Prediction of Chronic Atrophic Gastritis and Gastric Neoplasms by Serum Pepsinogen Assay: A Systematic Review and Meta-Analysis of Diagnostic Test Accuracy


Abstract
1. Introduction
2. Materials and Methods
2.1. Literature Searching Strategy
2.2. Selection Criteria
2.3. Methodological Quality
2.4. Data Extraction and Primary and Modifier-Based Analyses
2.5. Statistical Analysis
3. Results
3.1. Identification of Relevant Studies
3.2. Characteristics of the Included Studies
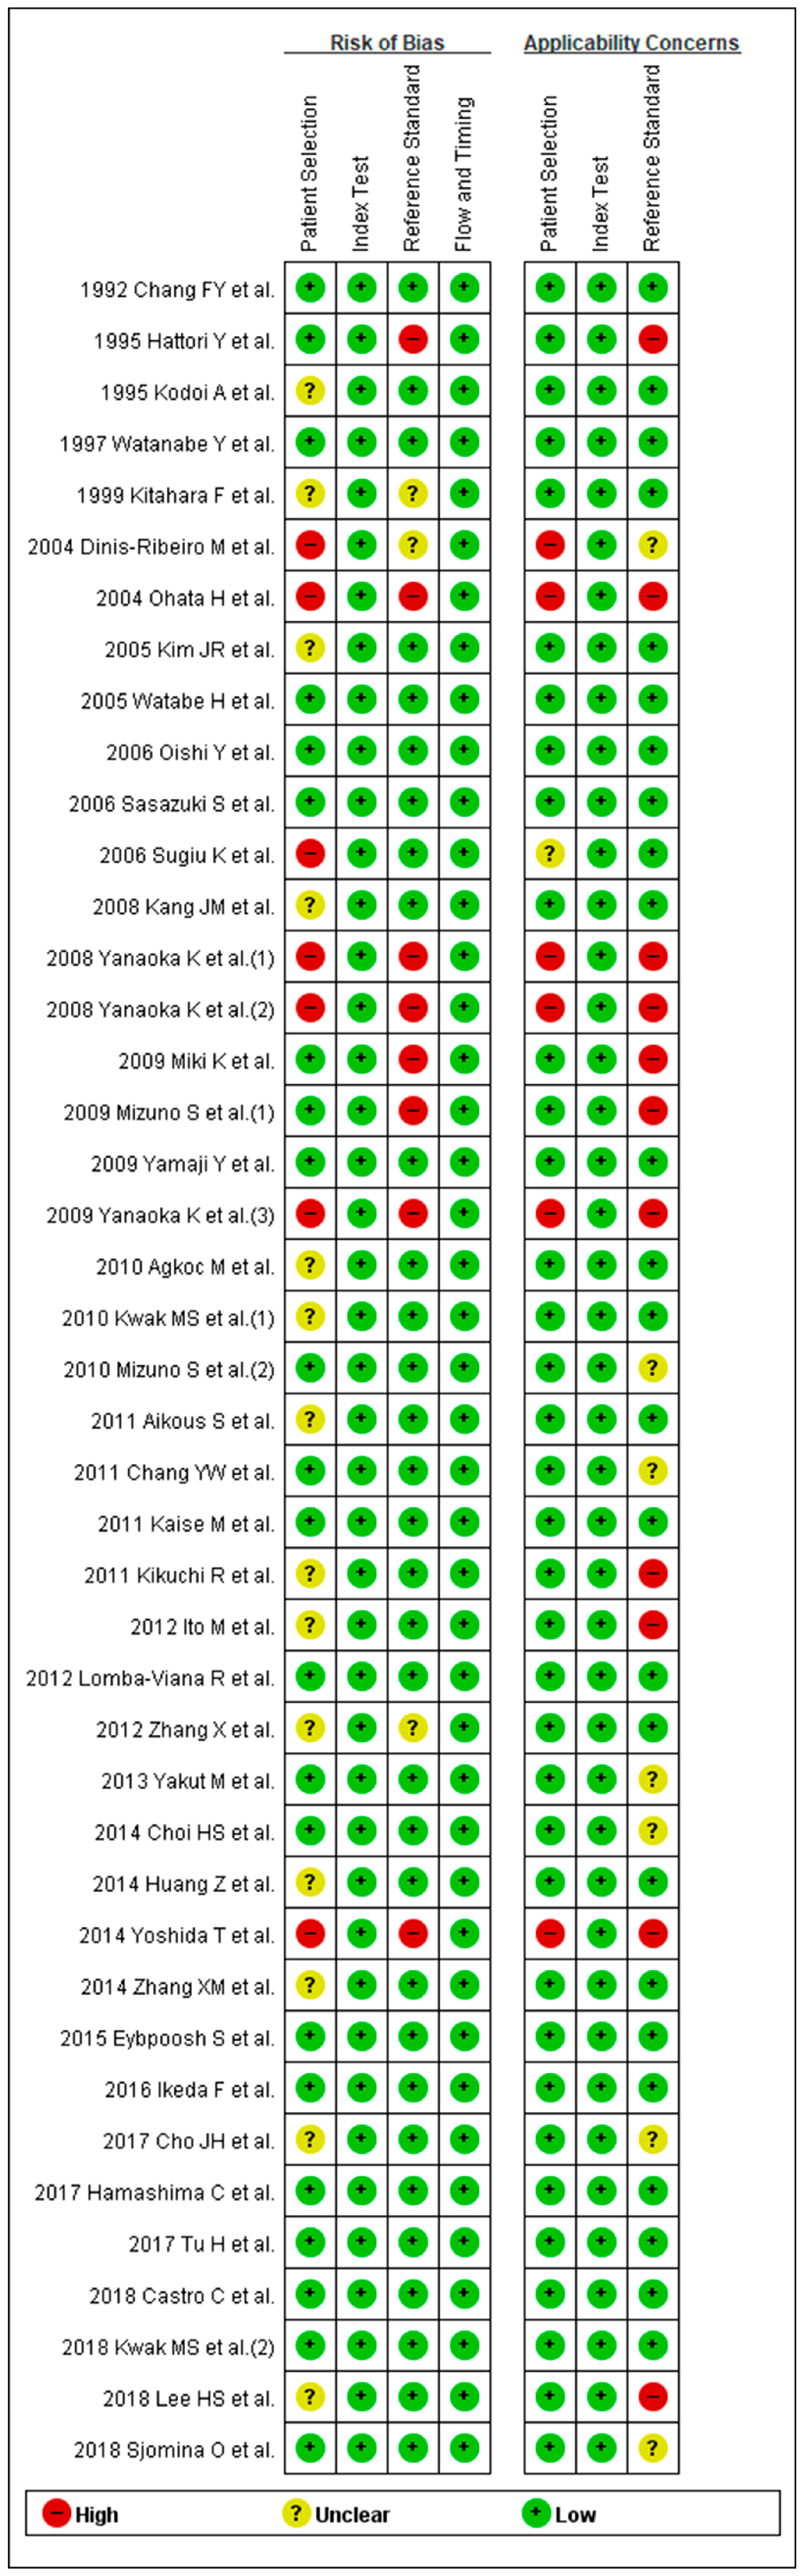
3.3. Methodological Quality of the Include Studies
3.4. DTA of sPGA in CAG
3.5. DTA of sPGA in GC
3.6. Exploring Heterogeneity with Meta-Regression and Subgroup Analysis of sPGA in CAG
3.7. Exploring Heterogeneity with Meta-Regression and Subgroup Analysis of sPGA in GC
3.8. Publication Bias
4. Discussion
Author Contributions
Funding
Conflicts of Interest
Access to Data
Abbreviations
References
- World Health Organization (WHO). Available online: http://www.who.int/mediacentre/factsheets/fs297/en (accessed on 1 October 2018).
- Correa, P. A human model of gastric carcinogenesis. Cancer Res. 1988, 48, 3554–3560. [Google Scholar]
- De Vries, A.C.; van Grieken, N.C.; Looman, C.W.; Casparie, M.K.; de Vries, E.; Meijer, G.A.; Kuipers, E.J. Gastric cancer risk in patients with premalignant gastric lesions: A nationwide cohort study in the Netherlands. Gastroenterology 2008, 134, 945–952. [Google Scholar] [CrossRef]
- Bang, C.S.; Lee, J.J.; Baik, G.H. Diagnostic performance of serum pepsinogen assay for the prediction of atrophic gastritis and gastric neoplasms: Protocol for a systematic review and meta-analysis. Medicine 2019, 98, e14240. [Google Scholar] [CrossRef] [PubMed]
- Jencks, D.S.; Adam, J.D.; Borum, M.L.; Koh, J.M.; Stephen, S.; Doman, D.B. Overviewof current concepts in gastric intestinal metaplasia and gastric cancer. Gastroenterol. Hepatol. 2018, 14, 92–101. [Google Scholar]
- Jun, J.K.; Choi, K.S.; Lee, H.Y.; Suh, M.; Park, B.; Song, S.H.; Jung, K.W.; Lee, C.W.; Choi, C.W.; Choi, I.J.; et al. Effectiveness of the Korean National CancerScreening program in reducing gastric cancer mortality. Gastroenterology 2017, 152, 1319–1328.e7. [Google Scholar] [CrossRef] [PubMed]
- Park, Y.H.; Kim, N. Review of atrophic gastritis and intestinal metaplasia as a premalignant lesion of gastric cancer. J. Cancer Prev. 2015, 20, 25–40. [Google Scholar] [CrossRef] [PubMed]
- Dinis-Ribeiro, M.; Yamaki, G.; Miki, K.; Costa-Pereira, A.; Matsukawa, M.; Kurihara, M. Meta-analysis on the validity of pepsinogen test for gastric carcinoma, dysplasia or chronic atrophic gastritis screening. J. Med. Screen. 2004, 11, 141–147. [Google Scholar] [CrossRef] [PubMed]
- Huang, Y.K.; Yu, J.C.; Kang, W.M.; Ma, Z.Q.; Ye, X.; Tian, S.B.; Yan, C. Significance of Serum Pepsinogens as a Biomarker for Gastric Cancer and Atrophic Gastritis Screening: A Systematic Review and Meta-Analysis. PLoS ONE 2015, 10, e0142080. [Google Scholar] [CrossRef]
- Liu, L.; Lang, J.; Jin, Y.; Chen, Y.; Chang, W.; Yao, Y.; Yu, J. The Value of Pepsinogen in GC Screening: A Systematic Review and Meta-Analysis. Gastroenterol. Res. Pract. 2019, 2019, 7087232. [Google Scholar] [CrossRef]
- Terasawa, T.; Nishida, H.; Kato, K.; Miyashiro, I.; Yoshikawa, T.; Takaku, R.; Hamashima, C. Prediction of gastric cancer development by serum pepsinogen test and Helicobacter pylori seropositivity in Eastern Asians: A systematic review and meta-analysis. PLoS ONE 2014, 9, e109783. [Google Scholar] [CrossRef] [PubMed]
- Zagari, R.M.; Rabitti, S.; Greenwood, D.C.; Eusebi, L.H.; Vestito, A.; Bazzoli, F. Systematic review with meta-analysis: Diagnostic performance of the combination of pepsinogen, gastrin-17 and anti-Helicobacter pylori antibodies serum assays for the diagnosis of atrophic gastritis. Aliment. Pharmacol. Ther. 2017, 46, 657–667. [Google Scholar] [CrossRef] [PubMed]
- Syrjanen, K. A Panel of Serum Biomarkers (GastroPanel(R)) in Non-invasive Diagnosis of Atrophic Gastritis. Systematic Review and Meta-analysis. Anticancer Res. 2016, 36, 5133–5144. [Google Scholar] [CrossRef] [PubMed]
- Miki, K. Gastric cancer screening using the serum pepsinogen test method. Gastric. Cancer 2006, 9, 245–253. [Google Scholar] [CrossRef] [PubMed]
- Shamseer, L.; Moher, D.; Clarke, M.; Ghersi, D.; Liberati, A.; Petticrew, P.; Stewart, L.A. Preferred reporting items for systematic review and meta-analysis protocols (PRISMA-P) 2015: Elaboration and explanation. BMJ 2015, 350, g7647. [Google Scholar] [CrossRef] [PubMed]
- Whiting, P.F.; Rutjes, A.W.; Westwood, M.E.; Mallett, S.; Deeks, J.J.; Reitsma, J.B.; Leeflang, M.M.; Sterne, J.A. QUADAS-2: A revised tool for the quality assessment of diagnostic accuracy studies. Ann. Intern. Med. 2011, 155, 529–536. [Google Scholar] [CrossRef] [PubMed]
- Reitsma, J.B.; Glas, A.S.; Rutjes, A.W.; Scholten, R.J.; Bossuyt, P.M.; Zwinderman, A.H. Bivariate analysis of sensitivity and specificity produces informative summary measures in diagnostic reviews. J. Clin. Epidemiol. 2005, 58, 982–990. [Google Scholar] [CrossRef]
- Rutter, C.M.; Gatsonis, C.A. A hierarchical regression approach to meta-analysis of diagnostic test accuracy evaluations. Stat. Med. 2001, 20, 2865–2884. [Google Scholar] [CrossRef]
- Harbord, R.M.; Whiting, P. Metandi: Meta-analysis of diagnostic accuracy using hierarchical logistic regression. Stata J. 2009, 9, 211–229. [Google Scholar] [CrossRef]
- Inoue, M.; Kobayashi, S.; Matsuura, A.; Hamajima, N.; Tajima, K.; Tominaga, S. Agreement of endoscopic findings and serum pepsinogen levels as an indicator of atrophic gastritis. Cancer Epidemiol. Biomark. Prev. 1998, 7, 261–263. [Google Scholar]
- Dinis-Ribeiro, M.; Da Costa-Pereira, A.; Lopes, C.; Barbosa, J.; Guilherme, M.; Moreira-Dias, L.; Lomba-Viana, H.; Silva, R.; Abreu, N.; Lomba-Viana, R. Validity of serum pepsinogen I/II ratio for the diagnosis of gastric epithelial dysplasia and intestinal metaplasia during the follow-up of patients at risk for intestinal-type gastric adenocarcinoma. Neoplasia 2004, 6, 449–456. [Google Scholar] [CrossRef]
- Nardone, G.; Rocco, A.; Staibano, S.; Mezza, E.; Autiero, G.; Compare, D.; De Rosa, G.; Budillon, G. Diagnostic accuracy of the serum profile of gastric mucosa in relation to histological and morphometric diagnosis of atrophy. Aliment. Pharmacol. Ther. 2005, 22, 1139–1146. [Google Scholar] [CrossRef]
- Con, S.A.; Con-Wong, R.; Con-Chin, G.R.; Con-Chin, V.G.; Takeuchi, H.; Valerín, A.L.; Echandi, G.; Mena, F.; Brenes, F.; Yasuda, N.; et al. Serum pepsinogen levels, Helicobacter pylori CagA status, and cytokine gene polymorphisms associated with gastric premalignant lesions in Costa Rica. Cancer Epidemiol. Biomark. Prev. 2007, 16, 2631–2636. [Google Scholar] [CrossRef]
- Iijima, K.; Abe, Y.; Kikuchi, R.; Koike, T.; Ohara, S.; Sipponen, P.; Shimosegawa, T. Serum biomarker tests are useful in delineating between patients with gastric atrophy and normal, healthy stomach. World J. Gastroenterol. 2009, 15, 853–859. [Google Scholar] [CrossRef]
- Leja, M.; Kupcinskas, L.; Funka, K.; Sudraba, A.; Jonaitis, L.; Ivanauskas, A.; Janciauskas, D.; Kiudelis, G.; Chiu, H.M.; Lin, J.T. The Validity of a Biomarker Method for Indirect Detection of Gastric Mucosal Atrophy Versus Standard Histopathology. Dig. Dis. Sci. 2009, 54, 2377–2384. [Google Scholar] [CrossRef]
- Agkoc, M.; Dursun, H.; Albayrak, F.; Yilmaz, O.; Kiziltunc, A.; Yilmaz, A.; Gundogdu, C. Usefulness of serum pepsinogen levels as a screening test for atrophic gastritis and gastric cancer. Eurasian. J. Med. 2010, 42, 15–18. [Google Scholar] [CrossRef]
- Yakut, M.; Ormeci, N.; Erdal, H.; Keskin, O.; Karayel, Z.; Tutkak, H.; Soykan, I. The association between precancerous gastric lesions and serum pepsinogens,serum gastrin, vascular endothelial growth factor, serum interleukin-1 Beta, serum toll-like receptor-4 levels and Helicobacter pylori Cag A status. Clin. Res. Hepatol. Gastroenterol. 2013, 37, 302–311. [Google Scholar] [CrossRef]
- Lee, J.Y.; Kim, N.; Lee, H.S.; Oh, J.C.; Kwon, Y.H.; Choi, Y.J.; Yoon, K.C.; Hwang, J.J.; Lee, H.J.; Lee, A.; et al. Correlations among endoscopic, histologic and serologic diagnoses for the assessment of atrophic gastritis. J. Cancer Prev. 2014, 19, 47–55. [Google Scholar] [CrossRef]
- Kim, E.H.; Kang, H.; Park, C.H.; Choi, H.S.; Jung, D.H.; Chung, H.; Park, J.C.; Shin, S.K.; Lee, S.K.; Lee, Y.C. The optimal serum pepsinogen cut-off value for predicting histologically confirmed atrophic gastritis. Dig. Liver Dis. 2015, 47, 663–668. [Google Scholar] [CrossRef]
- Myint, T.; Shiota, S.; Vilaichone, R.K.; Ni, N.; Aye, T.T.; Matsuda, M.; Tran, T.T.H.; Uchida, T.; Mahachai, V.; Yamaoka, Y. Prevalence of Helicobacter pylori infection and atrophic gastritis in patients with dyspeptic symptoms in Myanmar. World J. Gastroenterol. 2015, 21, 629–636. [Google Scholar] [CrossRef]
- Kotachi, T.; Ito, M.; Yoshihara, M.; Boda, T.; Kiso, M.; Masuda, K.; Matsuo, T.; Tanaka, S.; Chayama, K. Serological Evaluation of Gastric Cancer Risk Based on Pepsinogen and Helicobacter pylori Antibody: Relationship to Endoscopic Findings. Digestion 2017, 95, 314–318. [Google Scholar] [CrossRef]
- Leja, M.; Camargo, M.C.; Polaka, I.; Isajevs, S.; Liepniece-Karele, I.; Janciauskas, D.; Rudzite, D.; Kikuste, I.; Vanags, A.; Kojalo, I.; et al. Detection of gastric atrophy by circulating pepsinogens: A comparison of three assays. Helicobacter 2017, 22. [Google Scholar] [CrossRef]
- Loong, T.H.; Soon, N.C.; Nik Mahmud, N.R.K.; Naidu, J.; Abdul Rani, R.; Abdul Hamid, N.; Hikmah Elias, M.; Rose, I.M.; Tamil, A.; Mokhtar, N.M.; et al. Serum pepsinogen and gastrin-17 as potential biomarkers for pre-malignant lesions in the gastric corpus. Biomed. Rep. 2017, 7, 460–468. [Google Scholar] [CrossRef][Green Version]
- Chang, F.Y.; Lai, K.H.; Wang, T.F.; Lee, S.D.; Tsai, Y.T.; Tsay, S.H. Location and type of gastric carcinoma in relation to pepsinogen I level in blood. Scand. J. Gastroenterol. 1992, 27, 884–888. [Google Scholar] [CrossRef]
- Hattori, Y.; Tashiro, H.; Kawamoto, T.; Kodama, Y. Sensitivity and specificity of mass screening for gastric cancer using the measurment of serum pepsinogens. Jpn. J. Cancer Res. 1995, 86, 1210–1215. [Google Scholar] [CrossRef]
- Kodoi, A.; Yoshihara, M.; Sumii, K.; Haruma, K.; Kajiyama, G. Serum pepsinogen in screening for gastric cancer. J. Gastroenterol. 1995, 30, 452–460. [Google Scholar] [CrossRef]
- Watanabe, Y.; Kurata, J.H.; Mizuno, S.; Mukai, M.; Inokuchi, H.; Miki, K.; Ozasa, K.; Kawai, K. Helicobacter pylori infection and gastric cancer: A nested case-control study in a rural area of Japan. Dig. Dis. Sci. 1997, 42, 1383–1387. [Google Scholar] [CrossRef]
- Kitahara, F.; Kobayashi, K.; Sato, T.; Kojima, Y.; Araki, T.; Fujino, M.A. Accuracy of screening for gastric cancer using serum pepsinogen concentrations. Gut 1999, 44, 693–697. [Google Scholar] [CrossRef]
- Ohata, H.; Kitauchi, S.; Yoshimura, N.; Mugitani, K.; Iwane, M.; Nakamura, H.; Yoshikawa, A.; Yanaoka, K.; Arii, K.; Tamai, H.; et al. Progression of chronic atrophic gastritis associated with Helicobacter pylori infection increases risk of gastric cancer. Int. J. Cancer 2004, 109, 138–143. [Google Scholar] [CrossRef]
- Kim, J.R.; Lee, K.; Jung, W.T.; Lee, O.J.; Kim, T.H.; Kim, H.J.; Lee, J.S.; Passaro, D.J. Validity of serum pepsinogen levels and quininium resin test combined for gastric cancer screening. Cancer. Detect. Prev. 2005, 29, 570–575. [Google Scholar] [CrossRef]
- Watabe, H.; Mitsushima, T.; Yamaji, Y.; Okamoto, M.; Wada, R.; Kokubo, T.; Doi, H.; Yoshida, H.; Kawabe, T.; Omata, M. Predicting the development of gastric cancer from combining Helicobacter pylori antibodies and serum pepsinogen status: A prospective endoscopic cohort study. Gut 2005, 54, 764–768. [Google Scholar] [CrossRef]
- Oishi, Y.; Kiyohara, Y.; Kubo, M.; Tanaka, K.; Tanizaki, Y.; Ninomiya, T.; Doi, Y.; Shikata, K.; Yonemoto, K.; Shirota, T.; et al. The serum pepsinogen test as a predictor of gastric cancer: The Hisayama study. Am. J. Epidemiol. 2006, 163, 629–637. [Google Scholar] [CrossRef]
- Sasazuki, S.; Inoue, M.; Iwasaki, M.; Otani, T.; Yamamoto, S.; Ikeda, S.; Hanaoka, T.; Tsugane, S. Effect of Helicobacter pylori infection combined with CagA and pepsinogen status on gastric cancer development among Japanese men and women: A nested case-control study. Cancer Epidemiol. Biomark. Prev. 2006, 15, 1341–1347. [Google Scholar] [CrossRef]
- Sugiu, K.; Kamada, T.; Ito, M.; Kaya, S.; Tanaka, A.; Kusunoki, H.; Hata, J.; Haruma, K. Anti-parietal cell antibody and serum pepsinogen assessment in screening for gastric carcinoma. Dig. Liver Dis. 2006, 38, 303–307. [Google Scholar] [CrossRef]
- Kang, J.M.; Kim, N.; Yoo, J.Y.; Park, Y.S.; Lee, D.H.; Kim, H.Y.; Lee, H.S.; Choe, G.; Kim, J.S.; Jung, H.C.; et al. The role of serum pepsinogen and gastrin test for the detection of gastric cancer in Korea. Helicobacter 2008, 13, 146–156. [Google Scholar] [CrossRef]
- Yanaoka, K.; Oka, M.; Mukoubayashi, C.; Yoshimura, N.; Enomoto, S.; Iguchi, M.; Magari, H.; Utsunomiya, H.; Tamai, H.; Arii, K.; et al. Cancer high-risk subjects identified by serum pepsinogen tests: Outcomes after 10-year follow-up in asymptomatic middle-aged males. Cancer Epidemiol. Biomark. Prev. 2008, 17, 838–845. [Google Scholar] [CrossRef]
- Yanaoka, K.; Oka, M.; Yoshimura, N.; Mukoubayashi, C.; Enomoto, S.; Iguchi, M.; Magari, H.; Utsunomiya, H.; Tamai, H.; Arii, K.; et al. Risk of gastric cancer in asymptomatic, middle-aged Japanese subjects based on serum pepsinogen and Helicobacter pylori antibody levels. Int. J. Cancer 2008, 123, 917–926. [Google Scholar] [CrossRef]
- Miki, K.; Fujishiro, M.; Kodashima, S.; Yahagi, N. Long-term results of gastric cancer screening using the serum pepsinogen test method among an asymptomatic middle-aged Japanese population: Original article. Dig. Endosc. 2009, 21, 78–81. [Google Scholar] [CrossRef]
- Mizuno, S.; Kobayashi, M.; Tomita, S.; Miki, I.; Masuda, A.; Onoyama, M.; Habu, Y.; Inokuchi, H.; Watanabe, Y. Validation of the pepsinogen test method for gastric cancer screening using a follow-up study. Gastric. Cancer 2009, 12, 158–163. [Google Scholar] [CrossRef]
- Yamaji, Y.; Watabe, H.; Yoshida, H.; Kawabe, T.; Wada, R.; Mitsushima, T.; Omata, M. High-risk population for gastric cancer development based on serum pepsinogen status and lifestyle factors. Helicobacter 2009, 14, 81–86. [Google Scholar] [CrossRef]
- Yanaoka, K.; Oka, M.; Ohata, H.; Yoshimura, N.; Deguchi, H.; Mukoubayashi, C.; Enomoto, S.; Inoue, I.; Iguchi, M.; Maekita, T.; et al. Eradication of Helicobacter pylori prevents cancer development in subjects with mild gastric atrophy identified by serum pepsinogen levels. Int. J. Cancer 2009, 125, 2697–2703. [Google Scholar] [CrossRef]
- Kwak, M.S.; Kim, N.; Lee, H.S.; Lee, H.E.; Jung, H.C.; Song, I.S. Predictive power of serum pepsinogen tests for the development of gastric cancer in comparison to the histologic risk index. Dig. Dis. Sci. 2010, 55, 2275–2282. [Google Scholar] [CrossRef] [PubMed]
- Mizuno, S.; Miki, I.; Ishida, T.; Yoshida, M.; Onoyama, M.; Azuma, T.; Habu, Y.; Inokuchi, H.; Ozasa, K.; Miki, K.; et al. Prescreening of a high-risk group for gastric cancer by serologically determined Helicobacter pylori infection and atrophic gastritis. Dig. Dis. Sci. 2010, 55, 3132–3137. [Google Scholar] [CrossRef] [PubMed]
- Aikou, S.; Ohmoto, Y.; Gunji, T.; Matsuhashi, N.; Ohtsu, H.; Miura, H.; Kubota, K.; Yamagata, Y.; Seto, Y.; Nakajima, A.; et al. Tests for serum levels of trefoil factor family proteins can improve gastric cancer screening. Gastroenterology 2011, 141, 837–845.e7. [Google Scholar] [CrossRef] [PubMed]
- Chang, Y.W.; Hwangbo, Y.; Lee, J.W.; Jo, S.J.; Cho, J.H.; Shim, J.; Jang, J.Y.; Kim, H.J.; Kim, B.H. Clinical parameters including serum pepsinogen level and management strategy in patients with premalignant gastric dysplasia. Eur. J. Gastroenterol. Hepatol. 2011, 23, 405–410. [Google Scholar] [CrossRef] [PubMed]
- Kaise, M.; Miwa, J.; Tashiro, J.; Ohmoto, Y.; Morimoto, S.; Kato, M.; Urashima, M.; Ikegami, M.; Tajiri, H. The combination of serum trefoil factor 3 and pepsinogen testing is a valid non-endoscopic biomarker for predicting the presence of gastric cancer: A new marker for gastric cancer risk. J. Gastroenterol. 2011, 46, 736–745. [Google Scholar] [CrossRef] [PubMed]
- Kikuchi, R.; Abe, Y.; Iijima, K.; Koike, T.; Ara, N.; Uno, K.; Asanuma, K.; Asano, N.; Imatani, A.; Shimosegawa, T. Low serum levels of pepsinogen and gastrin 17 are predictive of extensive gastric atrophy with high-risk of early gastric cancer. Tohoku. J. Exp. Med. 2011, 223, 35–44. [Google Scholar] [CrossRef] [PubMed][Green Version]
- Ito, M.; Yoshihara, M.; Takata, S.; Wada, Y.; Matsuo, T.; Boda, T.; Tanaka, S.; Chayama, K. Serum screening for detection of high-risk group for early-stage diffuse type gastric cancer in Japanese. J. Gastroenterol. Hepatol. 2012, 27, 598–602. [Google Scholar] [CrossRef]
- Lomba-Viana, R.; Dinis-Ribeiro, M.; Fonseca, F.; Vieira, A.S.; Bento, M.J.B.; Lomba-Viana, H. Serum pepsinogen test for early detection of gastric cancer in a European Country. Eur. J. Gastroenterol. Hepatol. 2012, 24, 37–41. [Google Scholar] [CrossRef]
- Zhang, X.; Xue, L.; Xing, L.; Wang, J.; Cui, J.; Mi, J.; Xing, X.; Wang, J.; Du, Z.; Misumi, J.; et al. Low serum pepsinogen i and pepsinogen I/II ratio and Helicobacter pylori infection are associated with increased risk of gastric cancer: 14-year follow up result in a rural Chinese community. Int. J. Cancer 2012, 130, 1614–1619. [Google Scholar] [CrossRef]
- Choi, H.S.; Lee, S.Y.; Kim, J.H.; Sung, I.K.; Park, H.S.; Shim, C.S.; Jin, C.J. Combining the serum pepsinogen level and Helicobacter pylori antibody test for predicting the histology of gastric neoplasm. J. Dig. Dis. 2014, 15, 293–298. [Google Scholar] [CrossRef]
- Huang, Z.; Zhang, X.; Lu, H.; Wu, L.; Wang, D.; Zhang, Q.; Ding, H. Serum trefoil factor 3 is a promising non-invasive biomarker for gastric cancer screening: A monocentric cohort study in China. BMC Gastroenterol. 2014, 14, 74. [Google Scholar] [CrossRef]
- Yoshida, T.; Kato, J.; Inoue, I.; Yoshimura, N.; Deguchi, H.; Mukoubayashi, C.; Oka, M.; Watanabe, M.; Enomoto, S.; Niwa, T.; et al. Cancer development based on chronic active gastritis and resulting gastric atrophy as assessed by serum levels of pepsinogen and Helicobacter pylori antibody titer. Int. J. Cancer 2014, 134, 1445–1457. [Google Scholar] [CrossRef]
- Zhang, X.M.; Li, J.X.; Zhang, G.Y.; Li, X.H.; Gu, H. The value of serum pepsinogen levels for the diagnosis of gastric diseases in Chinese Han people in midsouth China. BMC Gastroenterol. 2014, 14, 3. [Google Scholar] [CrossRef]
- Eybpoosh, S.; Talebkhan, Y.; Saberi, S.; Esmaeili, M.; Oghalaie, A.; Ebrahimzadeh, F.; Karimi, T.; Abdirad, A.; Nahvijou, A.; Mohagheghi, M.A.; et al. Age-specific gastric cancer risk indicated by the combination of Helicobacter pylori sero-status and serum pepsinogen levels. Iran. Biomed. J. 2015, 19, 133–142. [Google Scholar]
- Ikeda, F.; Shikata, K.; Hata, J.; Fukuhara, M.; Hirakawa, Y.; Ohara, T.; Mukai, N.; Nagata, M.; Yoshida, D.; Yonemoto, K.; et al. Combination of Helicobacter pylori Antibody and Serum Pepsinogen as a Good Predictive Tool of Gastric Cancer Incidence: 20-Year Prospective Data From the Hisayama Study. J. Epidemiol. 2016, 26, 629–636. [Google Scholar] [CrossRef]
- Cho, J.H.; Jeon, S.R.; Kim, H.G.; Jin, S.Y.; Park, S. The serum pepsinogen levels for risk assessment of gastric neoplasms: New proposal from a case-control study in Korea. Medicine 2017, 96, e7603. [Google Scholar] [CrossRef]
- Hamashima, C.; Sasazuki, S.; Inoue, M.; Tsugane, S. Receiver operating characteristic analysis of prediction for gastric cancer development using serum pepsinogen and Helicobacter pylori antibody tests. BMC Cancer 2017, 17, 183. [Google Scholar] [CrossRef]
- Tu, H.; Sun, L.; Dong, X.; Gong, Y.; Xu, Q.; Jing, J.; Bostick, R.M.; Wu, X.; Yuan, Y. A Serological Biopsy Using Five Stomach-Specific Circulating Biomarkers for Gastric Cancer Risk Assessment: A Multi-Phase Study. Am. J. Gastroenterol. 2017, 112, 704–715. [Google Scholar] [CrossRef]
- Castro, C.; Dinis-Ribeiro, M.; Rodrigues, A.N.G.; Calheiros, T.; Santos, J.; Pereira, P.; Ramos, M.; Cunha, H.; Andrade, M.; Costa, A.; et al. Western long-term accuracy of serum pepsinogen-based gastric cancer screening. Eur. J. Gastroenterol. Hepatol. 2018, 30, 274–277. [Google Scholar] [CrossRef]
- Kwak, M.S.; Chung, G.E.; Chung, S.J.; Kang, S.J.; Yang, J.I.; Kim, J.S. Predicting the development of gastric neoplasms in a healthcare cohort by combining Helicobacter pylori antibodies and serum pepsinogen: A 5-year longitudinal study. Gastroenterol. Res. Pract. 2018, 2018, 8796165. [Google Scholar] [CrossRef]
- Lee, H.S.; Jeon, S.W.; Nomura, S.; Seto, Y.; Kwon, Y.H.; Nam, S.Y.; Ishibashi, Y.; Ohtsu, H.; Ohmoto, Y.; Yang, H.M. Screening biomarker as an alternative to endoscopy for the detection of early gastric cancer: The combination of serum trefoil factor family 3 and pepsinogen. Gastroenterol. Res. Pract. 2018, 2018, 1024074. [Google Scholar] [CrossRef]
- Sjomina, O.; Pavlova, J.; Daugule, I.; Janovic, P.; Kikuste, I.; Vanags, A.; Tolmanis, I.; Rudzite, D.; Polaka, I.; Kojalo, I.; et al. Pepsinogen test for the evaluation of precancerous changes in gastric mucosa: A population-based study. J. Gastrointestin. Liver Dis. 2018, 27, 11–17. [Google Scholar]
- Cha, J.H.; Jang, J.S. Clinical correlation between serum pepsinogen level and gastric atrophy in gastric neoplasm. Korean. J. Intern. Med. 2018. [Google Scholar] [CrossRef]
- Lee, S.Y. Endoscopic gastritis, serum pepsinogen assay, and Helicobacter pylori infection. Korean J. Intern. Med. 2016, 31, 835–844. [Google Scholar] [CrossRef]
- Yeh, J.M.; Hur, C.; Ward, Z.; Schrag, D.; Goldie, S.J. Gastric adenocarcinoma screening and prevention in the era of new biomarker and endoscopic technologies: A cost-effectiveness analysis. Gut 2016, 65, 563–574. [Google Scholar] [CrossRef]
- Mukoubayashi, C.; Yanaoka, K.; Ohata, H.; Arii, K.; Tamai, H.; Oka, M.; Ichinose, M. Serum pepsinogen and gastric cancer screening. Intern. Med. 2007, 46, 261–266. [Google Scholar] [CrossRef]
- De Re, V.; Orzes, E.; Canzonieri, V.; Maiero, S.; Fornasarig, M.; Alessandrini, L.; Cervo, S.; Steffan, A.; Zanette, G.; Mazzon, C.; et al. Pepsinogens to distinguish patients with gastric intestinal metaplasia and Helicobacter pylori infection among populations at risk for gastric cancer. Clin. Transl. Gastroenterol. 2016, 7, e183. [Google Scholar] [CrossRef]
- Kim, N.; Jung, H.C. The role of serum pepsinogen in the detection of gastric cancer. Gut Liver 2010, 4, 307–319. [Google Scholar] [CrossRef]


| Parameters | Current Study | Dinis-Ribeiro et al. (2004) [8] | Miki et al. (2006) [14] | Terasawa et al. (2014) [11] | Huang et al. (2015) [9] | Syrjänen et al. (2016) [13] | Zagari et al. (2017) [12] | Liu et al. (2019) [10] |
|---|---|---|---|---|---|---|---|---|
| Number of included studies | 9 studies for the diagnosis of CAG and 17 studies for the diagnosis of GC | 25 studies or book chapters for the diagnosis of GC | 42 studies for the diagnosis of GC | 12 studies for the diagnosis of GC | 16 studies for the diagnosis of CAG and 15 studies for the diagnosis of GC | 27 studies for the diagnosis of CAG | 20 studies for the diagnosis of CAG | 19 studies for the diagnosis of GC |
| Main outcome | Diagnostic validity of sPGA | Diagnostic validity of sPGA | Diagnostic validity of sPGA | Diagnostic validity of sPGA with Helicobacter pylori seropositivity | Diagnostic validity of sPGA | Diagnostic validity of GastroPanel (pepsinogen, gastrin-17, anti H. pylori antibodies) | Diagnostic validity of GastroPanel | |
| Searching strategy | PubMed, Embase, and the Cochrane Library (only studies in English) | PubMed and data reports from Japan (there was no information about searching keywords, the date of searching, the number of authors who performed searching, or how they managed disagreement or discrepancy of searching between authors) | PubMed and data reports from Japan (there was no information about searching keywords, the date of searching, the number of authors who performed searching, or how they managed disagreement or discrepancy of searching between authors) | PubMed, Web of Science, the Cochrane Library, and Japanese Medical Research Database (only studies in English or Japanese). The search was updated through citation-tracking | PubMed, Embase, and the CNKI (only studies in English or Chinese). Several articles were omitted. | MEDLINE (no language limitation) | PubMed, Embase, Scopus, and the Cochrane Library | PubMed, Embase, the Cochrane Library, CNKI, WanFang, VIP, and CBM databases (only studies in English or Chinese). Several articles were omitted. |
| Cut-off value | PG I ≤70 ng/mL and/or PG I/II ≤3 | PG I ≤70 ng/mL and PG I/II ratio ≤3, PG I ≤50 ng/mL and PG I/II ratio ≤3, PG I ≤30 ng/mL and PG I/II ratio ≤2 | PG I ≤70 ng/mL and PG I/II ratio ≤3 | PG I ≤70 ng/mL and PG I/II ratio ≤3 | Diagnostic values with various cut-off standards were pooled in a single outcome | Diagnostic values with various cut-off standards were pooled in a single outcome | ||
| Inaccurate calculation (coding) of TP/FP/FN/TN | Unknown (crude value of TP/FP/FN/TN in each study is not described) | Unknown (crude value of TP/FP/FN/TN in each study is not described). Many studies with different cut-off values were coded as those of PG I ≤70 ng/mL and PG I/II ratio ≤3 (intrinsic cutoff effect was assumed) | Not a meta-analysis with DTA. Hazard ratio was the effect size and conventional meta-analysis was done. | Detected in several studies | Unknown. Not a meta-analysis with diagnostic test accuracy (DTA). Sensitivity and specificity of each study was pooled using conventional meta-analysis method. | Detected in several studies | ||
| Determination of heterogeneity | Correlation coefficient between the logarithm of the sensitivity and specificity, beta of HSROC model, visual examination of the SROC curve | Chi-squared test (Cochrane Q statistic) with subgroup analysis according to the study population; (population-based study vs. GC screening in selected groups) | Chi-squared test (Cochrane Q statistic) (whether meta-regression was done or not is unknown) | I2 statistics | I2 statistics, correlation coefficient between sensitivity. Whether the correlation coefficient is between sensitivity and false positive rate or between sensitivity and specificity is not clearly defined. | I2 statistics | Visual examination of the forest plot and SROC curve | I2 statistics, Spearman correlation coefficient between the logarithm of the sensitivity and the logarithm of the (1—specificity), visual examination of the forest plot and SROC curve |
| Quality assessment | QUADAS-2 | None | None | QUIPS-2, PROBAST | QUADAS-2 | None | QUADAS-2 | QUADAS |
| Inaccurate coding for subgroup analysis | Study design was inaccurately coded in several studies. |
| <For CAG> |
| Database: MEDLINE (through PubMed) |
|
|
|
|
|
|
| Database: Embase |
|
|
|
|
|
|
| Database: Cochrane Library |
|
|
|
|
|
|
|
|
|
| <For gastric neoplasm> |
| Database: MEDLINE (through PubMed) |
|
|
|
|
| Database: Embase |
|
|
|
|
| Database: Cochrane Library |
|
|
|
|
|
|
|
| Study | Study Format/Nationality | Diagnosis | Number of Patients | Number of Control | Cut-off Value | Detection Method of sPGA | Age (Years, Mean ± SD) | Gender (M/F) | Smoking | H. pylori | TP | FP | FN | TN |
|---|---|---|---|---|---|---|---|---|---|---|---|---|---|---|
| Inoue et al. (1998) [20] | Case–control/Japan | CAG (endoscopic diagnosis without histology) | 117 | 83 | PG I ≤70 ng/mL and PG I/PG II ratio ≤3 | RIA | Mean 60.5 (range: 34–81) | 91/109 | 96 | 21 | 21 | 62 | ||
| Dinis-Ribeiro et al. (2004) [21] | Cross-sectional /Portugal | CAG with extensive IM (histopathologic evaluation of all three specimens collected demonstrated IM) | 61 | 74 | PG I/PG II ratio ≤3 | ELISA | Median 61 (range: 26–75) | Male: 36.8% | 40 | 16 | 21 | 58 | ||
| Nardone et al. (2005) [22] | Case–control/Italy | CAG (updated Sydney classification) | 30 | 64 | PG I/PG II ratio ≤3 | ELISA | Mean 56 (range: 38–75) | 36/58 | 44/94 (46.8%) | 9 | 0 | 21 | 64 | |
| Con et al. (2007) [23] | Case–control/Costa Rica | CAG (updated Sydney classification) | 58 | 165 | PG I ≤70 ng/mL and PG I/PG II ≤3 | ELISA | 51.17 ± 12.8 | 94/129 | 91.4% in patient with CAG, 68.5% in patient without CAG | 45 | 64 | 13 | 101 | |
| Iijima et al. (2009) [24] | Case–control/Japan | CAG | 20 | 142 | PG I ≤70 ng/mL and PG I/PG II ratio ≤3 | ELISA | Mean 55 (range: 22–79) | 95/67 | 15 | 44 | 5 | 98 | ||
| Leja et al. (2009) [25] | Case–control/Latvia, Lithuania, Taiwan | CAG (corpus, grade II-III in updated Sydney classification) | 24 | 217 | PG I/PG II ratio <3 | ELISA | Mean 66.3 (range: 55–84) | 68/173 | 165/241 (68.5%) | 20 | 28 | 4 | 189 | |
| Agkoc et al. (2010) [26] | Case–control/Turkey | CAG | 30 | 110 | PG I/PG II ratio <3 | RIA | CAG: 60.56 ± 11.29 (range: 36–76) | 78/62 | 26 | 7 | 4 | 103 | ||
| Yakut et al. (2013) [27] | Case–control/Turkey | CAG (updated Sydney classification) | 45 | 117 | PG I ≤70 ng/mL and PG I/PG II ratio ≤3 | ELISA | 55.07 ± 11.91 | 75/87 | 24 (14.8%) | 98/162 (60.5%) | 28 | 23 | 17 | 94 |
| PG I ≤70 ng/mL | 28 | 22 | 17 | 95 | ||||||||||
| PG I/PG II ratio ≤3 | 26 | 12 | 19 | 105 | ||||||||||
| Lee et al. (2014) [28] | Case–control/Korea | CAG (endoscopic diagnosis without histology) | 1216 | 1204 | PG I/PG II ratio ≤3 | L-TIA | Mean 57.6 | 1506/1052 | 1541 (60.2%) | 775 | 471 | 441 | 733 | |
| Kim et al. (2015) [29] | Cohort/Korea | CAG (updated Sydney classification) (antrum) | 22/95 | PG I ≤70 ng/mL and PG I/PG II ratio ≤3 | L-TIA | 57.7 ± 12.1 | 42/53 | 12/31 (38.7%) (in CAG) 17/64 (26.6%) (in no CAG) | 5 | 9 | 17 | 64 | ||
| CAG (corpus) | 19/95 | 8 | 6 | 11 | 70 | |||||||||
| Myint et al. (2015) [30] | Case–control /Myanmar | CAG (grade I-III in updated Sydney classification) | 143 | 109 | PG I ≤70 ng/mL and PG I/PG II ratio ≤3 | ELISA | 43.6 ± 14.2 (range: 13–85) | 97/155 | 121/252 | 11 | 1 | 132 | 108 | |
| PG I/PG II ratio ≤3 | 12 | 1 | 131 | 108 | ||||||||||
| Kotachi et al. (2017) [31] | Case–control/Japan | CAG (endoscopic diagnosis without histology) (corpus) | 370 | 170 | PG I ≤70 ng/mL and PG I/PG II ratio ≤3 | ELISA | Mean 61.2 | 375/165 | 217/540 | 163 | 0 | 207 | 170 | |
| Leja et al. (2017) [32] | Case–control/Latvia | CAG (grade II-III in updated Sydney classification) | 50 | 755 | PG I ≤70 ng/mL and PG I/PG II ratio ≤3 | L-TIA | Median 51 (range: 18–88) | 29% male | 38 | 235 | 12 | 520 | ||
| Loong et al. (2017) [33] | Cross-sectional /Malaysia | CAG or IM (updated Sydney classification) (corpus) | 37 | 35 | PG I ≤70 ng/mL | ELISA | 56.2 ± 16.2 | 33/39 | 3 | 6 | 3 | 60 | ||
| PG I/PG II ratio ≤3 | 1 | 2 | 5 | 64 |
| Study | Study Format/Nationality | Diagnosis | Number of Patients | Number of Control | Cut-off Value | Detection Method of sPGA | Age (Years, Mean ± SD) | Gender (M/F) | Smoking | H. pylori | TP | FP | FN | TN |
|---|---|---|---|---|---|---|---|---|---|---|---|---|---|---|
| Chang et al. (1992) [34] | Case–control/Taiwan | GC | 192 (175 AGC) | 70 | PG I ≤70 ng/mL | RIA | GC: 64.6 ± 8.3/control: 51.2 ± 11.2, range: 32–85 | 235/27 | 112/262 (42.7%) | 124 | 12 | 68 | 58 | |
| Hattori et al. (1995) [35] | Cohort/Japan (follow-up duration: 1 year) | GC (100% adenocarcinoma; 7 undifferentiated- and 11 differentiated-type histology) (sPGA positive subjects were screened by endoscopy) | 18/4876 | PG I ≤70 ng/mL and PG I/PG II ratio ≤3 | RIA | Range: 40–61 | 4761/115 | 15 | 1243 | 3 | 3615 | |||
| Kodoi et al. (1995) [36] | Case–control/Japan | GC | 269 (127 EGCs, 142 AGCs/167 differentiated-, 102 undifferentiated-type histology) | 1345 (sex, age matched) | PG I<70 ng/mL and PG I/PG II ratio <3 | RIA | GC: median 65 (range: 24–80) | 1080/534 | 162 | 543 | 107 | 802 | ||
| Watanabe et al. (1997) [37] | Nested case–control/Japan | GC | 45 | 225 (sex-, age-, and address-matched control) | PG I ≤70 ng/mL and PG I/PG II ratio ≤3 | RIA | 156/114 | 211/270 | 34 | 99 | 11 | 126 | ||
| Kitahara et al. (1999) [38] | Cross-sectional /Japan | GC | 13/5113 | PG I ≤70 ng/mL and PG I/PG II ratio ≤3 | RIA | Mean 52.5 | 2456/2657 | 11 | 1352 | 2 | 3748 | |||
| PG I/PG II ratio ≤3 | 11 | 1673 | 2 | 3427 | ||||||||||
| Dinis-Ribeiro et al. (2004) [21] | Cross-sectional /Portugal | LGD | 23/136 | PG I/PG II ratio ≤3 | ELISA | Median 61 (range: 26–75) | 50/86 | 16 | 39 | 7 | 74 | |||
| Ohata et al. (2004) [39] | Cohort/Japan (follow-up duration: mean 7.7 ± 0.9 year) | GC (Those with positive double-contrast barium X-ray and/or a positive PG test were further examined by endoscopy) | 45/4655 | PG I/PG II ratio <3 | RIA | 49.5 ± 4.6 | 100% male | 3657/4655 (78.6%) | 27 | 1585 | 18 | 3025 | ||
| Kim et al. (2005) [40] | Case–control/Korea | GC | 13 | 30 | PG I<70 ng/mL and PG I/PG II ratio <3 | RIA | Normal endoscopy group: mean 33.4, atrophic gastritis: 47.8, GC: 57 | 9 | 7 | 4 | 23 | |||
| Watabe et al. (2005) [41] | Cohort/Japan (follow-up duration: mean 4.7 ± 1.7 years) | GC | 43 (34 intestinal- and 9 diffuse-type histology)/6983 | PG I ≤70 ng/mL and PG I/PG II ratio ≤3 | RIA | 48.9 ± 8.5 | 4782/2201 | 3216/6983 (46.1%) in total, 29/43 (67.4%) in GC | 30 | 1495 | 13 | 5445 | ||
| Oishi et al. (2006) [42] | Cohort/Japan (follow-up duration: 14 years) | GC | 89/2446 | PG I ≤70 ng/mL and PG I/PG II ratio ≤3 | RIA | Mean 57 in male and 59 in female | 1016/1430 | 80.2% in male and 8.2% in female | 1745/2446 (71.3%) in total and 78/89 (87.6%) in GC | 53 | 661 | 36 | 1696 | |
| Sasazuki et al. (2006) [43] | Nested case-control/Japan | GC (299 differentiated- and 159 undifferentiated-type histology) | 511 | 511 (matched for gender, age, study area, blood donation date, fasting time at blood donation) | PG I ≤70 ng/mL and PG I/PG II ratio ≤3 | EIA | 57.4 ± 0.32 | Male: 66.8% | GC: 35.7%, control: 30.3% | 419 | 295 | 92 | 216 | |
| Sugiu et al. (2006) [44] | Case–control/Japan | GC | 27 | 65 | PG I/PG II ratio ≤3 | RIA | Mean 57.9 (range: 15–88) | 54/38 | 100% | 23 | 32 | 4 | 33 | |
| Kang et al. (2008) [45] | Case–control/Korea | GC | 380 | 626 | PG I ≤70 ng/m | L-TIA | 57.6 ± 13.2 | 585/421 | 788/1006 (78.3%) | 275 | 500 | 105 | 126 | |
| GC | 380 | 626 | PG I/PG II ratio ≤3 | 225 | 244 | 155 | 382 | |||||||
| Dysplasia | 107 | 899 | PG I ≤70 ng/m | 88 | 717 | 19 | 182 | |||||||
| Dysplasia | 107 | 899 | PG I/PG II ratio ≤3 | 66 | 351 | 41 | 548 | |||||||
| Yanaoka et al. (2008) [46] | Cohort/Japan (follow-up duration: mean 9.7 ± 0.9 years ) | GC (Those with positive double-contrast barium X-ray and/or a positive PG test were further examined by endoscopy) | 63/5209 | PG I ≤70 ng/mL and PG I/PG II ratio ≤3 | RIA | 49.2 ± 4.7 | 100% male | 37 | 1370 | 26 | 3776 | |||
| Yanaoka et al. (2008) [47] | Cohort/Japan (follow-up duration: mean 9.7 ± 0.9 years ) | GC (Those with positive double-contrast barium X-ray and/or a positive PG test were further examined by endoscopy) | 63/5209 | PG I/PG II ratio ≤3 | RIA | 49.2 ± 4.7 | 100% male | 3656/5209 | 43 | 1713 | 20 | 3433 | ||
| Miki et al. (2009) [48] | Cohort/Japan (follow-up duration: 15 year) | GC including intramucosal cancers (Those with a positive PG test and those with a negative PG test took endoscopy every 2 and 5 years, respectively) | 125 (28 EGCs, 72 intramucosal cancers, 25 AGCs)/13789 | PG I ≤70 ng/mL and PG I/PG II ratio ≤3 | RIA or L-TIA | Mean 48.7 | Initial enrollment: 101,892 (85,578/16,314) | 110 | 9026 | 15 | 4638 | |||
| Mizuno et al. (2009) [49] | Cohort/Japan (follow-up duration: 1 year) | GC (PG I level of ≤30 ng/mL and a PG I/PG II ratio of ≤2.0 or those with abnormal X-ray findings were advised to undergo endoscopy) | 19/12120 | PG I ≤70 ng/mL and PG I/PG II ratio ≤3 | CLIA | Male: median 50 (range: 15–84), Female: median 49 (range: 22–84) | 7590/4530 | 13 | 1743 | 6 | 10,358 | |||
| Yamaji et al. (2009) [50] | Cohort/Japan (follow-up duration: mean 4.79 years) | GC | 37/6158 | PG I ≤70 ng/mL and PG I/PG II ratio ≤3 | ELISA | Mean 49 | 4259/1899 | 2177/6158 (current or past smoker) | 2901/6158 | 27 | 1333 | 10 | 4788 | |
| Yanaoka et al. (2009) [51] | Cohort/Japan (follow-up duration: mean 9.3 ± 0.7 years) | GC (Those with positive double-contrast barium X-ray and/or a positive PG test were further examined by endoscopy) | 60 (40 intestinal- and 20 diffuse-type histology)/4129 (3,656 with persistent H. pylori infection and 473 with successful H. pylori eradication) | PG I ≤70 ng/mL and PG I/PG II ratio ≤3 | RIA | 49.8 ± 4.6 in H. pylori infection group, 49.6 ± 5.5 in eradication group | 100% male | 57.1% in H. pylori infection group, 55.4% in eradication group | 100% infected | 28 | 1050 | 32 | 3019 | |
| Agkoc et al. (2010) [26] | Case–control/Turkey | GC | 50 | 90 | PG I/PG II ratio <3 | RIA | GC: 65.42 ± 10.28 (range: 38–83) | 78/62 | 42 | 9 | 8 | 81 | ||
| Kwak et al. (2010) [52] | Cross-sectional/Korea | GC | 460 | 460 | PG I/PG II ratio ≤3 | L-TIA | Mean 57.9 | 528/392 | 765 (83.2%) | 244 | 136 | 216 | 324 | |
| Mizun et al. (2010) [53] | Cohort/Japan (follow-up duration: median 9.3 years) | GC | 61/2859 | PG I ≤70 ng/mL and PG I/PG II ratio ≤3 | RIA | 55–74 category is most prevalent | 1011/1848 | 2148/2859 | 44 | 1079 | 17 | 1719 | ||
| Aikou et al. (2011) [54] | Case–control/Japan | GC | 183 (107 AGCs, 76 EGCs; 86 differentiated- and 97 undifferentiated-type EGCs) | 269 | PG I<70 ng/mL and PG I/PG II ratio <3 | ELISA | GC: 66.0 ± 10.7/control: 50.1 ± 9.9 | 362/90 | GC: 62.3%, control: 34.9% | 82 | 34 | 101 | 235 | |
| Chang et al. (2011) [55] | Case–control/Korea | Gastric neoplasms | 297 (61 LGDs, 21 HGDs, 84 EGCs, 131 AGCs) | 293 | PG I/PG II ratio ≤3 | L-TIA | LGD: 60.2 ± 9.5, HGD: 63.1 ± 8.6, EGC: 59.8 ± 9.2, AGC: 61.6 ± 12.6, control: 50.7 ± 13.6 | 368/222 | Gastric neoplasms: 22.8–51.9%, control: 24.2% | Gastric neoplasms: 60.7–81%, control: 58% | 184 | 89 | 113 | 204 |
| Kaise et al. (2011) [56] | Case–control/Japan | GC | 192 | 1254 | PG I ≤70 ng/mL and PG I/PG II ratio ≤3 | CLIA | GC: 64.3 ± 9.7/control: 52.3 ± 12.4 | GC: 5:1, control: 1.2:1 | GC: 63%, control: 38.2% | GC: 83.9%, control: 30.1% | 129 | 229 | 63 | 1025 |
| Kikuchi et al. (2011) [57] | Case–control/Japan | EGC | 122 (114 well- to moderate-differentiated EGCs and 8 poorly-differentiated EGCs) | 178 | PG I ≤70 ng/mL and PG I/PG II ratio ≤3 | CLIA | GC: 68.2 ± 9.7/control: 56.2 ± 14.9 | 187/113 | GC: 100/122 (82%), control: 109/178 (61.2%) | 95 | 68 | 27 | 110 | |
| PG I ≤70 ng/mL | 114 | 148 | 8 | 30 | ||||||||||
| PG I/PG II ratio ≤3 | 100 | 83 | 22 | 95 | ||||||||||
| Ito et al. (2012) [58] | Case–control/Japan | Diffuse-type EGC | 42 | 511 | PG I ≤70 ng/mL and PG I/PG II ratio ≤3 | RIA | GC: mean 57.2 in male, 59.1 in female. Control: mean 58.5 | 305/248 | 387/553 | 20 | 191 | 22 | 320 | |
| Lomba-Viana et al. (2012) [59] | Cohort/Portugal (follow-up duration: 3–5 year) | GC | 6 (5 intestinal- and 1 diffuse-type histology/3 EGCs and 3 AGCs)/514 | PG I ≤70 ng/mL and PG I/PG II ratio ≤3 | ELISA | Median 60 (range: 40–79) | 76/438 | 165/514 (32.1%) | 6 | 268 | 3 | 237 | ||
| Zhang et al. (2012) [60] | Cohort/China (follow-up duration: 14 years) | GC | 26/1501 | PG I ≤70 ng/mL and PG I/PG II ratio ≤3 | RIA | 45.29 ± 12.18 | 554/947 | 995/1501 (66.3%) | 9 | 158 | 17 | 1317 | ||
| Yakut et al. (2013) [27] | Case–control/Turkey | Dysplasia | 37 | 125 | PG I ≤70 ng/mL and PG I/PG II ratio ≤3 | ELISA | 57.52 ± 11.16 | 75/87 | 24 (14.8%) | 98/162 (60.5%) | 13 | 38 | 24 | 87 |
| PG I ≤70 ng/mL | 13 | 37 | 24 | 88 | ||||||||||
| PG I/PG II ratio ≤3 | 8 | 30 | 29 | 95 | ||||||||||
| Choi et al. (2014) [61] | Case–control/Korea | Gastric neoplasms | 17 | 3311 | PG I ≤70 ng/mL and PG I/PG II ratio ≤3 | L-TIA | Mean 49.8–59.0 | 1979/1349 | 9 | 438 | 8 | 2873 | ||
| Huang et al. (2014) [62] | Nested case-control/China | GC | 72 | 37 | PG I ≤70 ng/mL and PG I/PG II ratio ≤3 | CLIA | GC: 61.7 ± 1.4, control: 56.7 ± 2.8 | GC: 1.23:1. Control: 1.31:1 | GC: 66.7%, control: 48% | 27 | 7 | 45 | 30 | |
| Yoshida et al. (2014) [63] | Cohort/Japan (follow-up duration: mean 11.6 ± 4.3 years) | GC (those with positive double-contrast barium X-ray and/or a positive PG test were further examined by endoscopy) | 87/4655 | PG I ≤70 ng/mL and PG I/PG II ratio ≤3 | RIA | 49.5 ± 4.6 | 100% male | 59.3% | 3657/4655 | 48 | 1314 | 39 | 3254 | |
| Zhang et al. (2014) [64] | Case–control/China | GC | 82 (69 AGCs, 13 EGCs) | 142 | PG I ≤70 ng/mL | ELISA | Patients with gastrointestinal diseases: 52.3 ± 12.3 (range 19–80), control: 52.4 ± 15.1 (range 29–77) | 163/85 | 85.4% in patients with GC, 74.4% in control | 56 | 25 | 26 | 117 | |
| PG I/PG II ratio ≤3 | 21 | 2 | 61 | 140 | ||||||||||
| Eybpoosh et al. (2015) [65] | Cross-sectional/Iran | GC | 578 (62 EGCs, 516 AGCs/315 intestinal-, 203 diffuse-, 69 mixed-type histology/274 undifferentiated-, 304 differentiated-type histology) | 763 | PG I ≤70 ng/mL and PG I/PG II ratio ≤3 | ELISA | 750/591 | 399/1341 | 100 | 44 | 478 | 719 | ||
| PG I ≤70 ng/mL | 133 | 234 | 445 | 529 | ||||||||||
| PG I/PG II ratio ≤3 | 32 | 34 | 546 | 729 | ||||||||||
| Ikeda et al. (2016) [66] | Cohort/Japan (follow-up: at least 20 years) | GC | 123/2446 | PG I ≤70 ng/mL and PG I/PG II ratio ≤3 | RIA | 58.3 ± 11.4 | 1016/1430 | 24.6% | 1761/2446 | 70 | 644 | 53 | 1679 | |
| Cho et al. (2017) [67] | Case–control/Korea | Gastric neoplasms | 87 (19 LGDs, 16 HGDs, 40 EGCs, 12 AGCs) | 311 | PG I/PG II ratio ≤3 | L-TIA | 48.2 ± 16.6 | 170/228 | 209/398 (52.5%) (46% with neoplasm vs. 75.9% without neoplasm) | 59 | 62 | 28 | 249 | |
| Hamashima et al. (2017) [68] | Nested case-control/Japan | GC | 497 | 497 (matched for sex, age, blood donation date, and fasting time at blood donation) | PG I/PG II ratio ≤3 | EIA | 57.5 ± 7.2 | Male: 66.4% | 432 | 299 | 65 | 198 | ||
| Tu et al. (2017) [69] | Cohort/China (follow-up duration: median 11.6 years) | GC | 86/12018 | PG I ≤70 ng/mL | ELISA | GC: 59.0 ± 10.6/GC-free: 49.6 ± 10.7 | 82.6% male in GC/45.1% male in GC-free | 39% in GC/36.4% in GC-free | 27 | 3642 | 59 | 8290 | ||
| PG I/PG II ratio <3 | 15 | 728 | 71 | 11204 | ||||||||||
| Castro et al. (2018) [70] | Cohort/Portugal (follow-up duration: median 6.5 years for sPGA (+)/7.5 years for sPGA (–) | GC (100% adenocarcinoma) | 26/5913 | PG I ≤70 ng/mL and PG I/PG II ratio ≤3 | ELISA | Range: 40–74 | 2257/3656 | 9 | 216 | 17 | 5671 | |||
| Kwak et al. (2018) [71] | Cohort/Korea (follow-up duration: mean 5.6 years) | GC | 15/3297 | PG I ≤70 ng/mL and PG I/PG II ratio ≤3 | L-TIA | 51.3 ± 9.4 | 2326/971 | 2020/3297 | 7 | 567 | 8 | 2715 | ||
| Gastric neoplasms | 29/3297 | 12 | 562 | 17 | 2706 | |||||||||
| Lee et al. (2018) [72] | Case–control/Korea | EGC | 30 | 30 | PG I<70 ng/mL and PG I/PG II ratio <3 | L-TIA | 59.5 ± 10.7 (patients with EGC) vs. 66.6 ± 12.0 (control) | 36/24 | 10 | 2 | 20 | 28 | ||
| Sjomina et al. (2018) [73] | Cross-sectional/Latvia | GC | 2 | 257 | PG I<70 ng/mL and PG I/PG II ratio <3 | L-TIA | 56.5 ± 12.5 | 82/177 | 177 (66%) | 1 | 160 | 1 | 97 | |
| Gastric dysplasia | 21 | 238 | 17 | 144 | 4 | 94 |
| Subgroup | Number of Included Studies | Sensitivity (95% CI) | Specificity (95% CI) | PLR | NLR | DOR | AUC |
|---|---|---|---|---|---|---|---|
| Cut-off value: PG I ≤70 ng/mL and PG I/PG II ratio ≤3 | 8 | 0.59 (0.38–0.78) | 0.89 (0.70–0.97) | 5.5 (2.3–13.0) | 0.46 (0.30–0.69) | 12 (6–25) | 0.81 (0.77–0.84) |
| Age (years, median or mean) | |||||||
| <60 | 6 | 0.54 (0.29–0.78) | 0.84 (0.64–0.94) | 3.5 (2.1–5.8) | 0.54 (0.35–0.84) | 6 (4–10) | 0.78 (0.74–0.81) |
| 60≤ | 2 | Null | Null | Null | Null | Null | Null |
| Methodological quality of included studies | |||||||
| High-quality | 5 | 0.68 (0.54–0.79) | 0.76 (0.64–0.85) | 2.79 (2.04–3.80) | 0.43 (0.32–0.57) | 7 (4–10) | 0.78 (0.74–0.82) |
| Low-quality | 3 | Null | Null | Null | Null | Null | Null |
| Cut-off value: PG I/PG II ratio ≤3 | 8 | 0.50 (0.28–0.72) | 0.94 (0.82–0.98) | 7.8 (3.3–18.1) | 0.53 (0.34–0.82) | 15 (6–37) | 0.85 (0.81–0.88) |
| Ethnicity | |||||||
| Western | 5 | 0.66 (0.45–0.81) | 0.92 (0.81–0.97) | 8.5 (3.7–19.4) | 0.37 (0.22–0.62) | 23 (9–57) | 0.88 (0.85–0.91) |
| Asian | 3 | Null | Null | Null | Null | Null | Null |
| Age (years, median or mean) | |||||||
| <60 | 5 | 0.31 (0.15–0.53) | 0.97 (0.80–0.99) | 8.9 (2.2–35.9) | 0.71 (0.57–0.89) | 12 (3–45) | 0.67 (0.62–0.71) |
| 60≤ | 3 | Null | Null | Null | Null | Null | Null |
| Methodological quality of included studies | |||||||
| High-quality | 4 | 0.66 (0.40–0.85) | 0.94 (0.84–0.98) | 10.7 (4.8–24.1) | 0.36 (0.18–0.71) | 30 (11–78) | 0.92 (0.90–0.94) |
| Low-quality | 4 | 0.32 (0.12–0.62) | 0.92 (0.63–0.99) | 4.1 (1.4–12.3) | 0.73 (0.56–0.97) | 6 (2–15) | 0.67 (0.63–0.71) |
| Total number of included patients | |||||||
| <1000 | 7 | 0.49 (0.24–0.74) | 0.95 (0.87–0.98) | 9.6 (4.8–19.4) | 0.54 (0.33–0.89) | 18 (8–41) | 0.90 (0.87–0.92) |
| 1000≤ | 1 | Null | Null | Null | Null | Null | Null |
| Subgroup | Number of Included Studies | Sensitivity (95% CI) | Specificity (95% CI) | PLR | NLR | DOR | AUC |
|---|---|---|---|---|---|---|---|
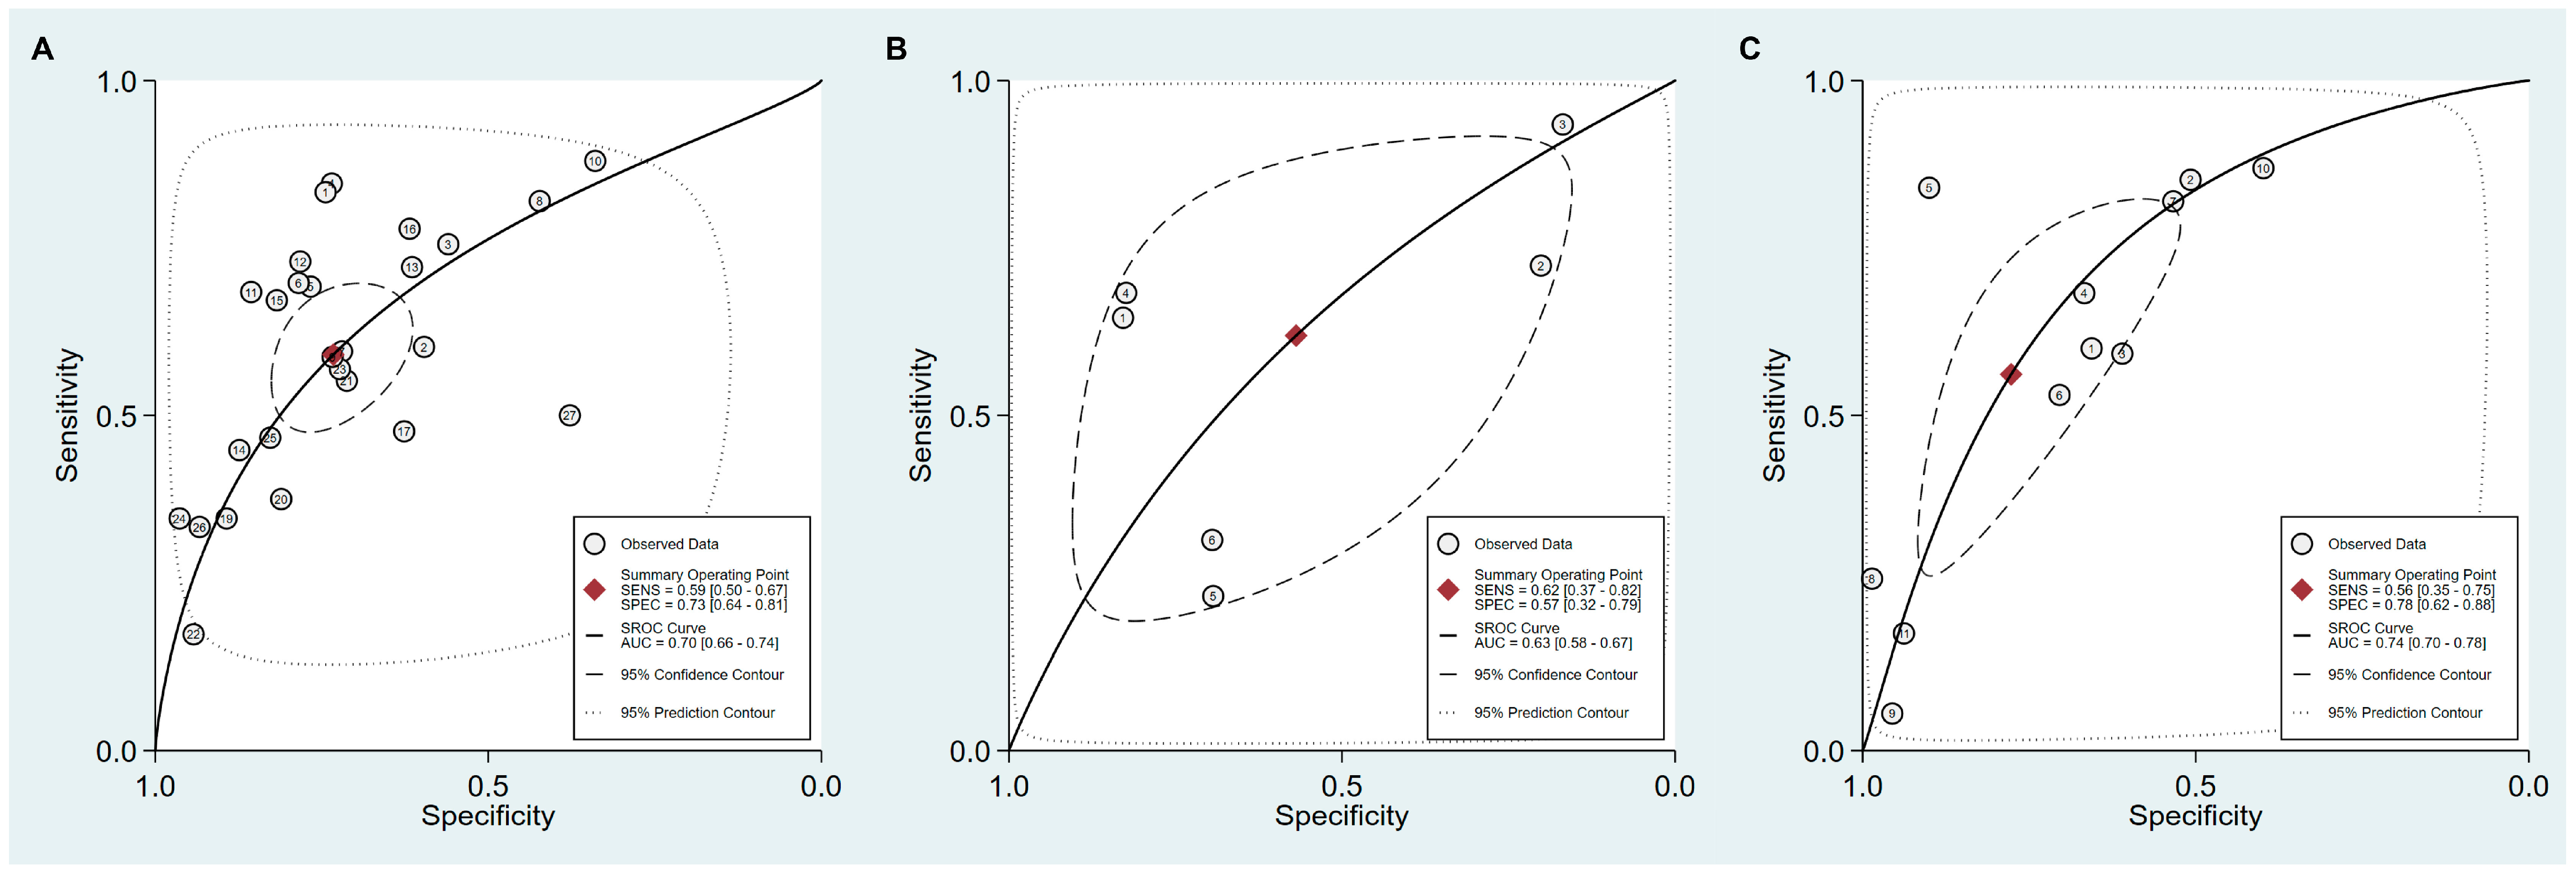
| Cut-off value: PG I ≤70 ng/mL and PG I/PG II ratio ≤3 | 27 | 0.59 (0.50–0.67) | 0.73 (0.64–0.81) | 2.2 (1.7–2.9) | 0.56 (0.46–0.68) | 4 (3–6) | 0.70 (0.66–0.74) |
| Ethnicity | |||||||
| Asian | 24 | 0.60 (0.52–0.68) | 0.75 (0.68–0.80) | 2.4 (2.0–2.8) | 0.53 (0.46–0.61) | 5 (4–6) | 0.73 (0.69–0.77) |
| Western | 3 | null | null | null | null | null | null |
| Published year | |||||||
| 2010–2018 | 15 | 0.46 (0.35–0.57) | 0.77 (0.63–0.87) | 2.0 (1.2–3.4) | 0.70 (0.56–0.89) | 3 (1–6) | 0.61 (0.57–0.66) |
| 1995–2009 | 12 | 0.71 (0.64–0.78) | 0.68 (0.59–0.76) | 2.2 (1.8–2.8) | 0.42 (0.34–0.52) | 5 (4–8) | 0.76 (0.72–0.79) |
| Total number of included patients | |||||||
| <1000 | 9 | 0.50 (0.34–0.65) | 0.65 (0.44–0.81) | 1.4 (0.7–2.8) | 0.78 (0.48–1.25) | 2 (1–6) | 0.58 (0.54–0.62) |
| 1000≤ | 18 | 0.61 (0.50–0.70) | 0.77 (0.68–0.83) | 2.6 (2.1–3.2) | 0.51 (0.43–0.61) | 5 (4–7) | 0.74 (0.70–0.78) |
| Cut-off value: PG I ≤70 ng/mL | 6 | 0.62 (0.38–0.82) | 0.57 (0.32–0.79) | 1.4 (0.9–2.3) | 0.67 (0.40–1.11) | 2 (1–5) | 0.63 (0.58–0.67) |
| Methodological quality of included studies | |||||||
| High-quality | 5 | 0.52 (0.33–0.70) | 0.66 (0.43–0.83) | 1.5 (0.8–2.9) | 0.73 (0.47–1.16) | 2 (1–6) | 0.61 (0.57–0.65) |
| Low-quality | 1 | null | null | null | null | null | null |
| Cut-off value: PG I/PG II ratio ≤3 | 11 | 0.56 (0.35–0.75) | 0.78 (0.62–0.88) | 2.5 (1.7–3.7) | 0.56 (0.39–0.81) | 4 (3–8) | 0.74 (0.70–0.78) |
| Ethnicity | |||||||
| Asian | 10 | 0.52 (0.30–0.73) | 0.75 (0.58–0.87) | 2.1 (1.7–2.7) | 0.63 (0.47–0.86) | 3 (2–5) | 0.70 (0.66–0.74) |
| Western | 1 | null | null | null | null | null | null |
© 2019 by the authors. Licensee MDPI, Basel, Switzerland. This article is an open access article distributed under the terms and conditions of the Creative Commons Attribution (CC BY) license (http://creativecommons.org/licenses/by/4.0/).
Share and Cite
Bang, C.S.; Lee, J.J.; Baik, G.H. Prediction of Chronic Atrophic Gastritis and Gastric Neoplasms by Serum Pepsinogen Assay: A Systematic Review and Meta-Analysis of Diagnostic Test Accuracy. J. Clin. Med. 2019, 8, 657. https://doi.org/10.3390/jcm8050657
Bang CS, Lee JJ, Baik GH. Prediction of Chronic Atrophic Gastritis and Gastric Neoplasms by Serum Pepsinogen Assay: A Systematic Review and Meta-Analysis of Diagnostic Test Accuracy. Journal of Clinical Medicine. 2019; 8(5):657. https://doi.org/10.3390/jcm8050657
Chicago/Turabian StyleBang, Chang Seok, Jae Jun Lee, and Gwang Ho Baik. 2019. "Prediction of Chronic Atrophic Gastritis and Gastric Neoplasms by Serum Pepsinogen Assay: A Systematic Review and Meta-Analysis of Diagnostic Test Accuracy" Journal of Clinical Medicine 8, no. 5: 657. https://doi.org/10.3390/jcm8050657
APA StyleBang, C. S., Lee, J. J., & Baik, G. H. (2019). Prediction of Chronic Atrophic Gastritis and Gastric Neoplasms by Serum Pepsinogen Assay: A Systematic Review and Meta-Analysis of Diagnostic Test Accuracy. Journal of Clinical Medicine, 8(5), 657. https://doi.org/10.3390/jcm8050657