The Challenges of Diagnostic Imaging in the Era of Big Data


Abstract
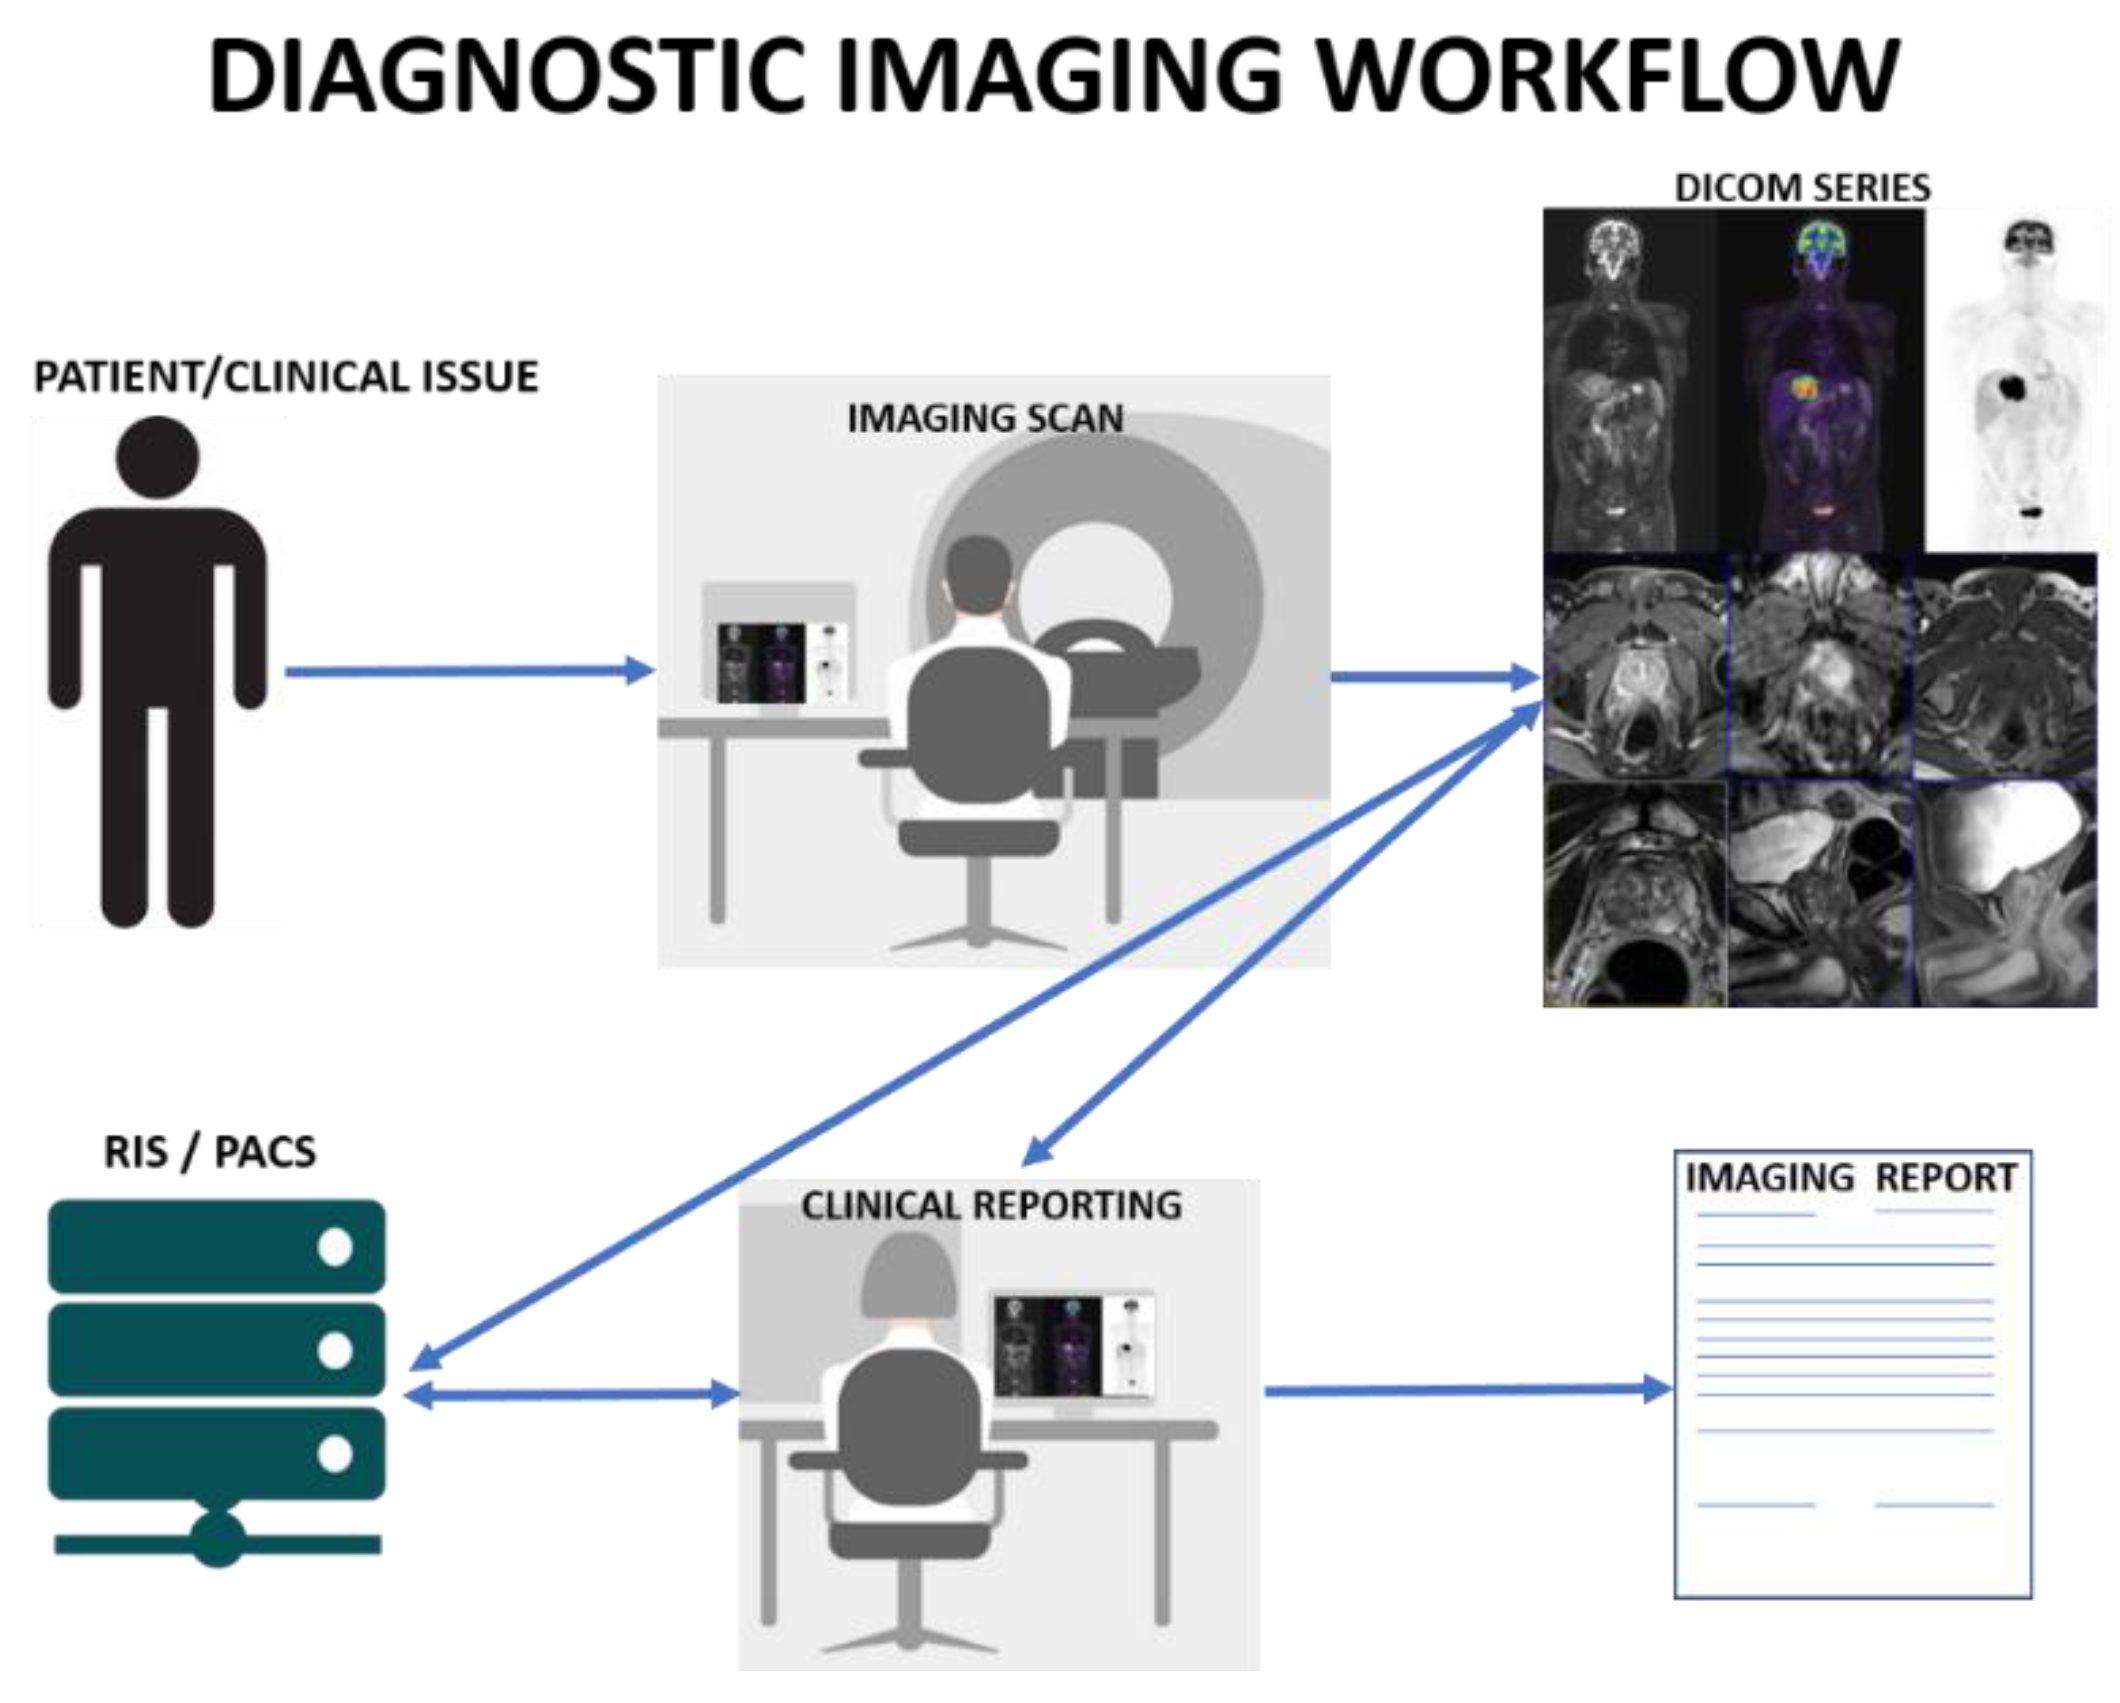
:1. Introduction
1.1. Volume
1.2. Variety
1.3. Velocity
1.4. Veracity
1.5. Value
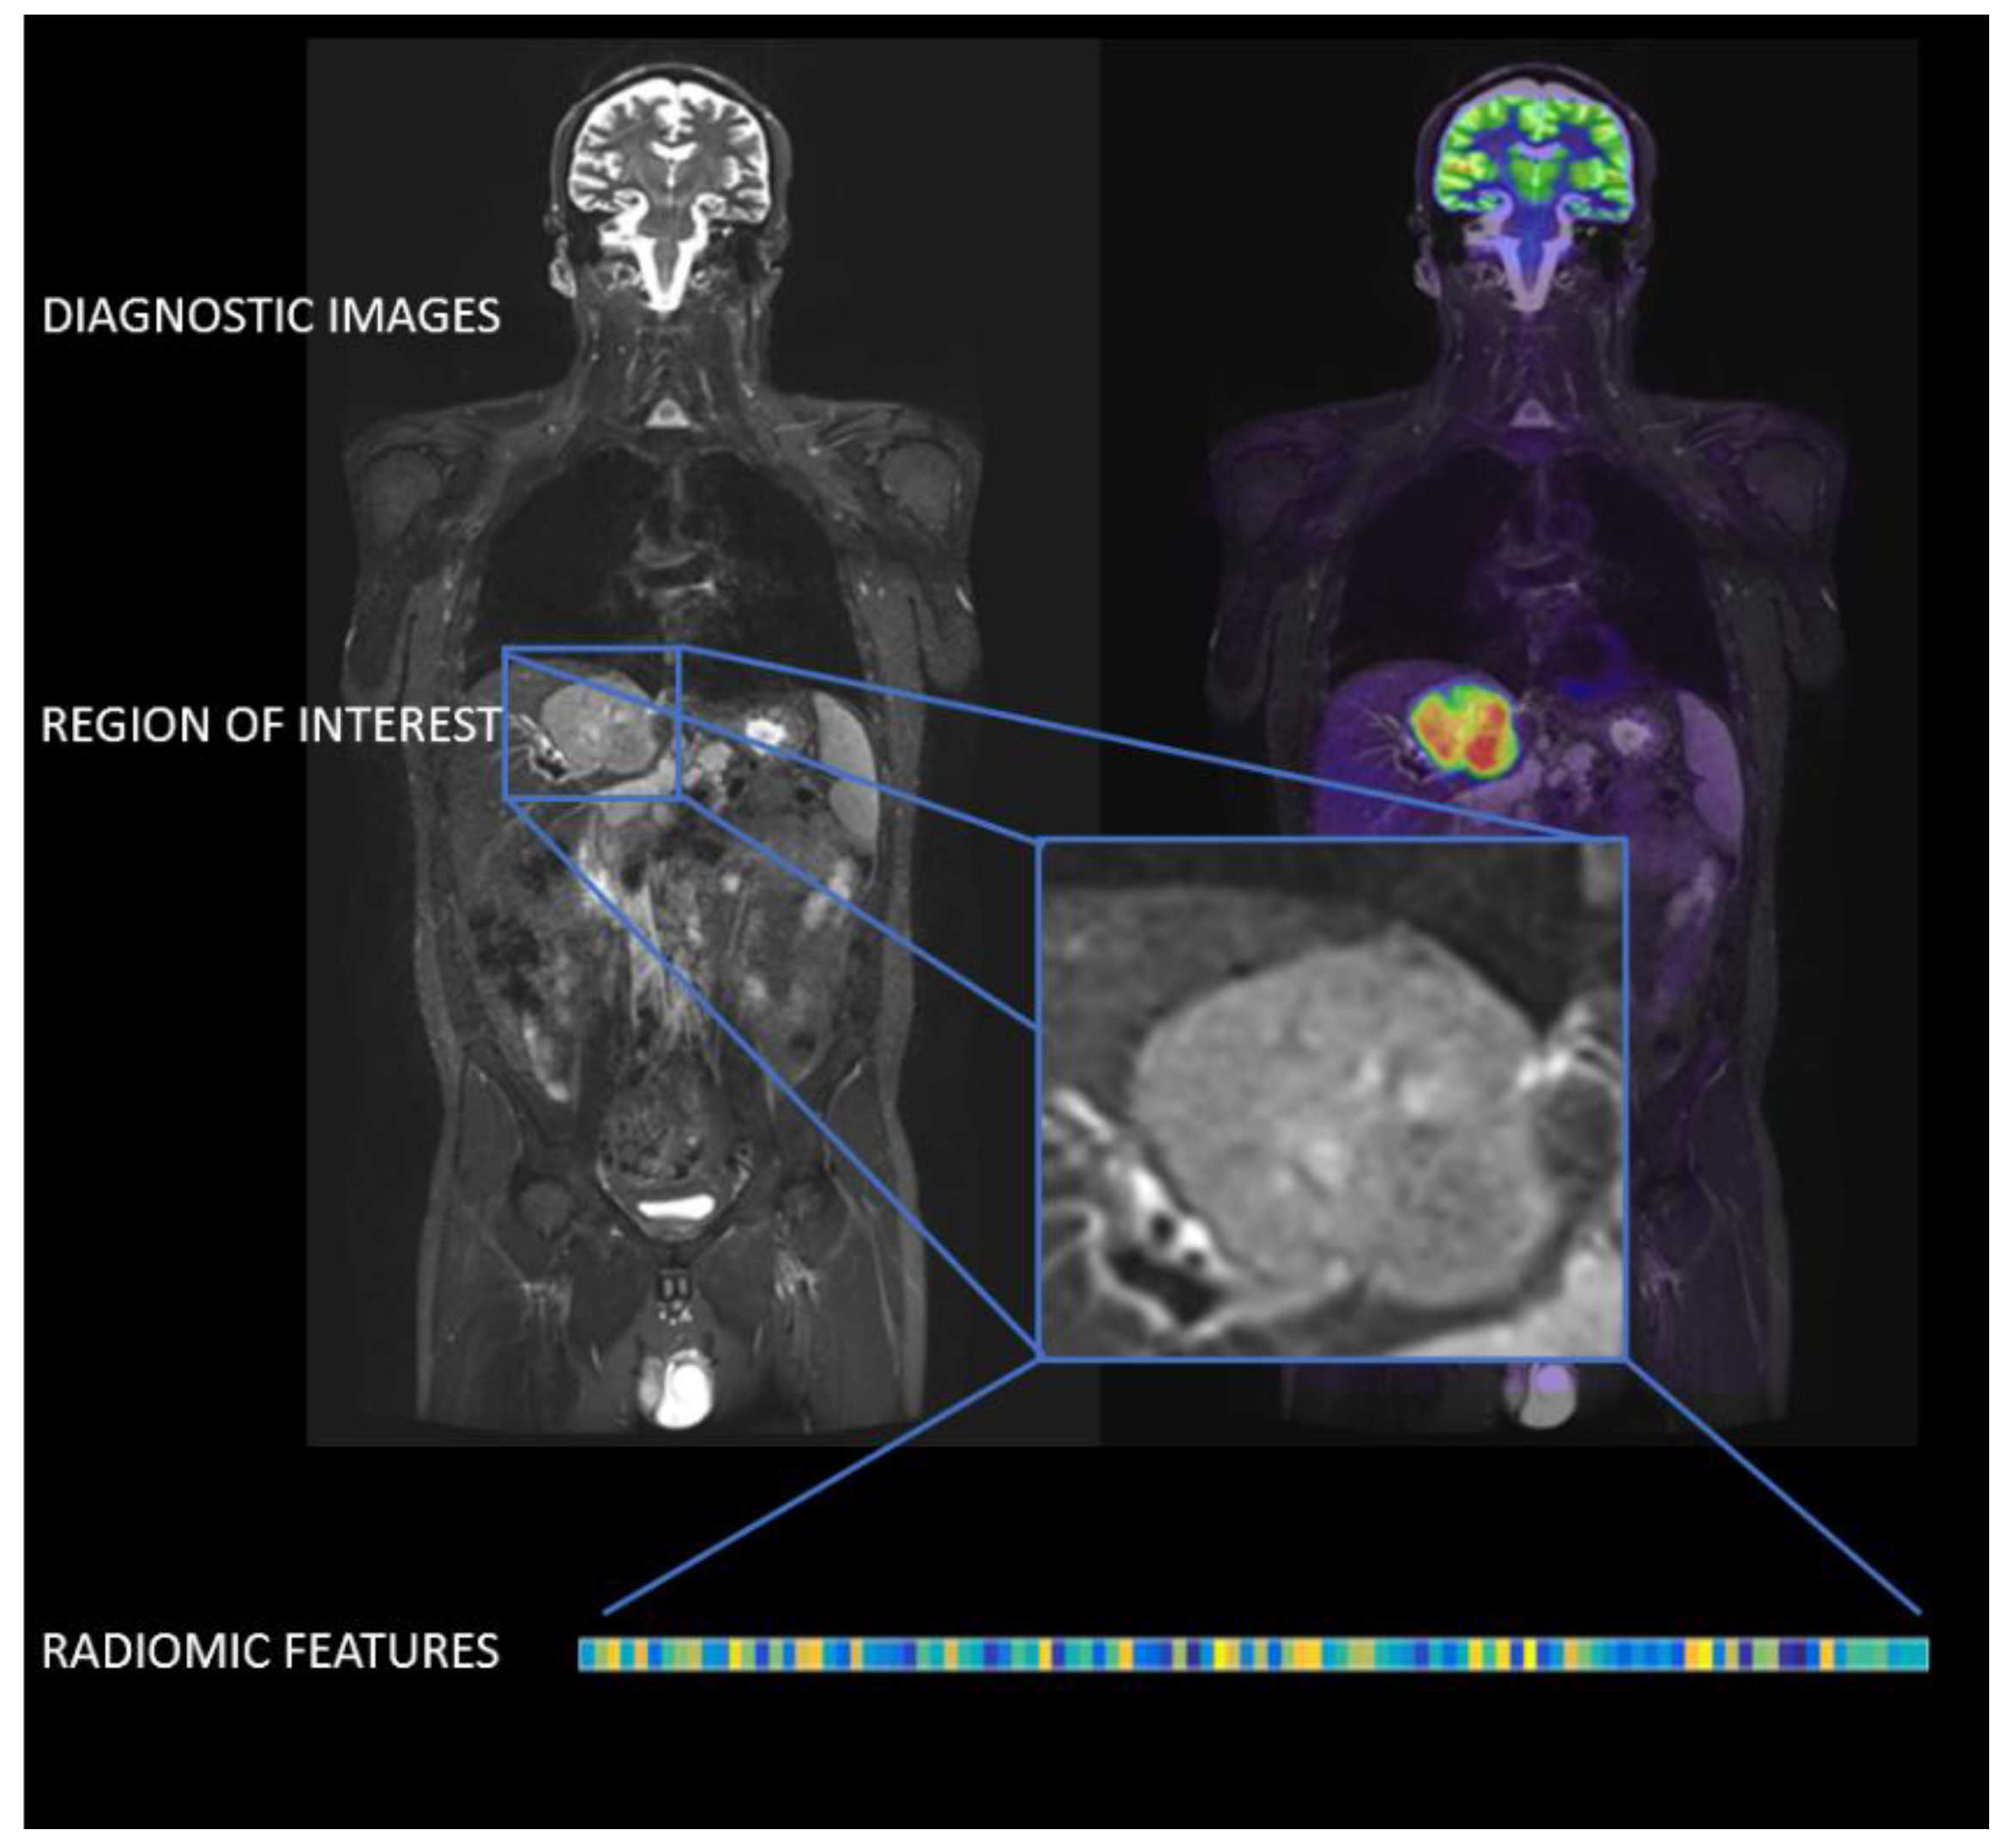
2. Radiomics
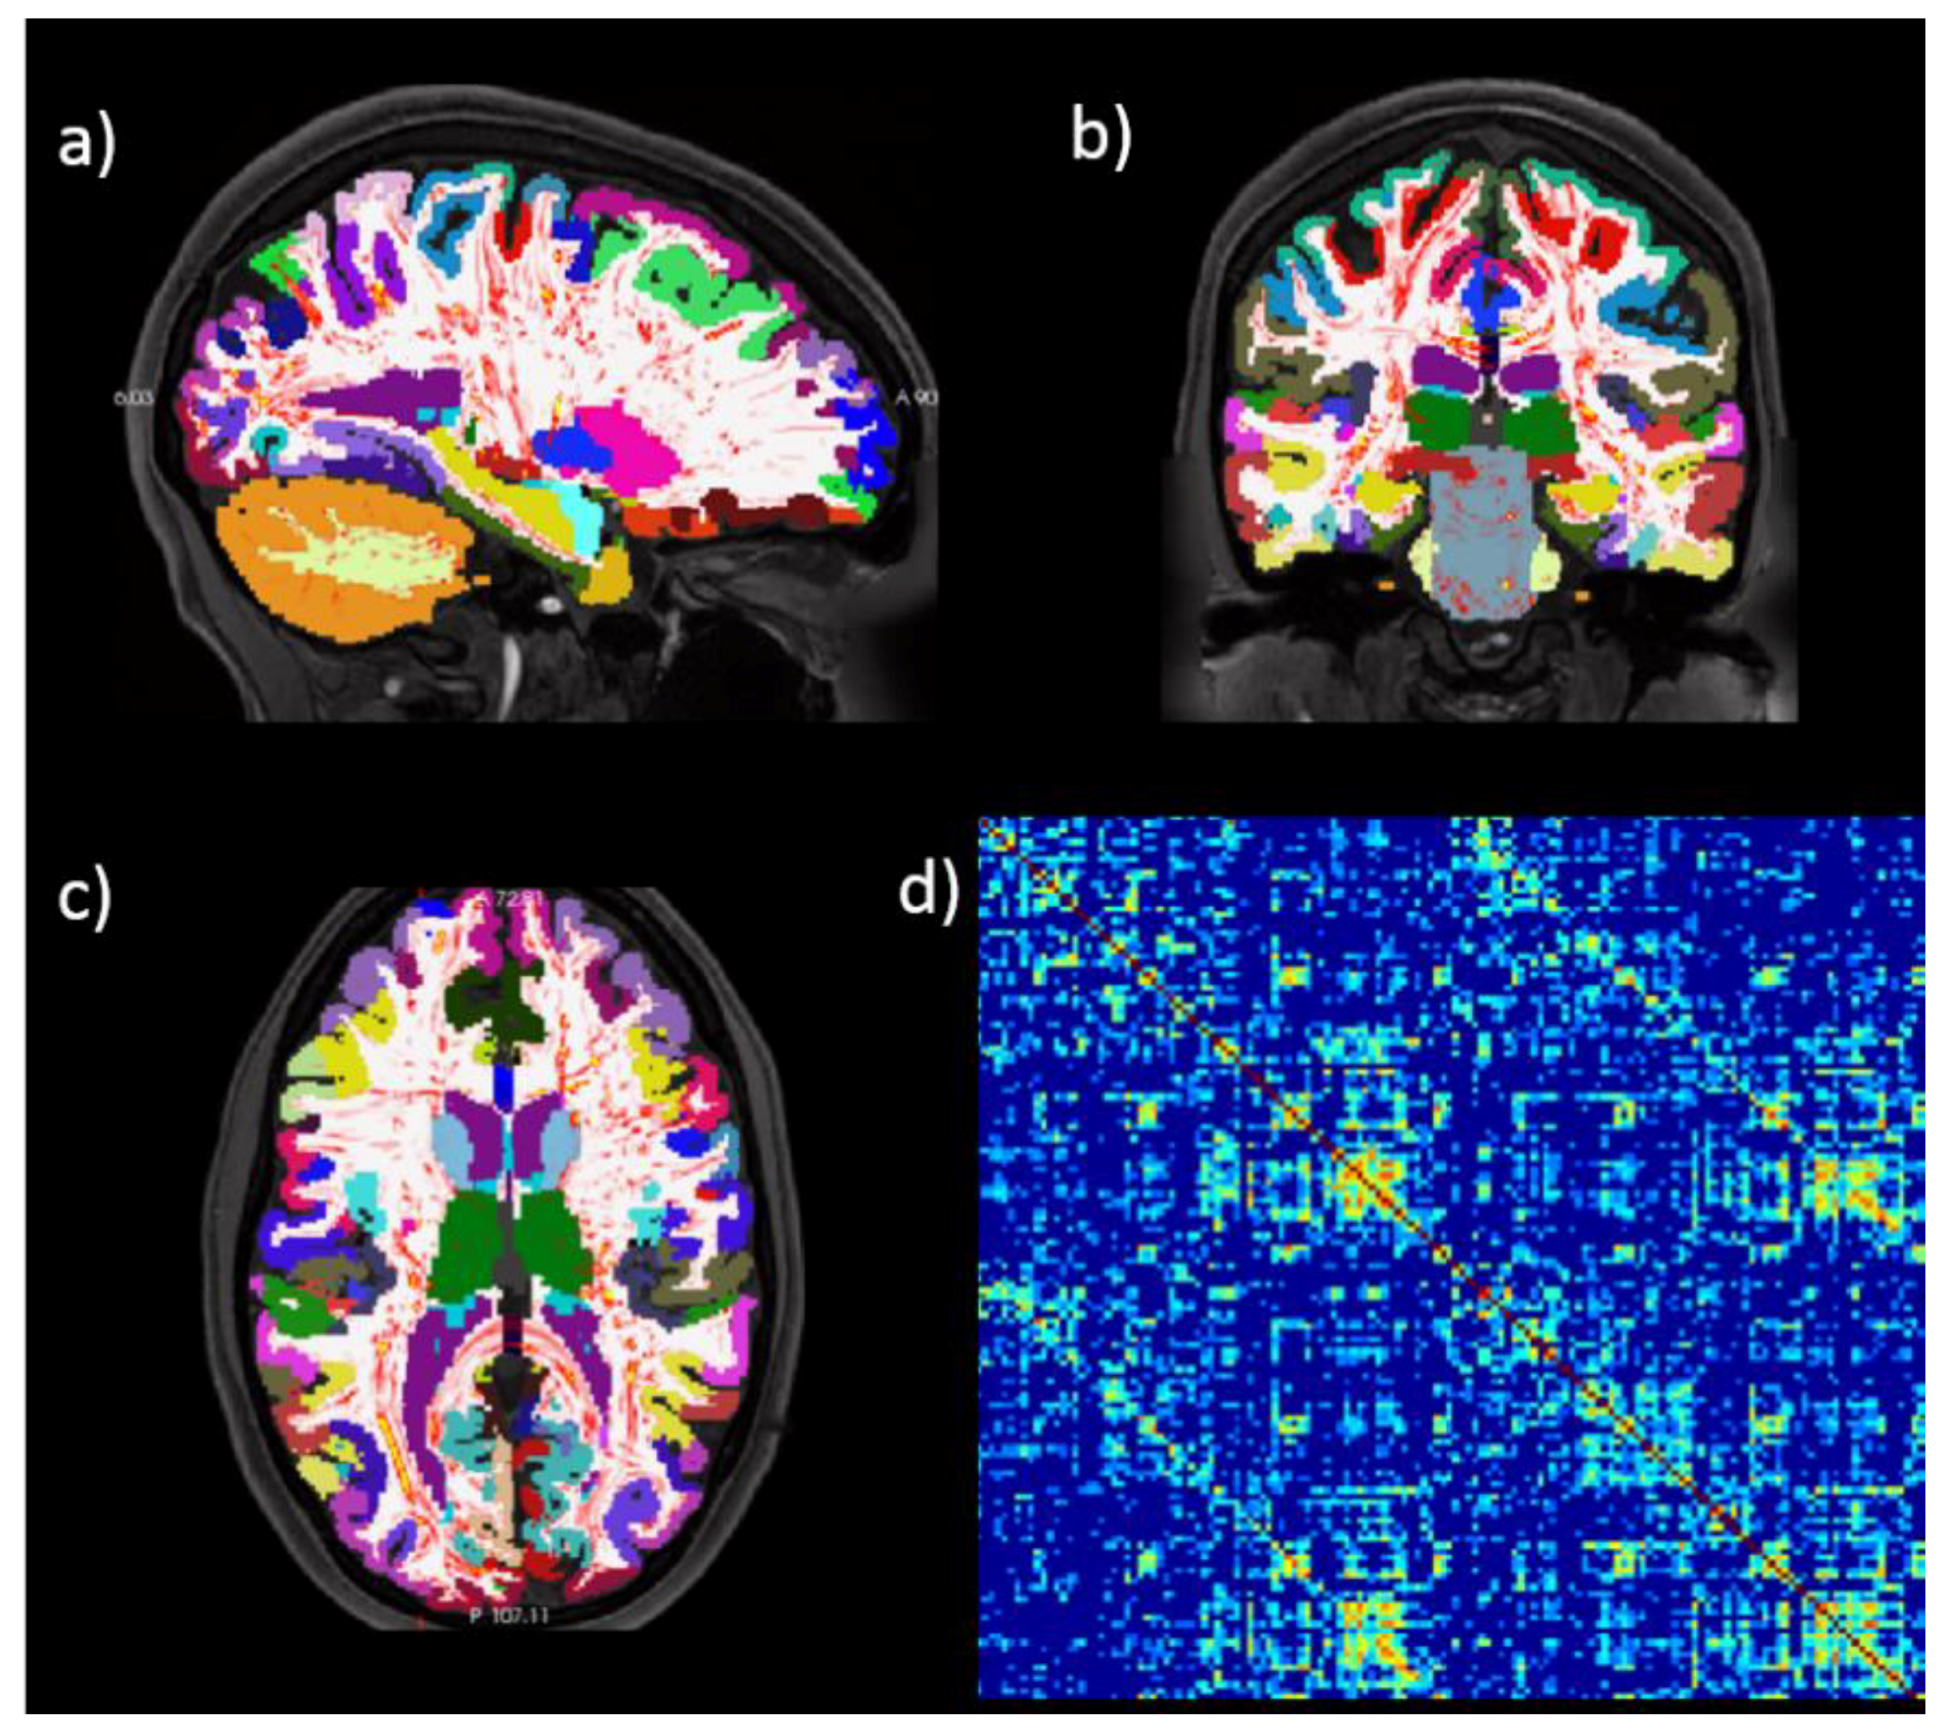
3. Connectomics
4. Anthropometry and Simulation
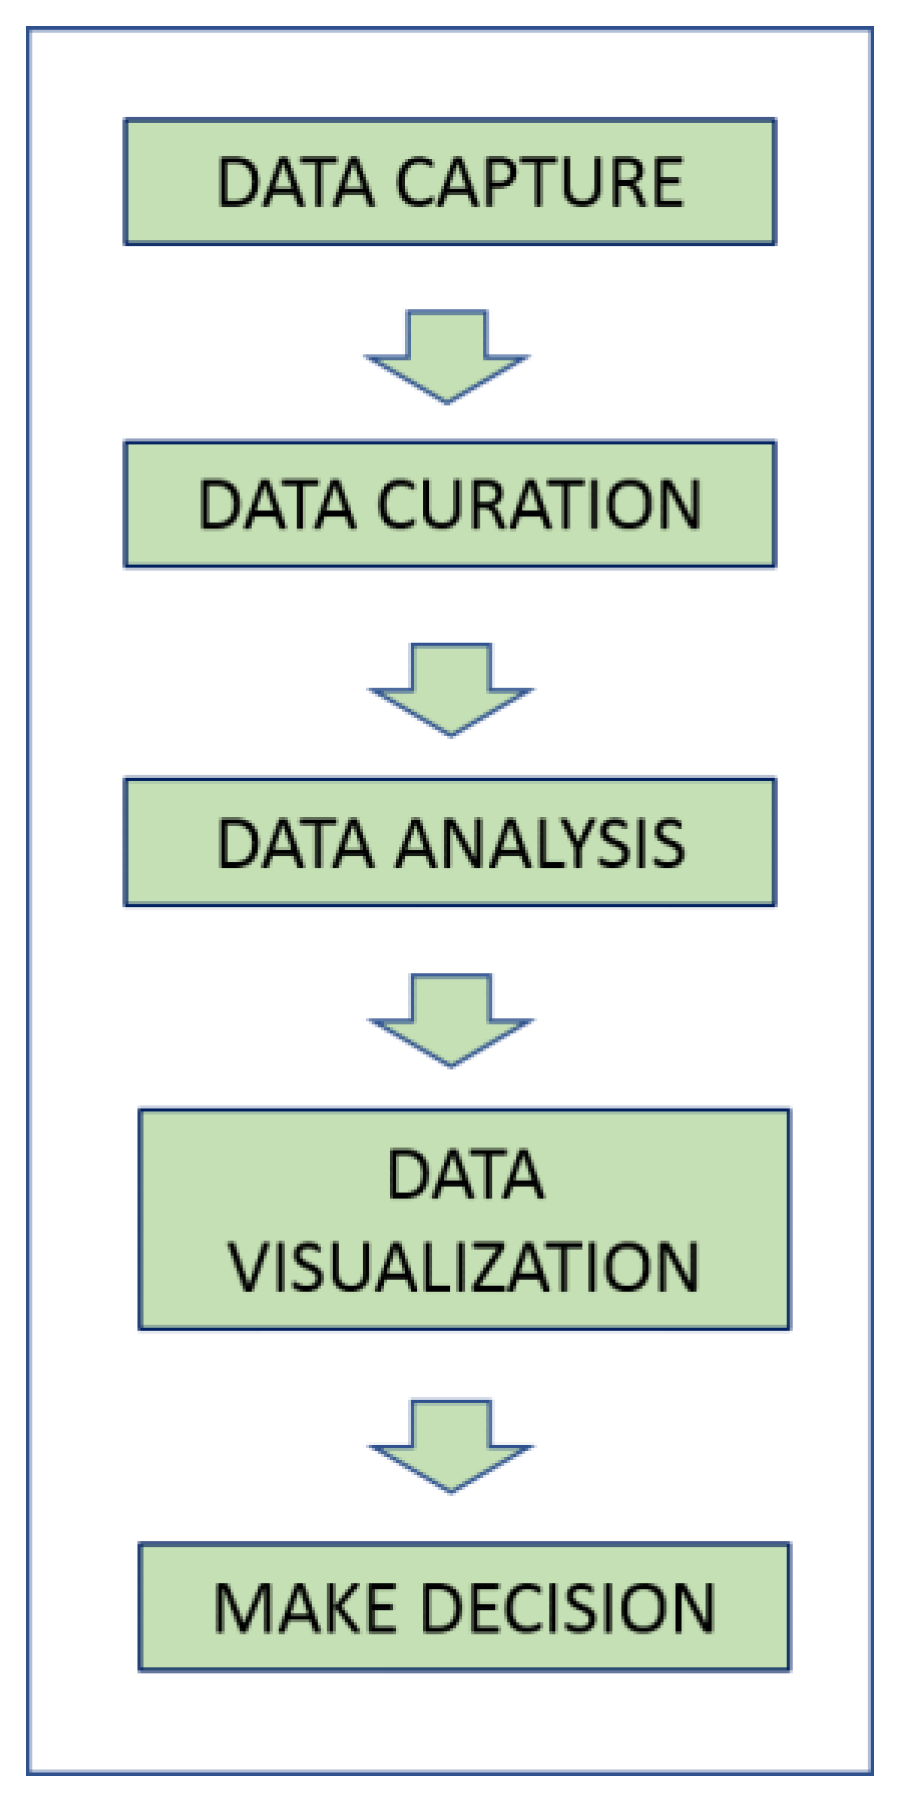
5. Discussion
Author Contributions
Funding
Conflicts of Interest
References
- Laney, D. 3D data management: Controlling data volume, velocity and variety. META Group Res. Note 2001, 6, 1. [Google Scholar]
- Kansagra, A.P.; Yu, J.-P.J.; Chatterjee, A.R.; Lenchik, L.; Chow, D.S.; Prater, A.B.; Yeh, J.; Doshi, A.M.; Hawkins, C.M.; Heilbrun, M.E.; et al. Big Data and the Future of Radiology Informatics. Acad. Radiol. 2016, 23, 30–42. [Google Scholar] [CrossRef] [PubMed]
- Mehta, N.; Pandit, A. Concurrence of big data analytics and healthcare: A systematic review. Int. J. Med. Inform. 2018, 114, 57–65. [Google Scholar] [CrossRef] [PubMed]
- Wu, X.; Zhu, X.; Wu, G.-Q.; Ding, W. Data mining with big data. IEEE Trans. Knowl. Data Eng. 2014, 26, 97–107. [Google Scholar]
- Dinov, I.D. Volume and Value of Big Healthcare Data. J. Med. Stat. Inf. 2016, 4. pii: 3. [Google Scholar] [CrossRef]
- Morris, M.A.; Saboury, B.; Burkett, B.; Gao, J.; Siegel, E.L. Reinventing Radiology: Big Data and the Future of Medical Imaging. J. Thorac. Imaging 2018, 33, 4–16. [Google Scholar] [CrossRef] [PubMed]
- Ristevski, B.; Chen, M. Big Data Analytics in Medicine and Healthcare. J. Integr. Bioinform. 2018, 15. [Google Scholar] [CrossRef] [PubMed]
- Hulsen, T.; Jamuar, S.S.; Moody, A.; Karnes, J.H.; Orsolya, V.; Hedensted, S.; Spreafico, R.; Hafler, D.A.; McKinney, E. From Big Data to Precision Medicine. Front. Med. 2019, 6. [Google Scholar] [CrossRef]
- Sukumar, S.R.; Natarajan, R.; Ferrell, R.K. Quality of Big Data in health care. Int. J. Health Care Qual. Assur. 2015, 28, 621–634. [Google Scholar] [CrossRef] [PubMed]
- Incoronato, M.; Aiello, M.; Infante, T.; Cavaliere, C.; Grimaldi, A.M.; Mirabelli, P.; Monti, S.; Salvatore, M. Radiogenomic Analysis of Oncological Data: A Technical Survey. Int. J. Mol. Sci. 2017, 18, 805. [Google Scholar] [CrossRef] [PubMed]
- Lambin, P.; Leijenaar, R.T.H.; Deist, T.M.; Peerlings, J.; de Jong, E.E.C.; Van Timmeren, J.; Sanduleanu, S.; Larue, R.T.H.M.; Even, A.J.G.; Jochems, A.; et al. Radiomics: The bridge between medical imaging and personalized medicine. Nat. Rev. Clin. Oncol. 2017, 14, 749–762. [Google Scholar] [CrossRef] [PubMed]
- Segal, E.; Sirlin, C.B.; Ooi, C.; Adler, A.S.; Gollub, J.; Chen, X.; Chan, B.K.; Matcuk, G.R.; Barry, C.T.; Chang, H.Y.; et al. Decoding global gene expression programs in liver cancer by noninvasive imaging. Nat. Biotechnol. 2007, 25, 675–680. [Google Scholar] [CrossRef] [PubMed]
- Diehn, M.; Nardini, C.; Wang, D.S.; McGovern, S.; Jayaraman, M.; Liang, Y.; Aldape, K.; Cha, S.; Kuo, M.D. Identification of noninvasive imaging surrogates for brain tumor gene-expression modules. Proc. Natl. Acad. Sci. USA 2008, 105, 5213–5218. [Google Scholar] [CrossRef] [PubMed] [Green Version]
- Gillies, R.J.; Kinahan, P.E.; Hricak, H. Radiomics: Images are more than Pictures, They Are Data. Radiology 2016, 278, 563–577. [Google Scholar] [CrossRef] [PubMed]
- Aerts, H.J.W.L.; Velazquez, E.R.; Leijenaar, R.T.H.; Parmar, C.; Grossmann, P.; Carvalho, S.; Bussink, J.; Monshouwer, R.; Haibe-Kains, B.; Rietveld, D.; et al. Decoding tumour phenotype by noninvasive imaging using a quantitative radiomics approach. Nat. Commun. 2014, 5, 4006. [Google Scholar] [CrossRef] [PubMed] [Green Version]
- Monti, S.; Aiello, M.; Incoronato, M.; Grimaldi, A.M.; Moscarino, M.; Mirabelli, P.; Ferbo, U.; Cavaliere, C.; Salvatore, M. DCE-MRI Pharmacokinetic-Based Phenotyping of Invasive Ductal Carcinoma: A Radiomic Study for Prediction of Histological Outcomes. Contrast Media Mol. Imaging 2018, 2018, 5076269. [Google Scholar] [CrossRef] [PubMed]
- Kirienko, M.; Cozzi, L.; Antunovic, L.; Lozza, L.; Fogliata, A.; Voulaz, E.; Rossi, A.; Chiti, A.; Sollini, M. Prediction of disease-free survival by the PET/CT radiomic signature in non-small cell lung cancer patients undergoing surgery. Eur. J. Nucl. Med. Mol. Imaging 2017, 45, 207–217. [Google Scholar] [CrossRef] [PubMed]
- Blanc-Durand, P.; Gucht, A.V.D.; Jreige, M.; Nicod-Lalonde, M.; Silva-Monteiro, M.; Prior, J.O.; Denys, A.; Depeursinge, A.; Schaefer, N. Signature of survival: A 18F-FDG PET based whole-liver radiomic analysis predicts survival after 90Y-TARE for hepatocellular carcinoma. Oncotarget 2017, 9, 4549–4558. [Google Scholar] [PubMed]
- Zwanenburg, A.; Leger, S.; Vallières, M.; Löck, S. Image Biomarker Standardisation Initiative. Image biomarker standardisation initiative. arXiv, 2016; arXiv:1612.07003. [Google Scholar]
- Keek, S.A.; Leijenaar, R.T.; Jochems, A.; Woodruff, H.C. A review on radiomics and the future of theranostics for patient selection in precision medicine. Br. J. Radiol. 2018, 91, 20170926. [Google Scholar] [CrossRef] [PubMed]
- Sporns, O. Structure and function of complex brain networks. Dialogues Clin. Neurosci. 2013, 15, 247–262. [Google Scholar] [PubMed]
- Rubinov, M.; Sporns, O. Complex network measures of brain connectivity: Uses and interpretations. NeuroImage 2010, 52, 1059–1069. [Google Scholar] [CrossRef] [PubMed]
- Aiello, M.; Cavaliere, C.; Salvatore, M. Hybrid PET/MR Imaging and Brain Connectivity. Front. Neurosci. 2016, 10, 64. [Google Scholar] [CrossRef] [PubMed]
- Marchitelli, R.; Aiello, M.; Cachia, A.; Quarantelli, M.; Cavaliere, C.; Postiglione, A.; Tedeschi, G.; Montella, P.; Milan, G.; Salvatore, M.; et al. Simultaneous resting-state FDG-PET/fMRI in Alzheimer Disease: Relationship between glucose metabolism and intrinsic activity. NeuroImage 2018, 176, 246–258. [Google Scholar] [CrossRef] [PubMed]
- Aiello, M.; Salvatore, E.; Cachia, A.; Pappatà, S.; Cavaliere, C.; Prinster, A.; Nicolai, E.; Salvatore, M.; Baron, J.-C.; Quarantelli, M. Relationship between simultaneously acquired resting-state regional cerebral glucose metabolism and functional MRI: A PET/MR hybrid scanner study. Neuroimage 2015, 113, 111–121. [Google Scholar] [CrossRef] [PubMed]
- Lichtman, J.W.; Sanes, J.R. Ome sweet ome: What can the genome tell us about the connectome? Curr. Opin. Neurobiol. 2008, 18, 346–353. [Google Scholar] [CrossRef] [PubMed]
- Glasser, M.F.; Coalson, T.S.; Robinson, E.C.; Hacker, C.D.; Harwell, J.; Yacoub, E.; Ugurbil, K.; Andersson, J.; Beckmann, C.F.; Jenkinson, M.; et al. A multi-modal parcellation of human cerebral cortex. Nature 2016, 536, 171–178. [Google Scholar] [CrossRef] [PubMed] [Green Version]
- Toga, A.W.; Clark, K.A.; Thompson, P.M.; Shattuck, D.W.; Van Horn, J.D. Mapping the Human Connectome. Neurosurgery 2012, 71, 1–5. [Google Scholar] [CrossRef] [PubMed] [Green Version]
- Xia, M.; He, Y. Functional connectomics from a “big data” perspective. NeuroImage 2017, 160, 152–167. [Google Scholar] [CrossRef] [PubMed]
- Powell, M.A.; Garcia, J.O.; Yeh, F.-C.; Vettel, J.M.; Verstynen, T. Local connectome phenotypes predict social, health, and cognitive factors. Netw. Neurosci. 2017, 2, 86–105. [Google Scholar] [CrossRef] [PubMed]
- Riccelli, R.; Toschi, N.; Nigro, S.; Terracciano, A.; Passamonti, L. Surface-based morphometry reveals the neuroanatomical basis of the five-factor model of personality. Soc. Cogn. Affect. Neurosci. 2017, 12, 671–684. [Google Scholar] [CrossRef] [PubMed] [Green Version]
- Toschi, N.; Passamonti, L. Intra-cortical myelin mediates personality differences. J. Pers. 2018. [Google Scholar] [CrossRef] [PubMed]
- Talukdar, T.; Román, F.J.; Operskalski, J.T.; Zwilling, C.E.; Barbey, A.K. Individual differences in decision making competence revealed by multivariate fMRI. Hum. Brain Mapping 2018, 39, 2664–2672. [Google Scholar] [CrossRef] [PubMed]
- Seidlitz, J.; Váša, F.; Shinn, M.; Romero-Garcia, R.; Whitaker, K.J.; Vértes, P.E.; Wagstyl, K.; Reardon, P.K.; Clasen, L.; Liu, S.; et al. Morphometric Similarity Networks Detect Microscale Cortical Organization and Predict Inter-Individual Cognitive Variation. Neuron 2018, 97, 231.e7–247.e7. [Google Scholar] [CrossRef] [PubMed]
- Frangi, A.F.; Tsaftaris, S.A.; Prince, J.L. Simulation and Synthesis in Medical Imaging. IEEE Trans. Med Imaging 2018, 37, 673–679. [Google Scholar] [CrossRef] [PubMed] [Green Version]
- Utkualp, N.; Ercan, I. Anthropometric Measurements Usage in Medical Sciences. Available online: https://www.hindawi.com/journals/bmri/2015/404261/ (accessed on 16 April 2018).
- Daly, M.; Duma, S.M.; Stitzel, J.D. Retrospective identification of subject anthropometry using computed tomography of the leg. Biomed. Sci. Instrum. 2006, 42, 114–119. [Google Scholar] [PubMed]
- Mongraw-Chaffin, M.; Kanaya, A.M.; Kandula, N.R.; Shah, A.; Anderson, C.A.M. The relationship between anthropometry and body composition from computed tomography: The Mediators of Atherosclerosis in South Asians Living in America Study. Ethn. Health 2017, 22, 565–574. [Google Scholar] [CrossRef] [PubMed]
- Mongraw-Chaffin, M.; Golden, S.H.; Allison, M.A.; Ding, J.; Ouyang, P.; Schreiner, P.J.; Szklo, M.; Woodward, M.; Young, J.H.; Anderson, C.A.M. The Sex and Race Specific Relationship between Anthropometry and Body Fat Composition Determined from Computed Tomography: Evidence from the Multi-Ethnic Study of Atherosclerosis. PLoS ONE 2015, 10, e0139559. [Google Scholar] [CrossRef] [PubMed]
- Alharethy, S.; Al-Quniabut, I.; Jang, Y.J. Anthropometry of Arabian Nose using Computed Tomography Scanning. Ann. Saudi Med. 2017, 37, 144–147. [Google Scholar] [CrossRef] [PubMed]
- Pool, G.M.; Didier, R.A.; Bardo, D.; Selden, N.R.; Kuang, A.A. Computed tomography-generated anthropometric measurements of orbital relationships in normal infants and children. J. Neurosurg. Pediatr. 2016, 18, 201–206. [Google Scholar] [CrossRef] [PubMed]
- Flamini, V.; Creane, A.P.; Kerskens, C.M.; Lally, C. Imaging and finite element analysis: A methodology for non-invasive characterization of aortic tissue. Med. Eng. Phys. 2015, 37, 48–54. [Google Scholar] [CrossRef] [PubMed]
- Wang, H.; Xu, Z.; Fujita, H.; Liu, S. Towards felicitous decision making: An overview on challenges and trends of Big Data. Inf. Sci. 2016, 367–368, 747–765. [Google Scholar] [CrossRef]
- Fedorov, A.; Clunie, D.; Ulrich, E.; Bauer, C.; Wahle, A.; Brown, B.; Onken, M.; Riesmeier, J.; Pieper, S.; Kikinis, R.; et al. DICOM for quantitative imaging biomarker development: A standards based approach to sharing clinical data and structured PET/CT analysis results in head and neck cancer research. PeerJ 2016, 4, e2057. [Google Scholar] [CrossRef] [PubMed]
- Mulshine, J.L.; Gierada, D.S.; Armato, S.G.; Avila, R.S.; Yankelevitz, D.F.; Kazerooni, E.A.; McNitt-Gray, M.F.; Buckler, A.J.; Sullivan, D.C. Role of the Quantitative Imaging Biomarker Alliance in Optimizing CT for the Evaluation of Lung Cancer Screen–Detected Nodules. J. Am. Coll. Radiol. 2015, 12, 390–395. [Google Scholar] [CrossRef] [PubMed]
- Nordstrom, R.J. The Quantitative Imaging Network in Precision Medicine. Tomography 2016, 2, 239–241. [Google Scholar] [PubMed] [Green Version]
- Van Essen, D.C.; Glasser, M.F. The Human Connectome Project: Progress and Prospects. Cerebrum 2016, 2016, 10–16. [Google Scholar]
- Miller, K.L.; Alfaro-Almagro, F.; Bangerter, N.K.; Thomas, D.L.; Yacoub, E.; Xu, J.; Bartsch, A.J.; Jbabdi, S.; Sotiropoulos, S.N.; Andersson, J.L.; et al. Multimodal population brain imaging in the UK Biobank prospective epidemiological study. Nat. Neurosci. 2016, 19, 1523–1536. [Google Scholar] [CrossRef] [PubMed] [Green Version]
- European Society of Radiology (ESR) ESR Position Paper on Imaging Biobanks. Insights Imaging 2015, 6, 403–410. [CrossRef] [PubMed]
- Castiglioni, I.; Gilardi, M.C. Radiomics: Is it time to compose the puzzle? Clin. Transl. Imaging 2018, 6, 411–413. [Google Scholar] [CrossRef] [PubMed]


© 2019 by the authors. Licensee MDPI, Basel, Switzerland. This article is an open access article distributed under the terms and conditions of the Creative Commons Attribution (CC BY) license (http://creativecommons.org/licenses/by/4.0/).
Share and Cite
Aiello, M.; Cavaliere, C.; D’Albore, A.; Salvatore, M. The Challenges of Diagnostic Imaging in the Era of Big Data. J. Clin. Med. 2019, 8, 316. https://doi.org/10.3390/jcm8030316
Aiello M, Cavaliere C, D’Albore A, Salvatore M. The Challenges of Diagnostic Imaging in the Era of Big Data. Journal of Clinical Medicine. 2019; 8(3):316. https://doi.org/10.3390/jcm8030316
Chicago/Turabian StyleAiello, Marco, Carlo Cavaliere, Antonio D’Albore, and Marco Salvatore. 2019. "The Challenges of Diagnostic Imaging in the Era of Big Data" Journal of Clinical Medicine 8, no. 3: 316. https://doi.org/10.3390/jcm8030316
APA StyleAiello, M., Cavaliere, C., D’Albore, A., & Salvatore, M. (2019). The Challenges of Diagnostic Imaging in the Era of Big Data. Journal of Clinical Medicine, 8(3), 316. https://doi.org/10.3390/jcm8030316