Reduction of Fat to Muscle Mass Ratio Is Associated with Improvement of Liver Stiffness in Diabetic Patients with Non-Alcoholic Fatty Liver Disease

 , , ,
, , ,  and
and 
Abstract
1. Introduction
2. Methods
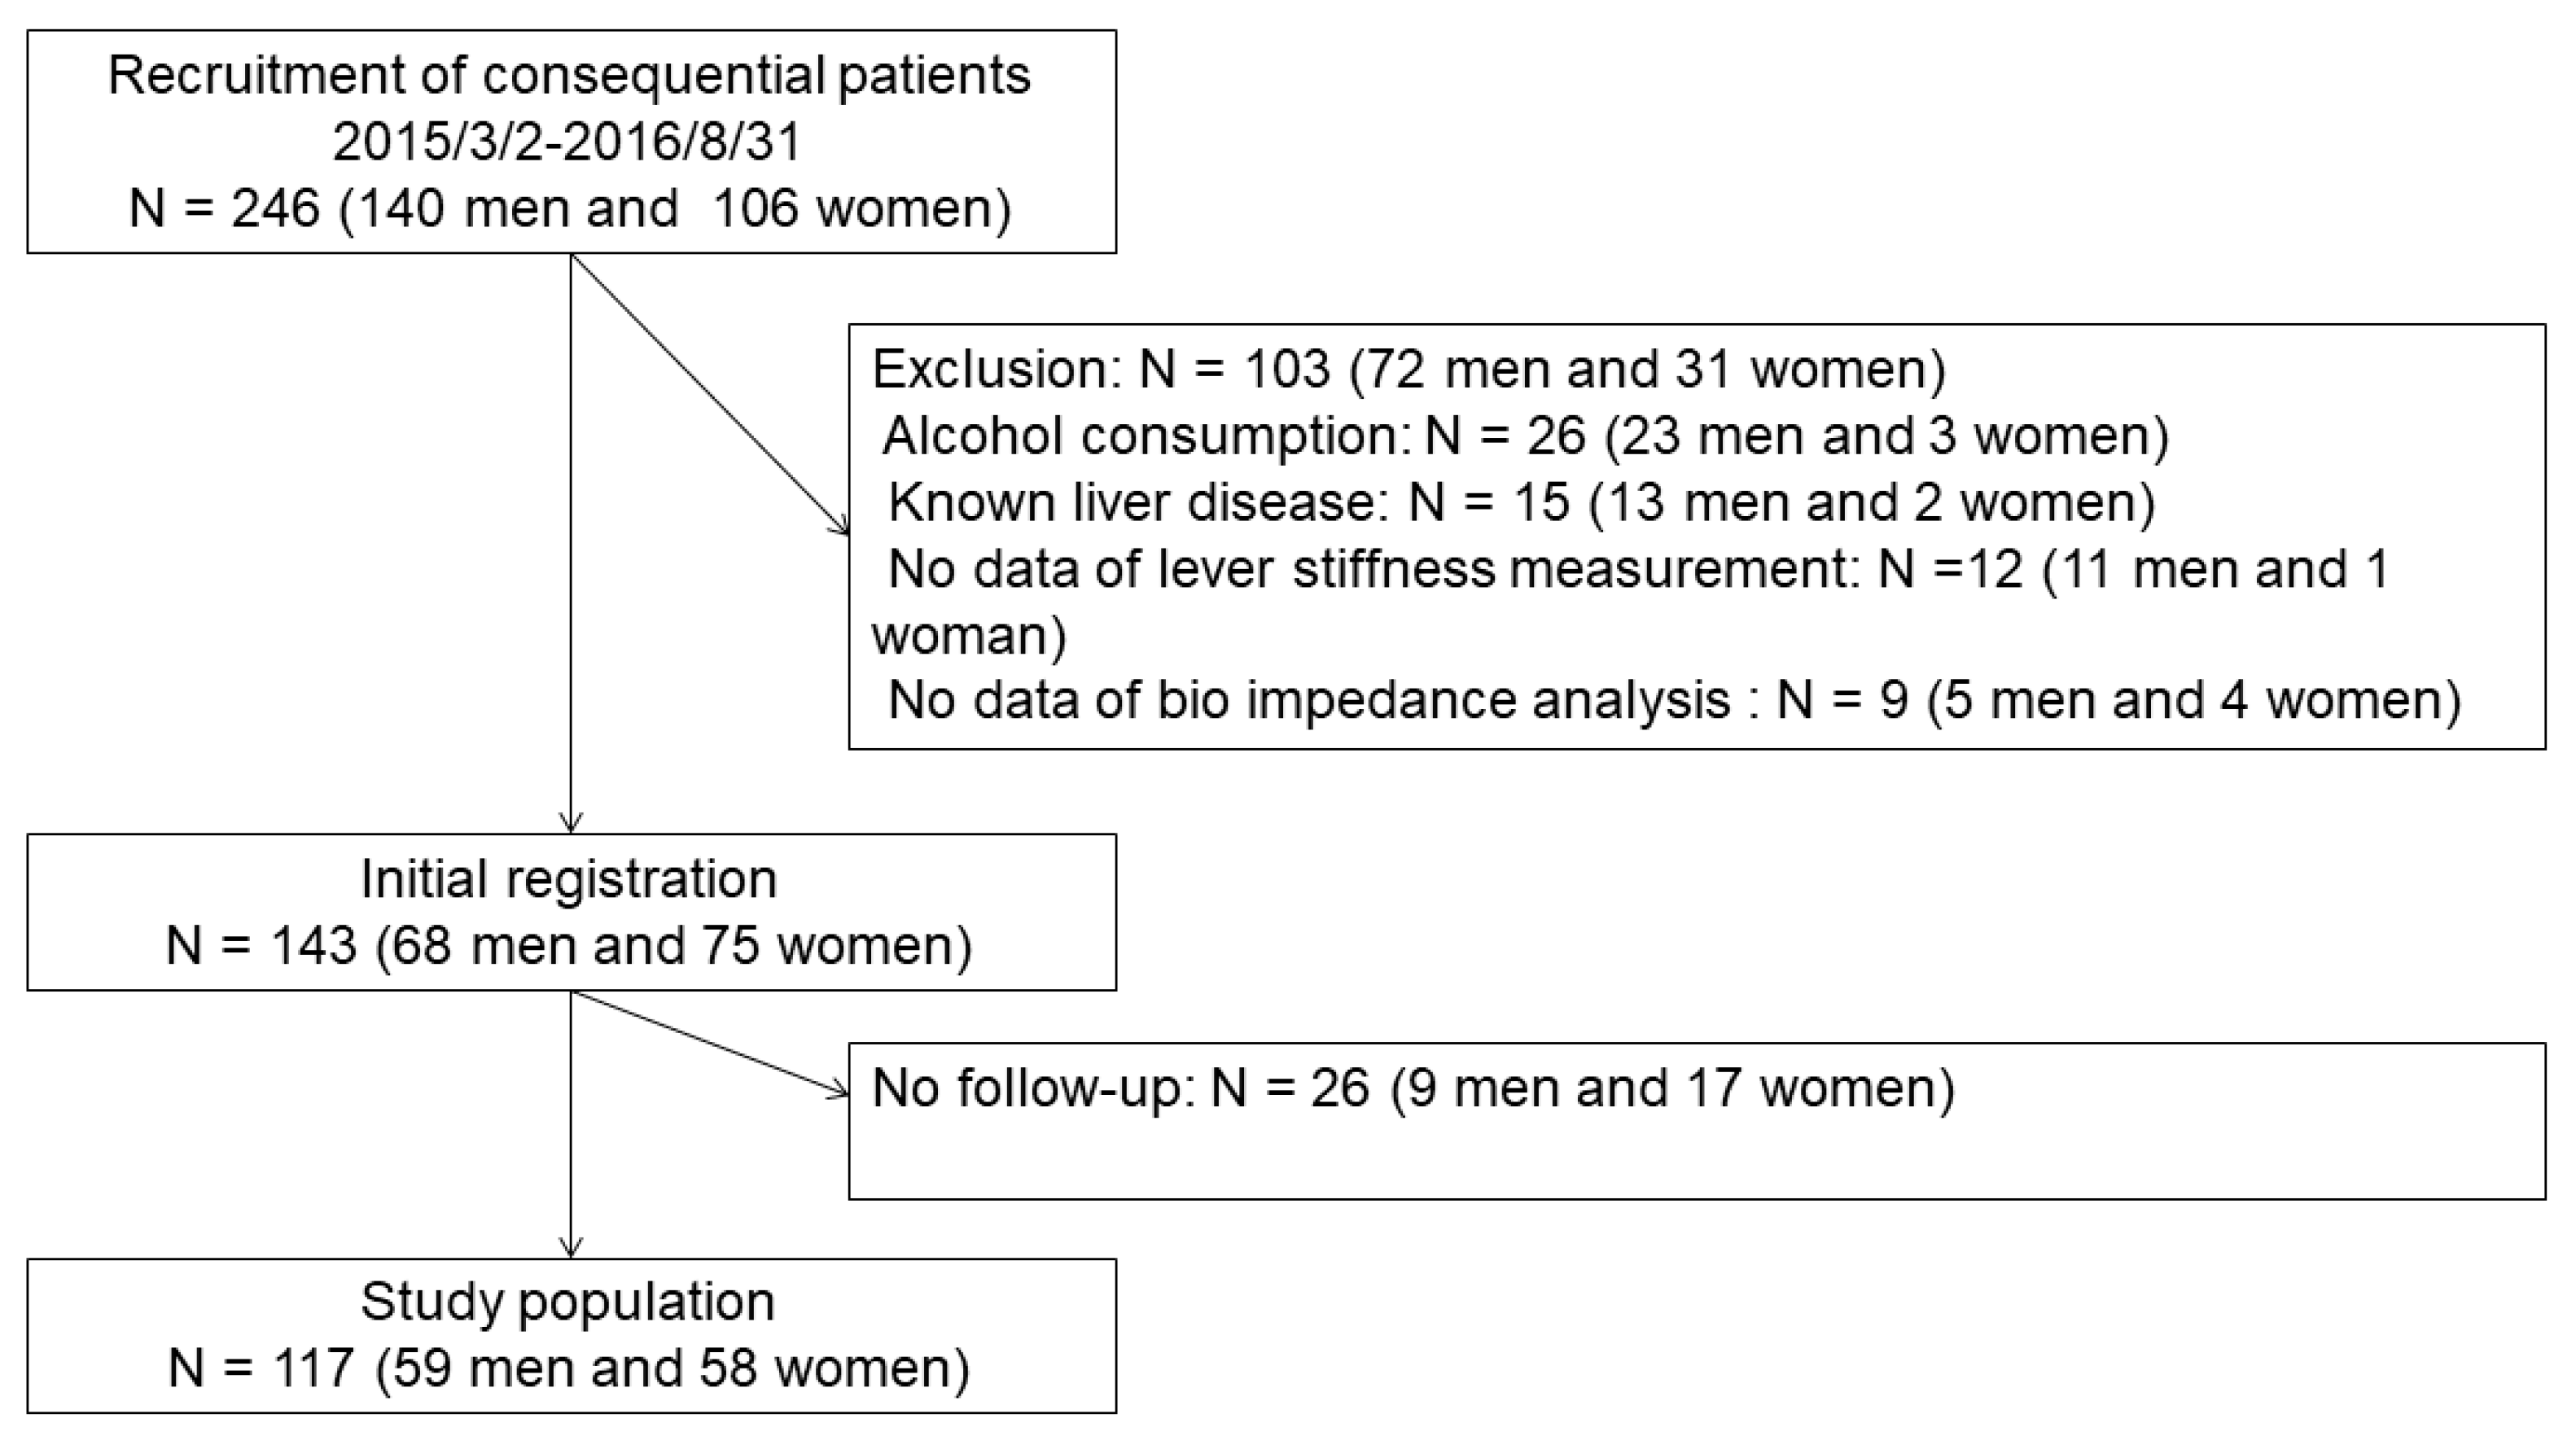
2.1. Study Population and Design
2.2. Sample Size and Periods for the Recruitments
2.3. Definition for NAFLD
2.4. Biochemical Assays
2.5. Measurement of Body Composition
2.6. The Controlled Attenuation Parameter (CAP) and Liver Stiffness Measurement (LSM)
2.7. Statistical Analysis and Missing Values
3. Results
4. Discussion
5. Conclusions
Supplementary Files
Supplementary File 1Author Contributions
Funding
Acknowledgments
Conflicts of Interest
References
- Neuschwander-Tetri, B.A.; Caldwell, S.H. Nonalcoholic steatohepatitis: Summary of an AASLD Single Topic Conference. Hepatology 2003, 37, 1202–1219. [Google Scholar] [CrossRef] [PubMed]
- Angulo, P. Nonalcoholic fatty liver disease. N. Engl. J. Med. 2002, 346, 1221–1231. [Google Scholar] [CrossRef] [PubMed]
- Arrese, M. Nonalcoholic fatty liver disease: Liver disease: An overlooked complication of diabetes mellitus. Nat. Rev. Endocrinol. 2010, 6, 660–661. [Google Scholar] [CrossRef] [PubMed]
- Hashimoto, Y.; Osaka, T.; Fukuda, T.; Tanaka, M.; Yamazaki, M.; Fukui, M. The relationship between hepatic steatosis and skeletal muscle mass index in men with type 2 diabetes. Endocr. J. 2016, 63, 877–884. [Google Scholar] [CrossRef]
- Reid, D.T.; Eksteen, B. Murine models provide insight to the development of non-alcoholic fatty liver disease. Nutr. Res. Rev. 2015, 28, 133–142. [Google Scholar] [CrossRef]
- Fukuda, T.; Hamaguchi, M.; Kojima, T.; Mitsuhashi, K.; Hashimoto, Y.; Ohbora, A.; Kato, T.; Nakamura, N.; Fukui, M. Transient remission of nonalcoholic fatty liver disease decreases the risk of incident type 2 diabetes mellitus in Japanese men. Eur. J. Gastroenterol. Hepatol. 2016, 28, 1443–1449. [Google Scholar] [CrossRef]
- Hamaguchi, M.; Kojima, T.; Takeda, N.; Nakagawa, T.; Taniguchi, H.; Fujii, K.; Omatsu, T.; Nakajima, T.; Sarui, H.; Shimazaki, M.; et al. The metabolic syndrome as a predictor of nonalcoholic fatty liver disease. Ann. Intern. Med. 2005, 143, 722–728. [Google Scholar] [CrossRef]
- Hashimoto, Y.; Fukuda, T.; Oyabu, C.; Tanaka, M.; Asano, M.; Yamazaki, M.; Fukui, M. Impact of low-carbohydrate diet on body composition: Meta-analysis of randomized controlled studies. Obes. Rev. 2016, 17, 499–509. [Google Scholar] [CrossRef]
- Yu, R.; Shi, Q.; Liu, L.; Chen, L. Relationship of sarcopenia with steatohepatitis and advanced liver fibrosis in non-alcoholic fatty liver disease: A meta-analysis. BMC Gastroenterol. 2018, 18, 51. [Google Scholar] [CrossRef]
- Hashimoto, Y.; Hamaguchi, M.; Fukuda, T.; Nakamura, N.; Ohbora, A.; Kojima, T.; Fukui, M. BMI history and risk of incident fatty liver: A population-based large-scale cohort study. Eur. J. Gastroenterol. Hepatol. 2016, 10, 1188–1193. [Google Scholar] [CrossRef]
- Hashimoto, Y.; Kaji, A.; Sakai, R.; Hamaguchi, M.; Okada, H.; Ushigome, E.; Asano, M.; Yamazaki, M.; Fukui, M. Sarcopenia is associated with blood pressure variability in older patients with type 2 diabetes: A cross-sectional study of the KAMOGAWA-DM cohort study. Geriatr. Gerontol. Int. 2018, 18, 1345–1349. [Google Scholar] [CrossRef] [PubMed]
- Kaji, A.; Hashimoto, Y.; Kobayashi, Y.; Sakai, R.; Okamura, T.; Miki, A.; Hamaguchi, M.; Kuwahata, M.; Yamazaki, M.; Fukui, M. Sarcopenia is associated with tongue pressure in older patients with type 2 diabetes: A cross-sectional study of the KAMOGAWA-DM cohort study. Geriatr. Gerontol. Int. 2019, 19, 153–158. [Google Scholar] [CrossRef] [PubMed]
- Osaka, T.; Hashimoto, Y.; Fukuda, T.; Tanaka, M.; Yamazaki, M.; Fukui, M. Relationship between skeletal muscle mass and hepatic fibrosis in patients with type 2 diabetes. Diabetes Metab. 2017, 43, 184–186. [Google Scholar] [CrossRef] [PubMed]
- Peng, T.C.; Wu, L.W.; Chen, W.L.; Liaw, F.Y.; Chang, Y.W.; Kao, T.W. Nonalcoholic fatty liver disease and sarcopenia in a Western population (NHANES III): The importance of sarcopenia definition. Clin. Nutr. 2019, 38, 422–428. [Google Scholar] [CrossRef] [PubMed]
- Tanaka, M.; Okada, H.; Hashimoto, Y.; Kumagai, M.; Nishimura, H.; Oda, Y.; Fukui, M. Relationship between nonalcoholic fatty liver disease and muscle quality as well as quantity evaluated by computed tomography. Liver Int. 2019, 13. [Google Scholar] [CrossRef] [PubMed]
- Hamaguchi, M.; Kojima, T.; Itoh, Y.; Harano, Y.; Fujii, K.; Nakajima, T.; Kato, T.; Takeda, N.; Okuda, J.; Ida, K.; et al. The severity of ultrasonographic findings in nonalcoholic fatty liver disease reflects the metabolic syndrome and visceral fat accumulation. Am. J. Gastroenterol. 2007, 102, 2708–2715. [Google Scholar] [CrossRef]
- Chitturi, S.; Farrell, G.C.; Hashimoto, E.; Saibara, T.; Lau, G.K.K.; Sollano, J.D. Non-alcoholic fatty liver disease in the Asia-Pacific region: Definitions and overview of proposed guidelines. J. Gastroenterol. Hepatol. 2007, 22, 778–787. [Google Scholar] [CrossRef]
- McCullough, A.J. The clinical features, diagnosis and natural history of nonalcoholic fatty liver disease. Clin. Liver Dis. 2004, 8, 521–533. [Google Scholar] [CrossRef]
- Sumida, Y.; Yoneda, M.; Hyogo, H.; Itoh, Y.; Ono, M.; Fujii, H.; Eguchi, Y.; Suzuki, Y.; Aoki, N.; Kanemasa, K.; et al. Validation of the FIB4 index in a Japanese nonalcoholic fatty liver disease population. BMC Gastroenterol. 2012, 12, 2. [Google Scholar] [CrossRef]
- Kim, M.; Shinkai, S.; Murayama, H.; Mori, S. Comparison of segmental multifrequency bioelectrical impedance analysis with dual-energy X-ray absorptiometry for the assessment of body composition in a community-dwelling older population. Geriatr. Gerontol. Int. 2015, 15, 1013–1022. [Google Scholar] [CrossRef]
- Anderson, L.J.; Erceg, D.N.; Schroeder, E.T. Utility of multifrequency bioelectrical impedance compared with dual-energy x-ray absorptiometry for assessment of total and regional body composition varies between men and women. Nutr. Res. 2012, 32, 479–485. [Google Scholar] [CrossRef] [PubMed]
- Chen, L.K.; Liu, L.K.; Woo, J.; Assantachai, P.; Auyeung, T.W.; Bahyah, K.S.; Chou, M.Y.; Chen, L.Y.; Hsu, P.S.; Krairit, O.; et al. Sarcopenia in Asia: Consensus report of the Asian working group for sarcopenia. J. Am. Med. Dir. Assoc. 2014, 15, 95–101. [Google Scholar] [CrossRef] [PubMed]
- Shida, T.; Akiyama, K.; Oh, S.; Sawai, A.; Isobe, T.; Okamoto, Y.; Ishige, K.; Mizokami, Y.; Yamagata, K.; Onizawa, K.; et al. Skeletal muscle mass to visceral fat area ratio is an important determinant affecting hepatic conditions of non-alcoholic fatty liver disease. J. Gastroenterol. 2017, 4, 535–547. [Google Scholar] [CrossRef] [PubMed]
- Machado, M.V.; Cortez-Pinto, H. Non-invasive diagnosis of non-alcoholic fatty liver disease. A critical appraisal. J. Hepatol. 2013, 58, 1007–1019. [Google Scholar] [CrossRef] [PubMed]
- Sasso, M.; Beaugrand, M.; de Ledinghen, V.; Douvin, C.; Marcellin, P.; Poupon, R.; Sandrin, L.; Miette, V. Controlled Attenuation Parameter (CAP): A Novel VCTETM Guided Ultrasonic Attenuation Measurement for the Evaluation of Hepatic Steatosis: Preliminary Study and Validation in a Cohort of Patients with Chronic Liver Disease from Various Causes. Ultrasound Med. Biol. 2010, 36, 1825–1835. [Google Scholar] [CrossRef]
- Saito, H.; Tada, S.; Nakamoto, N.; Kitamura, K.; Horikawa, H.; Kurita, S.; Saito, Y.; Iwai, H.; Ishii, H. Efficacy of non-invasive elastometry on staging of hepatic fibrosis. Hepatol. Res. 2004, 29, 97–103. [Google Scholar] [CrossRef]
- Petta, S.; Ciminnisi, S.; di Marco, V.; Cabibi, D.; Cammà, C.; Licata, A.; Marchesini, G.; Craxì, A. Sarcopenia is associated with severe liver fibrosis in patients with non-alcoholic fatty liver disease. Aliment. Pharmacol. Ther. 2017, 45, 510–518. [Google Scholar] [CrossRef]
- Pasiakos, S.M.; Cao, J.J.; Margolis, L.M.; Sauter, E.R.; Whigham, L.D.; McClung, J.P.; Rood, J.C.; Carbone, J.W.; Combs, G.F., Jr.; Young, A.J. Effects of high-protein diets on fat-free mass and muscle protein synthesis following weight loss: A randomized controlled trial. FASEB J. 2013, 27, 3837–3847. [Google Scholar] [CrossRef]
- Kato, K.I.; Takeshita, Y.; Misu, H.; Zen, Y.; Kaneko, S.; Takamura, T. Liver steatosis is associated with insulin resistance in skeletal muscle rather than in the liver in Japanese patients with non-alcoholic fatty liver disease. J. Diabetes Investig. 2015, 6, 158–163. [Google Scholar] [CrossRef]
- Belizário, J.E.; Fontes-Oliveira, C.C.; Borges, J.P.; Kashiabara, J.A.; Vannier, E. Skeletal muscle wasting and renewal: A pivotal role of myokine IL-6. Springerplus 2016, 5, 619. [Google Scholar] [CrossRef]
- Yasukawa, H.; Ohishi, M.; Mori, H.; Murakami, M.; Chinen, T.; Aki, D.; Hanada, T.; Takeda, K.; Akira, S.; Hoshijima, M.; et al. IL-6 induces an anti-inflammatory response in the absence of SOCS3 in macrophages. Nat. Immunol. 2003, 4, 551–556. [Google Scholar] [CrossRef] [PubMed]
- Hammerich, L.; Tacke, F. Interleukins in chronic liver disease: Lessons learned from experimental mouse models. Clin. Exp. Gastroenterol. 2014, 7, 297–306. [Google Scholar] [PubMed]
- Bouchi, R.; Nakano, Y.; Fukuda, T.; Takeuchi, T.; Murakami, M.; Minami, I.; Izumiyama, H.; Hashimoto, K.; Yoshimoto, T.; Ogawa, Y. Reduction of visceral fat by liraglutide is associated with ameliorations of hepatic steatosis, albuminuria, and micro-inflammation in type 2 diabetic patients with insulin treatment: A randomized control trial. Endocr. J. 2016, 64, 269–281. [Google Scholar] [CrossRef] [PubMed]
- Houghton, D.; Thoma, C.; Hallsworth, K.; Cassidy, S.; Hardy, T.; Burt, A.D.; Tiniakos, D.; Hollingsworth, K.G.; Taylor, R.; Day, C.P.; et al. Exercise reduces liver lipids and visceral adiposity in patients with nonalcoholic steatohepatitis in a randomized controlled Trial. Clin. Gastroenterol. Hepatol. 2017, 15, 96–102. [Google Scholar] [CrossRef] [PubMed]
- WHO Expert Consultation. Appropriate body-mass index for Asian populations and its implications for policy and intervention strategies. Lancet 2004, 363, 157–163. [Google Scholar] [CrossRef]
- Boström, P.; Wu, J.; Jedrychowski, M.P.; Korde, A.; Ye, L.; Lo, J.C.; Rasbach, K.A.; Boström, E.A.; Choi, J.H.; Long, J.Z.; et al. A PGC1-α-dependent myokine that drives brown-fat-like development of white fat and thermogenesis. Nature 2012, 481, 463–468. [Google Scholar] [CrossRef]
- Handy, J.A.; Saxena, N.K.; Fu, P.; Lin, S.; Mells, J.E.; Gupta, N.A.; Anania, F.A. Adiponectin activation of AMPK disrupts leptin-mediated hepatic fibrosis via suppressors of cytokine signaling (SOCS-3). J. Cell. Biochem. 2010, 110, 1195–1207. [Google Scholar] [CrossRef]
- Wong, V.W.S.; Chan, W.K.; Chitturi, S.; Chawla, Y.; Dan, Y.Y.; Duseja, A.; Fan, J.; Goh, K.L.; Hamaguchi, M.; Hashimoto, E.; et al. Asia-Pacific Working Party on Non-alcoholic Fatty Liver Disease guidelines 2017-Part 1: Definition, risk factors and assessment. J. Gastroenterol. Hepatol. 2018, 33, 70–85. [Google Scholar] [CrossRef]
- Chitturi, S.; Wong, V.W.S.; Chan, W.K.; Wong, G.L.H.; Wong, S.K.; Sollano, J.; Ni, Y.H.; Liu, C.J.; Lin, Y.C.; Lesmana, L.A.; et al. The Asia-Pacific Working Party on Non-alcoholic Fatty Liver Disease guidelines 2017-Part 2: Management and special groups. J. Gastroenterol. Hepatol. 2018, 33, 86–98. [Google Scholar] [CrossRef]
- Sumida, Y.; Yoneda, M. Current and future pharmacological therapies for NAFLD/NASH. J. Gastroenterol. 2018, 53, 362–376. [Google Scholar] [CrossRef]
- de Lédinghen, V.; Vergniol, J.; Chan, H.L.; Hiriart, J.B.; Chan, A.W.; Chermak, F.; Choi, P.C.; Foucher, J.; Chan, C.K.; Merrouche, W.; et al. Controlled attenuation parameter for the diagnosis of steatosis in non-alcoholic fatty liver disease. J. Gastroenterol. Hepatol. 2016, 31, 848–855. [Google Scholar] [CrossRef] [PubMed]
- Obara, N.; Ueno, Y.; Fukushima, K.; Nakagome, Y.; Kakazu, E.; Kimura, O.; Wakui, Y.; Kido, O.; Ninomiya, M.; Kogure, T.; et al. Transient elastography for measurement of liver stiffness measurement can detect early significant hepatic fibrosis in Japanese patients with viral and nonviral liver diseases. J. Gastroentero. 2008, 43, 720–728. [Google Scholar] [CrossRef] [PubMed]


| Baseline | After One Year | ||||||
|---|---|---|---|---|---|---|---|
| All | Men | Women | All | Men | Women | p | |
| N | 117 | 59 | 58 | ||||
| Age, year | 63.5 (12.2) | 64.1 (11.5) | 63.0 (12.9) | ||||
| Duration of diabetes, years | 12.0 (9.6) | 12.5 (9.5) | 11.4 (9.7) | ||||
| Regular exercise | 48 (41.0) | 25 (42.4) | 23 (39.7) | ||||
| Smoking Status | |||||||
| Never smoker | 56 (47.9) | 15 (25.4) | 41 (70.7) | ||||
| Former smoker | 46 (39.3) | 33 (55.9) | 13 (22.4) | ||||
| Current smoker | 15 (12.8) | 11 (18.6) | 4 (6.9) | ||||
| Body mass index, kg/m2 | 25.4 (4.4) | 25.7 (4.1) | 25.0 (4.7) | 25.1 (4.2) | 25.3 (3.8) | 24.8 (4.6) | <0.001 |
| Appendicular skeletal muscle mass, kg | 19.0 (4.8) | 22.0 (3.8) | 15.8 (3.4) | 18.7 (4.7) | 21.8 (3.7) | 15.5 (3.4) | <0.001 |
| Skeletal muscle index, kg/m2 | 7.1 (1.2) | 7.8 (1.0) | 6.5 (0.9) | 7.0 (1.2) | 7.7 (0.9) | 6.4 (0.9) | <0.001 |
| Body fat mass, kg | 21.2 (8.2) | 20.7 (7.4) | 21.8 (8.9) | 20.8 (8.0) | 20.1 (6.9) | 21.5 (8.9) | 0.019 |
| Body fat percentage, % | 31.1 (8.2) | 28.0 (6.5) | 34.4 (8.5) | 31.0 (8.0) | 27.7 (6.2) | 34.4 (8.2) | 0.440 |
| Fat-to-muscle ratio | 0.9 (0.3) | 0.7 (0.2) | 1.0 (0.4) | 0.9 (0.3) | 0.7 (0.2) | 1.0 (0.4) | 0.478 |
| Systolic blood pressure, mmHg | 134.0 (19.8) | 132.2 (18.7) | 135.8 (20.8) | 135.9 (17.0) | 134.6 (15.6) | 137.1 (18.4) | 0.305 |
| Diastolic blood pressure, mmHg | 79.1 (11.6) | 80.5 (11.1) | 77.6 (12.1) | 78.4 (10.3) | 79.7 (9.8) | 77.1 (10.7) | 0.515 |
| Platelet count, × 109/L | 218.6 (53.9) | 209.0 (43.9) | 228.5 (61.3) | 226.8 (57.0) | 220.8 (50.3) | 232.9 (63.0) | 0.010 |
| Hemoglobin A1c, % | 7.5 (1.1) | 7.7 (1.2) | 7.3 (1.0) | 7.2 (1.2) | 7.4 (1.2) | 7.0 (1.0) | <0.001 |
| Hemoglobin A1c, mmol/L | 58.4 (12.4) | 60.8 (13.4) | 55.9 (11.0) | 54.9 (12.6) | 57.0 (13.4) | 52.8 (11.4) | <0.001 |
| Aspartate aminotransferase, IU/L | 29.8 (18.6) | 32.2 (22.6) | 27.3 (13.2) | 27.7 (15.5) | 29.8 (16.1) | 25.7 (14.8) | 0.193 |
| Alanine aminotransferase, IU/L | 34.9 (30.0) | 39.5 (36.6) | 30.2 (20.6) | 31.2 (24.9) | 35.3 (29.0) | 26.9 (19.2) | 0.079 |
| Gamma-glutamyl transferase, IU/L | 47.1 (46.4) | 56.6 (54.4) | 37.4 (34.4) | 42.9 (50.6) | 52.7 (62.8) | 32.9 (31.6) | 0.113 |
| Ferritin, ng/mL | 126.1 (116.6) | 154.6 (137.2) | 97.2 (82.6) | 114.6 (108.3) | 143.2 (131.6) | 85.5 (67.4) | 0.120 |
| Type 4 collagen 7 S, ng/mL | 4.8 (1.0) | 4.9 (1.2) | 4.8 (0.8) | 5.0 (1.2) | 5.0 (1.3) | 5.0 (1.1) | 0.182 |
| Hyaluronic acid, ng/mL | 85.0 (134.2) | 87.9 (173.8) | 82.1 (76.9) | 75.1 (71.5) | 72.1 (76.1) | 78.1 (66.9) | 0.337 |
| Fib-4 index | 1.67 (0.84) | 1.78 (0.95) | 1.55 (0.71) | 1.58 (0.74) | 1.65 (0.8) | 1.5 (0.67) | 0.053 |
| Controlled attenuation parameter, dB/m | 273.4 (53.5) | 279.1 (50.9) | 267.6 (55.8) | 269.7 (70.8) | 273.7 (71.4) | 265.6 (70.6) | 0.510 |
| Liver stiffness measurement, kPa | 6.3 (3.4) | 7.0 (4.2) | 5.5 (2.1) | 5.6 (2.5) | 5.8 (3.0) | 4.8 (1.7) | 0.040 |
| Extensive liver stiffness | 27 (23.1) | 17 (28.8) | 10 (17.2) | 17 (14.5) | 12 (20.3) | 5 (8.6) | <0.001 |
| Sulfonylurea | 42 (35.9) | 23 (39.0) | 19 (32.8) | 35 (30.0) | 19 (32.2) | 16 (27.6) | 0.034 |
| Dipeptidyl peptidase-4 inhibitors | 34 (29.1) | 22 (37.3) | 12 (20.7) | 38 (32.4) | 20 (33.9) | 18 (31.0) | 0.396 |
| Glinides | 8 (6.8) | 3 (5.1) | 5 (8.6) | 7 (6.0) | 1 (1.7) | 6 (10.3) | 0.657 |
| Metformin | 54 (46.2) | 29 (49.2) | 25 (43.1) | 60 (51.3) | 34 (57.6) | 26 (44.8) | 0.033 |
| Thiazolidine | 5 (4.3) | 3 (5.1) | 2 (3.4) | 3 (2.6) | 2 (3.4) | 1 (1.7) | 0.158 |
| α-glucosidase inhibitors | 14 (12.0) | 8 (13.6) | 6 (10.3) | 9 (7.7) | 7 (11.9) | 2 (3.4) | 0.096 |
| Sodium-glucose cotransporter-2 inhibitors | 2 (1.7) | 2 (3.4) | 0 (0) | 25 (21.4) | 10 (16.9) | 15 (25.9) | <0.001 |
| Insulin | 27 (23.1) | 17 (28.8) | 10 (17.2) | 25 (21.4) | 17 (28.8) | 8 (13.8) | 0.319 |
| Glucagon-like peptide-1 | 5 (4.3) | 1 (1.7) | 4 (6.9) | 30 (25.6) | 16 (27.1) | 14 (24.1) | <0.001 |
| Controlled Attenuation Parameter | Liver Stiffness Measurement | |||
|---|---|---|---|---|
| r | p | r | p | |
| Age | −0.39 | <0.001 | −0.14 | 0.135 |
| Body mass index | 0.56 | <0.001 | 0.39 | <0.001 |
| Appendicular skeletal muscle mass | 0.31 | <0.001 | 0.18 | 0.055 |
| Skeletal muscle index | 0.35 | <0.001 | 0.24 | 0.008 |
| Body fat percentage | 0.41 | <0.001 | 0.24 | 0.01 |
| Fat-to-muscle ratio | 0.37 | <0.001 | 0.22 | 0.018 |
| Hemoglobin A1c | 0.29 | <0.001 | 0.14 | 0.137 |
| Aspartate aminotransferase | 0.28 | 0.003 | 0.54 | <0.001 |
| Alanine aminotransferase | 0.48 | <0.001 | 0.52 | <0.001 |
| Gamma-glutamyl transferase | 0.32 | <0.001 | 0.47 | <0.001 |
| Fib-4 index | −0.33 | <0.001 | 0.11 | 0.233 |
| Rate of Change in Controlled Attenuation Parameter | ||||
|---|---|---|---|---|
| β | p | β | p | |
| Age, year | −0.10 | 0.383 | −0.14 | 0.215 |
| Men | 0.07 | 0.472 | 0.07 | 0.440 |
| Smoking | −0.12 | 0.181 | −0.13 | 0.160 |
| Exercise | 0.01 | 0.890 | 0.05 | 0.616 |
| Duration of diabetes, year | 0.03 | 0.795 | 0.0004 | 0.997 |
| Hemoglobin A1c, % | 0.05 | 0.584 | 0.10 | 0.285 |
| Body mass index, kg/m2 | 0.26 | 0.021 | 0.19 | 0.080 |
| Sodium glucose cotransporter 2 inhibitor | −0.09 | 0.422 | −0.11 | 0.289 |
| Glucagon-like peptide-1 | −0.03 | 0.709 | −0.05 | 0.573 |
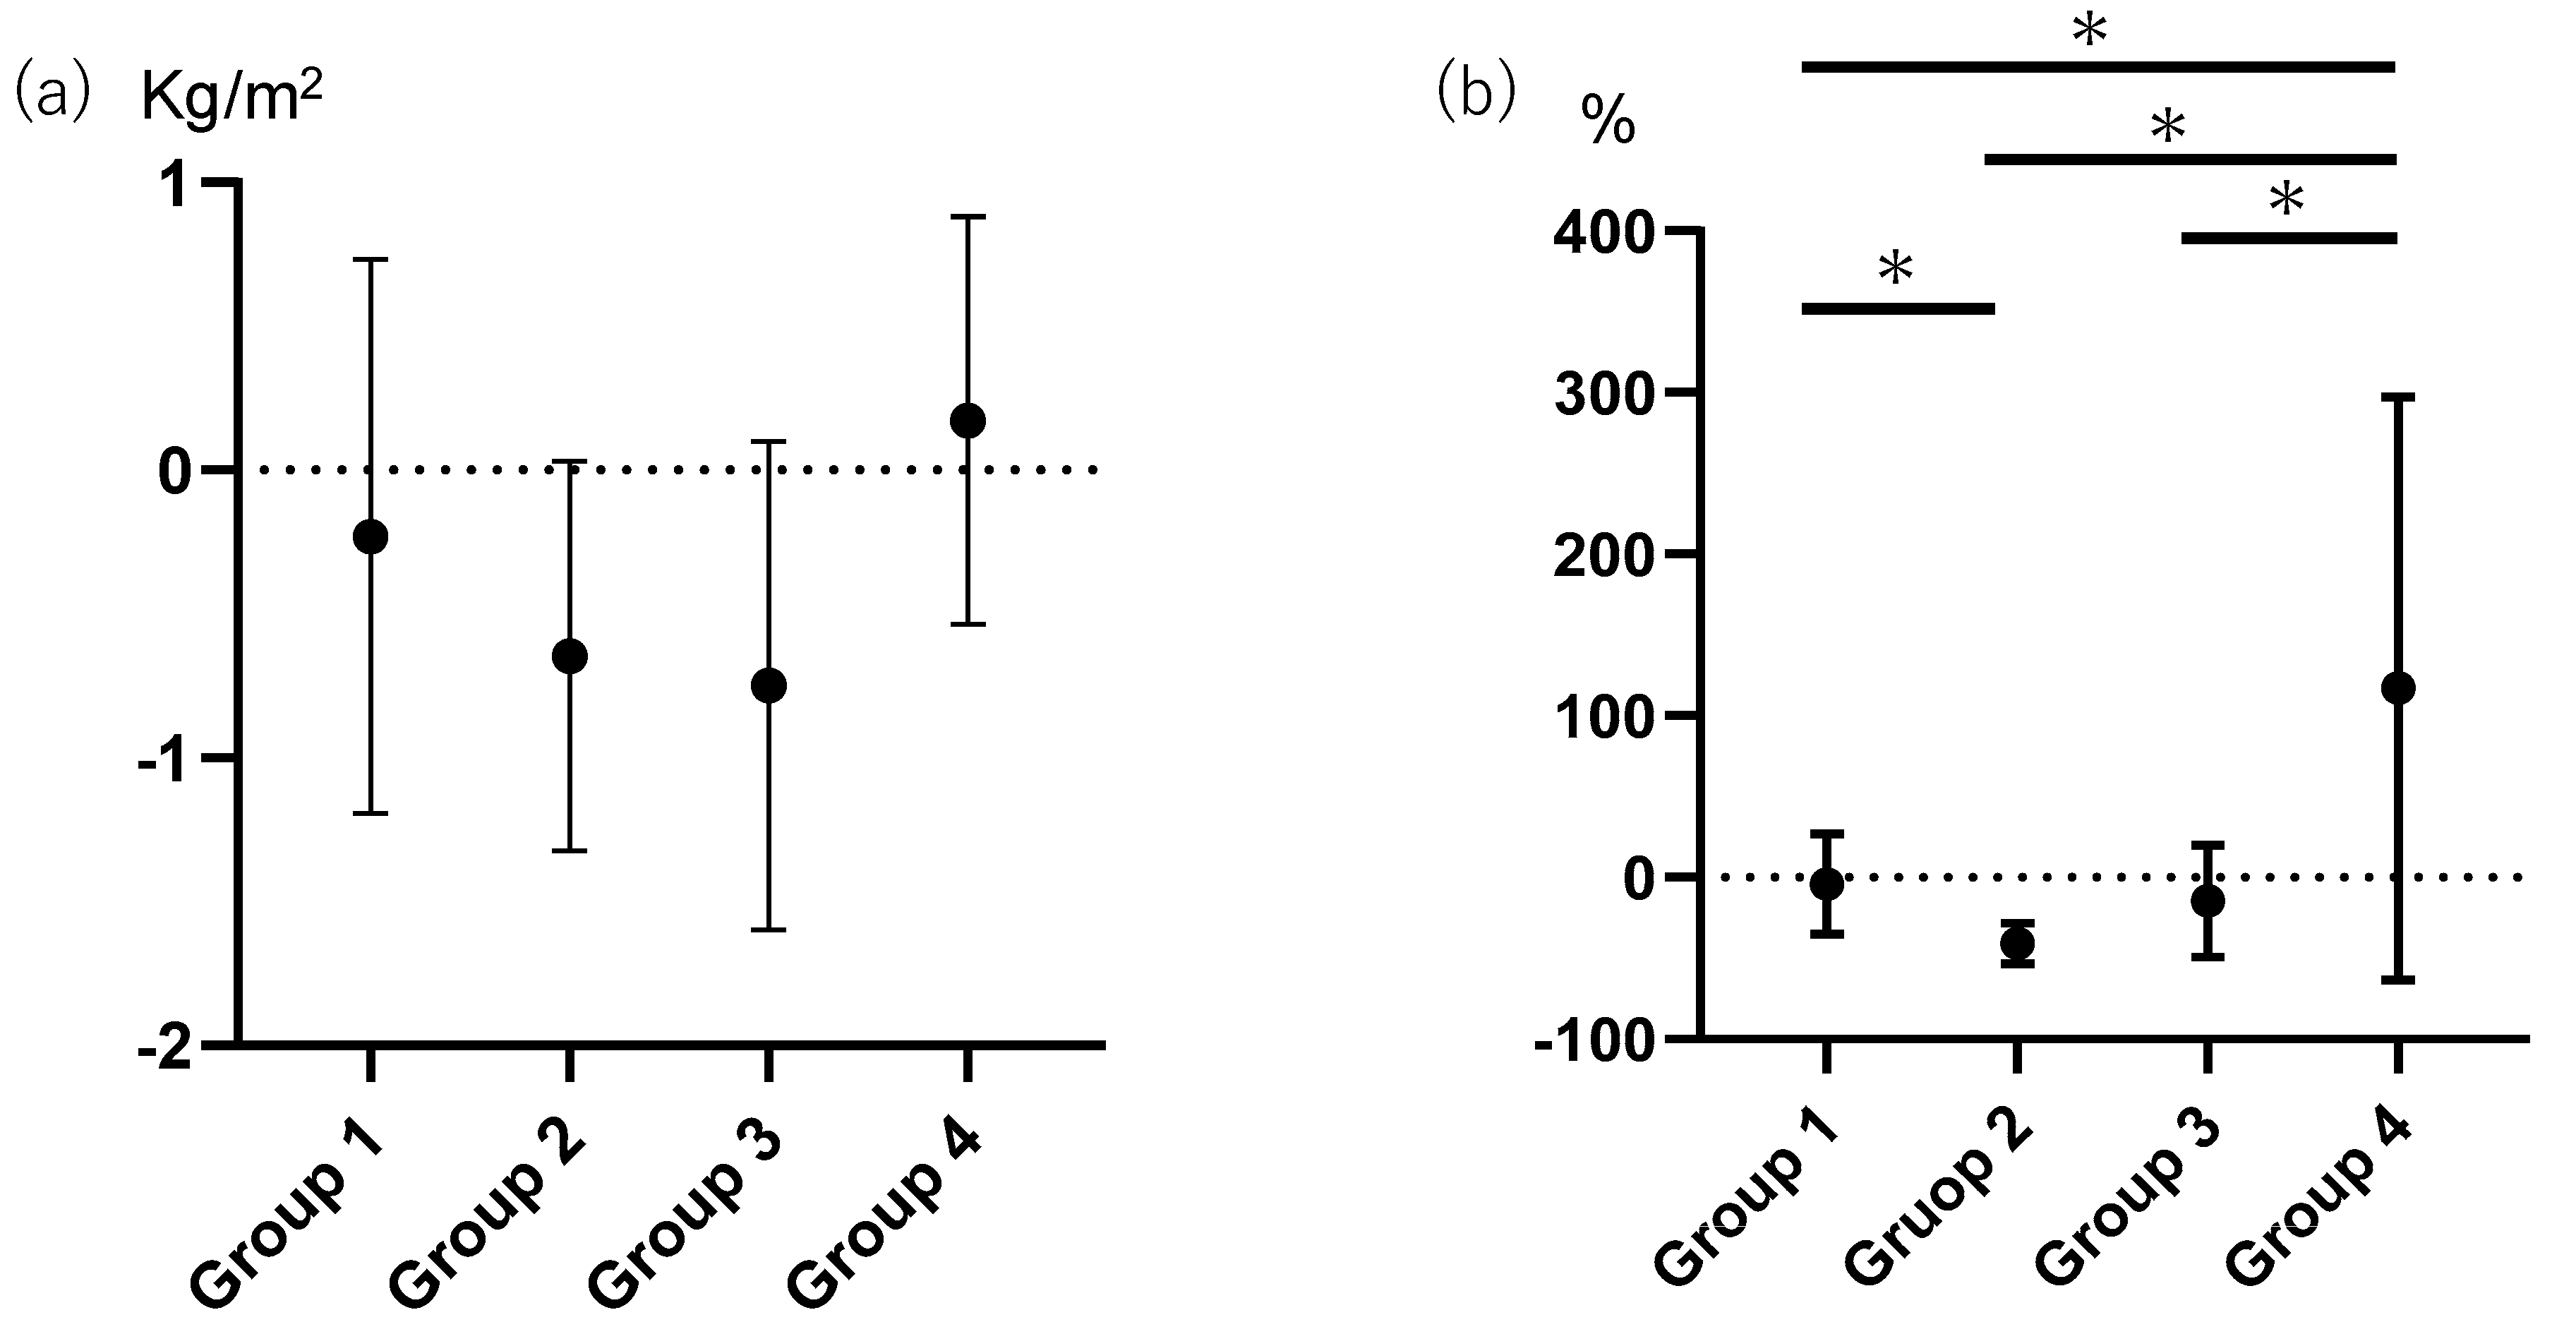
| Change in body mass index, kg/m2 | 0.38 | <0.001 | − | − |
| Change in fat-to-muscle ratio, Δ1 incremental | − | − | 0.38 | <0.001 |
| Rate of Change in Liver Stiffness Measurement | ||||
| β | p | β | p | |
| Age, year | 0.02 | 0.834 | 0.02 | 0.877 |
| Men | 0.08 | 0.451 | 0.07 | 0.459 |
| Smoking | −0.06 | 0.527 | −0.07 | 0.473 |
| Exercise | 0.07 | 0.485 | 0.09 | 0.376 |
| Duration of diabetes, year | 0.15 | 0.179 | 0.14 | 0.204 |
| Hemoglobin A1c, % | −0.15 | 0.153 | −0.13 | 0.204 |
| Body mass index, kg/m2 | 0.04 | 0.763 | 0.01 | 0.900 |
| Sodium glucose cotransporter 2 inhibitor | −0.05 | 0.655 | −0.06 | 0.608 |
| Glucagon-like peptide-1 | −0.08 | 0.439 | −0.08 | 0.409 |
| Change in body mass index, kg/m2 | 0.15 | 0.123 | − | − |
| Change in fat-to-muscle ratio, Δ1 incremental | − | − | 0.21 | 0.026 |
© 2019 by the authors. Licensee MDPI, Basel, Switzerland. This article is an open access article distributed under the terms and conditions of the Creative Commons Attribution (CC BY) license (http://creativecommons.org/licenses/by/4.0/).
Share and Cite
Osaka, T.; Hashimoto, Y.; Okamura, T.; Fukuda, T.; Yamazaki, M.; Hamaguchi, M.; Fukui, M. Reduction of Fat to Muscle Mass Ratio Is Associated with Improvement of Liver Stiffness in Diabetic Patients with Non-Alcoholic Fatty Liver Disease. J. Clin. Med. 2019, 8, 2175. https://doi.org/10.3390/jcm8122175
Osaka T, Hashimoto Y, Okamura T, Fukuda T, Yamazaki M, Hamaguchi M, Fukui M. Reduction of Fat to Muscle Mass Ratio Is Associated with Improvement of Liver Stiffness in Diabetic Patients with Non-Alcoholic Fatty Liver Disease. Journal of Clinical Medicine. 2019; 8(12):2175. https://doi.org/10.3390/jcm8122175
Chicago/Turabian StyleOsaka, Takafumi, Yoshitaka Hashimoto, Takuro Okamura, Takuya Fukuda, Masahiro Yamazaki, Masahide Hamaguchi, and Michiaki Fukui. 2019. "Reduction of Fat to Muscle Mass Ratio Is Associated with Improvement of Liver Stiffness in Diabetic Patients with Non-Alcoholic Fatty Liver Disease" Journal of Clinical Medicine 8, no. 12: 2175. https://doi.org/10.3390/jcm8122175
APA StyleOsaka, T., Hashimoto, Y., Okamura, T., Fukuda, T., Yamazaki, M., Hamaguchi, M., & Fukui, M. (2019). Reduction of Fat to Muscle Mass Ratio Is Associated with Improvement of Liver Stiffness in Diabetic Patients with Non-Alcoholic Fatty Liver Disease. Journal of Clinical Medicine, 8(12), 2175. https://doi.org/10.3390/jcm8122175