Echocardiographic Pulmonary to Left Atrial Ratio (ePLAR): A Comparison Study between Ironman Athletes, Age Matched Controls and A General Community Cohort


Abstract
1. Introduction
2. Methods
2.1. Subject Selection and Exercise Protocols
2.2. Echocardiographic Methods
2.3. Statistical Methodology
3. Results
3.1. Resting Echo Parameters
3.2. Exercise Performance
3.3. Cardiac Output Response to Exercise
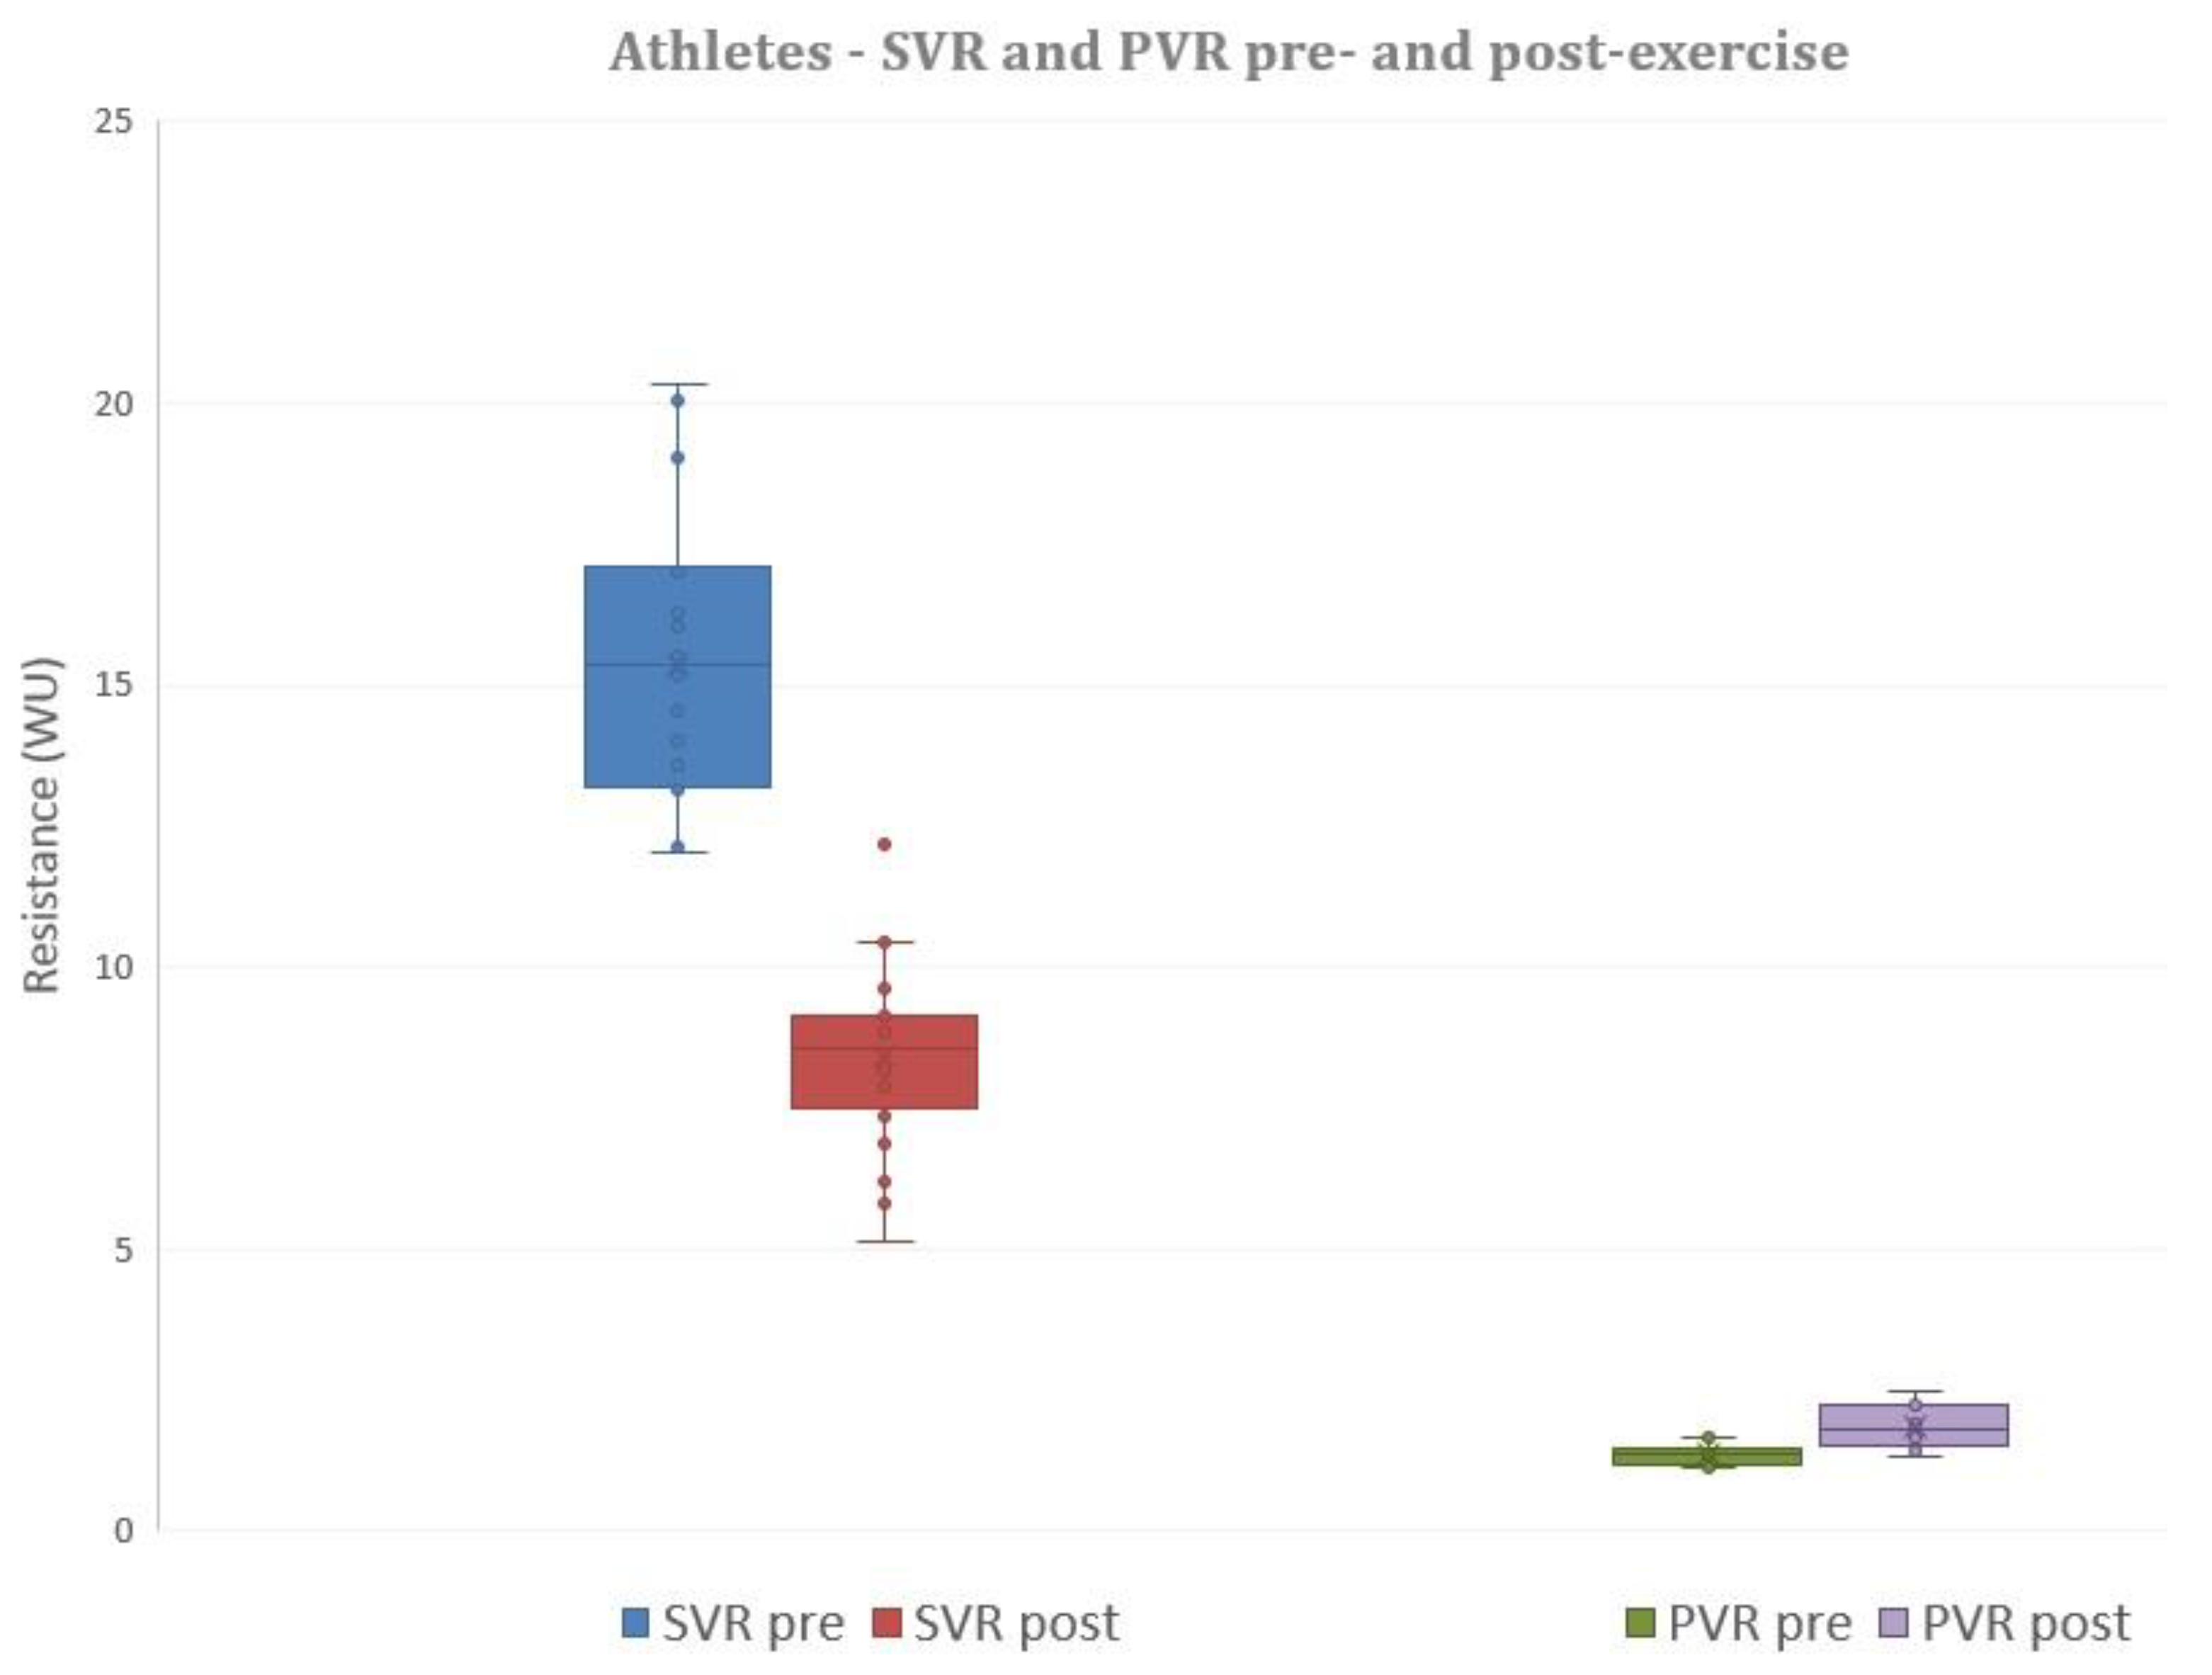
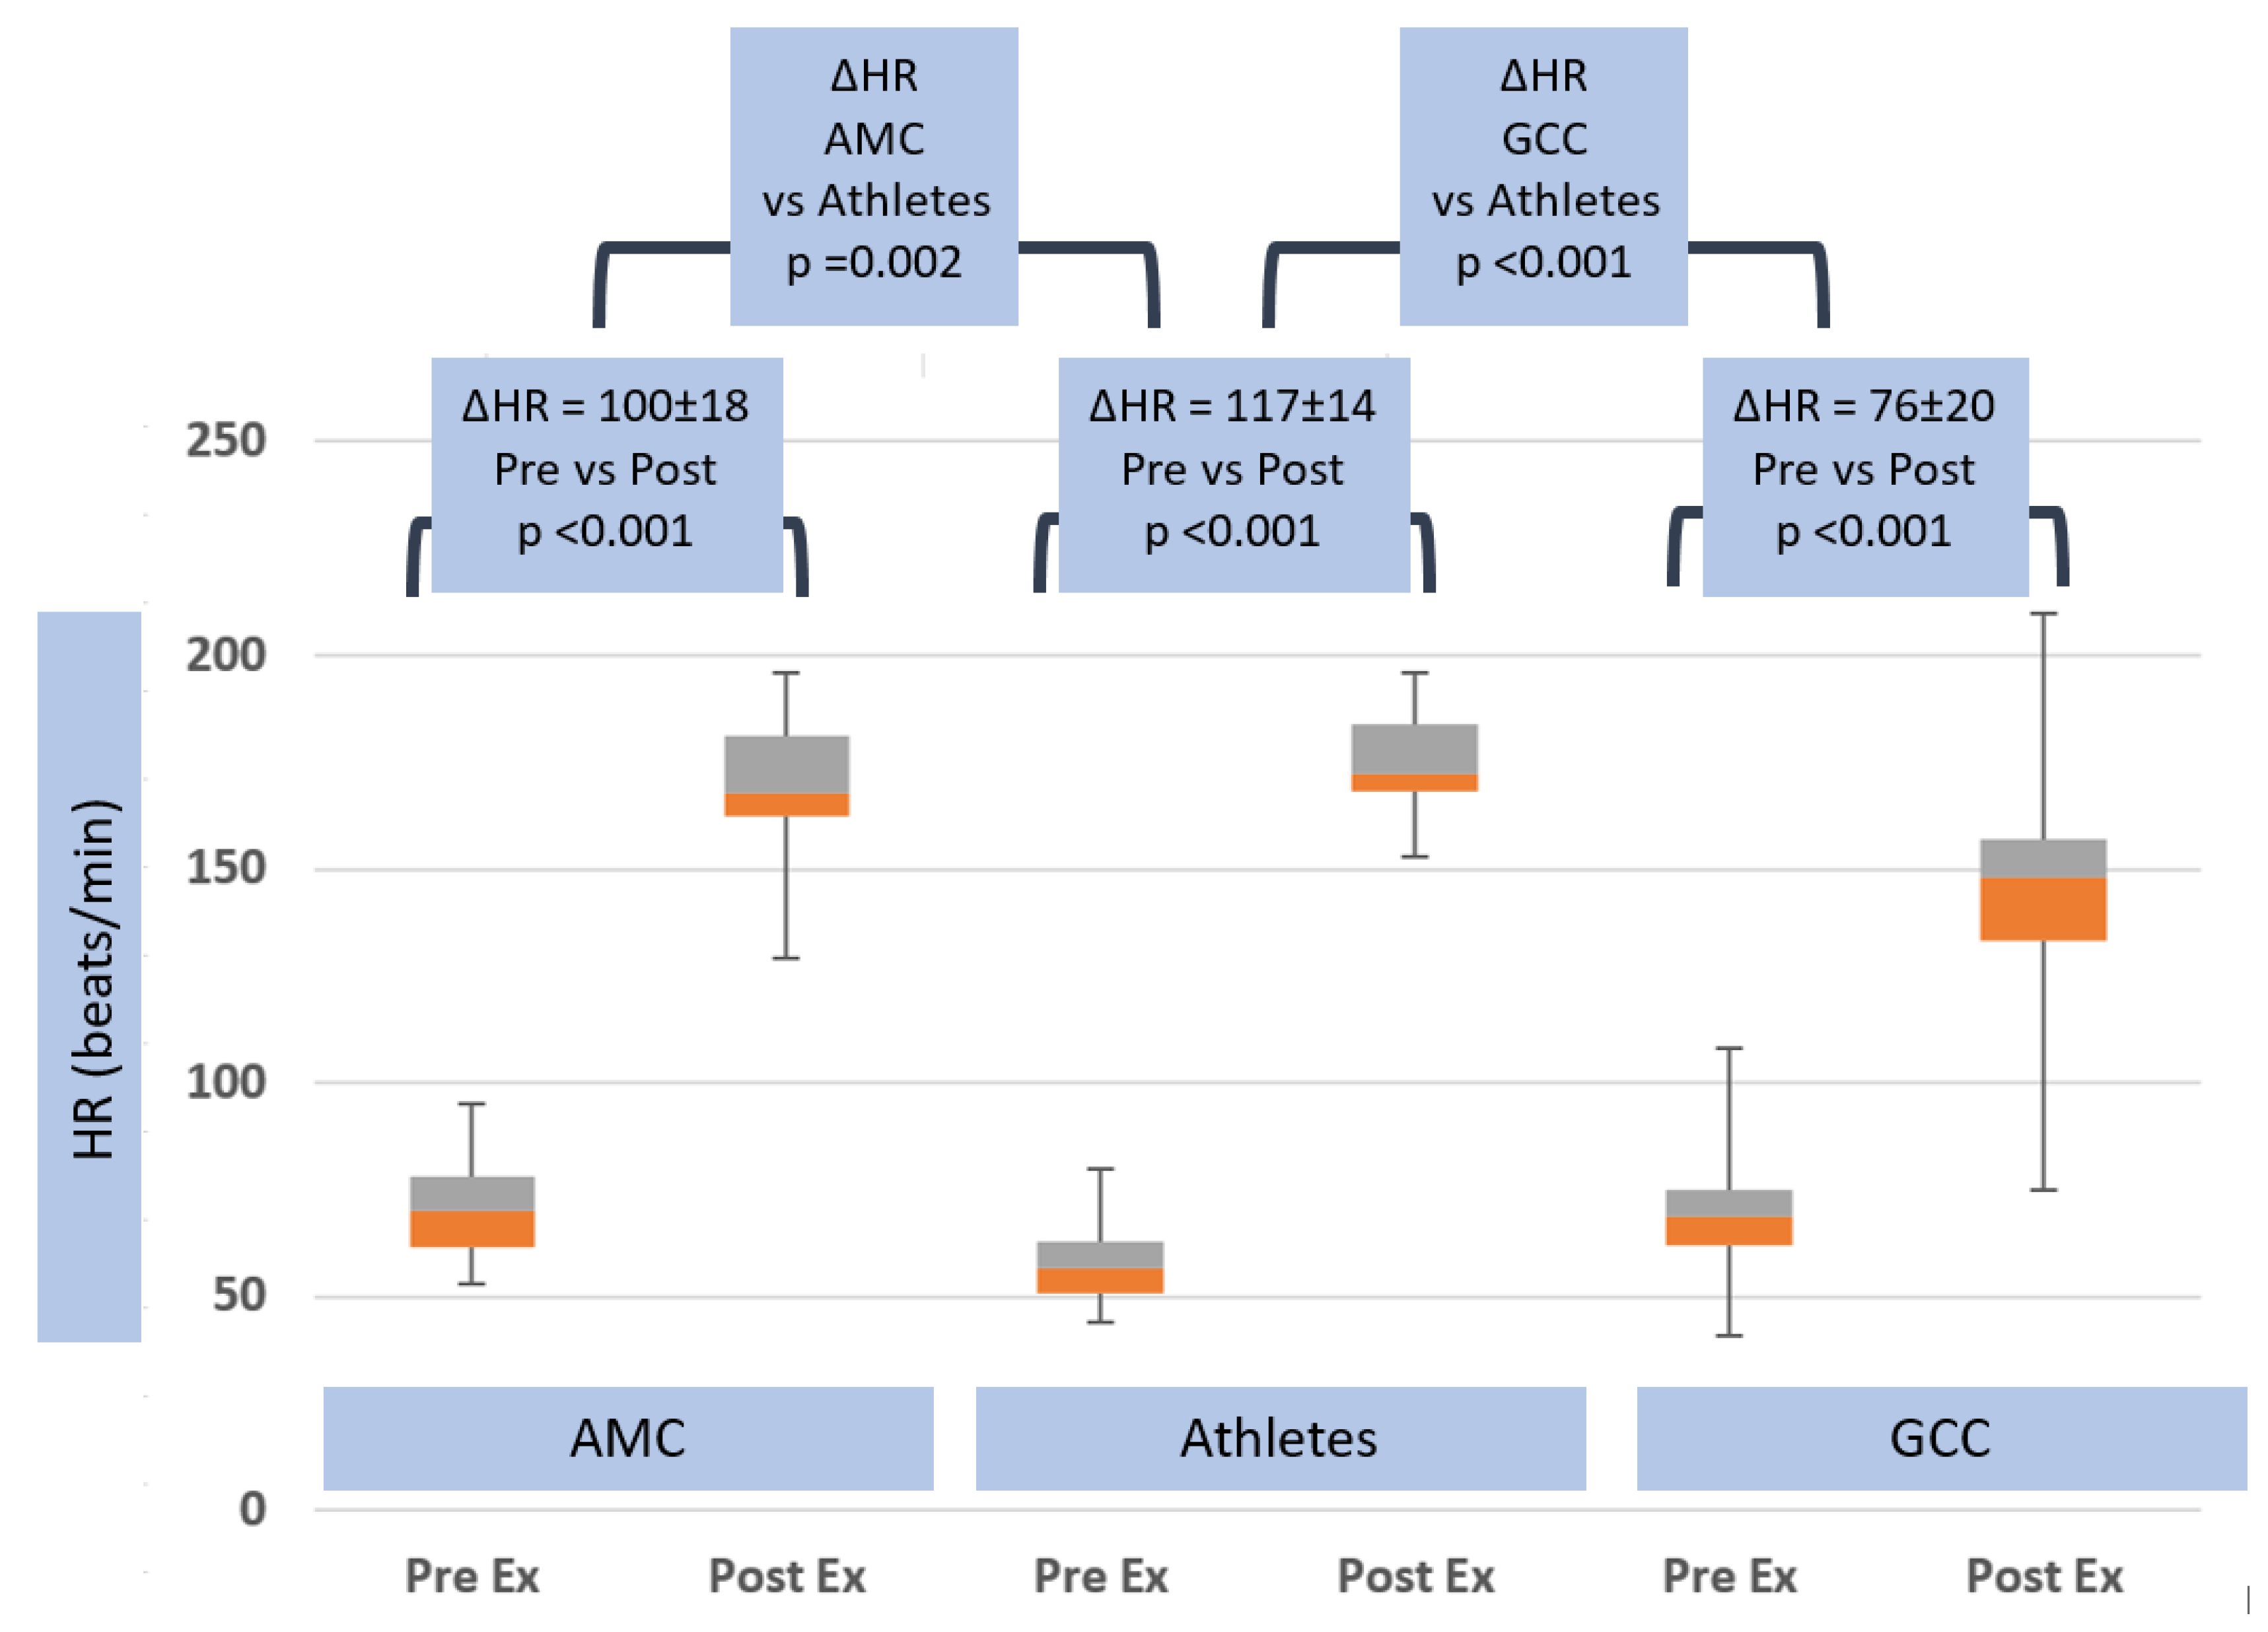
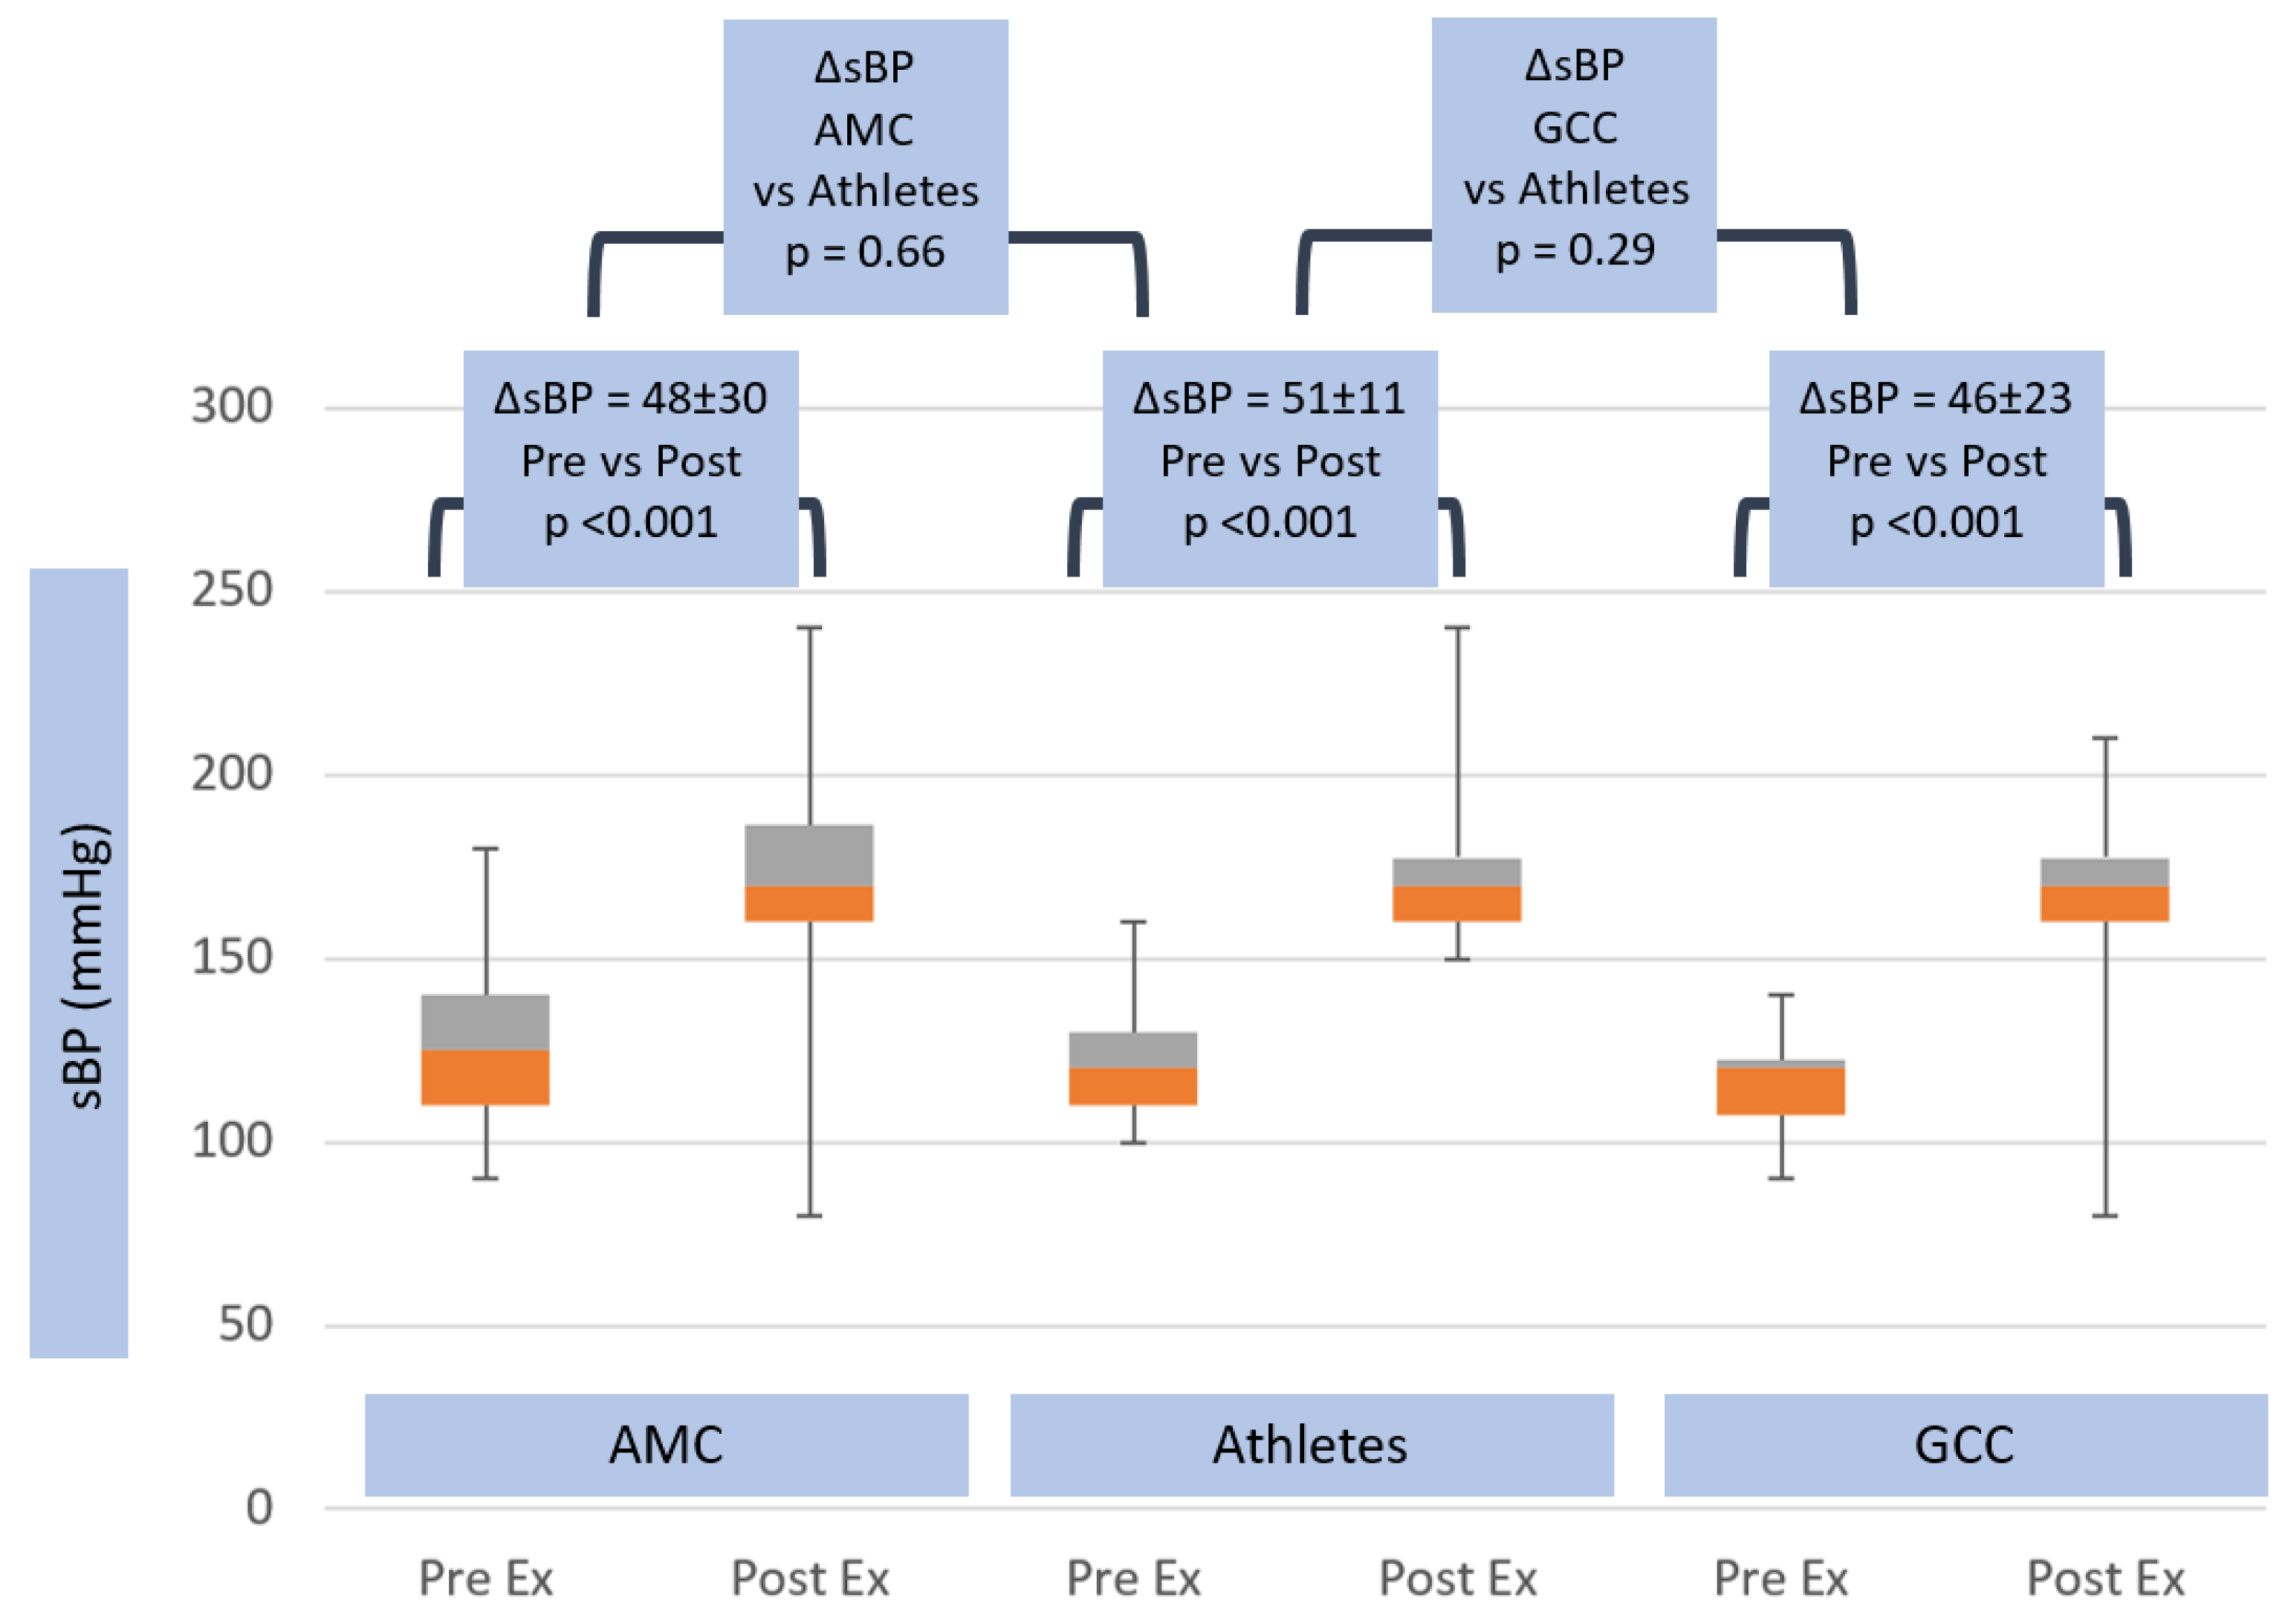
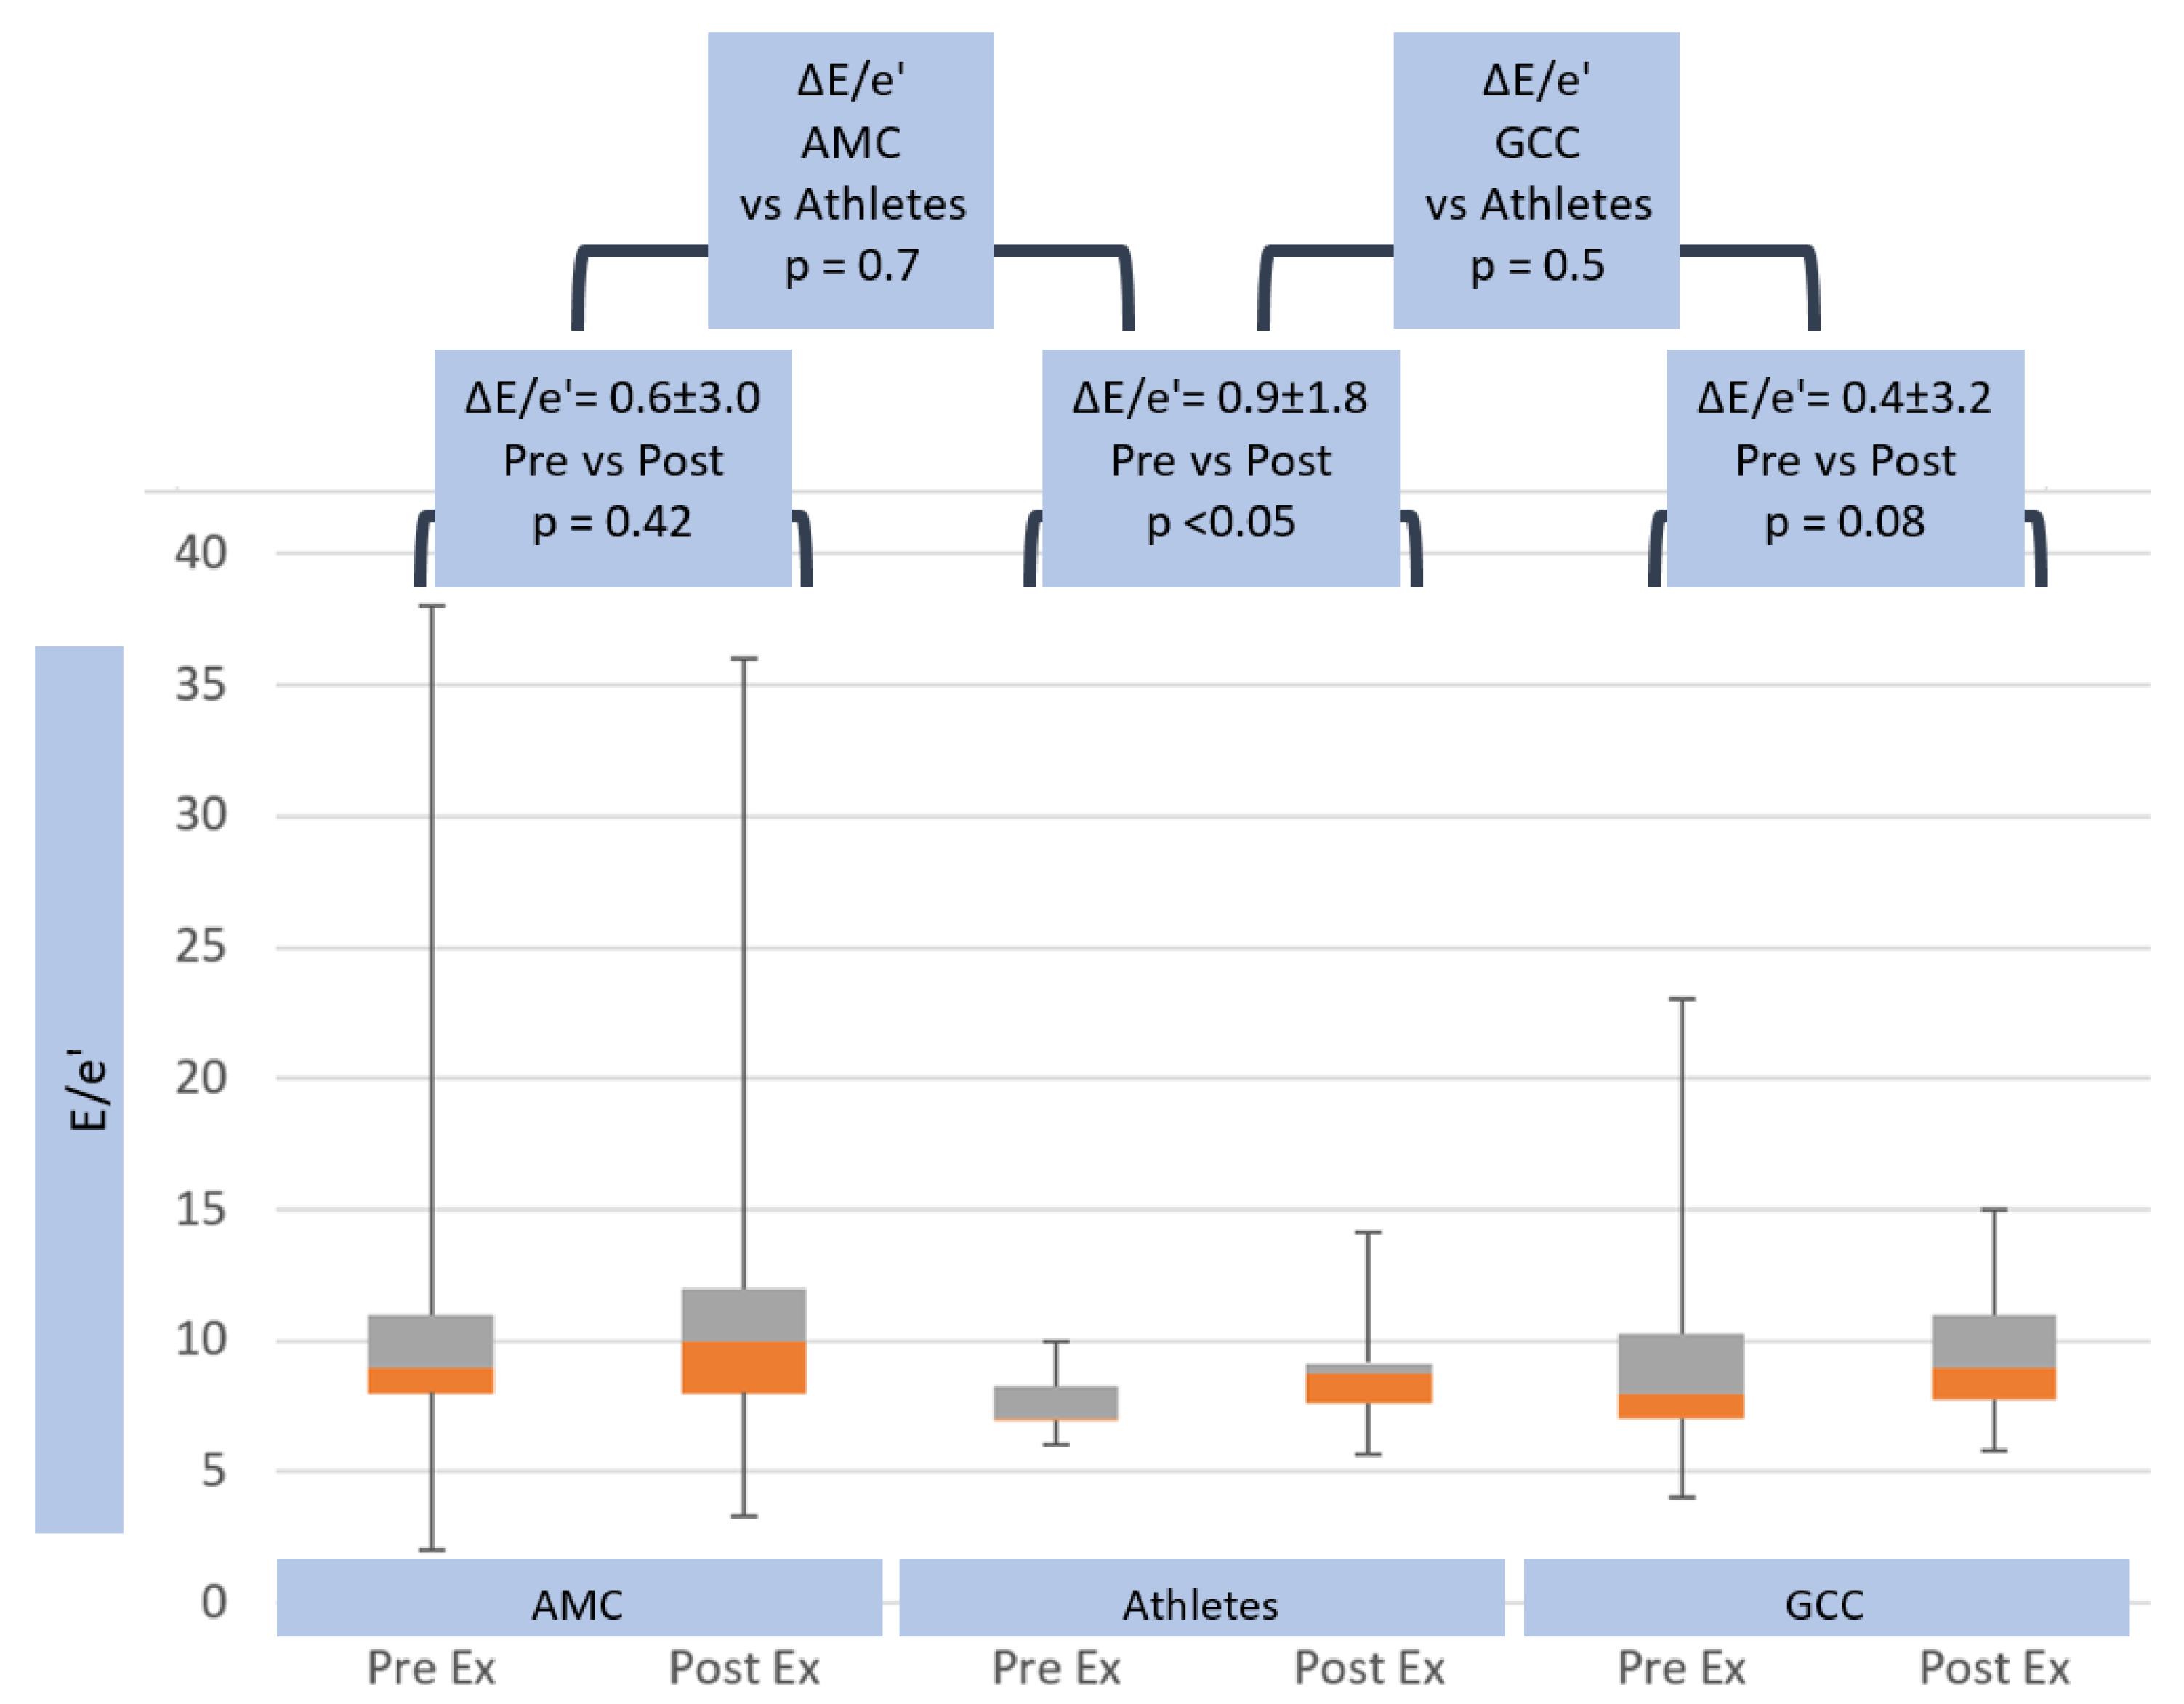
3.4. Exercise Hemodynamics
3.5. Exercise Echocardiographic Parameters
4. Discussion
5. Limitations
6. Conclusions
Author Contributions
Funding
Conflicts of Interest
Abbreviations
| BSA | Body surface area |
| BMI | Body mass index |
| HR | Heart rate |
| SV | Stroke volume |
| CO | Cardiac output |
| sBP | Systolic blood pressure |
| METS | Metabolic equivalents |
| dBP | Diastolic blood pressure |
| MAP | Mean arterial pressure |
| SVR | Systemic vascular resistance |
| PVR | Pulmonary vascular resistance |
| EF | Ejection fraction |
| E | Trans-mitral Doppler E-wave velocity |
| e’ | Mitral annular e’ wave velocity |
| E/e’ | Trans-mitral E-wave: mitral annular e’ wave |
| ePLAR | echocardiographic Pulmonary to Left Atrial Ratio |
| TR Vmax | Maximum tricuspid regurgitation velocity |
| RVSP | Right ventricular systolic pressure |
| RVOT | Right ventricular outflow tract |
| LVOT | Left ventricular outflow tract |
| VTI | Velocity time integral |
References
- Dempsey, J. Wolffe memorial lecture. Is the lung built for exercise? Med. Sci. Sports Exerc. 1986, 18, 143–155. [Google Scholar] [CrossRef]
- La Gerche, A.; Claessen, G.; Dymarkowski, S.; Voigt, J.U.; De Buck, F.; Vanhees, L.; Droogne, W.; Van Cleemput, J.; Claus, P.; Heidbuchel, H. Exercise-induced right ventricular dysfunction is associated with ventricular arrhythmias in endurance athletes. Eur. Heart J. 2015, 36, 1998–2010. [Google Scholar] [CrossRef]
- Heidbüchel, H.; Hoogsteen, J.; Fagard, R.; Vanhees, L.; Ector, H.; Willems, R.; Van Lierde, J. High prevalence of right ventricular involvement in endurance athletes with ventricular arrhythmias. Role of an electrophysiologic study in risk stratification. Eur. Heart J. 2003, 24, 1473–1480. [Google Scholar] [CrossRef]
- La Gerche, A.; Robberecht, C.; Kuiperi, C.; Nuyens, D.; Willems, R.; De Ravel, T.; Matthijs, G.; Heidbuchel, H. Lower than Expected Desmosomal Gene Mutation Prevalence in Endurance Athletes with Complex Ventricular Arrhythmias of Right Ventricular Origin. Heart 2010, 96, 1268–1274. [Google Scholar] [CrossRef] [PubMed]
- Sawant, A.C.; Bhonsale, A.; Riele, A.S.J.M.T.; Tichnell, C.; Murray, B.; Russell, S.D.; Tandri, H.; Tedford, R.J.; Judge, D.P.; Calkins, H.; et al. Exercise has a Disproportionate Role in the Pathogenesis of Arrhythmogenic Right Ventricular Dysplasia/Cardiomyopathy in Patients without Desmosomal Mutations. J. Am. Heart Assoc. 2014, 3, 001471. [Google Scholar] [CrossRef] [PubMed]
- World Medical Association. World Medical Association Declaration of Helsinki: Ethical principles for medical research involving human subjects. JAMA 2013, 310, 2191–2194. [Google Scholar] [CrossRef] [PubMed]
- Scalia, G.M.; Scalia, I.G.; Kierle, R.; Beaumont, R.; Cross, D.B.; Feenstra, J.; Burstow, D.J.; Fitzgerald, B.T.; Platts, D.G. ePLAR—The echocardiographic Pulmonary to Left Atrial Ratio—A novel non-invasive parameter to differentiate pre-capillary and post-capillary pulmonary hypertension. Int. J. Cardiol. 2016, 212, 379–386. [Google Scholar] [CrossRef] [PubMed]
- Shimiaie, J.; Sherez, J.; Aviram, G.; Megidish, R.; Viskin, S.; Halkin, A.; Ingbir, M.; Nesher, N.; Biner, S.; Keren, G.; et al. Determinants of Effort Intolerance in Patients with Heart Failure: Combined Echocardiography and Cardiopulmonary Stress Protocol. JACC Heart Fail. 2015, 3, 803–814. [Google Scholar] [CrossRef]
- Abbas, A.E.; Franey, L.M.; Marwick, T.; Maeder, M.T.; Kaye, D.M.; Vlahos, A.P.; Serra, W.; Al-Azizi, K.; Schiller, N.B.; Lester, S.J. Noninvasive Assessment of Pulmonary Vascular Resistance by Doppler Echocardiography. J. Am. Soc. Echocardiogr. 2013, 26, 1170–1177. [Google Scholar] [CrossRef]
- La Gerche, A.; Baggish, A.L.; Knuuti, J.; Prior, D.L.; Sharma, S.; Heidbuchel, H.; Thompson, P.D. Cardiac Imaging and Stress Testing Asymptomatic Athletes to Identify Those at Risk of Sudden Cardiac Death. JACC Cardiovasc. Imaging 2013, 6, 993–1007. [Google Scholar] [CrossRef]
- Prior, D.L.; La Gerche, A. The athlete’s heart. Heart 2012, 98, 947–955. [Google Scholar] [CrossRef] [PubMed]
- La Gerche, A.; Taylor, A.J.; Prior, D.L. Athlete’s Heart: The Potential for Multimodality Imaging to Address the Critical Remaining Questions. JACC Cardiovasc. Imaging 2009, 2, 350–363. [Google Scholar] [CrossRef] [PubMed]
- La Gerche, A.; Heidbuchel, H.; Burns, A.T.; Mooney, D.J.; Taylor, A.J.; Pfluger, H.B.; Inder, W.J.; MacIsaac, A.I.; Prior, D.L. Disproportionate Exercise Load and Remodeling of the Athlete’s Right Ventricle. Med. Sci. Sports Exerc. 2011, 43, 974–981. [Google Scholar] [CrossRef] [PubMed]
- Claessen, G.; Claus, P.I.; Ghysels, S.; Vermeersch, P.; Dymarkowski, S.; LA, A.G.; Heidbuchel, H.E. Right ventricular fatigue developing during endurance exercise: An exercise cardiac magnetic resonance study. Med. Sci. Sports Exerc. 2014, 46, 1717–1726. [Google Scholar] [CrossRef]
- La Gerche, A.; Burns, A.T.; Mooney, D.J.; Inder, W.J.; Taylor, A.J.; Bogaert, J.; MacIsaac, A.I.; Heidbüchel, H.; Prior, D.L. Exercise-induced right ventricular dysfunction and structural remodelling in endurance athletes. Eur. Heart J. 2012, 33, 998–1006. [Google Scholar] [CrossRef] [PubMed]
- Oxborough, D.; Shave, R.; Warburton, D.; Williams, K.; Oxborough, A.; Charlesworth, S.; Foulds, H.; Hoffman, M.D.; Birch, K.; George, K. Dilatation and dysfunction of the right ventricle immediately after ultraendurance exercise: Exploratory insights from conventional two-dimensional and speckle tracking echocardiography. Circ. Cardiovasc. Imaging 2011, 4, 253–263. [Google Scholar] [CrossRef]
- Douglas, P.S.; O’Toole, M.L.; Miller, W.B.; Reichek, N. Different effects of prolonged exercise on the right and left ventricles. J. Am. Coll. Cardiol. 1990, 15, 64–69. [Google Scholar] [CrossRef]
- Trivax, J.E.; Franklin, B.A.; Goldstein, J.A.; Chinnaiyan, K.M.; Gallagher, M.J.; deJong, A.T.; Colar, J.M.; Haines, D.E.; McCullough, P.A. Acute cardiac effects of marathon running. J. Appl. Physiol. 2010, 108, 1148–1153. [Google Scholar] [CrossRef]
- Teske, A.J.; Prakken, N.H.; De Boeck, B.W.; Velthuis, B.K.; Martens, E.P.; Doevendans, P.A.; Cramer, M.J. Echocardiographic tissue deformation imaging of right ventricular systolic function in endurance athletes. Eur. Heart J. 2009, 30, 969–977. [Google Scholar] [CrossRef]
- Francis, G.S. Hemodynamic and neurohumoral responses to dynamic exercise: Normal subjects versus patients with heart disease. Circulation 1987, 76, 11–17. [Google Scholar]
- Clausen, J.P. Circulatory adjustments to dynamic exercise and effect of physical training in normal subjects and in patients with coronary artery disease. Prog. Cardiovasc. Dis. 1976, 18, 459–495. [Google Scholar] [CrossRef]
- Koller, A.; Huang, A.; Sun, D.; Kaley, G. Exercise training augments flow-dependent dilation in rat skeletal muscle arterioles. Role of endothelial nitric oxide and prostaglandins. Circ. Res. 1995, 76, 544–550. [Google Scholar] [CrossRef] [PubMed]
- Kurl, S.; Laukkanen, J.; Rauramaa, R.; Lakka, T.; Sivenius, J.; Salonen, J. Systolic blood pressure response to exercise stress test and risk of stroke. Stroke 2001, 32, 2036–2041. [Google Scholar] [CrossRef] [PubMed]
- Gerche, A.L.; Roberts, T.; Claessen, G. The response of the pulmonary circulation and right ventricle to exercise: Exercise-induced right ventricular dysfunction and structural remodeling in endurance athletes (2013 Grover Conference series). Pulm Circ. 2014, 4, 407–416. [Google Scholar] [CrossRef] [PubMed]
- West, J.B. Left ventricular filling pressures during exercise: A cardiological blind spot? Chest 1998, 113, 1695–1697. [Google Scholar] [CrossRef] [PubMed]
- Argiento, P.; Chesler, N.; Mulè, M.; D’Alto, M.; Bossone, E.; Unger, P.; Naeije, R. Exercise stress echocardiography for the study of the pulmonary circulation. Eur. Respir. J. 2010, 35, 1273–1278. [Google Scholar] [CrossRef]
- Kane, D.W.; Tesauro, T.; Koizumi, T.; Gupta, R.; Newman, J.H. Exercise-induced pulmonary vasoconstriction during combined blockade of nitric oxide synthase and beta adrenergic receptors. J. Clin. Investig. 1994, 93, 677–683. [Google Scholar] [CrossRef]
- Dawson, C.A. Role of pulmonary vasomotion in physiology of the lung. Physiol. Rev. 1984, 64, 544–616. [Google Scholar] [CrossRef]
- Chemla, D.; Castelain, V.; Hoette, S.; Creuzé, N.; Provencher, S.; Zhu, K.; Humbert, M.; Herve, P. Strong linear relationship between heart rate and mean pulmonary artery pressure in exercising patients with severe precapillary pulmonary hypertension. Am. J. Physiol. Circ. Physiol. 2013, 305, H769–H777. [Google Scholar] [CrossRef]
- Verbrugge, F.H.; Dupont, M.; Bertrand, P.B.; Nijst, P.; Grieten, L.; Dens, J.; Verhaert, D.; Janssens, S.; Tang, W.W.; Mullens, W. Pulmonary vascular response to exercise in symptomatic heart failure with reduced ejection fraction and pulmonary hypertension. Eur. J. Heart Fail. 2015, 17, 320–328. [Google Scholar] [CrossRef]
- Bossone, E.; Rubenfire, M.; Bach, D.S.; Ricciardi, M.; Armstrong, W.F. Range of tricuspid regurgitation velocity at rest and during exercise in normal adult men: Implications for the diagnosis of pulmonary hypertension. J. Am. Coll. Cardiol. 1999, 33, 1662–1666. [Google Scholar] [CrossRef]
- Kovács, G.; Maier, R.; Aberer, E.; Brodmann, M.; Scheidl, S.; Tröster, N.; Hesse, C.; Salmhofer, W.; Graninger, W.; Gruenig, E.; et al. Borderline Pulmonary Arterial Pressure Is Associated with Decreased Exercise Capacity in Scleroderma. Am. J. Respir. Crit. Care Med. 2009, 180, 881–886. [Google Scholar] [CrossRef] [PubMed]
- Saggar, R.; Khanna, D.; Shapiro, S.; Furst, D.E.; Maranian, P.; Chauhan, N.; Clements, P.; Belperio, J.A.; Weigt, S.S.; Lynch, J.P.; et al. Exercise Induced Pulmonary Hypertension Associated with Systemic Sclerosis: Four Distinct Entities. Arthritis Rheum. 2010, 62, 3741–3750. [Google Scholar] [CrossRef] [PubMed]
- Tolle, J.J.; Waxman, A.B.; Van Horn, T.L.; Pappagianopoulos, P.P.; Systrom, D.M. Exercise-induced pulmonary arterial hypertension. Circulation 2008, 118, 2183–2189. [Google Scholar] [CrossRef] [PubMed]
- Magee, F.; Wright, J.L.; Wiggs, B.R.; Paré, P.D.; Hogg, J.C. Pulmonary vascular structure and function in chronic obstructive pulmonary disease. Thorax 1988, 43, 183–189. [Google Scholar] [CrossRef] [PubMed]
- Agustí, A.G.; Barberá, J.A.; Roca, J.; Wagner, P.D.; Guitart, R.; Rodriguez-Roisín, R. Hypoxic Pulmonary Vasoconstriction and Gas Exchange During Exercise in Chronic Obstructive Pulmonary Disease. Chest 1990, 97, 268–275. [Google Scholar] [CrossRef] [PubMed]
- Kovacs, G.; Olschewski, A.; Berghold, A.; Olschewski, H. Pulmonary vascular resistances during exercise in normal subjects: A systematic review. Eur. Respir. J. 2012, 39, 319–328. [Google Scholar] [CrossRef]
- Weisman, I.M.; Zeballos, R.J. Clinical exercise testing. Clin. Chest Med. 2001, 22, 679–701. [Google Scholar] [CrossRef]
- Fagard, R. Exercise is Good for Your Blood Pressure: Effects of Endurance Training and Resistance Training. Clin. Exp. Pharmacol. Physiol. 2006, 33, 853–856. [Google Scholar] [CrossRef]


| Age Matched Controls (AMC), n = 20 | p-value, Athletes vs. AMC | Athletes, n = 20 | p-value, Athletes vs. GCC | General Community Cohort (GCC), n = 230 | |
|---|---|---|---|---|---|
| Age (years) | 42.6 ± 7.0 | ns | 39.5 ± 11.3 | <0.001 | 66.0 ± 10.7 |
| Sex | 10 males | 17 males | 155 males | ||
| BSA (m2) | 2.0 ± 0.29 | ns | 2.0 ± 0.15 | ns | 2.0 ± 0.3 |
| BMI (kg/m2) | 27.7 ± 7.2 | 0.01 | 23.3 ± 2.1 | ns | 27.4 ± 4.9 |
| Exercise, duration (mins) | 10.1 ± 2.8, (Bruce protocol) | <0.05 | 12.2 ± 0.53 (Athlete protocol) | <0.001 | 8.3 ± 2.6, (Bruce protocol) |
| METS, (3.5 mL/min/kg) | 10.8 ± 2.6 | <0.001 | 20.4 ± 1.92 | <0.001 | 9.3 ± 2.5 |
| HR pre (beats/min) | 69.6 ± 11.1 | 0.001 | 57.5 ± 10.0 | <0.001 | 69.5 ± 10.6 |
| sBP pre +(mmHg) | 116.3 ± 14.5 | ns | 120.8 ± 12.9 | ns | 126.6 ± 18.9 |
| dBP pre (mmHg) | 76.5 ± 9.6 | ns | 72.9 ± 7.7 | ns | 75.0 ± 9.2 |
| HR max (beats/min) | 169.6 ± 16.8 | ns | 175.6 ± 10.9 | <0.001 | 146.0 ± 20.6 |
| sBP post (mmHg) | 165.6 ± 28.7 | ns | 170.5 ± 12.6 | ns | 172.5 ± 24.6 |
| dBP post (mmHg) | 85.9 ± 20.1 | <0.05 | 74.5 ± 7.2 | ns | 79.6 ± 15.5 |
| CO (rest), l/min | 5.5 ± 1.0 | ns | 6.0 ± 1.2 | ns | 5.7 ± 1.4 |
| CO (peak), l/min | 10.1 ± 3.6 | <0.01 | 13.3 ± 2.97 | <0.001 | 9.2 ± 2.5 |
| EF pre (%) | 65.9 ± 3.6 | ns | 63.7 ± 3.5 | ns | 64.8 ± 5.3 |
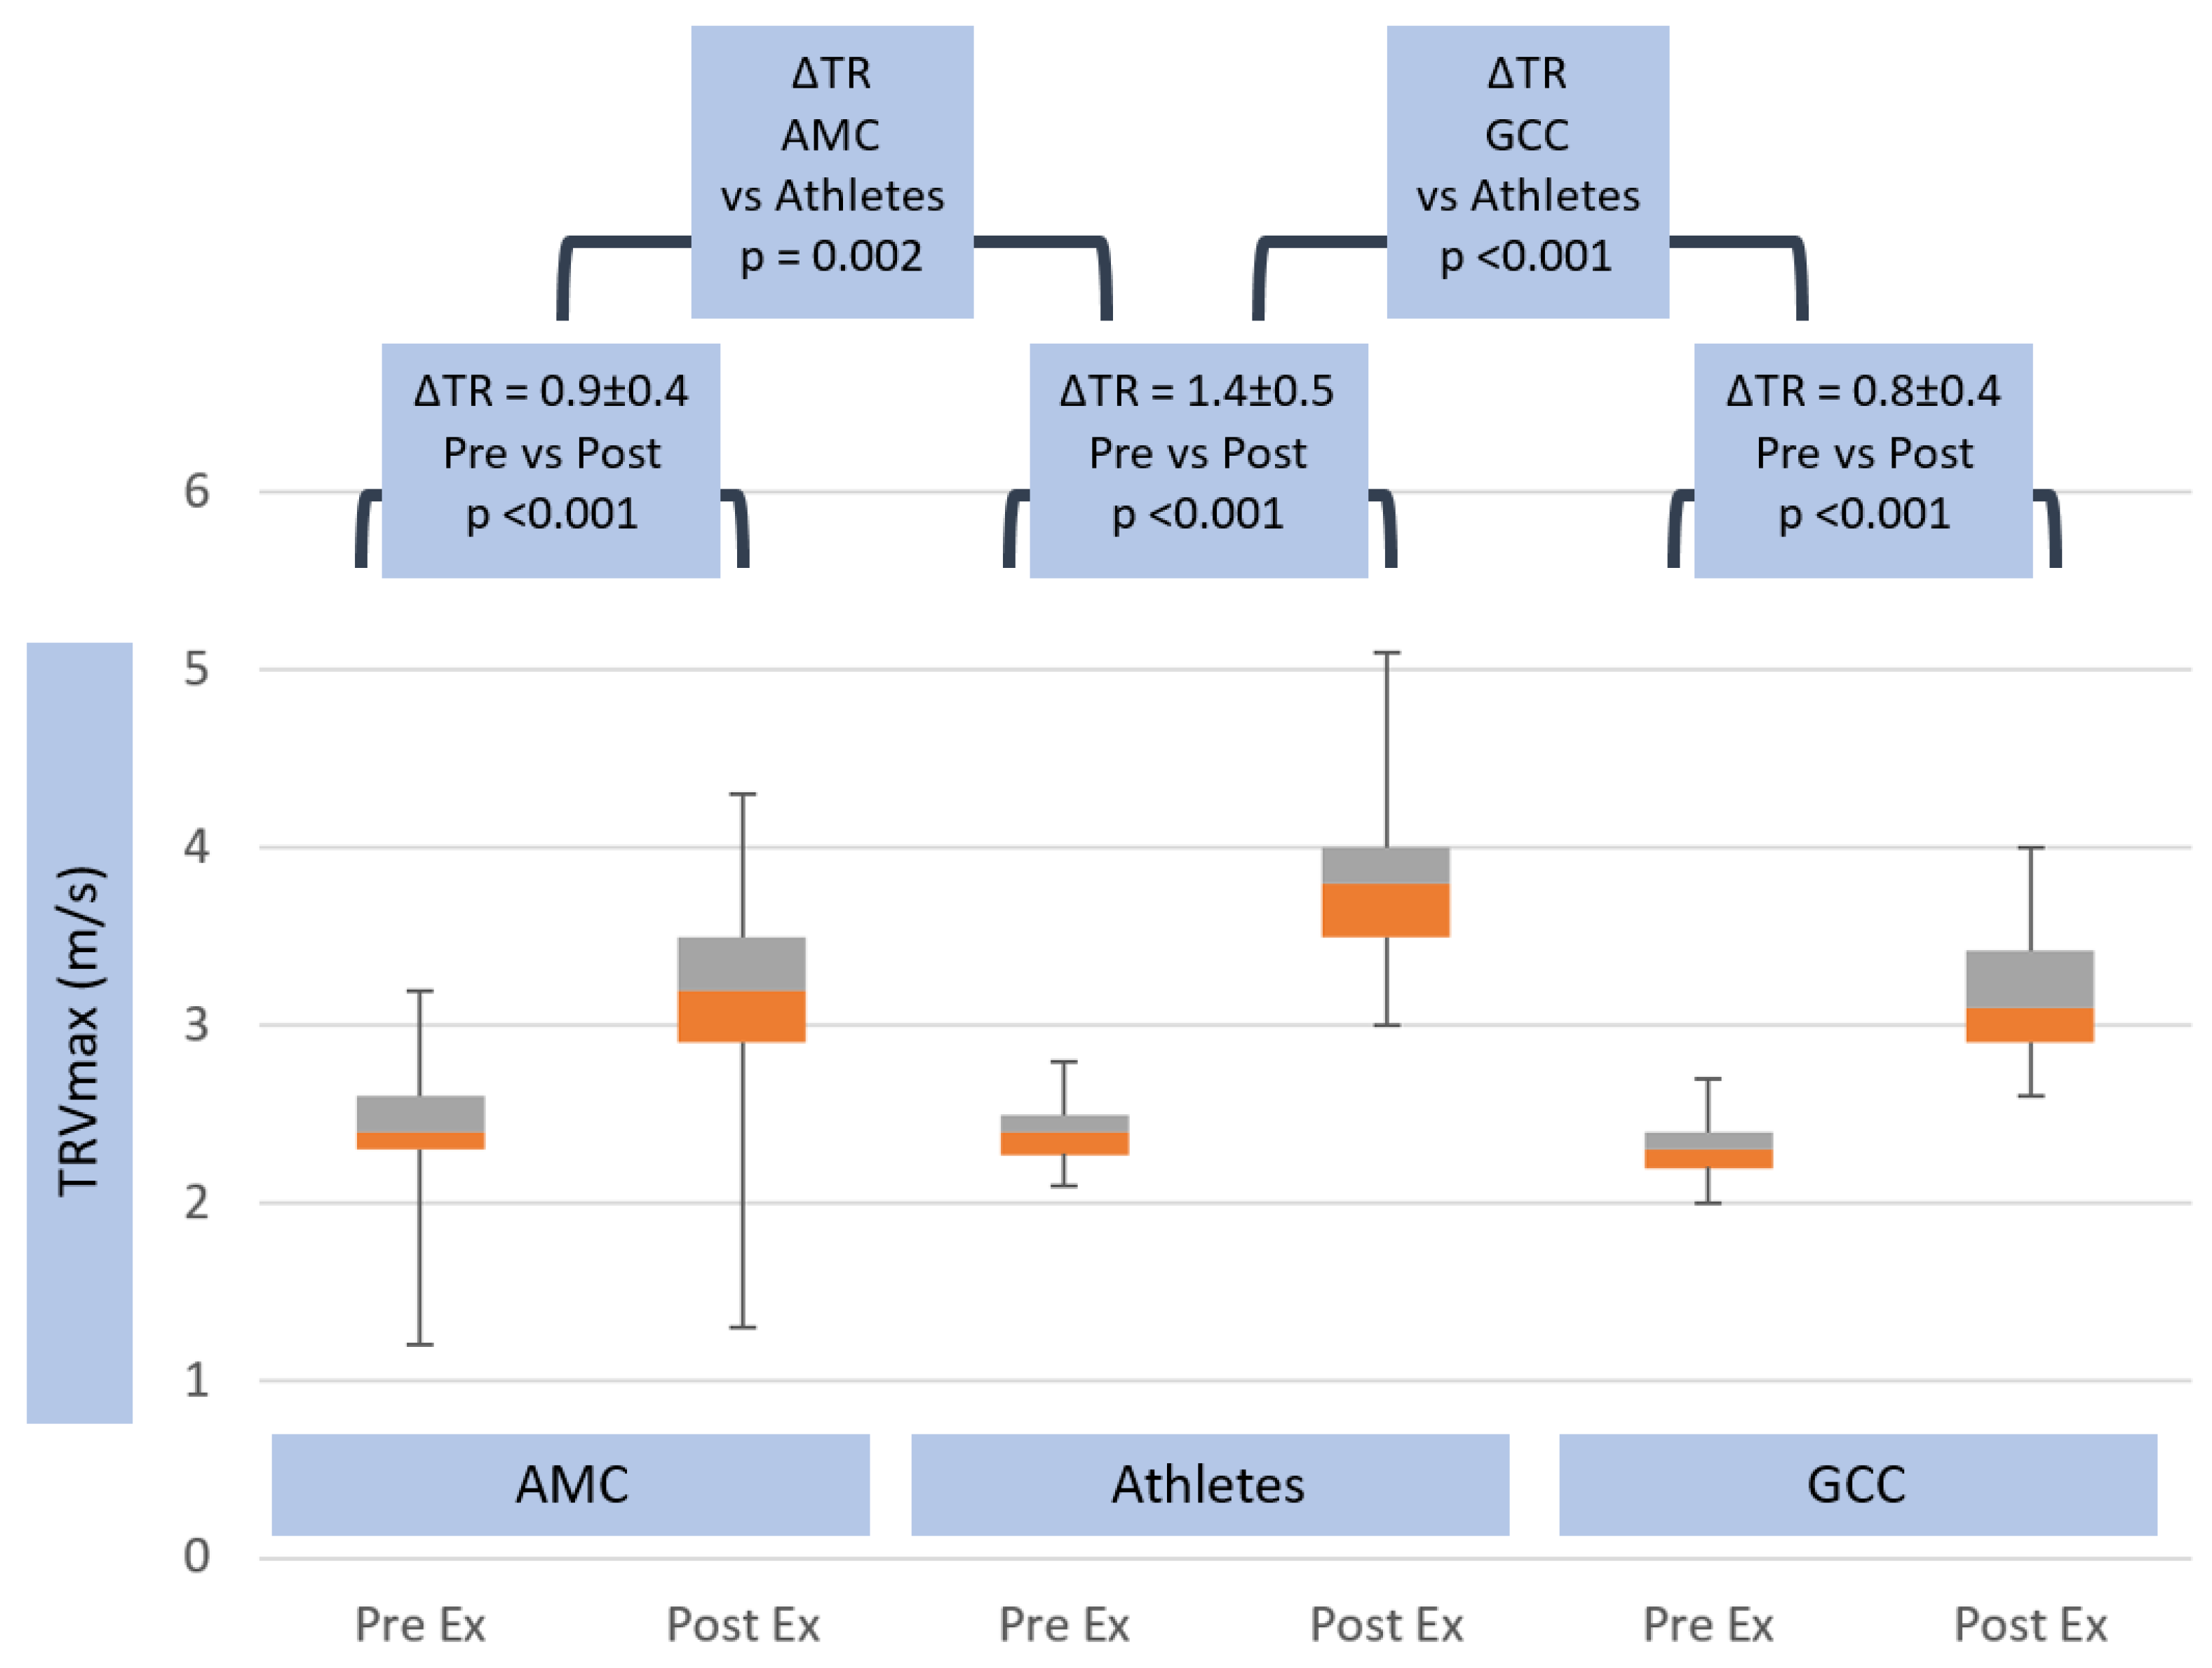
| TR Vmax pre (m/s) | 2.3 ± 0.2 | ns | 2.4 ± 0.2 | ns | 2.4 ± 0.3 |
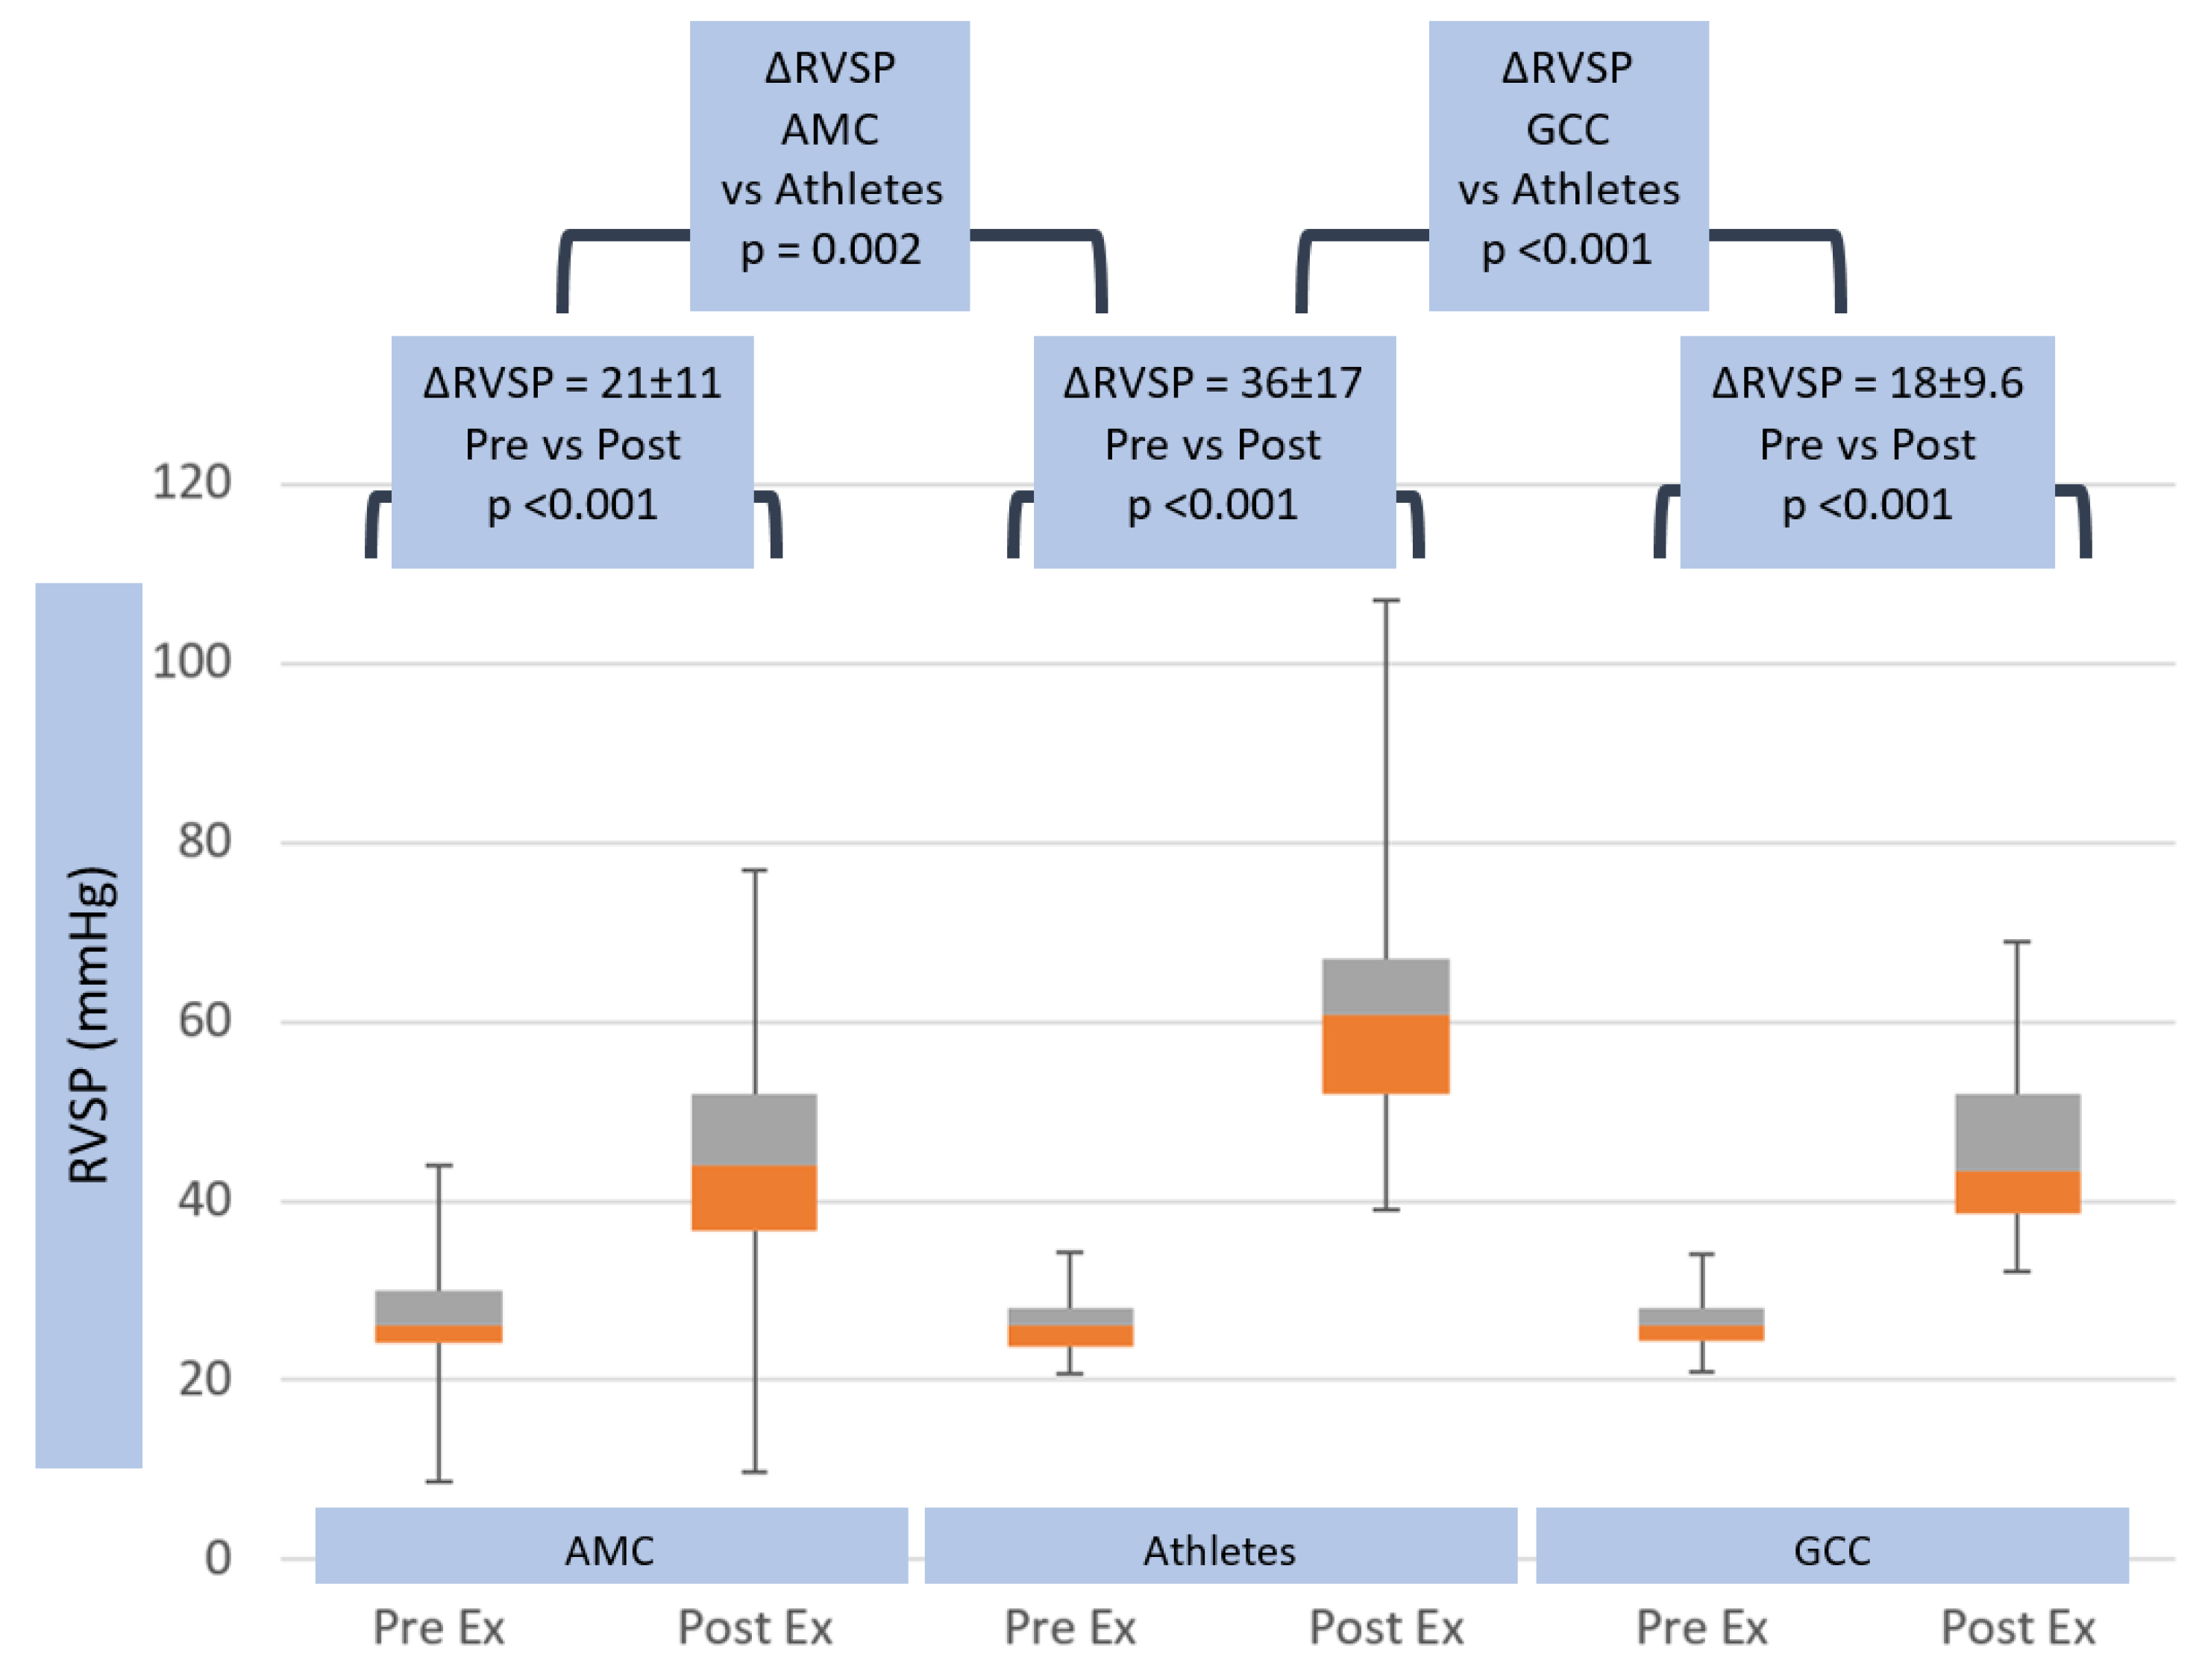
| RVSP pre (mmHg) | 26.6 ± 3.7 | ns | 26.4 ± 3.7 | ns | 26.9 ± 5.5 |
| E pre (m/s) | 0.87 ± 0.3 | ns | 0.8 ± 0.1 | ns | 0.8 ± 0.2 |
| e’ pre (m/s) | 0.1 ± 0.02 | ns | 0.11 ± 0.02 | <0.001 | 0.08 ± 0.03 |
| E/e’ pre | 9.0 ± 4.1 | ns | 7.6 ± 1.3 | 0.01 | 9.8 ± 3.8 |
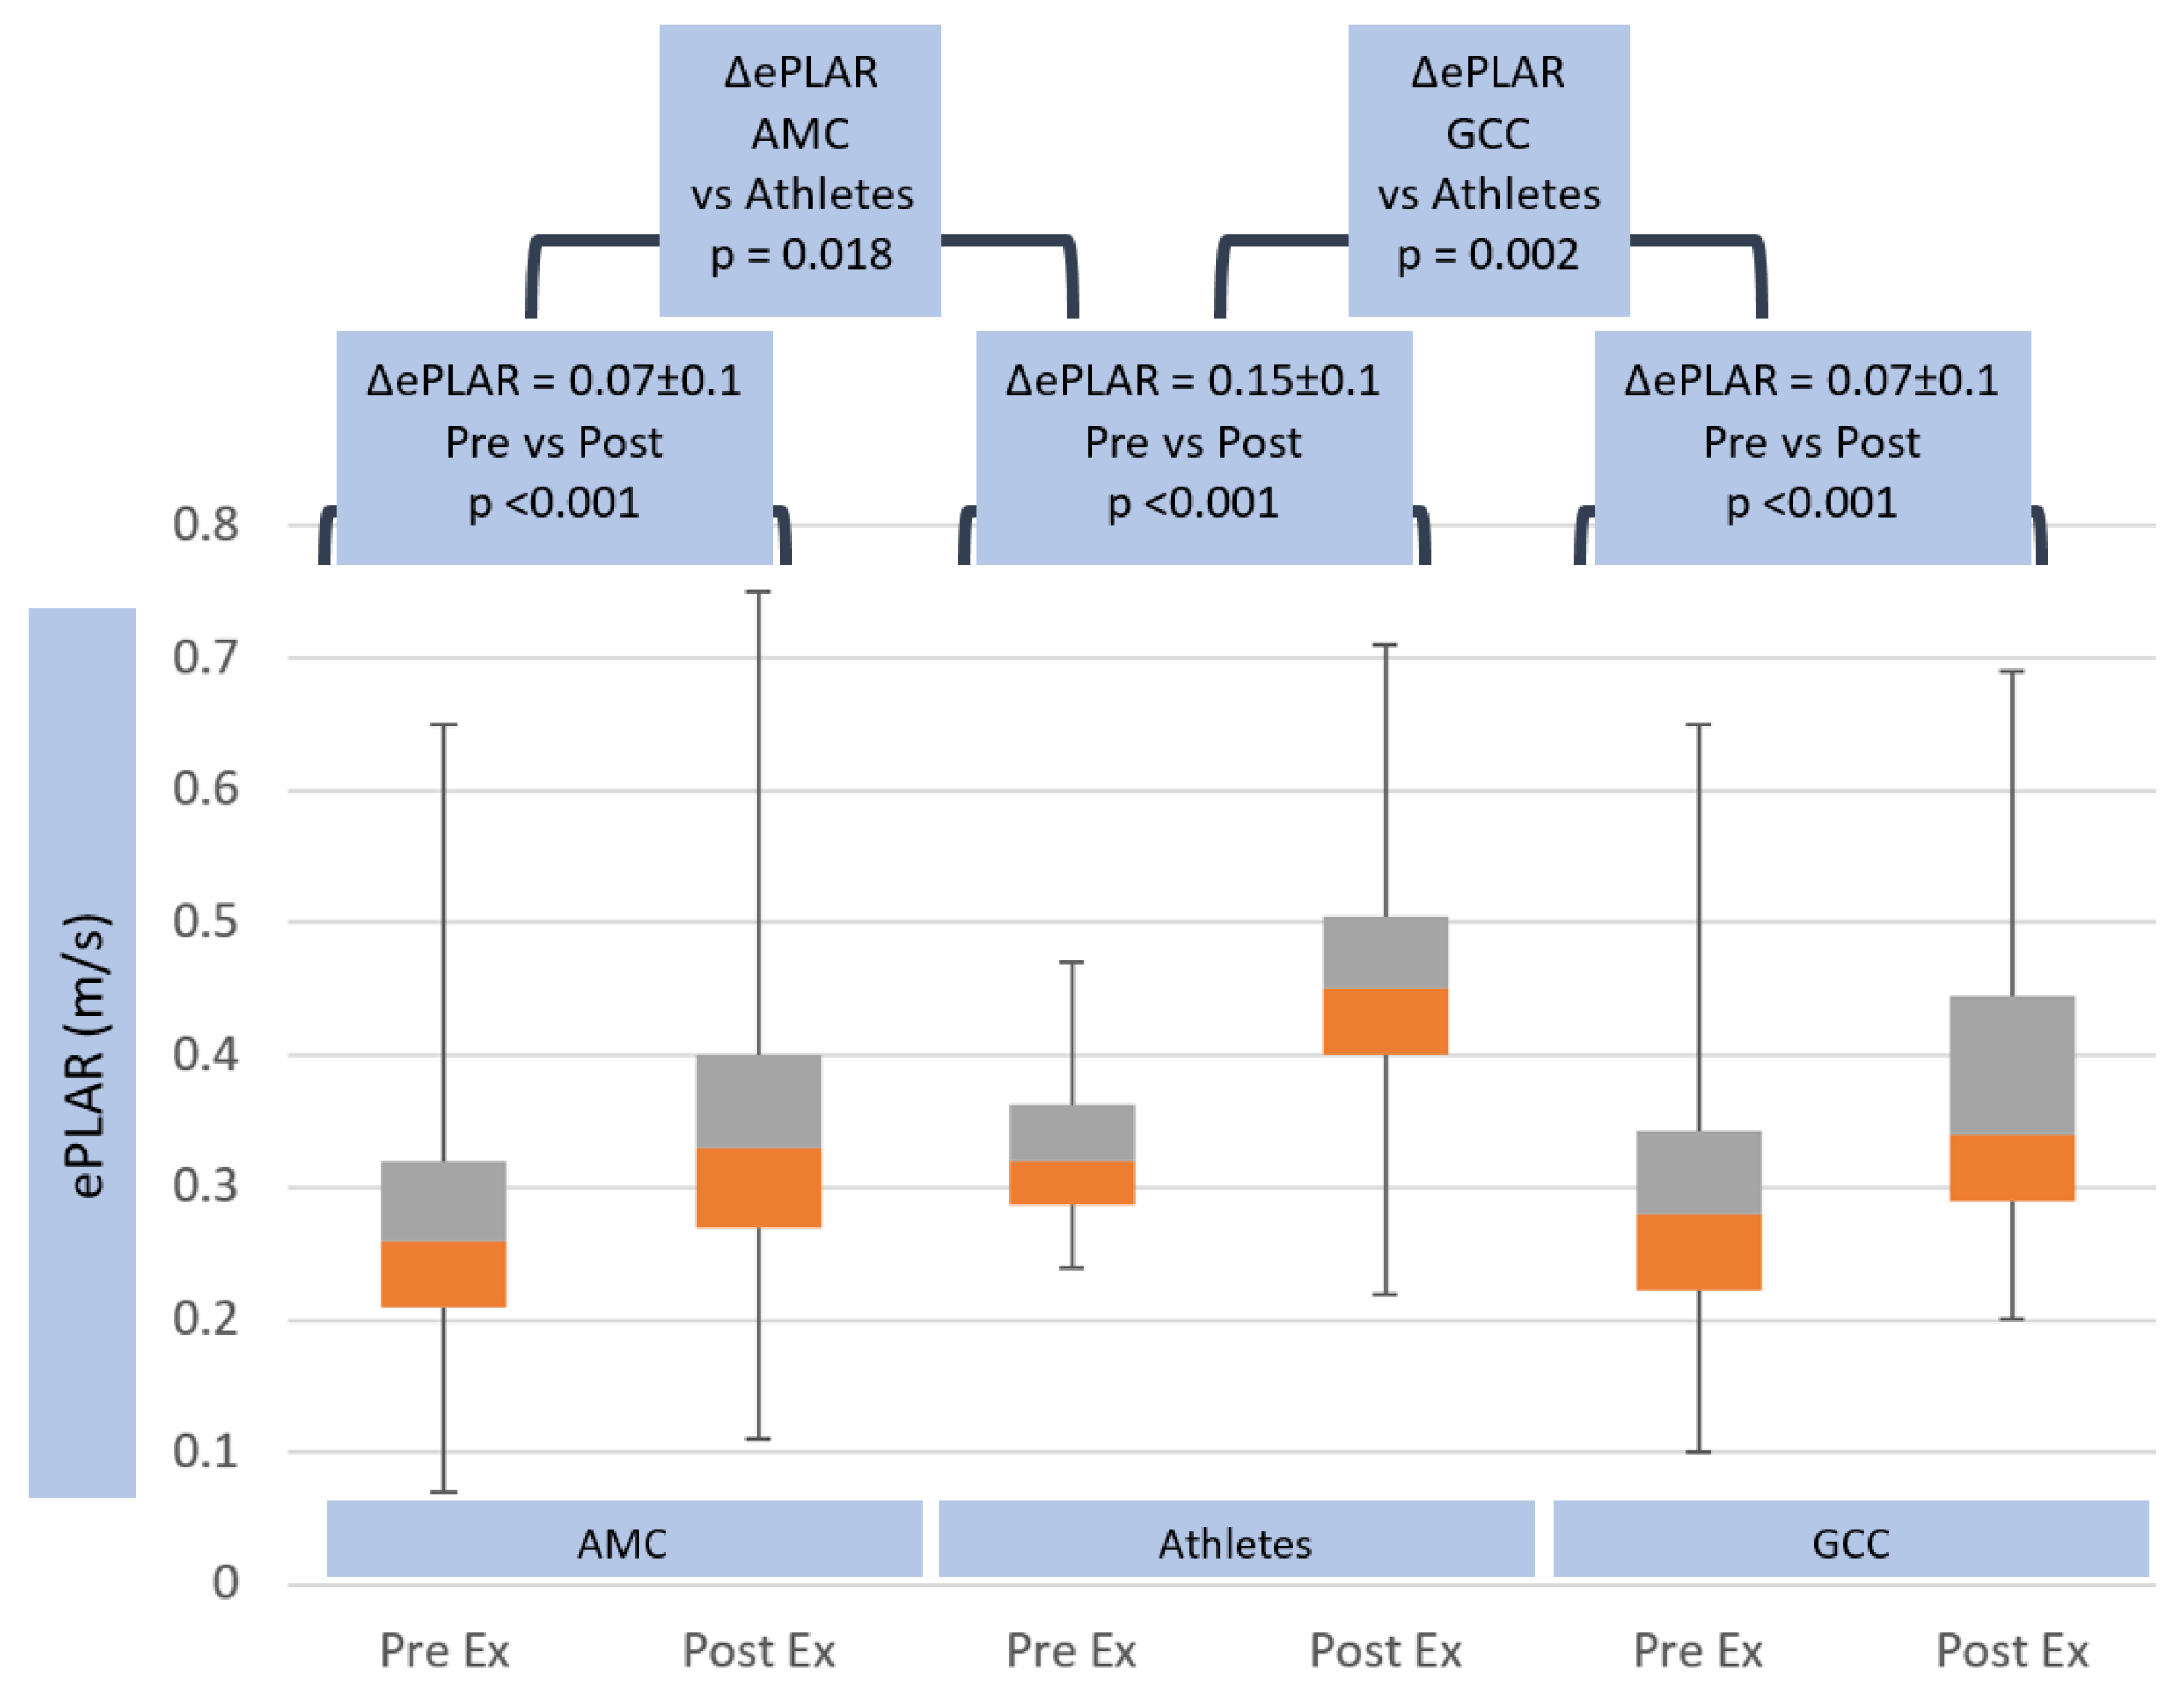
| ePLAR pre (m/s) | 0.30 ± 0.1 | ns | 0.33 ± 0.06 | <0.001 | 0.27 ± 0.09 |
| TR Vmax post (m/s) | 3.2 ± 0.4 | 0.001 | 3.8 ± 0.5 | <0.001 | 3.2 ± 0.4 |
| RVSP post (mmHg) | 47.0 ± 11.0 | <0.05 | 62.0 ± 17 | <0.001 | 45.1 ± 11.1 |
| E post (m/s) | 1.3 ± 0.3 | ns | 1.3 ± 0.2 | <0.001 | 1.1 ± 0.3 |
| e’ post (m/s) | 0.13 ± 0.02 | <0.05 | 0.16 ± 0.03 | ns | 0.13 ± 0.11 |
| E/e’ post | 9.6 ± 2.7 | ns | 8.5 ± 2.0 | 0.04 | 10.2 ± 3.7 |
| ePLAR post (m/s) | 0.37 ± 0.1 | <0.05 | 0.47 ± 0.13 | <0.001 | 0.35 ± 0.11 |
| Age Matched Control | p-Value Athletes vs. Age Matched Control | Athletes | p-Value Athletes vs. on-Athlete Cohort | General Community Cohort | |
|---|---|---|---|---|---|
| ΔHR (beats/min) | 100.0 ± 18.2 | 0.002 | 117.1 ± 14.2 | <0.001 | 76.0 ± 20.1 |
| ΔsBP (mmHg) | 48.1 ± 29.7 | ns | 51.3 ± 11.1 | ns | 45.6 ± 23.3 |
| ΔdBP (mmHg) | 8.1 ± 23.9 | ns | 1.5 ± 4.6 | ns | 2.9 ± 15.6 |
| ΔTR Vmax (m/s) | 0.9 ± 0.4 | 0.002 | 1.4 ± 0.5 | <0.001 | 0.8 ± 0.4 |
| ΔRVSP (mmHg) | 20.4 ± 10.8 | 0.002 | 35.6 ± 17 | <0.001 | 18 ± 9.6 |
| ΔE (m/s) | 0.4 ± 0.2 | 0.05 | 0.5 ± 0.2 | 0.003 | 0.3 ± 0.2 |
| Δe’ (m/s) | 0.03 ± 0.02 | ns | 0.05 ± 0.02 | ns | 0.04 ± 0.11 |
| ΔE/e’ | 0.6 ± 3.0 | ns | 0.9 ± 1.8 | ns | 0.4 ± 3.2 |
| ΔePLAR (m/s) | 0.07 ± 0.1 | 0.018 | 0.15 ± 0.1 | 0.002 | 0.07 ± 0.1 |
| Coefficients | Sig. | 95.0% Confidence Interval for B | |||
|---|---|---|---|---|---|
| Beta | Std. Error | Lower Bound | Upper Bound | ||
| Athlete | 39.310 | 18.913 | 0.040 | 1.903 | 76.717 |
| METs | −3.908 | 1.719 | 0.025 | −7.308 | −0.508 |
| Delta CO % | 0.019 | 0.270 | 0.945 | −0.516 | 0.553 |
| Delta sBP % | 0.373 | 0.212 | 0.081 | −0.047 | 0.793 |
| Age | −0.510 | 0.408 | 0.214 | −1.317 | 0.298 |
| BSA | 2.238 | 14.826 | 0.880 | −27.085 | 31.561 |
| HR max | −0.001 | 0.216 | 0.996 | −0.428 | 0.426 |
| Constant | 82.690 | 61.728 | 0.183 | −39.397 | 204.777 |
© 2019 by the authors. Licensee MDPI, Basel, Switzerland. This article is an open access article distributed under the terms and conditions of the Creative Commons Attribution (CC BY) license (http://creativecommons.org/licenses/by/4.0/).
Share and Cite
Tran, M.; Kwon, A.; Holt, D.; Kierle, R.; Fitzgerald, B.; Scalia, I.; Scalia, W.; Holt, G.; Scalia, G. Echocardiographic Pulmonary to Left Atrial Ratio (ePLAR): A Comparison Study between Ironman Athletes, Age Matched Controls and A General Community Cohort. J. Clin. Med. 2019, 8, 1756. https://doi.org/10.3390/jcm8101756
Tran M, Kwon A, Holt D, Kierle R, Fitzgerald B, Scalia I, Scalia W, Holt G, Scalia G. Echocardiographic Pulmonary to Left Atrial Ratio (ePLAR): A Comparison Study between Ironman Athletes, Age Matched Controls and A General Community Cohort. Journal of Clinical Medicine. 2019; 8(10):1756. https://doi.org/10.3390/jcm8101756
Chicago/Turabian StyleTran, Mai, Agatha Kwon, David Holt, Rebecca Kierle, Benjamin Fitzgerald, Isabel Scalia, William Scalia, Geoffrey Holt, and Gregory Scalia. 2019. "Echocardiographic Pulmonary to Left Atrial Ratio (ePLAR): A Comparison Study between Ironman Athletes, Age Matched Controls and A General Community Cohort" Journal of Clinical Medicine 8, no. 10: 1756. https://doi.org/10.3390/jcm8101756
APA StyleTran, M., Kwon, A., Holt, D., Kierle, R., Fitzgerald, B., Scalia, I., Scalia, W., Holt, G., & Scalia, G. (2019). Echocardiographic Pulmonary to Left Atrial Ratio (ePLAR): A Comparison Study between Ironman Athletes, Age Matched Controls and A General Community Cohort. Journal of Clinical Medicine, 8(10), 1756. https://doi.org/10.3390/jcm8101756