Is There a Link between Basal Metabolic Rate, Spleen Volume and Hepatic Growth Factor Levels in Patients with Obesity-Related NAFLD?

 ,
, 
 and
and
Abstract

1. Introduction
2. Method
2.1. Patients
2.2. Inclusion Criteria
2.3. Exclusion Criteria
2.4. Anthropometric Evaluation
2.5. Metabolic Assessment
2.6. Laboratory Data
2.7. Ultrasound Features
2.8. Indirect Calorimetry
2.9. Statistics
3. Results
3.1. Prevalence
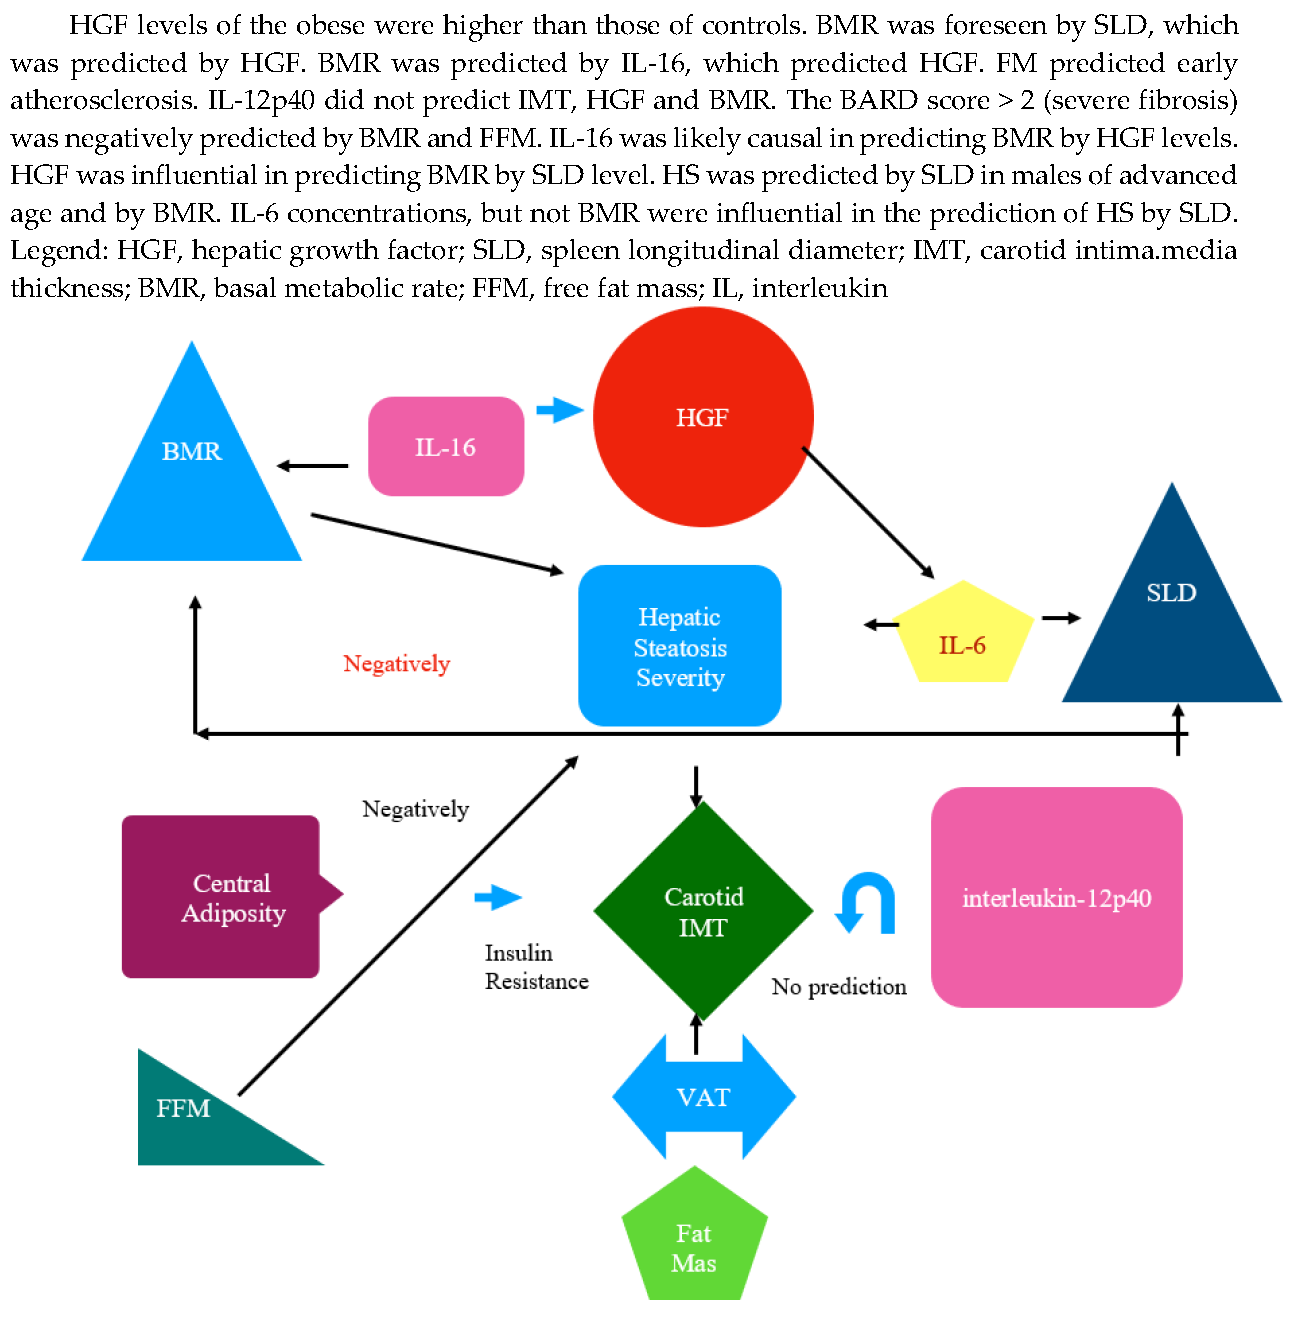
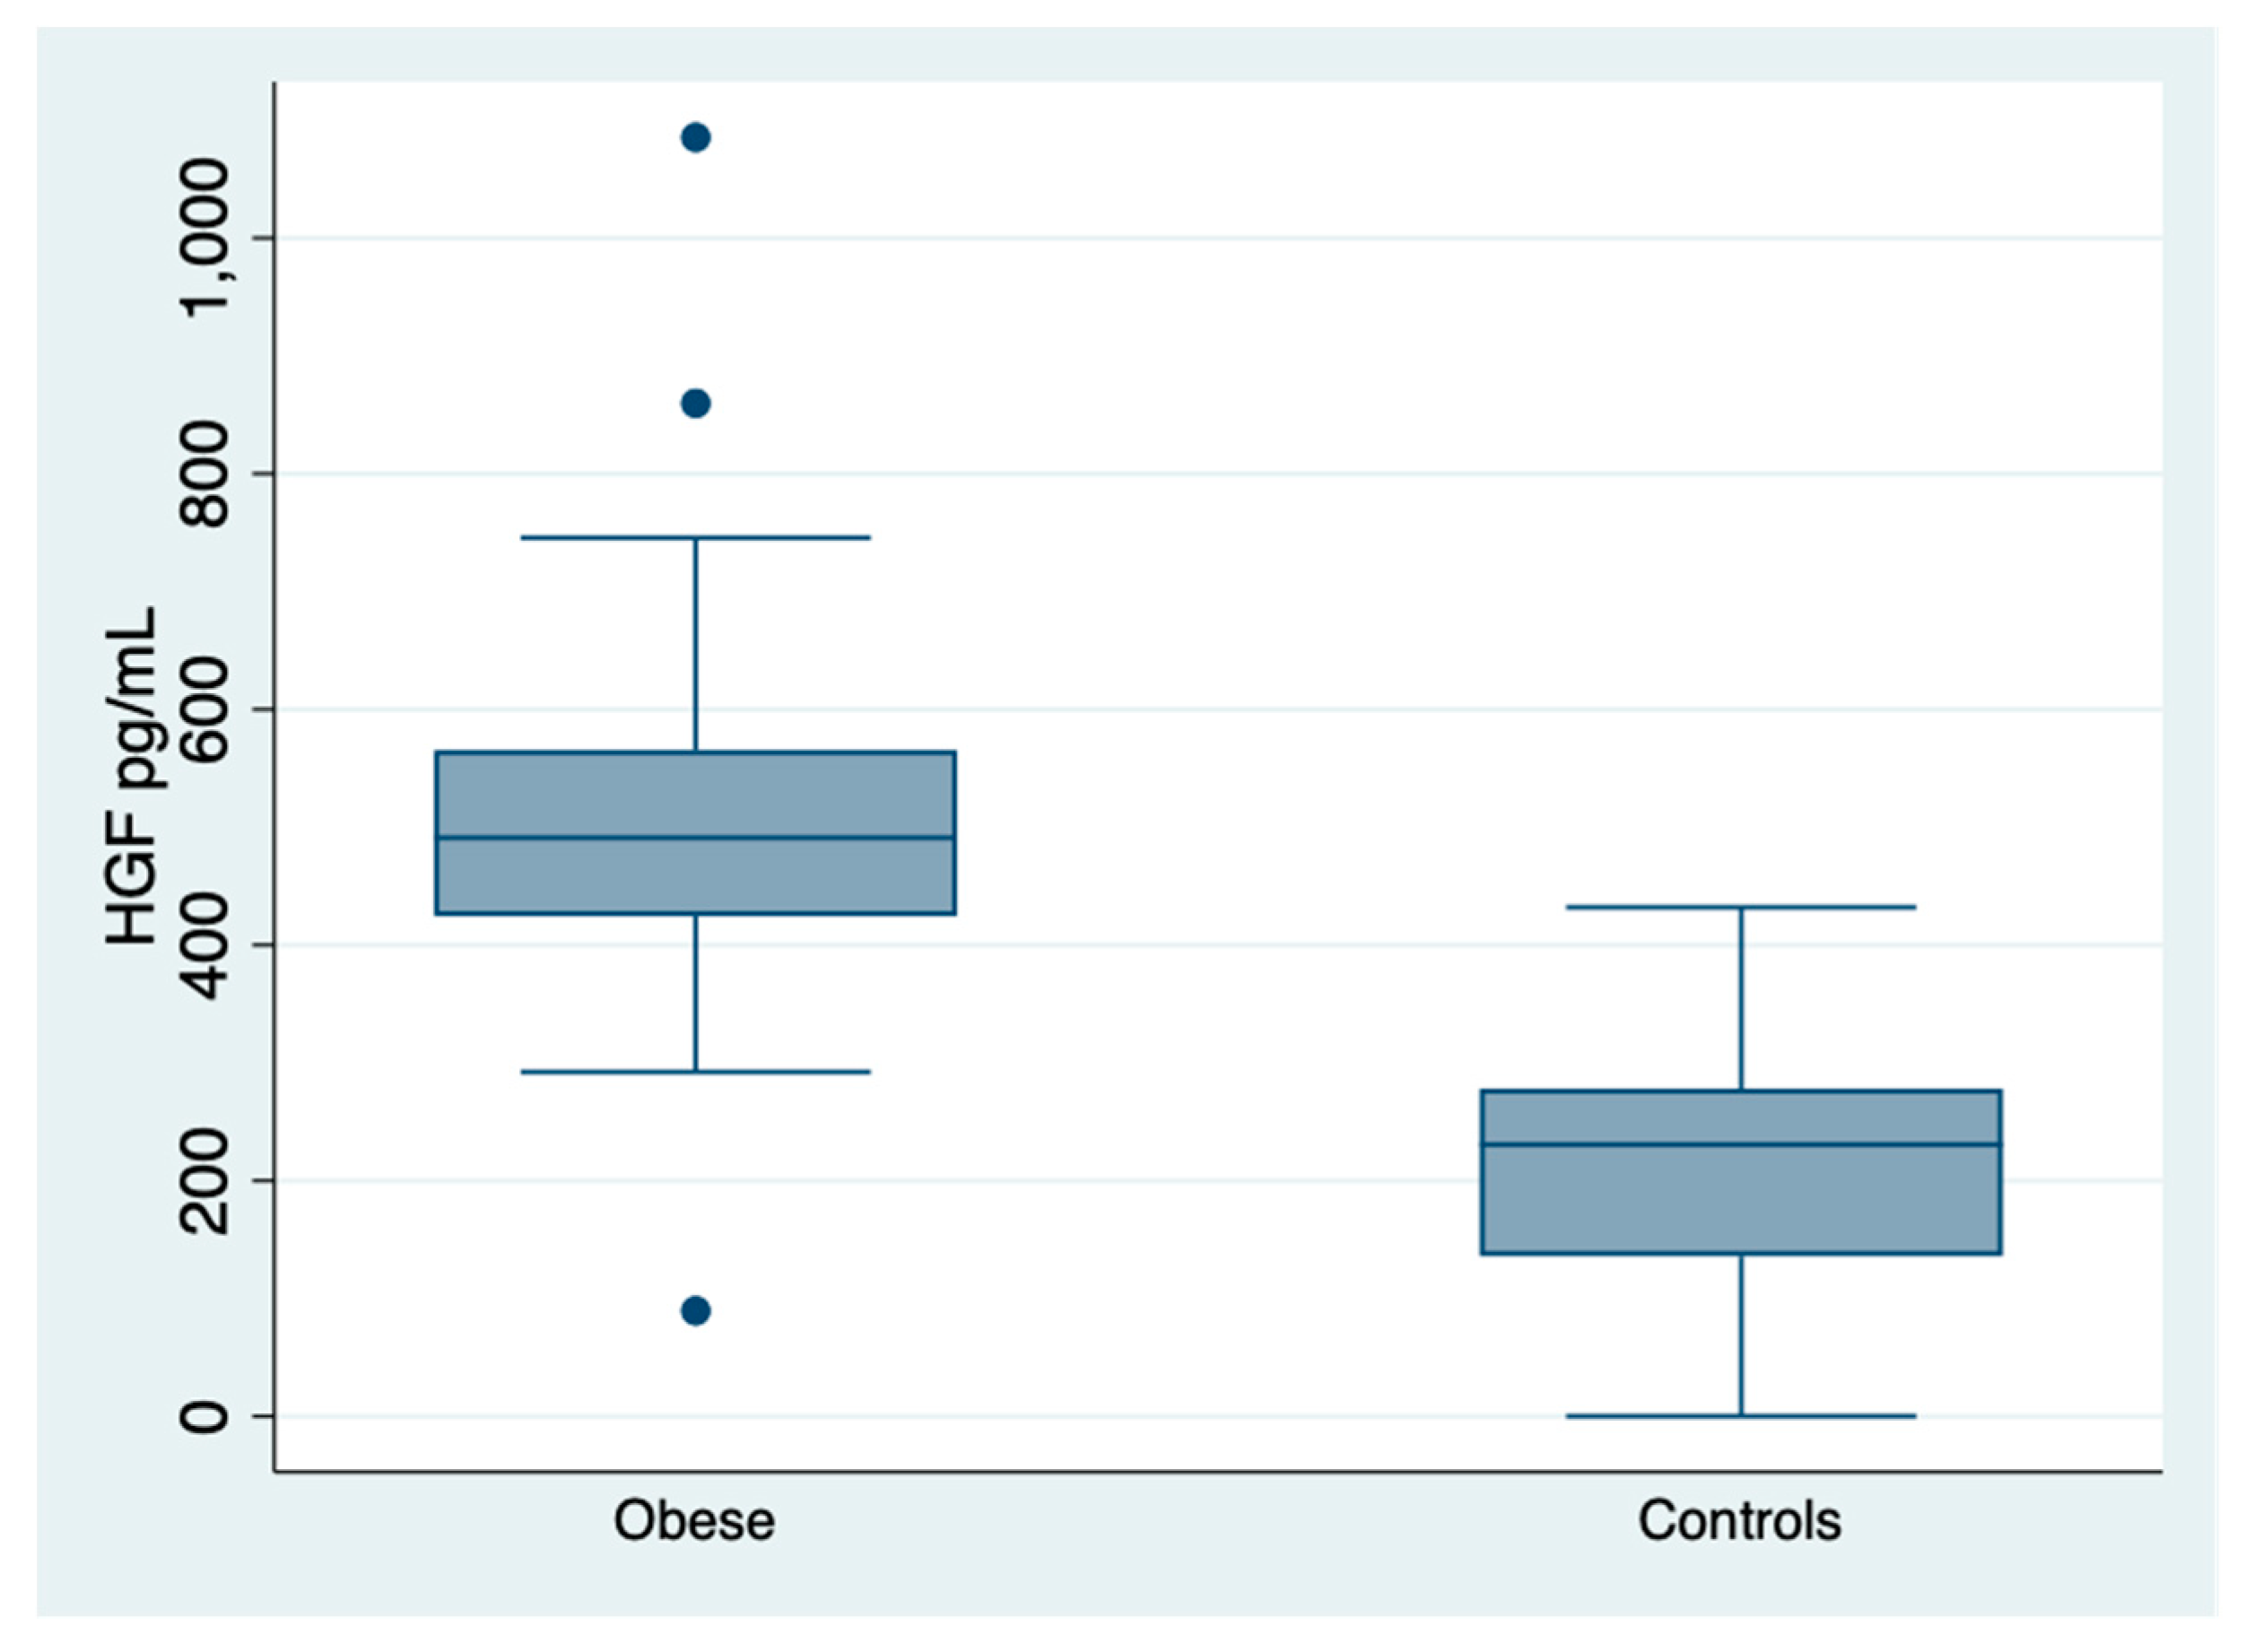
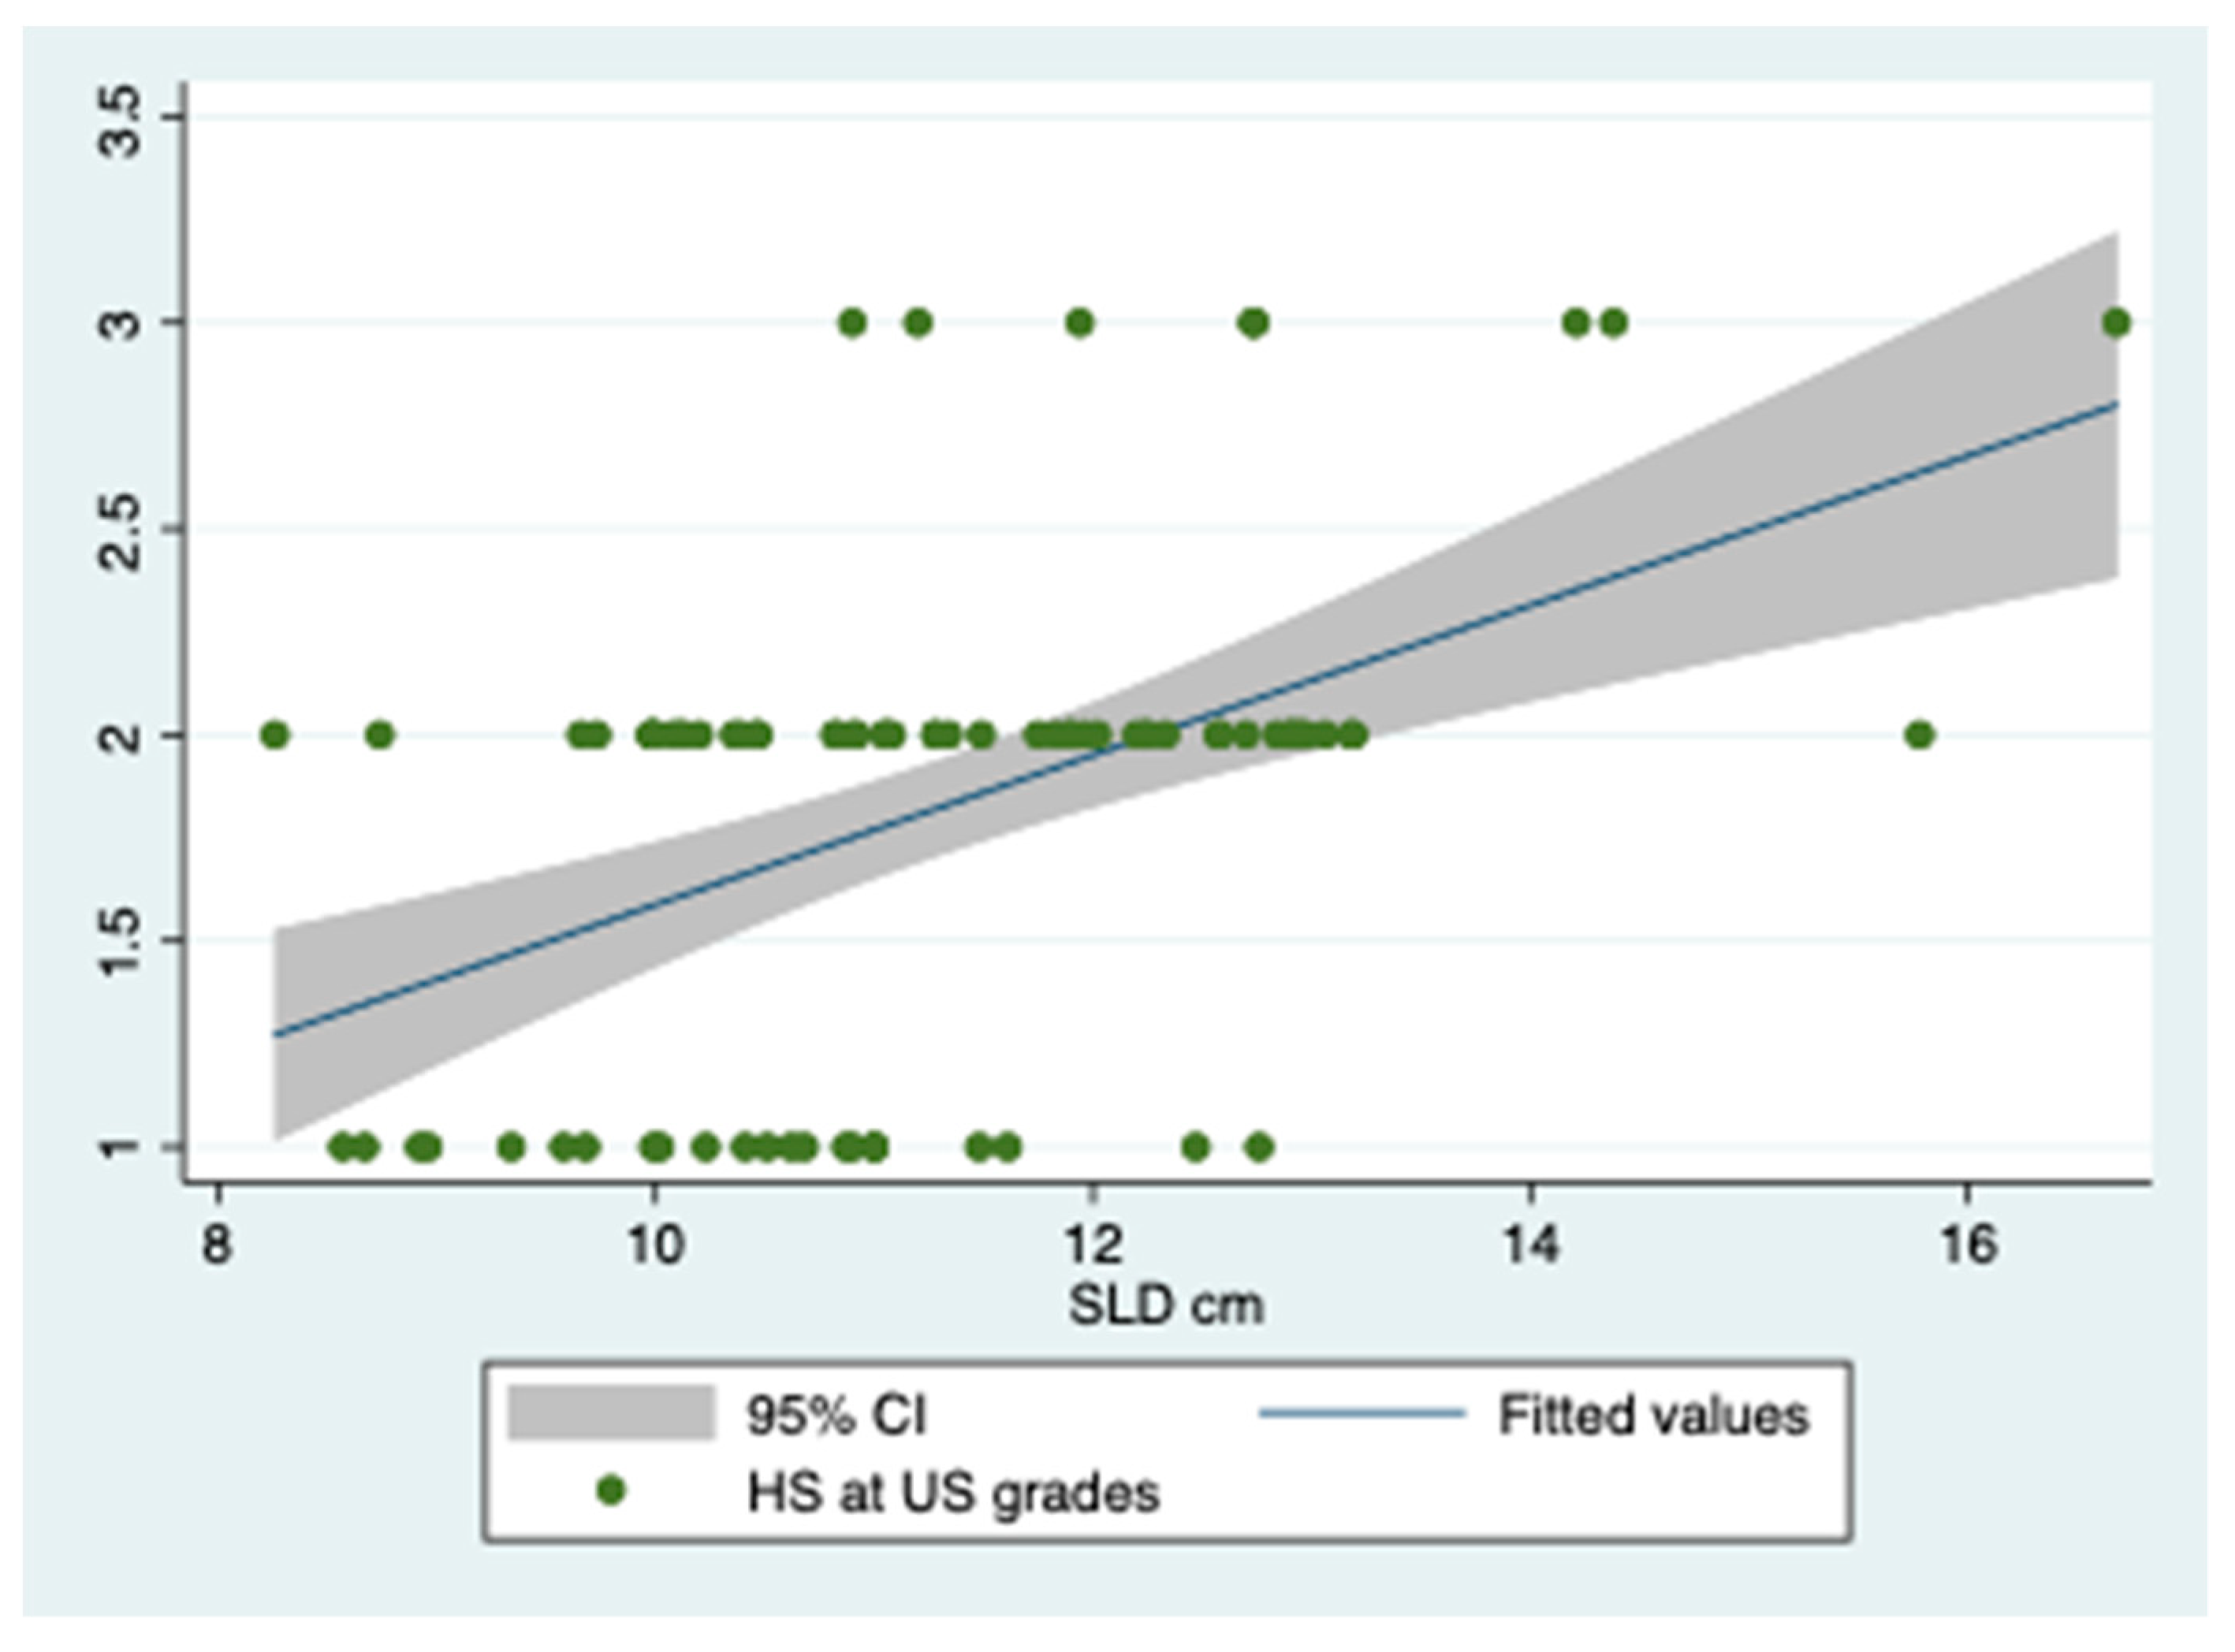
3.2. Predictions
4. Discussion
5. Limitations
6. Conclusions
7. Future Directions
Author Contributions
Conflicts of Interest
References
- Chawla, A. The immune system as a sensor of the metabolic state. Immunity 2013, 8, 644–654. [Google Scholar]
- Ravussin, E.; Lillioja, S.; Knowler, W.C.; Christin, L.; Freymond, D.; Abbott, W.G.; Boyce, V.; Howard, B.V.; Bogardus, C. Reduced rate of energy expenditure as a risk factor for body-weight gain. N. Engl. J. Med. 1988, 318, 467–472. [Google Scholar] [CrossRef] [PubMed]
- Carneiro, I.P.; Elliott, S.A.; Siervo, M.; Padwal, R.; Bertoli, S.; Battezzati, A.; Prado, C.M. Is Obesity Associated with Altered Energy Expenditure? Adv. Nutr. 2016, 7, 476–487. [Google Scholar] [CrossRef] [PubMed]
- Lazzer, S.; Bedogni, G.; Lafortuna, C.L.; Marazzi, N.; Busti, C.; Galli, R.; De Col, A.; Agosti, F.; Sartorio, A. Relationship between basal metabolic rate, gender, age, and body composition in 8,780 white obese subjects. Obesity 2010, 18, 71–78. [Google Scholar] [CrossRef] [PubMed]
- Bouchard, C.; Blair, S.N. Introductory comments for the consensus on physical activity and obesity. Med. Sci. Sports Exerc. 1999, 31, S498–S501. [Google Scholar] [CrossRef] [PubMed]
- Tarantino, G.; Marra, M.; Contaldo, F.; Pasanisi, F. Basal metabolic rate in morbidly obese patients with non-alcoholic fatty liver disease. Clin. Investig. Med. 2008, 3, E24–E29. [Google Scholar] [CrossRef]
- De Aquino, E.A., Jr.; Carbinatto, F.M.; Moriyama, L.T.; Bagnato, V.S. Regression of Non-Alcoholic Fatty Liver by Metabolic Reduction: Phototherapy in Association with Aerobic Plus Resistance Training In Obese Man—A Pilot Study. J. Obes. Weight Loss Ther. 2018, 8, 61. [Google Scholar]
- Javed, F.; He, Q.; Davidson, E.L.; Thornton, C.J.; Albu, J.; Boxt, L.; Krasnow, N.; Elia, M.; Kang, P.; Heshka, S.; et al. Brain and high metabolic rate organ mass: Contributions to resting energy expenditure beyond fat-free mass. Am. J. Clin. Nutr. 2010, 91, 907–912. [Google Scholar] [CrossRef] [PubMed]
- Altunkaynak, B.Z.; Ozbek, E.; Altunkaynak, M.E. A stereological and histological analysis of spleen on obese female rats, fed with high fat diet. Saudi Med. J. 2007, 28, 353–357. [Google Scholar] [PubMed]
- Benter, T.; Klühs, L.; Teichgräber, U. Sonography of the spleen. J. Ultrasound Med. 2011, 30, 1281–1293. [Google Scholar] [CrossRef]
- Kim, E.J.; Kim, S.; Kang, D.O.; Seo, H.S. Metabolic activity of the spleen and bone marrow in patients with acute myocardial infarction evaluated by 18f-fluorodeoxyglucose positron emission tomograpic imaging. Cardiovasc. Imaging 2014, 7, 454–560. [Google Scholar] [CrossRef] [PubMed]
- Dutta, P.; Courties, G.; Wei, Y.; Leuschner, F.; Gorbatov, R.; Robbins, C.S.; Iwamoto, Y.; Thompson, B.; Carlson, A.L.; Heidt, T.; et al. Myocardial infarction accelerates atherosclerosis. Nature 2012, 487, 325–329. [Google Scholar] [CrossRef] [PubMed]
- Swirski, F.K.; Nahrendorf, M.; Etzrodt, M.; Wildgruber, M.; Cortez-Retamozo, V.; Panizzi, P.; Figueiredo, J.L.; Kohler, R.H.; Chudnovskiy, A.; Waterman, P.; et al. Identification of splenic reservoir monocytes and their deployment to inflammatory sites. Science 2009, 325, 612–616. [Google Scholar] [CrossRef] [PubMed]
- Emami, H.; Singh, P.; MacNabb, M.; Vucic, E.; Lavender, Z.; Rudd, J.H.; Fayad, Z.A.; Lehrer-Graiwer, J.; Korsgren, M.; Figueroa, A.L.; et al. Splenic metabolic activity predicts risk of future cardiovascular events: Demonstration of a cardiosplenic axis in humans. JACC Cardiovasc. Imaging 2015, 8, 121–130. [Google Scholar] [CrossRef] [PubMed]
- Tarantino, G.; Colicchio, P.; Conca, P.; Finelli, C.; Di Minno, M.N.; Tarantino, M.; Capone, D.; Pasanisi, F. Young adult obese subjects with and without insulin resistance: What is the role of chronic inflammation and how to weigh it non-invasively? J. Inflamm. 2009, 6, 6. [Google Scholar] [CrossRef] [PubMed]
- Tarantino, G.; Conca, P.; Pasanisi, F.; Ariello, M.; Mastrolia, M.; Arena, A.; Tarantino, M.; Scopacasa, F.; Vecchione, R. Could inflammatory markers help diagnose nonalcoholic steatohepatitis? Eur. J. Gastroenterol. Hepatol. 2009, 21, 504–511. [Google Scholar] [CrossRef] [PubMed]
- Suzuki, S.; Yamanouchi, K.; Soeta, C.; Katakai, Y.; Harada, R.; Naito, K.; Tojo, H. Skeletal muscle injury induces hepatocyte growth factor expression in spleen. Biochem. Biophys. Res. Commun. 2002, 292, 709–714. [Google Scholar] [CrossRef] [PubMed]
- Kono, S.; Nagaike, M.; Matsumoto, K.; Nakamura, T. Marked induction of hepatocyte growth factor induction mRNA in intact kidney and spleen in response to injury of distant organs. Biochem. Biophys. Res. Commun. 1992, 186, 991–998. [Google Scholar] [CrossRef]
- Skibinski, G.; Skibinska, A.; James, K. The role of hepatocyte growth factor and its receptor c-met in interactions between lymphocytes and stromal cells in secondary human lymphoid organs. Immunology 2001, 102, 506–514. [Google Scholar] [CrossRef]
- Yang, Z.J.; Zhang, Y.R.; Chen, B.; Zhang, S.L.; Jia, E.Z.; Wang, L.S.; Zhu, T.B.; Li, C.J.; Wang, H.; Huang, J.; et al. Phase I clinical trial on intracoronary administration of Ad-hHGF treating severe coronary artery disease. Mol. Biol. Rep. 2009, 36, 1323–9132. [Google Scholar] [CrossRef]
- Hahn, W.; Pyun, W.B.; Kim, D.S.; Yoo, W.S.; Lee, S.D.; Won, J.H.; Shin, G.J.; Kim, J.M.; Kim, S. Enhanced cardioprotective effects by coexpression of two isoforms of hepatocyte growth factor from naked plasmid DNA in a rat ischemic heart disease model. J. Gene. Med. 2011, 13, 549–555. [Google Scholar] [CrossRef] [PubMed]
- Komarowska, I.; Coe, D.; Wang, G.; Haas, R.; Mauro, C.; Kishore, M.; Cooper, D.; Nadkarni, S.; Fu, H.; Steinbruchel, D.A.; et al. Hepatocyte Growth Factor Receptor c-Met Instructs T Cell Cardiotropism and Promotes T Cell Migration to the Heart via Autocrine Chemokine Release. Immunity 2016, 42, 1087–1099. [Google Scholar] [CrossRef] [PubMed]
- Rychli, K.; Richter, B.; Hohensinner, P.J.; Kariem Mahdy, A.; Neuhold, S.; Zorn, G.; Berger, R.; Mörtl, D.; Huber, K.; Pacher, R.; et al. Hepatocyte growth factor is a strong predictor of mortality in patients with advanced heart failure. Heart 2011, 97, 1158–1163. [Google Scholar] [CrossRef] [PubMed]
- Balaban, Y.H.; Sumer, H.; Simsek, H.; Us, D.; Tatar, G. Metabolic syndrome, non-alcoholic steatohepatitis (NASH), and hepatocyte growth factor (HGF). Ann. Hepatol. 2006, 5, 109–114. [Google Scholar] [CrossRef]
- Lichtenauer, M.; Franz, M.; Fritzenwanger, M.; Figulla, H.R.; Gerdes, N.; Jung, C. Elevated plasma levels of interleukin-12p40 and interleukin-16 in overweight adolescents. Biomed. Res. Int. 2015, 2015, 940910. [Google Scholar] [CrossRef] [PubMed]
- Chupp, G.L.; Wright, E.A.; Wu, D.; Vallen-Mashikian, M.; Cruikshank, W.W.; Center, D.M.; Kornfeld, H.; Berman, J.S. Tissue and T cell distribution of precursor and mature IL-16. J. Immunol. 1998, 161, 3114–3119. [Google Scholar]
- Jana, M.; Pahan, K. IL-12 p40 homodimer, but not IL-12 p70, induces the expression of IL-16 in microglia and macrophages. Mol. Immunol. 2009, 46, 773–783. [Google Scholar] [CrossRef] [PubMed]
- Cooper, A.M.; Khader, S.A. IL-12p40: An inherently agonistic cytokine. Trends Immunol. 2007, 28, 33–38. [Google Scholar] [CrossRef]
- The International Committee of Medical Journal Editors (ICMJE) at Overlapping Publication. Available online: http://www.icmje.org/recommendations/browse/publishing-and-editorial-issues/overlapping-publications.html (accessed on 27 August 2019).
- Tarantino, G.; Costantini, S.; Finelli, C.; Capone, F.; Guerriero, E.; La Sala, N.; Gioia, S.; Castello, G. Carotid Intima-Media Thickness Is Predicted by Combined Eotaxin Levels and Severity of Hepatic Steatosis at Ultrasonography in Obese Patients with Nonalcoholic Fatty Liver Disease. PLoS ONE 2014, 9, e105610. [Google Scholar] [CrossRef]
- Matthews, D.R.; Hosker, J.P.; Rudenski, A.S.; Naylor, B.A.; Treacher, D.F.; Turner, R.C. Homeostasis model assessment: Insulin resistance and beta-cell function from fasting plasma glucose and insulin concentrations in man. Diabetologia 1985, 28, 412–419. [Google Scholar] [CrossRef]
- Harrison, S.A.; Oliver, D.; Arnold, H.L.; Gogia, S.; Neuschwander-Tetri, B.A. Development and validation of a simple NAFLD clinical scoring system for identifying patients without advanced disease. Gut 2008, 57, 1441–1447. [Google Scholar] [CrossRef] [PubMed]
- Webb, M.; Yeshua, H.; Zelber-Sagi, S.; Santo, E.; Brazowski, E.; Halpern, Z.; Oren, R. Diagnostic value of a computerized hepatorenal index for sonographic quantification of liver steatosis. AJR Am. J. Roentgenol. 2009, 192, 909–914. [Google Scholar] [CrossRef] [PubMed]
- Tarantino, G.; Costantini, S.; Finelli, C.; Capone, F.; Guerriero, E.; La Sala, N.; Gioia, S.; Castello, G. Is serum Interleukin-17 associated with early atherosclerosis in obese patients? J. Transl. Med. 2014, 12, 214. [Google Scholar] [CrossRef] [PubMed]
- Stein, J.H.; Korcarz, C.E.; Hurst, R.T.; Lonn, E.; Kendall, C.B.; Mohler, E.R.; Najjar, S.S.; Rembold, C.M.; Post, W.S. American Society of Echocardiography Carotid Intima-Media Thickness Task Force. Use of carotid ultrasound to identify subclinical vascular disease and evaluate cardiovascular disease risk: A consensus statement from the American Society of Echocardiography Carotid Intima-Media Thickness Task Force. Endorsed by the Society for Vascular Medicine. J. Am. Soc. Echocardiogr. 2008, 21, 93–111. [Google Scholar] [PubMed]
- Schutz, Y.; Kyle, U.U.G.; Pichard, C. Fat-free mass index and fat mass index percentiles in caucasians aged 18–98 y. Int. J. Obes. 2002, 26, 953–960. [Google Scholar] [CrossRef] [PubMed]
- What Is Difference between Endogeneous and Exogeneous Variables? Available online: http://wwwpersonal.umd.umich.edu/~delittle/Encyclopedia%20entries/Endogenous%20variable.htm (accessed on 27 August 2019).
- Normal Physiological Levels of Human Cytokines Using Bio-Plex Pro™ Cytokine Assays. Available online: http://www.bio-rad.com/webroot/web/pdf/lsr/literature/Bulletin_6029.pdf (accessed on 27 August 2019).
- Lee, J.K.; Shim, J.H.; Lee, H.C.; Lee, S.H.; Kim, K.M.; Lim, Y.S.; Chung, Y.H.; Lee, Y.S.; Suh, D.J. Estimation of the healthy upper limits for serum alanine aminotransferase in Asian populations with normal liver histology. Hepatology 2010, 51, 1577–1583. [Google Scholar] [CrossRef]
- Goossens, G.H. The Metabolic Phenotype in Obesity: Fat Mass, Body Fat Distribution, and Adipose Tissue Function. Obes. Facts. 2017, 10, 207–215. [Google Scholar] [CrossRef]
- Domínguez-Pérez, M.; Nuño-Lámbarri, N.; Clavijo-Cornejo, D.; Luna-López, A.; Souza, V.; Bucio, L.; Miranda, R.U.; Muñoz, L.; Gomez-Quiroz, L.E.; Uribe-Carvajal, S.; et al. Hepatocyte Growth Factor Reduces Free Cholesterol-Mediated Lipotoxicity in Primary Hepatocytes by Countering Oxidative Stress. Oxid. Med. Cell Longev. 2016, 2016, 7960386. [Google Scholar] [CrossRef]
- Kroy, D.C.; Schumacher, F.; Ramadori, P.; Hatting, M.; Bergheim, I.; Gassler, N.; Boekschoten, M.V.; Müller, M.; Streetz, K.L.; Trautwein, C. Hepatocyte specific deletion of c-Met leads to the development of severe non-alcoholic steatohepatitis in mice. J. Hepatol. 2014, 61, 883–890. [Google Scholar] [CrossRef]
- Oliveira, A.G.; Araújo, T.G.; Carvalho, B.M.; Rocha, G.Z.; Santos, A.; Saad, M.J.A. The Role of Hepatocyte Growth Factor (HGF) in Insulin Resistance and Diabetes. Front. Endocrinol. 2018, 9, 503. [Google Scholar] [CrossRef]
- Muratsu, J.; Iwabayashi, M.; Sanada, F.; Taniyama, Y.; Otsu, R.; Rakugi, H.; Morishita, R. Hepatocyte Growth Factor Prevented High-Fat Diet-Induced Obesity and Improved Insulin Resistance in Mice. Sci. Rep. 2017, 7, 130. [Google Scholar] [CrossRef] [PubMed]
- Purzycka-Bohdan, D.; Szczerkowska-Dobosz, A.; Zablotna, M.; Wierzbicka, J.; Piotrowska, A.; Zmijewski, M.A.; Nedoszytko, B.; Nowicki, R. Assessment of Interleukin 16 Serum Levels and Skin Expression in Psoriasis Patients in Correlation with Clinical Severity of the Disease. PLoS ONE 2016, 11, e0165577. [Google Scholar] [CrossRef]
- Balato, N.; Napolitano, M.; Ayala, F.; Patruno, C.; Megna, M.; Tarantino, G. Nonalcoholic fatty liver disease, spleen and psoriasis: New aspects of low-grade chronic inflammation World. J. Gastroenterol. 2015, 21, 6892–6897. [Google Scholar] [CrossRef] [PubMed]
- Schernthaner, C.; Paar, V.; Wernly, B.; Pistulli, R.; Rohm, I.; Jung, C.; Figulla, H.R.; Yilmaz, A.; Cadamuro, J.; Haschke-Becher, E.; et al. Elevated plasma levels of interleukin-16 in patients with acute myocardial infarction. Medicine 2017, 96, e8396. [Google Scholar] [CrossRef] [PubMed]
- Elssner, A.; Doseff, A.I.; Duncan, M.; Kotur, M.; Wewers, M.D. IL-16 is constitutively present in peripheral blood monocytes and spontaneously released during apoptosis. J. Immunol. 2004, 172, 7721–7725. [Google Scholar] [CrossRef] [PubMed]
- Kim, Y.; Chang, Y.; Cho, Y.K.; Ahn, J.; Shin, H.; Ryu, S. Metabolic healthy versus unhealthy obesity and risk of fibrosis progression in non-alcoholic fatty liver disease. Liver Int. 2019. 21 June Epub ahead of print. [Google Scholar] [CrossRef]
- Johnstone, A.M.; Murison, S.D.; Duncan, J.S.; Rance, K.A.; Speakman, J.R. Factors influencing variation in basal metabolic rate include fat-free mass, fat mass, age, and circulating thyroxine but not sex, circulating leptin, or triiodothyronine. Am. J. Clin. Nutr. 2005, 82, 941–948. [Google Scholar] [CrossRef]


| Age (Years) | 46 (34–53) | Gender Males/Females n | 36/44 |
|---|---|---|---|
| Obesity classes I/II/III n | 8/26/46 | CRP | 0.56 (0.27–1.3) |
| MS (APT III) yes/not | 51/29 | HGF pg/mL | 491 (425–565) |
| MS (ID) yes/not | 51/29 | IL-12p40 pg/mL | 234 (130–317) |
| HS at US grade1/2/3 | 22/50/8 | IL-6 pg/mL | 5.7 (2.3–17-5) |
| BARD > 2 Males/Females n | 9/27 | T2DM n | 18 |
| SLD at US cm | 11 (10.1–12.4) | HOMA | 2.75 (1.9–4.7) |
| BMR kcal/24 h | 2220 (1770–2439) | Hypertension n | 4 |
| FFM % | 56 (49–67) | Cholesterol mg/dL | 191 ± 36 |
| FM % | 52 ± 7.5 | IMT mm | 0.9 (0.7–1.1) |
| RMR/FFM kcal/24 h*kg of body | 39 (34–43) | PChe U/L | 9605 (8300–10876) |
| ALT (Males) U/L | 36.5 (27–41) | ALT (Females) U/L | 23 (17–31) |
| AST (Males) U/L | 24 (21–27) | AST (Females) U/L | 20 (16–23) |
| G-GT mu/L | 25 (16–42) | AP mu/L | 73 (61–91.5) |
| Frequency Table | Pearson Chi-Squared = 4.838 | Pr = 0.089 | ||||
|---|---|---|---|---|---|---|
| Obesity class | MS | |||||
| Not | Yes | Total | ||||
| I | n | 4 | 4 | 8 | ||
| % | 13.79 | 7.84 | 10.00 | |||
| II | n | 13 | 13 | 26 | ||
| 44.83 | 25.49 | 46 | ||||
| III | n | 12 | 34 | 32.50 | ||
| % | 41.3 | 66.67 | 57.50 | |||
| Total | n | 29 | 51 | 80 | ||
| Multinomial logistic regression | ||||||
| Number of obs = 80 | Prob > chi-squared = 0.089 | |||||
| d.v. | Obesity class | Coef. | Std. Err. | z | p >|z| | (95% Conf. Interval) |
| I | ||||||
| i.v. | MS | −1.041 | 0.782780 | −1.33 | 0.183 | −2.576/0.493 |
| II | ||||||
| i.v. | MS | −1.041 | 0.516 | −2.02 | 0.044 | −2.053/0.029 |
| III | (base outcome) | |||||
| Linear Regression, Robust | |||||
| Number of obs = 80 | R-squared = 0.271 | ||||
| d.v. BMR | Coef. | Std. Err. | t | p > |t| | (95% Conf. Interval) |
| i.v. SLD | 144.508 | 27.801 | 5.20 | <0.001 | 89.161/199.855 |
| Linear Regression, Robust | |||||
| Number of obs = 80 | R-squared = 0.143 | ||||
| d.v. FFM | Coef. | Std. Err. | t | p > |t| | (95% Conf. Interval) |
| i.v. SLD | 3.348 | 1.146 | 2.92 | 0.005 | 1.068/5.60 |
| Linear Regression, Robust | |||||
| Number of obs = 80 | R-squared = 0.006 | ||||
| d.v. RMR/FFM | Coef | Std. Err. | t | p > |t| | (95% Conf. Interval) |
| i.v. SLD | 0.3519 | 0.496 | 0.71 | 0.480 | −0.636/1.339 |
| Linear Regression, Robust | |||||
| Number of obs = 80 | R-squared = 0.005 | ||||
| d.v. FF | Coef. | Std. Err. | t | p > |t| | (95% Conf. Interval) |
| i.v. SLD | −0.357 | 0.503 | −0.71 | 0.479 | −1.358/0.643 |
| Linear Regression, Robust | |||||
| Number of obs = 78 | R-squared = 0.089 | ||||
| d.v. BMR | Coef. | Std. Err. | t | p > |t| | (95% Conf. Interval) |
| i.v. IL-16| | 2.117 | 0323677 | 2.89 | 0.005 | 0.658/3.576 |
| Linear Regression, Robust | |||||
| Number of obs = 78 | R-squared = 0.006 | ||||
| d.v. BMR | Coef. | Std. Err. | t | p > |t| | (95% Conf. Interval) |
| i.v. IL-2p40 | −0.242 | 0.444 | −0.55 | 0.587 | −1.127/0.642 |
| Linear Regression, Robust | |||||
| Number of obs = 80, | R-squared = 0.003 | ||||
| d.v. IMT | Coef. | Std. Err. | t | p > |t| | (95% Conf. Interval) |
| i.v. SLD | −0.001 | 0.002 | −0.54 | 0.594 | −0.00/0.003 |
| Linear Regression, Robust | |||||
| Number of OBS = 80 | R-squared = 0.007 | ||||
| d.v. IMT | Coef. | Std. Err. | t | p > |t| | (95% Conf. Interval) |
| i.v. FFM | 0.0002 | 0.0003 | 0.72 | 0.473 | −0.0002/0.008 |
| Linear Regression, Robust | |||||
| Number of obs = 80 | R-squared = 0.0002 | ||||
| d.v. IMT | Coef. | Std. Err. | t | p > |t| | (95% Conf. Interval) |
| i.v. MBR | −1.09 × 10⁻⁶ | 8.58 × 10⁻⁶ | −0.13 | 0.899 | −0.00001/0.00002 |
| Linear Regression, Robust | |||||
| Number of obs = 80 | R-squared = 0.079 | ||||
| IMT | Coef. | Std. Err. | t | p > |t| | (95% Conf. Interval) |
| FF | 0.001 | 0.0005 | 2.43 | 0.017 | 0.0002/0.002 |
| Linear Regression, Robust | |||||
| Number of obs = 80 | R-squared = 0.015 | ||||
| IMT | Coef. | Std. Err. | t | p > |t| | (95% Conf. Interval) |
| RMR/FFM | −0.0006 | 0.0005 | −1.26 | 0.211 | −0.001/0.0003 |
| Linear Regression, Robust | |||||
| Number of obs = 78 | R-squared = 0.009 | ||||
| d.v. IMT | Coef. | Std. Err. | t | p > |t| | (95% Conf. Interval) |
| i.v. HGF | 0.00002 | 0.00004 | 0.70 | 0.488 | −0.00005/0.0001 |
| Linear Regression, Robust | |||||
| Number of obs = 78 | R-squared = 0.0005 | ||||
| d.v. IMT | Coef. | Std. Err. | t | p > |t| | (95% Conf. Interval) |
| i.v. IL-16 | 0.00001 | 0.00005 | 0.26 | 0.796 | −0.00008/0.0001 |
| Linear Regression, Robust | |||||
| Number of obs = 78 | R-squared = 0.005 | ||||
| d.v. IMT | Coef. | Std. Err. | t | p > |t| | (95% Conf. Interval) |
| i.v. IL-2p40 | −0.00002 | 0.00003 | −0.58 | 0.566 | −0.00008/0.00004 |
| Linear Regression, Robust | |||||
| Number of obs = 78 | R-squared = 0.086 | ||||
| d.v. SLD | Coef. | Std. Err. | t | p > |t| | (95% Conf. Interval) |
| i.v. HGF | 0.003 | 0.002 | 2.09 | 0.04 | 0.0001/0.006 |
| Linear Regression, Robust | |||||
| Number of obs = 78 | R-squared = 0.095 | ||||
| d.v. HGF | Coef. | Std. Err. | t | p > |t| | (95% Conf. Interval) |
| i.v. IL-16 | 0.680 | 0.315 | 2.16 | 0.034 | 0.052/1.307 |
| Linear Regression, Robust | |||||
| Number of obs = 78 | R-squared = 0.060 | ||||
| d.v. HGF | Coef. | Std. Err. | t | p > |t| | (95% Conf. Interval) |
| i.v. IL-12p40 | 0.234 | 0.137 | 1.71 | 0.091 | −0.038/0.507 |
| Extended Linear Regression | |||||
|---|---|---|---|---|---|
| Number of Obs = 78 | Wald Chi-Squared (1) = 4.00 | Prob > Chi-Squared = 0.005 | |||
| Coef. | Std. Err. | z | p > |z| | (95% Conf. Interval) | |
| d.v. BMR | |||||
| i.v. HGF | 3.114 | 1.558 | 2.00 | 0.046 | 0.061/6.168 |
| i.v. HGF | |||||
| e.v IL-16 | 0.680 | 0.237 | 2.87 | 0.004 | 0.215/1.144 |
| var(e.BMR) | 324139.1 | 164015.7 | ----- | ----- | 120232.0/873861.8 |
| var(e.HGF) | 16214.72 | 2596.422 | ----- | ----- | 11847.0/22192.7 |
| corr(e.HGF, | |||||
| e.BMR)| | −0.6887355 | 0.1925947 | −3.58 | <0.001 | −0.916/−0.127 |
| Regression | |||||
|---|---|---|---|---|---|
| Number of Obs = 78 | Wald Chi-Squared (1) = 5.65 | Prob > Chi-Squared = 0.017 | |||
| Coef. | Std. Err. | z | p > |z| | (95% Conf. Interval) | |
| d.v. BMR | |||||
| i.v. HGF | 5.834 | 2.457 | 2.38 | 0.017 | 1.022/10. 653 |
| HGF | 0 (omitted) | ||||
| i.v. HGF | |||||
| e.v. SLD | 25.922 | 9.548 | 2.71 | 0.007 | 7.208−44.636 |
| var(e.BMR) | 729,014.7 | 499,010.4 | ----- | ----- | 190,585.2/2,788,583.0 |
| var(e.HGF) | 16,380.95 | 2622.96 | ----- | ----- | 11,968.58/22,420.0 |
| corr (e.HGF, | |||||
| e.BMR) | −0.904 | 0.071 | −12.79 | <0.001 | −0.978/0.627 |
| Ordered Probit Regression, Robust | |||||
| Number of obs = 80 | Pseudo R-squared = 0.148 | ||||
| d.v. HS at US| | Coef. | Std. Err. | z | p > |z| | (95% Conf. Interval) |
| i.v. SLD | 0.428 | 0.095 | 4.48 | <0.001 | 0.241/0.615 |
| Ordered Probit Regression, Robust | |||||
| Number of obs = 80 | Pseudo R-squared = 0.112 | ||||
| d.v. HS at US | Coef. | Std. Err. | z | p > |z| | (95% Conf. Interval) |
| i.v. BMR | 0.001 | 0.0003 | 3.86 | <0.001 | 0.0006/0.002 |
| Ordered Probit Regression, Robust | |||||
| Number of obs = 78 | Pseudo R-squared = 0.005 | ||||
| d.v. HS at US | Coef. | Std. Err. | z | p > |z| | (95% Conf. Interval) |
| i.v. IL-16 | 0.002 | 0.002 | 1.00 | 0.318 | 0.002/0.005 |
| Ordered Probit Regression, Robust | |||||
| Number of obs = 78 | Pseudo R-squared = 0.004 | ||||
| d.v. HS at US | Coef. | Std. Err. | z | p > |z| | (95% Conf. Interval) |
| i.v. IL-12p40 | −0.0007 | 0.0009 | −0.81 | 0.420 | −0.002/0.001 |
| Extended Linear Regression | |||||
|---|---|---|---|---|---|
| Number of Obs = 80 | Wald Chi-Sqaured (1) = 16.21 | Prob > Chi-Squared = 0.0001 | |||
| Coef. | Std. Err. | z | p > |z| | (95% Conf. Interval) | |
| d.v. HS at US | |||||
| i.v. SLD | 0.308 | 0.076 | 4.03 | <0.001 | 0.158/0.458 |
| i.v SLD | 0 (omitted) | ||||
| i.v. SLD | |||||
| e.v. BMR | 0.002 | 0.0003 | 5.45 | <0.001 | 0.001/0.002 |
| var(e.HS) | 0.304 | 0.067 | ----- | ----- | 0.197/0.467 |
| Extended Linear Regression. | |||||
|---|---|---|---|---|---|
| Number of Obs = 80 | Wald Chi-Squared (1) = 4.44 | Prob > Chi-Squared = 0.035 | |||
| Coef. | Std. Err. | z | p > |z| | (95% Conf. Interval) | |
| d.v. HS at US | |||||
| i.v. SLD | 7.437 | 3.528 | 2.11 | 0.035 | 0.522/14.353 |
| SLD | 0 (omitted) | ||||
| i.v. SLD | |||||
| e.v. IL-6 | 0.0003 | 0.0004 | 0.71 | 0.479 | −0.0005/−0.001 |
| var(e.HS) | 126.483 | 121.119 | ----- | ------ | 19.361/826.291 |
| var(e.SLD) | 2.397 | 0.379 | ----- | ------- | 1.758/3.268 |
| corr(e.SLD) | |||||
| (e.HS) | −0.9989576 | 0.000985 | −1014.18 | <0.001 | −0.999/0.993 |
| Logistic Regression | |||||
| Number of obs = 78 | Prob > chi-squared = 0.244 | ||||
| d.v. BARD | Odds Ratio | Std. Err. | z | p > |z| | (95% Conf. Interval) |
| i.v. HGF | 0.998 | 0.002 | −1.12 | 0.261 | 0.994/1.002 |
| Logistic Regression | |||||
| Number of obs = 80 | Prob > chi-squared = 0.046 | ||||
| d.v. BARD | Odds Ratio | Std. Err. | z | p > |z| | (95% Conf. Interval) |
| i.v. SLD | 0.730 | 0.121 | −1.89 | 0.058 | 0.527/1.011 |
| Logistic Regression | |||||
| Number of obs = 80 | Prob > chi-squared = 0.023 | ||||
| d.v. BARD | Odds Ratio | Std. Err. | z | p > |z| | (95% Conf. Interval) |
| i.v. BMR | 0.999 | 0.0006 | −2.14 | 0.032 | 0.997/0.999 |
| Logistic Regression | |||||
| Number of obs = 80 | Prob > chi-squared = 0.019 | ||||
| d.v. BARD | Odds Ratio | Std. Err. | z | p > |z| | (95% Conf. Interval) |
| i.v. FFM | 0.957 | 0.019 | −2.16 | 0.031 | 0.920/0.996 |
© 2019 by the authors. Licensee MDPI, Basel, Switzerland. This article is an open access article distributed under the terms and conditions of the Creative Commons Attribution (CC BY) license (http://creativecommons.org/licenses/by/4.0/).
Share and Cite
Tarantino, G.; Citro, V.; Conforti, P.; Balsano, C.; Capone, D. Is There a Link between Basal Metabolic Rate, Spleen Volume and Hepatic Growth Factor Levels in Patients with Obesity-Related NAFLD? J. Clin. Med. 2019, 8, 1510. https://doi.org/10.3390/jcm8101510
Tarantino G, Citro V, Conforti P, Balsano C, Capone D. Is There a Link between Basal Metabolic Rate, Spleen Volume and Hepatic Growth Factor Levels in Patients with Obesity-Related NAFLD? Journal of Clinical Medicine. 2019; 8(10):1510. https://doi.org/10.3390/jcm8101510
Chicago/Turabian StyleTarantino, Giovanni, Vincenzo Citro, Paolo Conforti, Clara Balsano, and Domenico Capone. 2019. "Is There a Link between Basal Metabolic Rate, Spleen Volume and Hepatic Growth Factor Levels in Patients with Obesity-Related NAFLD?" Journal of Clinical Medicine 8, no. 10: 1510. https://doi.org/10.3390/jcm8101510
APA StyleTarantino, G., Citro, V., Conforti, P., Balsano, C., & Capone, D. (2019). Is There a Link between Basal Metabolic Rate, Spleen Volume and Hepatic Growth Factor Levels in Patients with Obesity-Related NAFLD? Journal of Clinical Medicine, 8(10), 1510. https://doi.org/10.3390/jcm8101510