Article

Functional Assessment of Hypertrophic Phenotype Cardiomyopathies Using Combined Cardiopulmonary Exercise Testing and Echocardiography: A Pilot Single-Centre Study †

1
Health Science Interdisciplinary Center, Sant’Anna School of Advanced Studies, 56127 Pisa, Italy
2
Fondazione Toscana Gabriele Monasterio (FTGM), 56124 Pisa, Italy
3
Division of Cardiology, University of Pisa, 56126 Pisa, Italy
*
Authors to whom correspondence should be addressed.
This article is a revised and expanded version of a paper entitled ”Functional Assessment of Hypertrophic Phenotype Cardiomyopathies Using Combined Cardiopulmonary Exercise Testing and Echocardiography: A Pilot Single-Centre Study”, which was presented at XXII Congresso Nazionale SIECVI, Giardini Naxos, Italy, 28–30 May 2026.
These authors contributed equally to this work.
J. Clin. Med. 2026, 15(9), 3470; https://doi.org/10.3390/jcm15093470
Submission received: 24 March 2026 / Revised: 27 April 2026 / Accepted: 28 April 2026 / Published: 1 May 2026
(This article belongs to the Special Issue Current Concepts and Clinical Application of Echocardiography)

Abstract

Background: In patients with left ventricular hypertrophy, resting structural parameters alone may not explain exertional symptoms. Hence, we investigate whether combined Cardiopulmonary Exercise Testing- Exercise Stress Echocardiography (CPET-ESE) can provide an integrated functional characterisation of hypertrophic phenotypes. Methods: As a preliminary investigation, this prospective single-centre pilot study enrols 43 patients, categorised into: obstructive hypertrophic cardiomyopathy (n = 19), transthyretin cardiac amyloidosis (n = 15), or preserved-ejection-fraction hypertrophic phenotypes (n = 9). Patients undergo symptom-limited semi-supine CPET-ESE on an electronically braked cycle ergometer with an individualised ramp protocol. Peak effort is defined by symptom limitation and respiratory exchange ratio criteria ( R E R 1.05 ), while peak VO2 is defined as the highest 30 s averaged value. Results: Exercise responses differ across phenotypes. Patients with obstructive hypertrophic cardiomyopathy have higher peak VO2 than the other groups, despite their lower chronotropic reserve. The preserved-ejection-fraction hypertrophic group shows lower peripheral oxygen extraction, whereas transthyretin amyloidosis shows a mixed central and peripheral limitation pattern. Right ventricle–pulmonary artery uncoupling is observed in the latter two groups. Conclusions: The use of CPET-ESE may help describe distinct physiological exercise profiles in hypertrophic phenotypes, but these findings should be considered exploratory. The small, heterogeneous and single-centre cohort precludes definitive mechanistic or predictive conclusions and supports the need for larger validation studies.

1. Introduction

Left ventricular hypertrophy (LVH) represents an increase in myocardial mass due to wall thickening, chamber enlargement, or both [1]. According to ASE/EACVI criteria, LVH is defined by a left ventricular mass index (LVMi) > 115 g / m 2 in men and >95 g / m 2 in women [2]. As demonstrated by the Framingham Heart Study, LVH is a strong, independent predictor of cardiovascular morbidity and mortality [3].
The presence of myocardial thickening is a hallmark feature shared by various cardiac conditions, including two particularly important causes:
  • Hypertensive heart disease and Heart Failure with Preserved Ejection Fraction (HFpEF) phenotype. Chronic pressure overload induces myocyte hypertrophy, interstitial fibrosis, and diastolic dysfunction, progressing to HFpEF [1]. Echocardiography typically shows concentric LVH, preserved ejection fraction (EF), mild diastolic impairment, and left atrial enlargement [4].
  • Hypertrophic cardiomyopathy (HCM), a genetic disorder mainly linked to autosomal dominant mutations of sarcomeric proteins (MYH7, MYBPC3) [5]. It is characterised by asymmetric septal hypertrophy and frequently features dynamic left ventricular outflow tract obstruction (LVOTO) driven by systolic anterior movement (SAM) of the mitral valve [6,7].
However, not all imaging-defined LVH reflects a true increase in myocardial mass due to cardiomyocyte hypertrophy. In a subset of conditions, apparent wall thickening results from extracellular infiltration, a phenomenon referred to as pseudo-hypertrophy [8].
Cardiac amyloidosis represents the prototypical model of pseudo-hypertrophy. It is an infiltrative cardiomyopathy caused by extracellular deposition of misfolded amyloid fibrils, leading to concentric wall thickening, HFpEF, reduced stroke volume (SV), and the characteristic discordance between increased wall thickness and low QRS voltages on ECG [9].
Notably, the severity of LVH-related symptoms often correlates poorly with the absolute degree of myocardial thickening [10,11]. This clinical–structural discrepancy suggests that resting morphological assessments are insufficient to explain the complex pathophysiology of the disease, highlighting the need for a transition toward comprehensive functional evaluation [4,7].
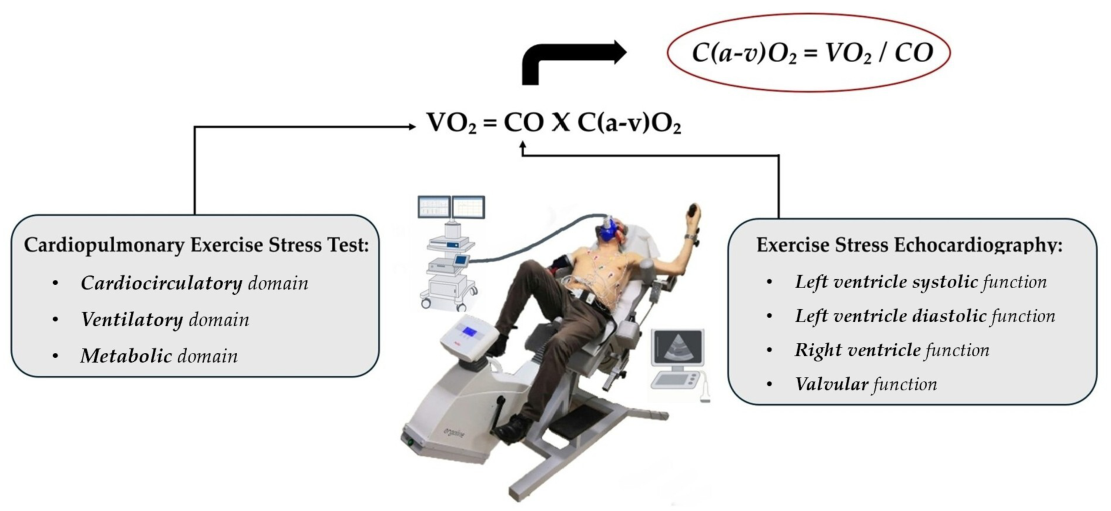
The latest methodological advance to assess exercise intolerance is the simultaneous integration of Cardiopulmonary Exercise Testing with Exercise Stress Echocardiography (CPET-ESE), represented in Figure 1. In this approach, echocardiographic images are acquired during exercise at predefined, physiologically relevant stages, while gas exchange and ventilatory parameters are continuously monitored [12].
This simultaneity enables direct, time-matched correlation between metabolic demand, ventilatory response, and dynamic cardiovascular performance, allowing a comprehensive mechanistic assessment of exercise limitation [13]. Although CPET-ESE is not yet included in formal guideline recommendations and lacks a universally standardised protocol, its clinical use is steadily increasing, supported by evidence of reproducibility and incremental value for phenotypic characterisation, prognosis, and personalised therapeutic decision-making [14].
Figure 1. Combined CardiopulmonaryExercise Testing-Exercise Stress Echocardiography (CPET-ESE) methodology. This setup utilizes a semi-supine electronically braked cycle ergometer with an individualised ramp protocol designed for an approximately 12 min exercise phase. While the CPET component offers an integrated evaluation of the cardiovascular, ventilatory, and metabolic systems through gas exchange analysis, simultaneous ESE allows for a targeted focus on cardiac functional and structural changes under physical stress, providing a comprehensive overview of the patient’s physiological response. Adapted and modified from [14].
Jcm 15 03470 g001
Such an integrated assessment may prove particularly effective for differentiating complex heart failure phenotypes and defining disease stages [15,16]. Specifically, it could potentially facilitate the clinical distinction between HFpEF and heart failure with reduced ejection fraction (HFrEF) while also aiding in the possible identification of early versus overt HFpEF [17].
Pathophysiological insights have also emerged in HCM, where exercise intolerance may be driven by a complex interplay between diastolic dysfunction and LVOTO [18]. By stratifying patients based on the presence of obstruction—whether resting, latent, or absent—and the degree of diastolic impairment, a study suggested that functional capacity may be most severely compromised when both conditions coexist at rest [19].
Regarding cardiac amyloidosis, evidence supporting the clinical application of CPET-ESE remains more limited. However, data comparing patisiran-treated patients with untreated cohorts provide early insights. Specifically, untreated individuals appear to show a more pronounced decline in inotropic reserve and a worsening VE/VCO2 slope [20].

2. Aims

This prospective and observational study hypothesizes that different hypertrophic phenotypes—such as hypertrophic cardiomyopathy with obstruction (HCMO), HFpEF, and transthyretin amyloid cardiomyopathy (ATTR-CA)—exhibit distinct “exercise signatures.” These signatures likely reflect differing limitations in cardiac output reserve, pulmonary vascular response, and/or systemic oxygen extraction capacity. By identifying these phenotypic profiles through CPET-ESE, clinicians may gain more accurate diagnostic and prognostic tools and better target therapies in a patient-specific manner. The primary aim is to validate CPET-ESE as an integrated tool for the functional characterisation of hypertrophic phenotypes and for identifying the distinct pathophysiological mechanisms underlying exercise limitation. The secondary objectives are to identify independent predictors of functional impairment—such as peak VO2, ventilatory efficiency (VE/VCO2 slope), and peak [C(a-v)O2]—using multivariable regression models that incorporate clinical variables, circulating biomarkers, resting echocardiographic parameters, and variables derived from ESE alone, without the direct inclusion of CPET measurements.

3. Materials and Methods

3.1. Study Population

Given the heterogeneous nature of LVH, a structured etiological classification is adopted to allow pathophysiologically coherent comparisons across groups. Within this methodological framework, the differential diagnosis between physiological LV remodeling (athlete’s heart) and pathological hypertrophy is beyond the scope of the present investigation. Accordingly, the study population exclusively includes patients with an established clinical diagnosis of pathological hypertrophic phenotypes based on current guideline-supported criteria. In line with this rationale, enrolled patients are categorised into three predefined LVH phenotypes:
  • HFpEF, including hypertensive heart disease and non-obstructive HCM, diagnosed using ESC criteria: LV wall thickness 12 mm , HF symptoms and signs, EF 50 % , and evidence of diastolic dysfunction or elevated natriuretic peptides levels [21]. Furthermore, non-obstructive HCM is defined by the absence of significant LVOTO, corresponding to an LVOT gradient 30 mmHg both at rest and during exercise [7];
  • ATTR-CA, confirmed by bone scintigraphy (Perugini score 2–3) and absence of monoclonal protein, or alternatively by endomyocardial biopsy with mass spectrometry in ambiguous cases [22];
  • HCMO, defined by a maximum LV wall thickness 15 mm , preserved EF, and the presence of LVOTO, defined as an LVOT gradient > 30 mmHg at rest, or induced by Valsalva maneuver, or detected during exercise [7].
Exclusion criteria include:
  • Reduced EF ( < 50 % );
  • Arrhythmias on ECG screening or prolonged QTc;
  • Syncope or ventricular arrhythmia within the 6 months prior to stress testing;
  • Severe valvular heart disease:
    Severe aortic stenosis: mean transvalvular gradient 40 mmHg and/or aortic valve area 1.0 cm 2 ;
    Severe MR: regurgitant volume 60 mL / beat or effective regurgitant orifice area 0.40 cm 2 ;
    Valvular lesions below these thresholds (e.g., a calcified aortic valve with a mean gradient of 30 mmHg) are classified as moderate and are therefore not considered exclusion criteria;
  • History of previous cardiac surgery;
  • Established haematological conditions linked to anemia or significant blood abnormalities, including anemia (Hb < 12 g / dL for women; <13 g / dL for men);
  • Severe Chronic Obstructive Pulmonary Disease (COPD), particularly in the presence of severe functional impairment, defined as markedly reduced exercise tolerance, significant dyspnea on minimal exertion (modified Medical Research Council scale, mMRC 3 ), forced expiratory volume in 1 s (FEV1) < 50 % predicted, or oxygen desaturation during physical activity.

3.2. Study Procedures

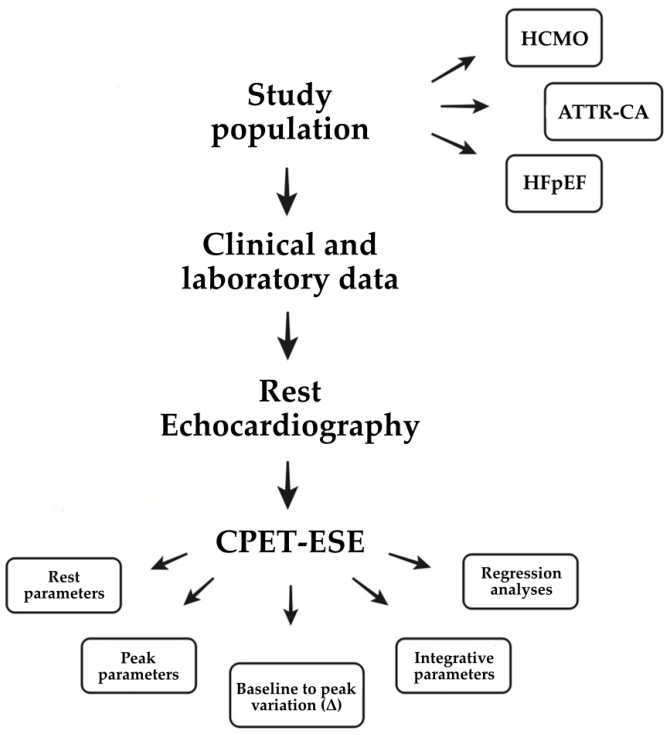
To ensure a comprehensive and standardised analysis, the study protocol is articulated into three sequential phases, as reported in Figure 2, progressing from clinical profiling to structural evaluation and, finally, to integrated functional assessment.
  • A detailed evaluation of baseline characteristics and cardiovascular profile was planned together with an assessment of key biomarkers including NT-proBNP, high-sensitivity troponin, and estimated glomerular filtration rate (eGFR);
  • Resting transthoracic echocardiography is performed in accordance with ASE/EACVI recommendations, with quantification of structural and functional parameters relevant to LVH phenotyping [2];
  • Combined CPET-ESE, described in detail in the following subsections.

3.3. Integrated CPET-ESE Protocol

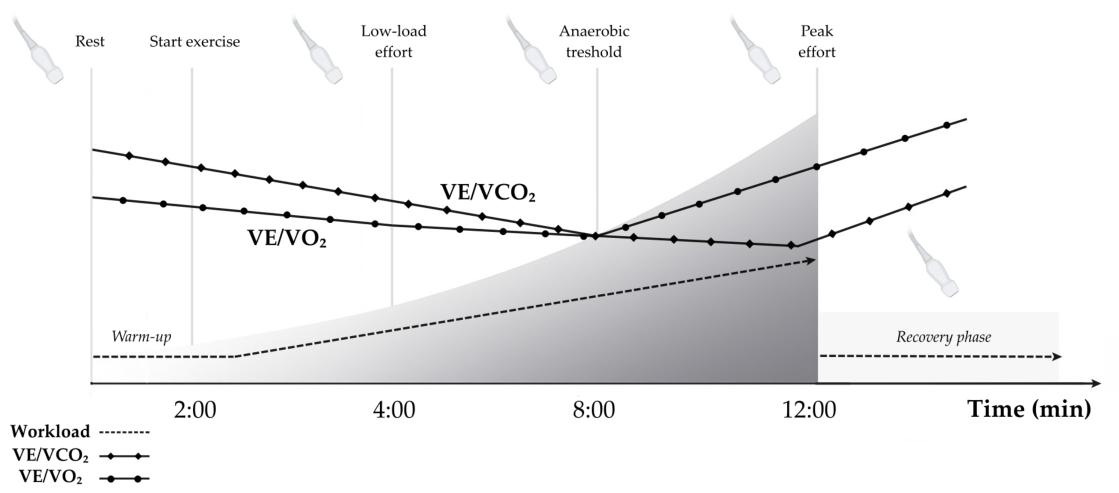
The combined CPET-ESE approach captures the dynamic interactions between cardiac, ventilatory and metabolic function during graded exercise. A detailed overview of the assessed variables is provided in Table 1 and further expanded in the Supplementary Materials. The full CPET-ESE protocol entails a continuous, multi-stage evaluation ranging from rest stage to post-exercise recovery, as illustrated in Figure 3. For this preliminary analysis, however, we focus exclusively on absolute values at baseline and peak exercise, alongside the dynamic Δ responses.

3.3.1. CPET Methodology

Patients undergo a symptom-limited, semi-supine CPET on an electronically braked ergometer, with clinical status monitored via continuous 12-lead ECG, SpO2, and automated blood pressure measurements throughout the procedure. To ensure an optimal exercise duration of about 12 min, an individualised ramp protocol is employed, after a brief warm-up phase. Gas exchange is analysed on a breath-by-breath basis, measuring oxygen uptake (VO2), carbon dioxide production (VCO2), and minute ventilation (VE), with predicted VO2 values derived from Wasserman equations.
The anaerobic threshold (AT) is determined using a multi-method approach, integrating the V-slope method, the nadir of the ventilatory equivalent for oxygen (VE/VO2) prior to a concomitant rise in VE/VCO2, and end-tidal gas trends (an increase in PETO2 with stable PETCO2) [23] Under standard conditions, a test is validated as reaching peak effort when the respiratory exchange ratio (RER) is ≥1.05. However, in cases where this threshold is not met, peak effort is defined by symptom limitation. Consequently, Peak VO2 is defined as the highest 30 s rolling average achieved during the final stage of the exercise protocol. Findings are visually cross-referenced and confirmed by two independent observers.

3.3.2. ESE Methodology

Echocardiographic acquisition is coupled with gas exchange analysis to correlate cardiac haemodynamic changes directly with metabolic workload. Measurements are performed at five key intervals:
  • Resting baseline;
  • Low workload within the first 4 min and a heart rate (HR) < 100 bpm;
  • Anaerobic threshold (AT), marked by a RER 1.0 ;
  • Peak exercise, with RER 1.05 or symptom-limitation;
  • Early recovery phase, within the first 2–3 min post maximal exercise.
At each stage, a comprehensive assessment of cardiac geometry and function is performed. This includes ventricular performance, diastolic indices, and valvular dynamics, as detailed in Table 1 and in Supplementary Materials. To ensure data robustness, all echocardiographic parameters are averaged over three consecutive cardiac cycles, or a 5 s interval for patients in atrial fibrillation.

3.4. Statistical Analysis

Comparative analysis across phenotypes is performed using parametric or non-parametric tests based on data distribution. Continuous variables are examined with one-way ANOVA. Categorical variables are assessed using the χ 2 test. Statistical significance is set at p < 0.05 for all analyses. To investigate the determinants of functional capacity, multivariable modelling is subsequently applied. Predictors of peak VO2, ventilatory efficiency (VE/VCO2 slope), and peak C(a-v)O2 are identified through multivariate linear regression, including only candidate predictors demonstrating a p < 0.10 at univariate screening. Regression coefficients ( β ) are used to quantify the strength and direction of associations, while multicollinearity among predictors is assessed using the variance inflation factor (VIF). Model performance and discriminatory ability are evaluated using adjusted R2; to quantify explained variance, receiver-operating characteristic (ROC) curves and area under the curve (AUC) for classification tasks, and Bland–Altman analysis to assess agreement between measured and predicted values. All analyses are conducted using complete-case analysis, as no significant missing data were present.

4. Results

4.1. Clinical Parameters and Biomarkers

The study population includes 43 patients with a mean age of 68 ± 10 years, who were predominantly male (84%, n = 36 ); females accounted for 16% ( n = 7 ). Most patients were in New York Heart Association functional classification (NYHA) class II (74%, n = 32 ), whereas the remaining 26% were in class I ( n = 11 ). Notably, despite a significantly younger mean age ( 62 ± 9 years, p = 0.001 ), HCMO patients showed the highest proportion of subjects in NYHA class II (95%, n = 18 , p = 0.024 ).
Regarding biomarkers, Log-transformed cardiac Troponin T (logTnT) presents a median value of 1.261 (IQR 1.055–1.433) in the overall population, with significantly higher levels observed in ATTR-CA compared with the other groups (median 1.582, IQR 1.359–1.655, p < 0.001 ). NT-proBNP shows a median value of 933 pg/mL (IQR 459–1573). Renal function is preserved overall, with creatinine levels of 1.02 ± 0.23 mg/dL and an eGFR of 75 ± 17 mL/min/1.73 m2, without significant differences among groups.
The most frequent comorbidities are hypertension (79%, n = 34 ) and dyslipidemia (65%, n = 28 ), followed by AF (35%, n = 15 ), Ischemic Heart Disease (23%, n = 10 ) and Diabetes Mellitus (12%, n = 5 ). Overall, 40% of patients ( n = 17 ) are current or former smokers. Three subjects (7%) have an implanted pacemaker.
Among pharmacological therapies, β -blockers are the most prevalent prescribed (72%, n = 31 ), with the highest usage observed in the HCMO subgroup, despite not reaching statistical significance ( p = 0.061 ). Further subgroup details are reported in Table 2.

4.2. Baseline Echocardiography

Baseline echocardiographic parameters are summarised in Table 3. The overall study population exhibit increased LVMi ( 158 ± 38 g/m2) together with marked left ventricular wall thickening, reflected by an interventricular septal thickness in diastole (IVSd) of 17.0 ± 2.9 mm and a posterior wall thickness in diastole (PWd) of 13.1 ± 2.4 mm. These findings are consistent with a hypertrophic remodeling pattern shared across the three groups. Notably, IVSd is significantly greater in the HCMO group ( 18.2 ± 3.3 mm, p = 0.025 ).
In the general population, EF is 59 ± 6 %, with all groups showing preserved EF, although values are slightly higher in HCMO ( 61 ± 5 %; p = 0.022 ). Left ventricular cavity dimensions remain within normal limits, with a left ventricular end-diastolic diameter (LVEDD) of 48 ± 5 mm and a left ventricular end-diastolic volume (LVEDV) of 121 ± 33 mL.
The diastolic profile shows impaired relaxation, with a mean E/e′ ratio of 13.7 ± 4.7 , associated with left atrial enlargement (LAVI 40.4 ± 9.6 mL/m2), suggesting chronically elevated filling pressures. Among the groups, HFpEF shows significantly lower E/e′ values compared with the others ( 10.11 ± 3.06 , p = 0.030 ).
Right ventricular function is preserved, with a TAPSE of 21 ± 4 mm and a PAPs of 34 ± 9 mmHg. Regarding valvular function, significant MR is present in 19% of patients ( n = 8 ), with significantly more prevalence in the HCMO group (n =6.32%, p = 0.024 ), while significant tricuspid regurgitation is observed in 7% of patients ( n = 3 ).

4.3. CPET-ESE

A summary of CPET-ESE parameters is provided in Table 4. At rest, in the overall cohort, SBP ( 131 ± 19 mmHg), DBP ( 74 ± 10 mmHg) and HR ( 64 ± 12 bpm) are within normal limits, with a mean double product (DP) of 8,297 ± 2,253, reporting no significant differences among groups.
The systolic function is preserved (SVi 37 ± 9 mL/m2; CI 2.3 ± 0.6 L/min/m2), and diastolic function shows a mean E/e′ of 12.7 ± 5.0 . Right ventricular function is preserved, with a mean TAPSE of 22 ± 3 mm and basal PASP of 32 ± 8 mmHg, showing no significant differences among groups.
Resting metabolic function is reduced (VO2 3.85 ± 1.57 mL/min/kg), with slightly increased peripheral oxygen extraction (C(a-v)O2 7.2 ± 3.1 mL/100 mL). Notably, HCMO patients exhibit significantly higher resting metabolic activity (basal VO2 4.92 ± 1.40 mL/min/kg), p < 0.001 ; basal C(a-v)O2 8.88 ± 2.64 mL/100 mL, p < 0.001 ), as compared to the other groups. Patients with ATTR-CA show the lowest basal VO2 ( 3.04 ± 1.36 mL/min/kg), while the HFpEF group reports the lowest basal C(a-v)O2 ( 5.50 ± 1.36 mL/100 mL).
At peak exercise, the hemodynamic response is appropriate in the general population, with increases in SBP ( 184 ± 27 mmHg), DBP ( 91 ± 15 mmHg), and mean HR ( 106 ± 19 bpm), resulting in a doubling of the double product ( 19 , 892 ± 5551 ).
Mean values for SVi and CI reach 48 ± 12 mL/m2 and 5.1 ± 1.4 L/min/m2, respectively, showing no significant variation across the three cohorts. By contrast, variations in diastolic function are observed: HFpEF shows lower filling pressures (peak E/e′ 8.7 ± 3.8 ) compared with both ATTR-CA ( 12.3 ± 4.0 ) and HCMO ( 13.4 ± 4.8 ), with a significant overall difference ( p = 0.033 ). The HCMO group also demonstrates a higher prevalence of significant MR at peak exercise (63%, n = 12 ; p = 0.003 ) compared with ATTR-CA (3/15) and HFpEF (0/9).
Right ventricular contractile function is generally preserved, with TAPSE at peak reaching 27 ± 5 mm. A peak PASP of 45 ± 18 mmHg is reached, with no significant differences between groups. Notably, ATTR-CA and HFpEF show decoupling of TAPSE/PASP during effort (ΔTAPSE/PASP: ATTR-CA 0.18 ± 0.16 ; HFpEF 0.10 ± 0.16 ; HCMO 0.10 ± 0.40 ; p = 0.045 ).
Peak VO2 results 14.92 ± 3.98 mL/min/kg in the general population, supported by an adequate increase in C(a-v)O2 ( 12.77 ± 3.37 mL/dL). Again, the HCMO group shows the highest values in both parameters, with a peak VO2 of 16.74 ± 2.84 mL/min/kg ( p = 0.020 ) and a peak C(a-v)O2 of 14.88 ± 2.94 mL/100 mL ( p < 0.001 ).
In this assessment, the HFpEF group reports both the lowest VO2 ( 13.27 ± 3.34 mL/min/kg) and C(a-v)O2 ( 10.46 ± 1.47 mL/100 mL), with values comparable to ATTR-CA. Furthermore, this result is supported by the proportion of patients reaching AT, which is markedly higher in HCMO (17/19, 90%; p < 0.001 ) compared to ATTR-CA (1/15, 7%) and HFpEF (2/9, 22%).
Despite these observations, HCMO shows the lowest chronotropic reserve values ( 39 ± 12 %; p = 0.009 ), with almost all patients ( n = 18 , 95%; p < 0.001 ) failing to reach the 62% cut-off threshold for chronotropic incompetence.
In the general population, the VE/VCO2 slope is 28.3 ± 5.1 and does not differ significantly among groups, whereas the CO/VO2 slope is at its highest in HFpEF ( 7.25 ± 3.02 ; p = 0.009 ).

4.4. Regression Analyses

Regression analyses are performed to identify independent predictors of peak VO2, VE/VCO2 slope, and peak C(a-v)O2 in the overall cohort.
In the multivariable regression, peak VO2 is independently predicted by baseline TAPSE ( β = + 0.40 ; VIF 1.06), peak CI ( β = + 0.40 ; VIF 1.06), and age ( β = 0.37 ; VIF 1.04). This model explains a substantial proportion of the variance in the cohort (adjusted R 2 = 0.57 ; p < 0.001 ).
Regarding the VE/VCO2 slope, peak CI ( β = 0.33 ; VIF 1.08), age ( β = 0.22 ; VIF 1.14), and LAVI ( β = + 0.41 ; VIF 1.22) emerge as independent predictors, accounting for significant variability (adjusted R 2 = 0.41 ; p < 0.001 ).
Finally, stepwise regression identifies peak CI ( β = 0.49 ; VIF 1.07), age ( β = 0.31 ; VIF 1.23), baseline MR ( β = + 0.35 ; VIF 1.22), and log NT-proBNP ( β = 0.50 ; VIF 1.39) as independent predictors of peak C(a-v)O2, with an adjusted R 2 = 0.58 ( p < 0.001 ).

5. Discussion

5.1. Baseline Phenotyping

Already at baseline, both clinical, laboratory and echocardiographic data allow identification of differences among the three groups. The mean age is higher in patients with both ATTR-CA and HFpEF compared with those with HCMO.
The burden of comorbidities follows a similar gradient, being greater in the older groups. In particular, comorbidities are not only more prevalent but also more heterogeneous in the ATTR-CA group, consistent with the systemic nature of the disease [24].
Serum biomarkers show significantly higher troponin levels in patients with amyloidosis compared with HFpEF and HCMO, reflecting greater myocardial injury.
Notably, despite their younger age and more favorable biomarker profile, patients with HCMO show a higher proportion of symptomatic individuals in NYHA class II, likely explained by the prominent role of LVOTO [25].
Baseline echocardiographic findings support this interpretation. In the HCMO group, septal hypertrophy is more pronounced and accompanied by higher aortic outflow velocities. In addition, moderate-to-severe MR is more frequently observed in HCMO, a finding related to SAM.
Regarding therapy, although not significant, β -blockers are more frequently prescribed in HCMO compared with ATTR-CA and HFpEF, consistent with the need to modulate HR in order to reduce LVOTO.
In contrast, patients with ATTR-CA and HFpEF exhibit increased wall thickness with more symmetric distribution.

5.2. CPET-ESE Phenotyping

Although these preliminary findings should be interpreted with caution, differences between the groups can be observed. Regarding basal data, despite similar rest CI and SVi across groups, HCMO patients show higher rest VO2 and rest C(a-v)O2, likely reflecting greater skeletal muscle mass and, in the context of LVOTO and more pronounced diastolic dysfunction, increased reliance on peripheral oxygen extraction.
Peak exercise data provide further potential insight into group-specific metabolic and hemodynamic responses. Patients in the HCMO group exhibit the highest peak VO2 and peak C(a-v)O2 among groups, while peak CI, although not significantly different, is surprisingly lower than in ATTR-CA and HFpEF. Peak SVi values are similar across groups, despite the higher baseline SVi in HCMO.
Thus, functional limitation in HCMO may be primarily driven by LVOTO, with the blunted VO2 response further constrained by chronotropic incompetence, likely secondary to β -blocker use. In line with this observation, a previous study has reported that chronotropic impairment in HCM is attenuated after adjusting for β -blocker therapy [18]. Notably, these observations underscore the need for careful β -blocker titration to achieve effective LVOTO reduction without excessively compromising HR increase. Referring to the HFpEF group, the cardiac response is the most efficient among the cohort, with higher peak CI and peak SVi, while filling pressures remain lower.
However, peak C(a-v)O2 is the lowest overall, limiting peak VO2 to below the prognostic threshold of 14 mL/kg/min. This is further supported by a significantly higher CO/VO2 slope, suggesting that exercise performance may be primarily constrained by peripheral oxygen extraction inefficiency. Although our HFpEF group represents a heterogeneous cohort comprising both hypertensive heart disease and non-obstructive HCM patients, our findings align with existing evidence [26]. In this context, the CPET-ESE approach utilizes the inverse Fick equation to enable a non-invasive assessment of C(a-v)O2, which may offer additional clinical utility across the broader HFpEF spectrum [14].
In the ATTR-CA group, a pattern of global functional impairment is observed. While peak C(a-v)O2 is reduced, diastolic function, as assessed by E/e′, remains unchanged from rest to peak. Peak systolic indices are within normal limits, yet lower than in HFpEF. Notably, chronotropic reserve is the highest among groups.
Functional limitation therefore may result from combined central and peripheral mechanisms, with CO primarily sustained by chronotropic response, a finding consistent with previous reports [27]. These findings may potentially underscore the need for cautious β -blocker use in patients with cardiac amyloidosis.
Potential insights may also be gleaned from assessing right heart function. In patients with HCMO, the ΔTAPSE/PASP from rest to peak is positive, whereas it is negative in ATTR-CA and HFpEF, suggesting impaired right ventricular–pulmonary arterial coupling in the latter groups. Regarding HCMO, this finding is supported by improvement in diastolic function during exercise, as testified by baseline and peak E/e′ values.
Furthermore, despite higher baseline values, peak PASP remains relatively lower in HCMO, whereas the rise is greater in HFpEF and ATTR-CA.
In the HFpEF group, the observation of lower peak E/e′ values argues against RV–AP uncoupling being driven by elevated left ventricular filling pressures, indicating that this phenomenon may primarily reflect reduced pulmonary vascular compliance.
A similar pattern is observed in ATTR-CA, where, alongside reduced pulmonary vascular compliance, right ventricular function is also less efficient compared with HFpEF. Nevertheless, these findings remain exploratory. In contrast to our results, emerging evidence suggests that exercise-induced pulmonary hypertension (EiPAH) may play a key role in predicting adverse clinical outcomes in HCM [15].

5.3. Prediction of Functional Parameters

Multivariable analyses shows that several CPET-derived functional parameters can be predicted by integrating clinical, laboratory, and echocardiographic data, including stress measurements.
These associations might be physiologically plausible: peak VO2 is related to baseline TAPSE and peak CI, highlighting the role of global cardiocirculatory function in exercise capacity, while VE/VCO2 slope correlated with peak CI and LAVI, linking both systolic and diastolic dysfunction to ventilatory inefficiency.
Peak C(a-v)O2 results associated with baseline MR, peak CI, NT-proBNP and age, potentially reflecting the interaction between cardiac function and peripheral oxygen extraction, as well as the contribution of age-related sarcopenia.
Notably, E/e′ is not retained in the multivariable models, likely due to collinearity with other markers of pressure load and remodelling such as LAVI. Subgroup analyses yield similar trends but are not reported due to the limited sample size.

6. Conclusions

6.1. Strengths and Perspectives

The combined CPET-ESE approach offers a non-invasive, integrative assessment of cardiac, respiratory, and metabolic responses to exercise. By combining multiparametric variables such as VO2, VE/VCO2 slope and C(a-v)O2, it may provide a more comprehensive clinical characterisation across diagnostic, therapeutic, and prognostic domains by:
  • Enhancing diagnostic accuracy by clarifying the underlying mechanism of exercise intolerance;
  • Detecting latent LVOTO, a key prognostic and diagnostic hallmark in HCM that may be absent at rest but becomes evident during exertion;
  • Guiding pharmacological management, allowing clinicians to tailor therapies such as β -blockers, diuretics, afterload-reducing agents, etc., after honing in on the predominant abnormality revealed during exercise;
  • Assisting in the selection of invasive therapies, informing decisions regarding candidacy for septal reduction interventions, guiding pacing strategies, and supporting the design of personalised exercise rehabilitation programs;
  • Enabling longitudinal monitoring of therapeutic response, which is particularly valuable in chronic settings.
In addiction, the development of predictive models linking clinical, laboratory and resting echocardiographic variables may expand the translational value of this approach. Indeed, these models can approximate key functional outcomes even in the absence of full CPET performance. This might be especially advantageous in resource-limited settings, in patients unable to perform maximal exercise testing, or in longitudinal follow-up when repeated CPET-ESE is impractical.

6.2. Limitations

As a diagnostic tool, CPET-ESE entails methodological constraints. Performance is highly effort-dependent and influenced by deconditioning, training status, and concurrent medications. From a technical perspective, the procedure requires specialised equipment and expertise for rapid multi-window image acquisition. Notably, the semi-supine position, necessary for image quality, can alter exercise biomechanics and shift the AT toward peak effort. Furthermore, respiratory and metabolic measurements are sensitive to calibration errors and day-to-day physiological variability. Regarding the study setting, recruitment from a single tertiary centre introduces inherent selection bias, as the cohort may reflect local referral patterns, operator expertise, and institutional workflows. Consequently, the inclusion of more selected, diagnostically complex, or symptomatic patients limits external validity. This cohort should therefore be regarded as hypothesis-generating rather than fully representative of hypertrophic phenotypes. In this regard, we acknowledge the current heterogeneity of the HFpEF group, which encompasses both hypertensive heart disease and non-obstructive HCM. Combined with the current sample size, this precludes subgroup comparisons or group-specific regression analyses at this stage. However, such detailed evaluations will be implemented as further recruitment expands the study population.

Supplementary Materials

The following supporting information can be downloaded at: https://www.mdpi.com/article/10.3390/jcm15093470/s1.

Author Contributions

Conceptualisation: M.S., I.F. and C.P. (Claudio Passino). Methodology: M.S., I.F. and C.P. (Claudio Passino). Investigation: M.S., I.F., C.A., C.P. (Christina Petersen), I.A.G. and E.B. Data curation: M.S. and I.F. Statistical analysis: L.B. Resources: G.T. Supervision: C.P. (Claudio Passino). Project administration: C.C. and C.P. (Claudio Passino). All authors have read and agreed to the published version of the manuscript.

Funding

This research received no external funding.

Institutional Review Board Statement

The study was conducted in accordance with the Declaration of Helsinki. The study protocol was reviewed by the Ethics Committee of Regione Toscana, Area Vasta Nord Ovest (CEAVNO), on 21 September 2023 and received ethical approval (registry number: 25288_FABIANI).

Informed Consent Statement

Informed consent was obtained from all subjects involved in the study. Written informed consent has been obtained from the patients to publish this paper.

Data Availability Statement

The data underlying this article will be shared on reasonable request to the corresponding author.

Conflicts of Interest

The authors declare no conflicts of interest.

Abbreviations

The following abbreviations are used in this manuscript:
AFAtrial Fibrillation;
ATTR-CATransthyretin Cardiac Amyloidosis;
AUCArea Under the Curve;
BMIBody Mass Index;
BSABody Surface Area;
CICardiac Index;
COPDChronic Obstructive Pulmonary Disease;
CPETCardiopulmonary Exercise Testing;
CPET-ESECombined Cardiopulmonary Exercise Test and Exercise Stress Echocardiography;
DPDouble Product;
E/e′Ratio of Early Mitral Inflow to Mitral Annular e′ Velocity;
EFEjection Fraction;
EiPAHExercise-induced Pulmonary Hypertension;
eGFREstimated Glomerular Filtration Rate;
ESEExercise Stress Echocardiography;
FEV1Forced Expiratory Volume in 1 s;
GLSGlobal Longitudinal Strain;
HCMHypertrophic Cardiomyopathy;
HCMOHypertrophic Cardiomyopathy with Obstruction;
HFpEFHeart Failure with Preserved Ejection Fraction;
HFrEFHeart Failure with Reduced Ejection Fraction;
HRHeart Rate;
IVSdInterventricular Septal Thickness in Diastole;
LAVILeft Atrial Volume Index;
LogTnTLog-transformed cardiac Troponin T;
LVEDDLeft Ventricular End-Diastolic Diameter;
LVEDVLeft Ventricular End-Diastolic Volume;
LVHLeft Ventricular Hypertrophy;
LVMiLeft Ventricular Mass Index;
LVOTLeft Ventricular Outflow Tract;
LVOTOLeft Ventricular Outflow Tract Obstruction;
mMRCmodified Medical Research Council dyspnea scale;
MRMitral Regurgitation;
MRAMineralocorticoid Receptor Antagonist;
NT-proBNPN-terminal pro–B-type Natriuretic Peptide;
PASPPulmonary Artery Systolic Pressure;
PETCO2End-Tidal Carbon Dioxide Pressure;
PWdPosterior Wall Thickness in Diastole;
RERRespiratory Exchange Ratio;
SAMSystolic Anterior Movement;
SGLT2iSodium/Glucose Cotransporter-2 Inhibitor;
SVStroke Volume;
SViStroke Volume Index;
TAPSETricuspid Annular Plane Systolic Excursion;
VEMinute Ventilation;
VE/VCO2Ventilatory Equivalent for CO2;
VIFVariance inflation Factor;
VO2Oxygen Uptake

References

  1. Lorell, B.H.; Carabello, B.A. Left Ventricular Hypertrophy. Circulation 2000, 102, 470–479. [Google Scholar] [CrossRef]
  2. Lang, R.M.; Badano, L.P.; Mor-Avi, V.; Afilalo, J.; Armstrong, A.; Ernande, L.; Flachskampf, F.A.; Foster, E.; Goldstein, S.A.; Kuznetsova, T.; et al. Recommendations for Cardiac Chamber Quantification by Echocardiography in Adults. J. Am. Soc. Echocardiogr. 2015, 28, 1–39. [Google Scholar] [CrossRef]
  3. Mahmood, S.S.; Levy, D.; Vasan, R.S.; Wang, T.J. The Framingham Heart Study and the Epidemiology of Cardiovascular Disease. Lancet 2014, 383, 999–1008. [Google Scholar] [CrossRef]
  4. Tadic, M.; Cuspidi, C.; Marwick, T.H. Phenotyping the Hypertensive Heart. Eur. Heart J. 2022, 43, 3794–3810. [Google Scholar] [CrossRef] [PubMed]
  5. Lopes, L.R.; Ho, C.Y.; Elliott, P.M. Genetics of hypertrophic cardiomyopathy: Established and emerging implications for clinical practice. Eur. Heart J. 2024, 45, 2727–2734. [Google Scholar] [CrossRef]
  6. Maron, B.J.; Desai, M.Y.; Nishimura, R.A.; Spirito, P.; Rakowski, H.; Towbin, J.A.; Rowin, E.J.; Maron, M.S.; Sherrid, M.V. Diagnosis and Evaluation of Hypertrophic Cardiomyopathy. J. Am. Coll. Cardiol. 2022, 79, 372–389. [Google Scholar] [CrossRef] [PubMed]
  7. Arbelo, E.; Protonotarios, A.; Gimeno, J.R.; Arbustini, E.; Elliott, P.M.; Olivotto, I.; Group, E.S.D. 2023 ESC Guidelines for the Management of Cardiomyopathies. Eur. Heart J. 2023, 44, 3503–3626. [Google Scholar] [CrossRef]
  8. Castiglione, V.; Montuoro, S.; Orlando, G.; Aimo, A.; Vergaro, G.; Emdin, M. Cardiac Amyloidosis: Innovations in Diagnosis and Treatment. Eur. Heart J. Suppl. 2025, 27, i88–i97. [Google Scholar] [CrossRef]
  9. Donnelly, J.P.; Hanna, M. Cardiac Amyloidosis: An Update on Diagnosis and Treatment. Clevel. Clin. J. Med. 2017, 84, 12–26. [Google Scholar] [CrossRef]
  10. Ireland, C.G.; Burstein, D.S.; Day, S.M.; Axelsson Raja, A.; Russell, M.W.; Zahka, K.G.; Pereira, A.; Canter, C.E.; Bach, R.G.; Wheelerl, M.T.; et al. Quality of Life and Exercise Capacity in Early Stage and Subclinical Hypertrophic Cardiomyopathy. Circ. Heart Fail. 2024, 17, 123–135. [Google Scholar] [CrossRef] [PubMed]
  11. Kittleson, M.M.; Maurer, M.S.; Ambardekar, A.; Bullock-Palmer, R.P.; Chang, P.P.; Eisen, H.J.; Nair, A.P.; Nativi-Nicolau, J.; Ruberg, F.L. 2023 ACC Expert Consensus Decision Pathway on the Management of Cardiac Amyloidosis. J. Am. Coll. Cardiol. 2023, 81, 1076–1126. [Google Scholar] [CrossRef]
  12. Ahn, H.B.; Park, J.; Choi, H.J.; Choi, H.M.; Hwang, I.C.; Yoon, Y.E.; Cho, G.Y. Cardiopulmonary exercise test with bicycle stress echocardiography for predicting adverse cardiac events in patients with stage A or B heart failure. Am. J. Prev. Cardiol. 2024, 21, 100913. [Google Scholar] [CrossRef] [PubMed]
  13. Pugliese, N.R.; De Biase, N.; Balletti, A.; Filidei, F.; Pieroni, A.; D’Angelo, G.; Masi, S.; Taddei, S.; Fabiani, I.; Di Bello, V. Characterisation of haemodynamic and metabolic abnormalities in the heart failure spectrum: The role of combined cardiopulmonary and exercise echocardiography stress test. Minerva Cardiol. Angiol. 2022, 70, 370–384. [Google Scholar] [CrossRef]
  14. Del Punta, L.; De Biase, N.; Armenia, S.; Di Fiore, V.; Maremmani, D.; Gargani, L.; Mazzola, M.; De Carlo, M.; Mengozzi, A.; Lomonaco, T.; et al. Combining cardiopulmonary exercise testing with echocardiography: A multiparametric approach to the cardiovascular and cardiopulmonary systems. Eur. Heart J.-Imaging Methods Pract. 2023, 1, qyad021. [Google Scholar] [CrossRef]
  15. Pugliese, N.R.; Mazzola, M.; Madonna, R.; Gargani, L.; De Biase, N.; Dini, F.L.; Taddei, S.; De Caterina, R.; Masi, S. Exercise-induced pulmonary hypertension in HFpEF and HFrEF: Different pathophysiologic mechanism behind similar functional impairment. Vasc. Pharmacol. 2022, 144, 106978. [Google Scholar] [CrossRef]
  16. Verwerft, J.; Bertrand, P.B.; Claessen, G.; Herbots, L.; Verbrugge, F.H. Cardiopulmonary Exercise Testing with Simultaneous Echocardiography: Blueprints of a Dyspnea Clinic for Suspected HFpEF. JACC Heart Fail. 2023, 11, 162–174. [Google Scholar] [CrossRef]
  17. Pugliese, N.R. Cardiac Reserve and Exercise Capacity: Insights from Combined Exercise Stress Echocardiography. J. Am. Soc. Echocardiogr. 2021, 34, 38–50. [Google Scholar] [CrossRef]
  18. Erez, Y.; Ghantous, E.; Shetrit, A.; Zamanzadeh, R.S.; Zahler, D.; Granot, Y.; Sapir, O.R.; Laufer Perl, M.; Banai, S.; Topilsky, Y.; et al. Exercise limitation in hypertrophic cardiomyopathy: Combined stress echocardiography and cardiopulmonary exercise test. ESC Heart Fail. 2024, 11, 2287–2294. [Google Scholar] [CrossRef]
  19. Re, F.; Zachara, E.; Avella, A.; Baratta, P.; Di Mauro, M.; Uguccioni, M.; Olivotto, I. Dissecting functional impairment in hypertrophic cardiomyopathy by dynamic assessment of diastolic reserve and outflow obstruction: A combined cardiopulmonary–echocardiographic study. Int. J. Cardiol. 2016, 227, 743–750. [Google Scholar] [CrossRef] [PubMed]
  20. Patel, R.K.; Bandera, F.; Venneri, L.; Knight, D.; Porcari, A.; Muthurangu, V.; Guazzi, M.; Hawkins, P.N.; Gillmore, J.D.; Fontana, M. Cardiopulmonary Exercise Testing With Exercise Echocardiography to Assess Treatment Response in Transthyretin Amyloid Cardiomyopathy. JACC Heart Fail. 2025, 11, 785–797. [Google Scholar] [CrossRef] [PubMed]
  21. McDonagh, T.A.; Metra, M.; Adamo, M.; Gardner, R.S.; Baumbach, A.; Böhm, M.; Burri, H.; Butler, J.; Čelutkienė, J.; Chioncel, O.; et al. 2021 ESC Guidelines for the diagnosis and treatment of acute and chronic heart failure. Eur. Heart J. 2021, 42, 3599–3726. [Google Scholar] [CrossRef]
  22. García-Pavia, P.; Rapezzi, C.; Adler, Y.; Arad, M.; Basso, C.; Brucato, A.; Burazor, I.; Caforio, A.L.P.; Damy, T.; Eriksson, U.; et al. Diagnosis and treatment of cardiac amyloidosis: A position statement of the ESC Working Group on Myocardial and Pericardial Diseases. Eur. Heart J. 2021, 42, 1554–1568. [Google Scholar] [CrossRef]
  23. Smith, W.T.; Niven, A.S. Cardiopulmonary Exercise Testing. Clin. Chest Med. 2025, 46, 481–498. [Google Scholar] [CrossRef] [PubMed]
  24. Cuddy, S.A.M.; Falk, R.H. Amyloidosis as a Systemic Disease in Context. JACC Heart Fail. 2023, 11, 865–878. [Google Scholar] [CrossRef] [PubMed]
  25. Maron, M.S.; Olivotto, I.; Zenovich, A.G.; Link, M.S.; Pandian, N.G.; Kuvin, J.T.; Nistri, S.; Cecchi, F.; Udelson, J.E.; Maron, B.J. Hypertrophic Cardiomyopathy Is Predominantly a Disease of Left Ventricular Outflow Tract Obstruction. Circulation 2006, 114, 2232–2239. [Google Scholar] [CrossRef]
  26. Pugliese, N.R.; Mazzola, M.; Fabiani, I.; De Biase, N.; Pedrinelli, R.; Natali, A.; Dini, F.L. Haemodynamic and Metabolic Phenotyping of Hypertensive Patients With and Without Heart Failure by Combining Cardiopulmonary and Echocardiographic Stress Test. Eur. J. Heart Fail. 2020, 22, 458–468. [Google Scholar] [CrossRef]
  27. Holt, M.F.; Flø, A.; Ravnestad, H.; Bjørnø, V.; Gullestad, L.; Andreassen, A.K.; Broch, K.; Gude, E. Invasive Haemodynamics at Rest and Exercise in Cardiac Amyloidosis. ESC Heart Fail. 2024, 11, 1263–1268. [Google Scholar] [CrossRef] [PubMed]
Figure 2. Flowchart of the study protocol. Clinical and laboratory data are first collected, followed by comprehensive resting echocardiography to characterise cardiac structure and function. Participants then undergo CPET-ESE, which yields multiple categories of physiological information: resting exercise parameters, peak exercise responses, baseline-to-peak (Δ) variations, and additional integrated cardiometabolic indices. These datasets are subsequently used for comparative analyses across phenotypes (HCMO, ATTR-CA, HFpEF) and for regression modelling.
Jcm 15 03470 g002
Figure 3. Illustration of the CPET-ESE protocol. The exercise phase is designed to last approximately 12 min, using an individualised ramp to ensure a progressive and controlled increase in workload after a 2 min warm-up period. Gas-exchange variables rise or fall in a characteristic pattern: VE/VCO2 and VE/VO2 are continuously monitored, and their trajectories assist in identifying the anaerobic threshold (AT). Echocardiographic imaging is acquired at predefined stages—rest, low-load effort, AT, peak exercise, and immediately post-exercise. The figure was adapted and modified with permission from [13].
Jcm 15 03470 g003
Table 1. Parameters assessed by CPET-ESE across exercise stages.
CategoryParameterMeasurement Timepoint
Clinical Hemodynamic ParametersSBPEvery 2 min
DBPEvery 2 min
HRContinuous
Exercise Stress EchocardiographyLVEFR; L–L; AT; P; Rec; Δ(P–R)
SViR; L–L; AT; P; Rec; Δ(P–R)
CIR; L–L; AT; P; Rec; Δ(P–R)
GLSR; P
E/e′ avgR; L–L; AT; P; Rec; Δ(P–R)
MR gradeR; L–L; AT; P
PASPR; L–L; AT; P; Rec; Δ(P–R)
TAPSER; L–L; AT; P; Rec; Δ(P–R)
TAPSE/PASPR; P; Δ(P–R)
Cardiopulmonary Exercise TestVO2R; L–L; AT; P; Δ(P–R)
VEContinuous
VTContinuous
RRContinuous
VE/VO2Continuous
VE/VCO2 slopeEntire exercise
PETO2Continuous
PETCO2Continuous
O2 pulseR; P; Δ(P–R)
VO2/WREntire exercise
VO2/HRR; AT; P
RERP
Chronotropic reserveDerived (R; P)
Ventilatory reserveDerived (R; P)
Integrated Cardiometabolic ParametersC(a-v)O2 differenceR; P; Δ(P–R)
CO/VO2 slopeEntire exercise
ΔSV/ΔVO2Δ-derived (P–R)
This table summarises hemodynamic, echocardiographic, ventilatory, metabolic, and integrated cardiometabolic parameters. Timepoints: R = rest; L–L = low load; AT = anaerobic threshold; P = peak; Rec = early recovery; Δ(P–R) = change from peak to rest. Abbreviations: C(a-v)O2 = arteriovenous oxygen difference; CI = cardiac index; CO = cardiac output; DBP = diastolic blood pressure; E/e′ avg = average ratio of early mitral inflow (E) to mitral annular e′ velocity; GLS = global longitudinal strain; HR = heart rate; LVEF = left-ventricular ejection fraction; MR = mitral regurgitation; O2 pulse = oxygen pulse; PASP = pulmonary artery systolic pressure; PETCO2 = end-tidal CO2 pressure; PETO2 = end-tidal O2 pressure; RER = respiratory exchange ratio; RR = respiratory rate; SBP = systolic blood pressure; SVi = stroke volume index; TAPSE = tricuspid annular plane systolic excursion; VE = minute ventilation; VCO2 = carbon dioxide production; VO2 = oxygen uptake; WR = work rate.
Table 2. Clinical parameters, risk factors and biomarkers.
General Population
(n = 43)
ATTR-CA
(n = 15)
HFpEF
(n = 9)
HCMO
(n = 19)
p Value < 0.05 *
Age, (years)68 ± 1073 ± 974 ± 762 ± 90.001 *
BSA, (m2)2.0 ± 0.32.0 ± 0.22.0 ± 0.22.0 ± 0.30.92
NYHA II class, n (%) 32 ( 74 % ) 9 ( 60 % ) 5 ( 56 % ) 18 ( 95 % ) 0.024 *
Hypertension, n (%) 34 ( 79 % ) 9 ( 60 % ) 8 ( 89 % ) 17 ( 90 % ) 0.08
Diabetes, n (%) 5 ( 12 % ) 2 ( 13 % ) 2 ( 22 % ) 5 ( 26 % ) 0.41
Smoker, n (%) 17 ( 40 % ) 7 ( 47 % ) 2 ( 22 % ) 8 ( 42 % ) 0.59
AF, n (%) 15 ( 35 % ) 6 ( 40 % ) 4 ( 44 % ) 5 ( 26 % ) 0.33
CAD, n (%) 10 ( 23 % ) 6 ( 40 % ) 3 ( 33 % ) 1 ( 5 % ) 0.037 *
logTnT1261 (1055–1433) 1582 ( 1359 - 1655 ) 1063 ( 1000 1202 ) 1128 ( 1023 1246 ) <0.001 *
NTproBNP, (pg/mL) 933 ( 459 1573 ) 1007 ( 650 1697 ) 793 ( 132 1714 ) 693 ( 447 1652 ) 0.62
EGFR, (mL/min/1.73 m2)75 ± 1769 ± 2071 ± 879 ± 150.23
β -blocker, n (%) 31 ( 72 % ) 8 ( 53 % ) 6 ( 67 % ) 17 ( 90 % ) 0.061
ACEi/ARB/ARNI, n (%) 28 ( 65 % ) 10 ( 67 % ) 5 ( 56 % ) 13 ( 68 % ) 0.79
MRA, n (%) 11 ( 26 % ) 6 ( 40 % ) 1 ( 11 % ) 4 ( 21 % ) 0.24
SGLT2i, n (%) 4 ( 9 % ) 2 ( 13 % ) 1 ( 11 % ) 1 ( 5 % ) 0.71
Loop diuretic, n (%) 3 ( 7 % ) 3 ( 20 % ) 0 ( 0 % ) 0 ( 0 % ) 0.063
ACEi = Angiotensin-Converting Enzyme inhibitors; AF = atrial fibrillation; ARB = Angiotensin II Receptor Blockers; ARNI = Angiotensin Receptor–Neprilysin Inhibitors; BSA = body surface area; CAD = coronary artery disease; EGFR = estimated glomerular filtration rate; MRA = Mineralocorticoid Receptor Antagonists; NTproBNP = N-terminal pro-B-type natriuretic peptide; NYHA = New York Heart Association; SGLT2i = Sodium–Glucose Cotransporter-2 inhibitors; TnT = troponin T. * = p < 0.05 is considered statistically significant.
Table 3. Parameters measured at basal echocardiography.
General Population
(n = 43)
ATTR-CA
(n = 15)
HFpEF
(n = 9)
HCMO
(n = 19)
p Value < 0.05 *
LVMi, (g/m2)158 ± 38162 ± 36136 ± 27163 ± 410.26
IVSd, (mm)17.0 ± 2.916.7 ± 1.814.9 ± 2.318.2 ± 3.30.025 *
PWd, (mm)13.1 ± 2.414.5 ± 2.011.4 ± 1.112.5 ± 2.60.008 *
EDD, (mm)48 ± 548 ± 650 ± 548 ± 40.52
EDV, (mL)121 ± 33107 ± 31121 ± 32132 ± 330.09
EF, (%)59 ± 656 ± 759 ± 561 ± 50.022 *
E/e′ avg13.7 ± 4.714.7 ± 5.410.1 ± 3.114.6 ± 4.00.030 *
TAPSE, (mm)21 ± 420 ± 420 ± 323 ± 30.051
PASP, (mmHg)34 ± 933 ± 1033 ± 734 ± 80.93
LAVI, (mL/m2)40 ± 1041 ± 1140 ± 1240 ± 80.91
Vmax Ao, (cm/s)192 ± 93150 ± 57151 ± 52247 ± 1060.002 *
≥moderate MR, n (%) 8 ( 19 % ) 2 ( 13 % ) 0 ( 0 % ) 6 ( 32 % ) 0.024 *
≥moderate TR, n (%) 3 ( 7 % ) 1 ( 7 % ) 2 ( 22 % ) 0 ( 0 % ) 0.046 *
EDD = end-diastolic diameter; EDV = end-diastolic volume; EF = ejection fraction; E/e′ avg = average E-wave to e′-wave ratio; IVSd = interventricular septal thickness in diastole; LAVI = left atrial volume index; LVMi = left ventricular mass index; MR = mitral regurgitation; PASP = systolic pulmonary artery pressure; PWd = posterior wall thickness in diastole; TAPSE = tricuspid annular plane systolic excursion; TR = tricuspid regurgitation; Vmax Ao = maximum aortic velocity. * = p < 0.05 is considered statistically significant.
Table 4. Parameters measured by CPET-ESE at baseline and at peak exercise.
General Population
(n = 43)
ATTR-CA
(n = 15)
HFpEF
(n = 9)
HCMO
(n = 19)
p Value < 0.05 *
basal SBP, (mmHg)131 ± 19130 ± 20130 ± 23133 ± 160.84
basal DBP, (mmHg)74 ± 1071 ± 1172 ± 1276 ± 80.30
basal HR, (bpm)64 ± 1266 ± 1268 ± 1160 ± 120.24
basal CI, (L/min/m2)2.3 ± 0.62.2 ± 0.52.3 ± 0.52.4 ± 0.70.44
basal SVi, (mL/m2)37 ± 935 ± 1036 ± 540 ± 90.15
basal E/e′ avg12.7 ± 5.012.5 ± 5.29.1 ± 4.114.6 ± 4.20.017 *
basal TAPSE, (mm)22 ± 320 ± 322 ± 423 ± 30.052
basal PASP, (mmHg)32 ± 829 ± 531 ± 834 ± 90.14
basal TAPSE/PASP, (mm/mmHg)0.72 ± 0.210.73 ± 0.210.78 ± 0.270.70 ± 0.180.69
basal VO2, (mL/min/Kg)3.85 ± 1.573.04 ± 1.362.90 ± 0.634.92 ± 1.40<0.001 *
basal C(a-v)O2, (mL/100 mL)7.24 ± 3.076.20 ± 3.395.50 ± 1.368.88 ± 2.640.004 *
peak SBP, (mmHg)184 ± 27180 ± 27176 ± 32191 ± 240.27
peak DBP, (mmHg)91 ± 1585 ± 1589 ± 1795 ± 120.15
peak HR, (bpm)106 ± 19114 ± 22108 ± 1998 ± 140.055
peak CI, (L/min/m2)5.1 ± 1.45.1 ± 1.75.5 ± 1.54.8 ± 1.10.56
peak SVi, (mL/m2)48 ± 1244 ± 1350 ± 849 ± 120.37
peak E/e’ avg12.0 ± 4.612.3 ± 4.08.6 ± 3.813.4 ± 4.80.033 *
peak PASP, (mmHg)45 ± 1850 ± 1448 ± 1442 ± 210.44
peak ≥ moderate MR, n (%)15 (37%)3 (21%)0 (0%)12 (63%)0.003 *
peak TAPSE, (mm)27 ± 526 ± 528 ± 626 ± 40.38
peak TAPSE/PASP, (mm/mmHg)0.69 ± 0.350.55 ± 0.200.68 ± 0.340.79 ± 0.410.17
peak VO2, (mL/min/Kg)14.92 ± 3.9813.55 ± 4.7313.27 ± 3.3416.78 ± 2.840.020 *
peak C(a-v)O2, (mL/100 mL)12.77 ± 3.3711.48 ± 3.0710.46 ± 1.9714.88 ± 2.94<0.001 *
ΔTAPSE, (mm)5 ± 36 ± 36 ± 43 ± 20.047 *
ΔTAPSE/PASP, (mm/mmHg)−0.03 ± 0.31−0.18 ± 0.16−0.10 ± 0.160.10 ± 0.400.045 *
AT reached, n (%)20 (47%)1 (7%)2 (22%)17 (90%)<0.001 *
Chronotropic reserve, (%)51 ± 2362 ± 2257 ± 3239 ± 120.009 *
CO/VO2 slope6.07 ± 2.536.77 ± 2.577.25 ± 3.024.96 ± 1.820.029 *
VE/VCO2 slope28.3 ± 5.129.2 ± 7.127.9 ± 3.627.7 ± 3.70.70
AT = anaerobic threshold; CI = cardiac index; CO/VO2 slope = slope of the relationship between cardiac output and oxygen consumption; C(a-v)O2 = arteriovenous oxygen content difference; DBP = diastolic blood pressure; E/e′ avg = average E-wave to e′-wave ratio; HR = heart rate; MR = mitral regurgitation; PASP = systolic pulmonary artery pressure; SVi = stroke volume index; SBP = systolic blood pressure; TAPSE = tricuspid annular plane systolic excursion; VE/VCO2 slope = slope of the relationship between minute ventilation and carbon dioxide production; VO2 = oxygen consumption. * = p < 0.05 is considered statistically significant.
Disclaimer/Publisher’s Note: The statements, opinions and data contained in all publications are solely those of the individual author(s) and contributor(s) and not of MDPI and/or the editor(s). MDPI and/or the editor(s) disclaim responsibility for any injury to people or property resulting from any ideas, methods, instructions or products referred to in the content.