Thyroid Function, Inflammation, and HDL-Cholesterol in Women with Acne: A Real-World Cross-Sectional Study Integrating Biochemistry and Thyroid Ultrasound

 ,
,  , , ,
, , , 
 ,
,
Abstract
1. Introduction
2. Materials and Methods
2.1. Study Design and Participants
2.2. Data Sources and Variables
2.3. Thyroid Ultrasound Acquisition and Derived Measures
2.4. Data Cleaning and Harmonization
2.5. Definitions of Thyroid Status and Clinical Thresholds
2.6. Statistical Analysis
3. Results
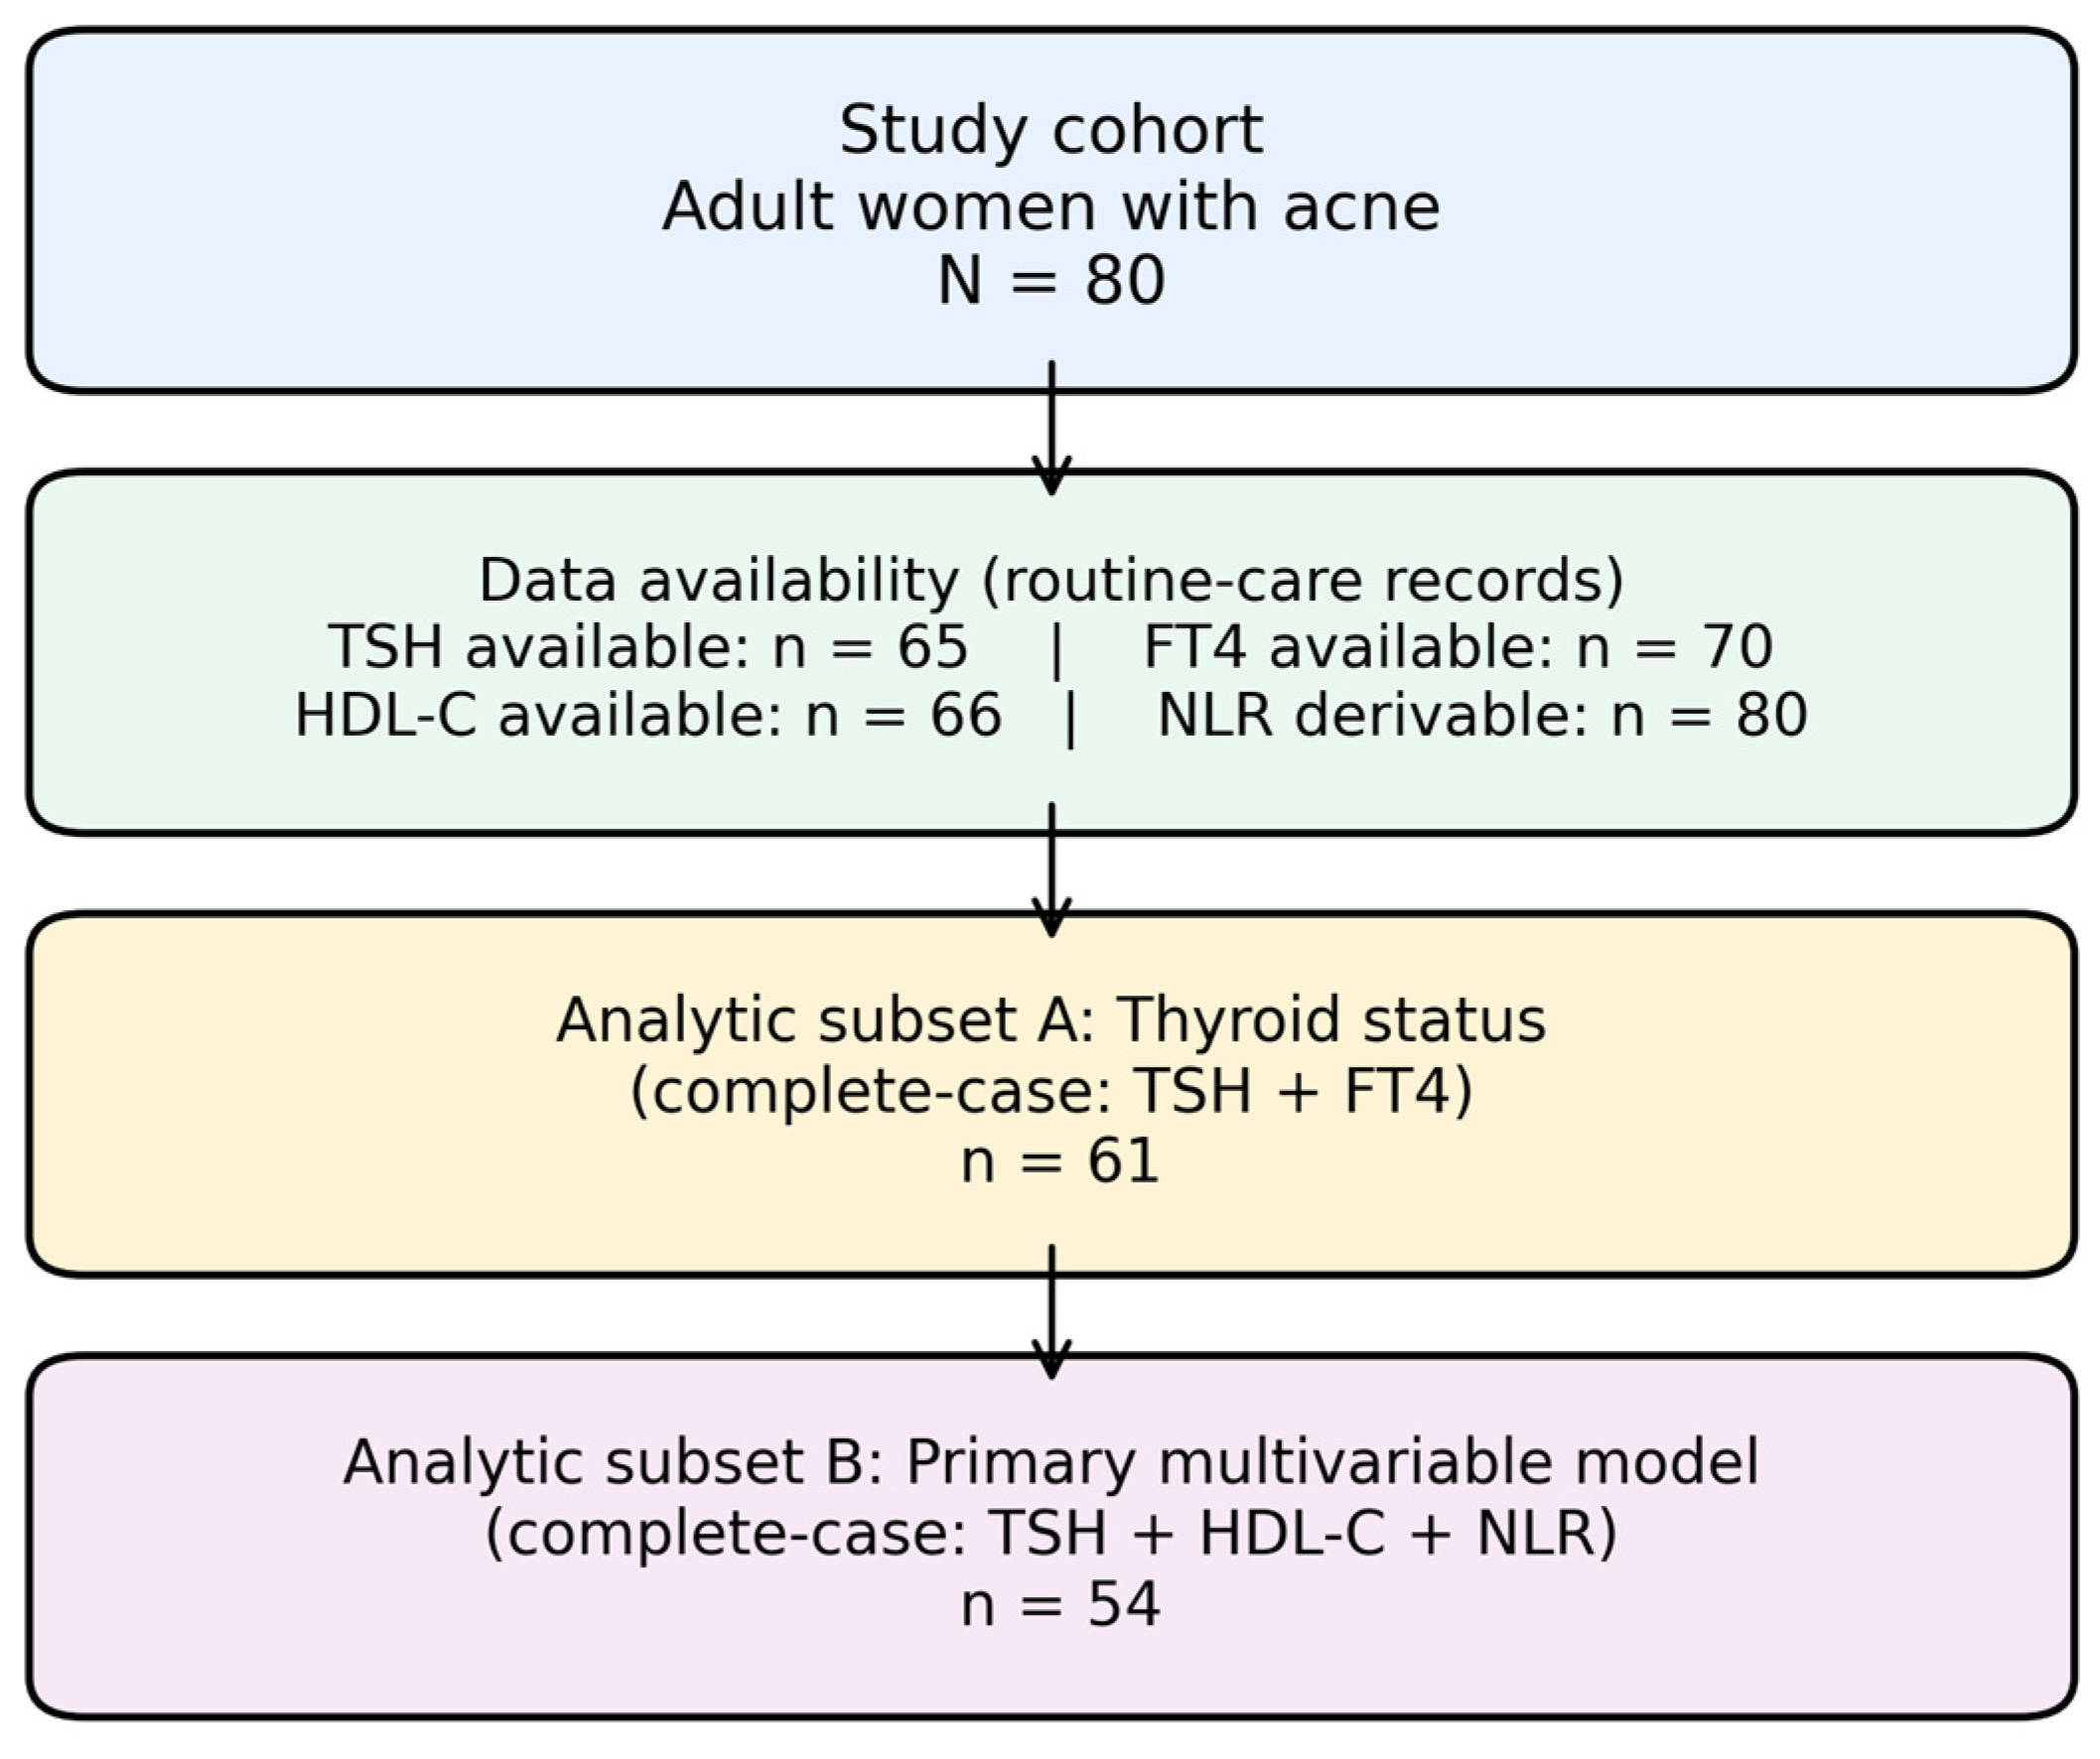
3.1. Study Sample and Data Availability
3.2. Baseline Biochemical and Endocrine Profile
3.3. Prevalence of Thyroid, Inflammatory, Endocrine, and Metabolic Abnormalities
3.4. Inferential Analyses
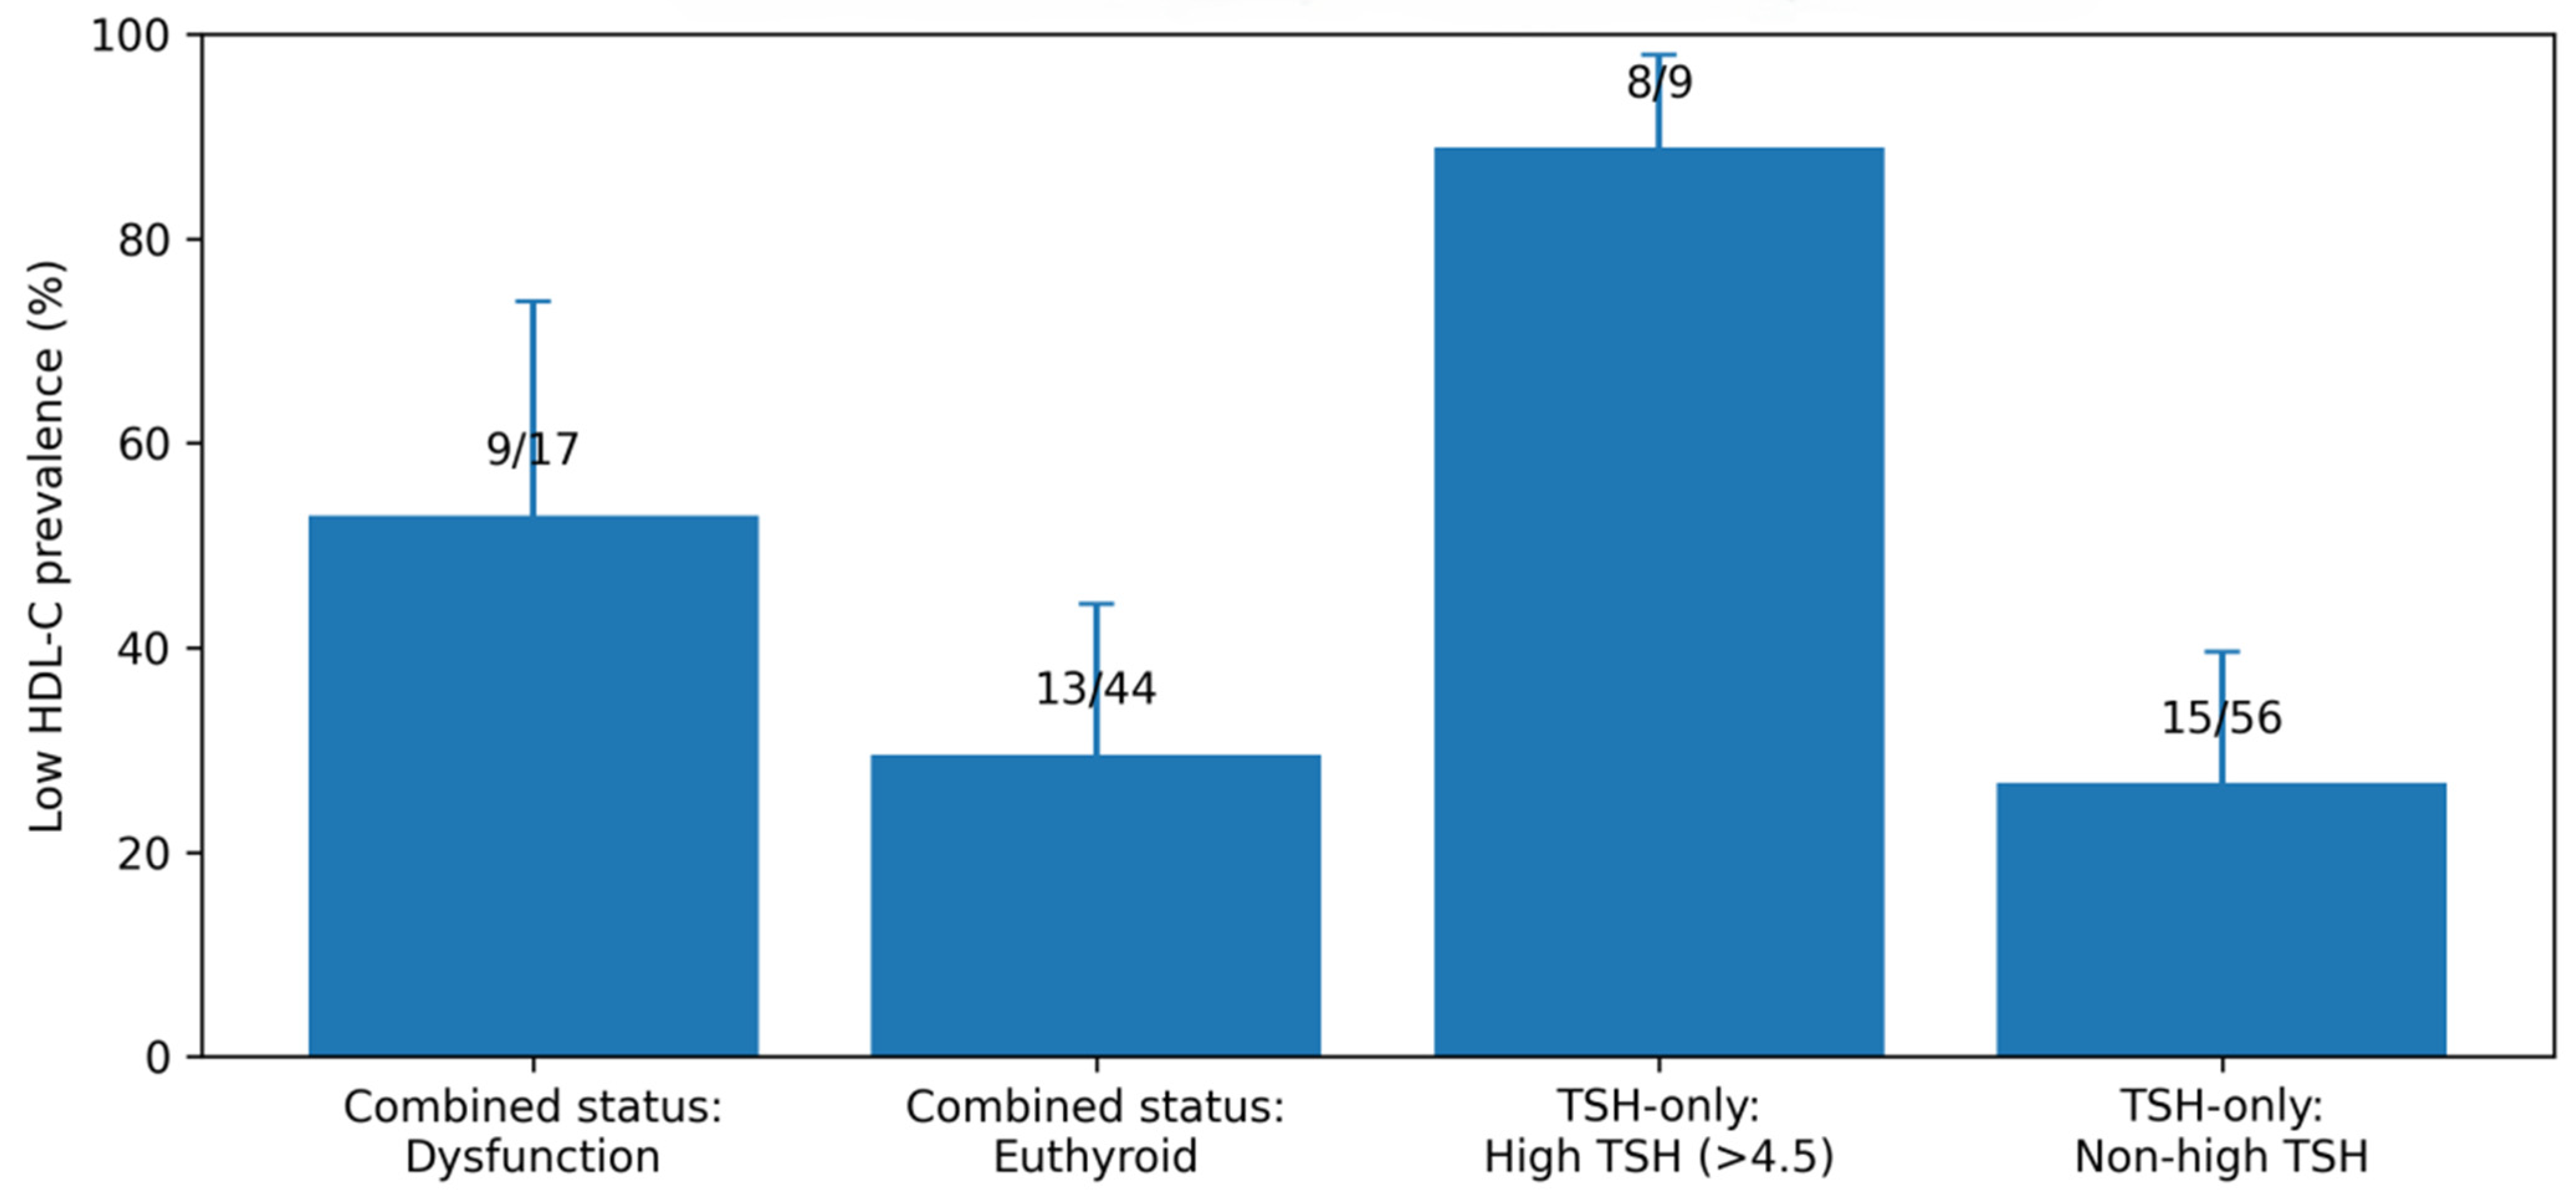
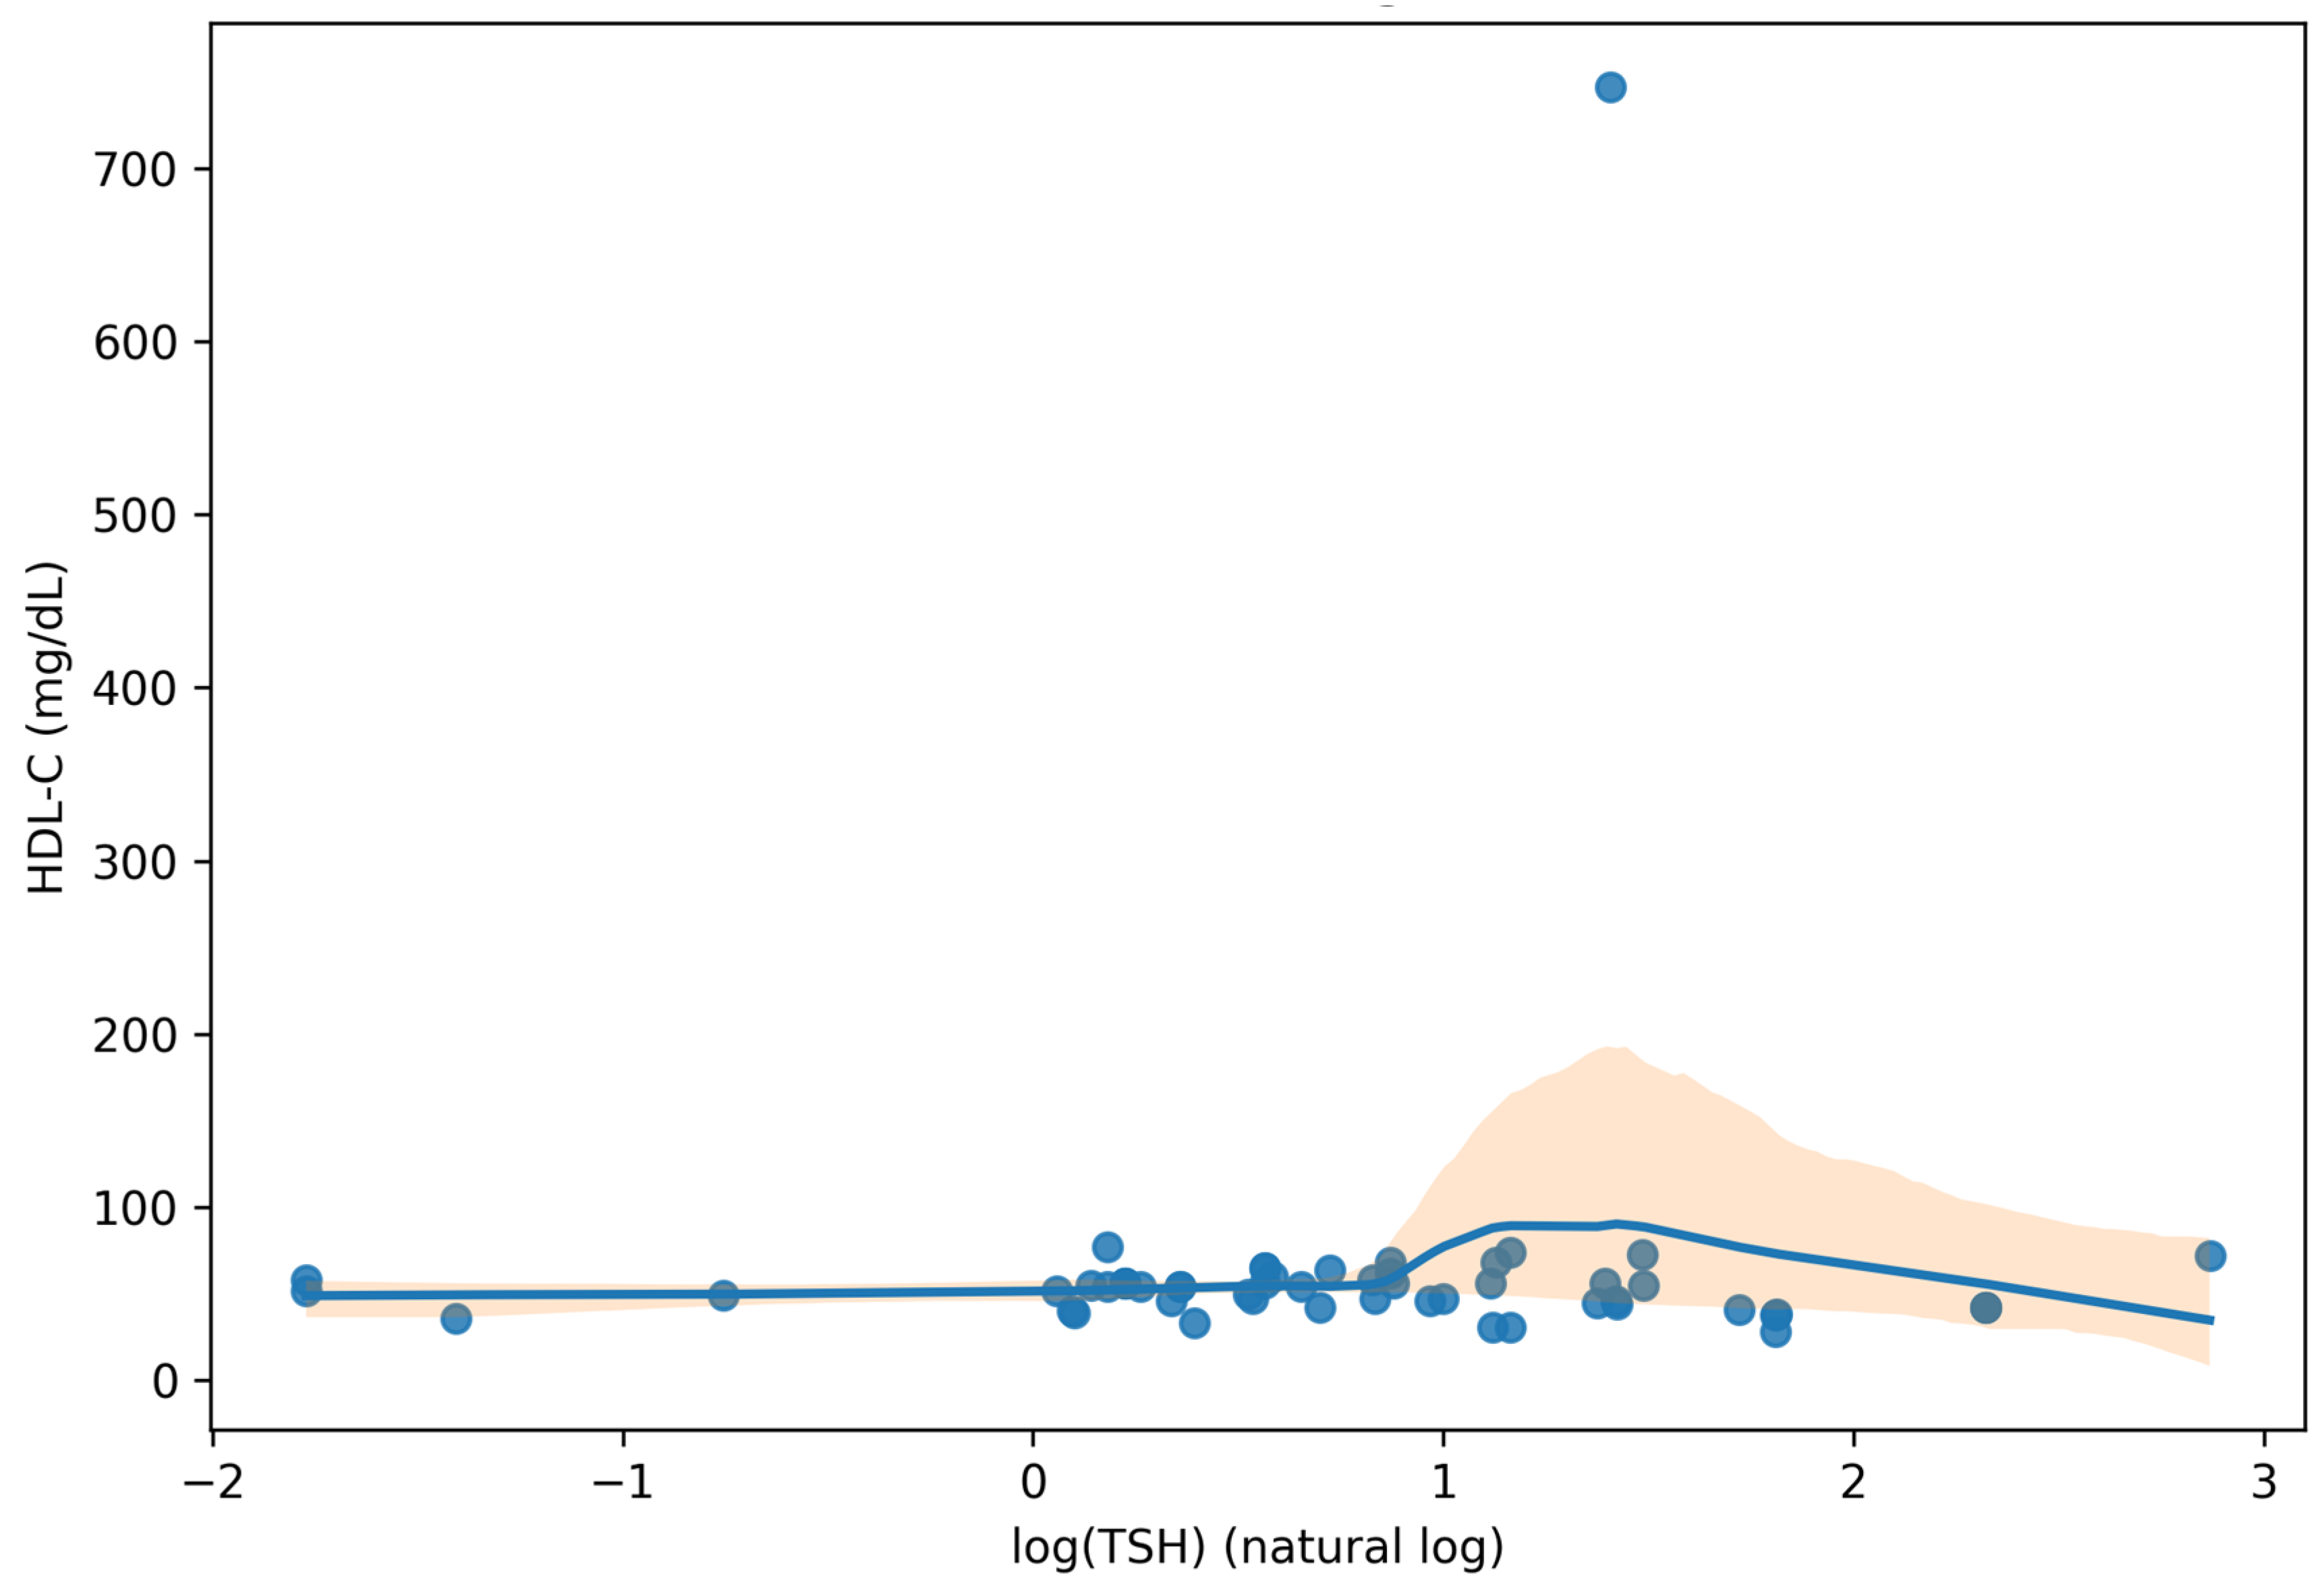
3.4.1. Low HDL-C in Relation to Thyroid Status
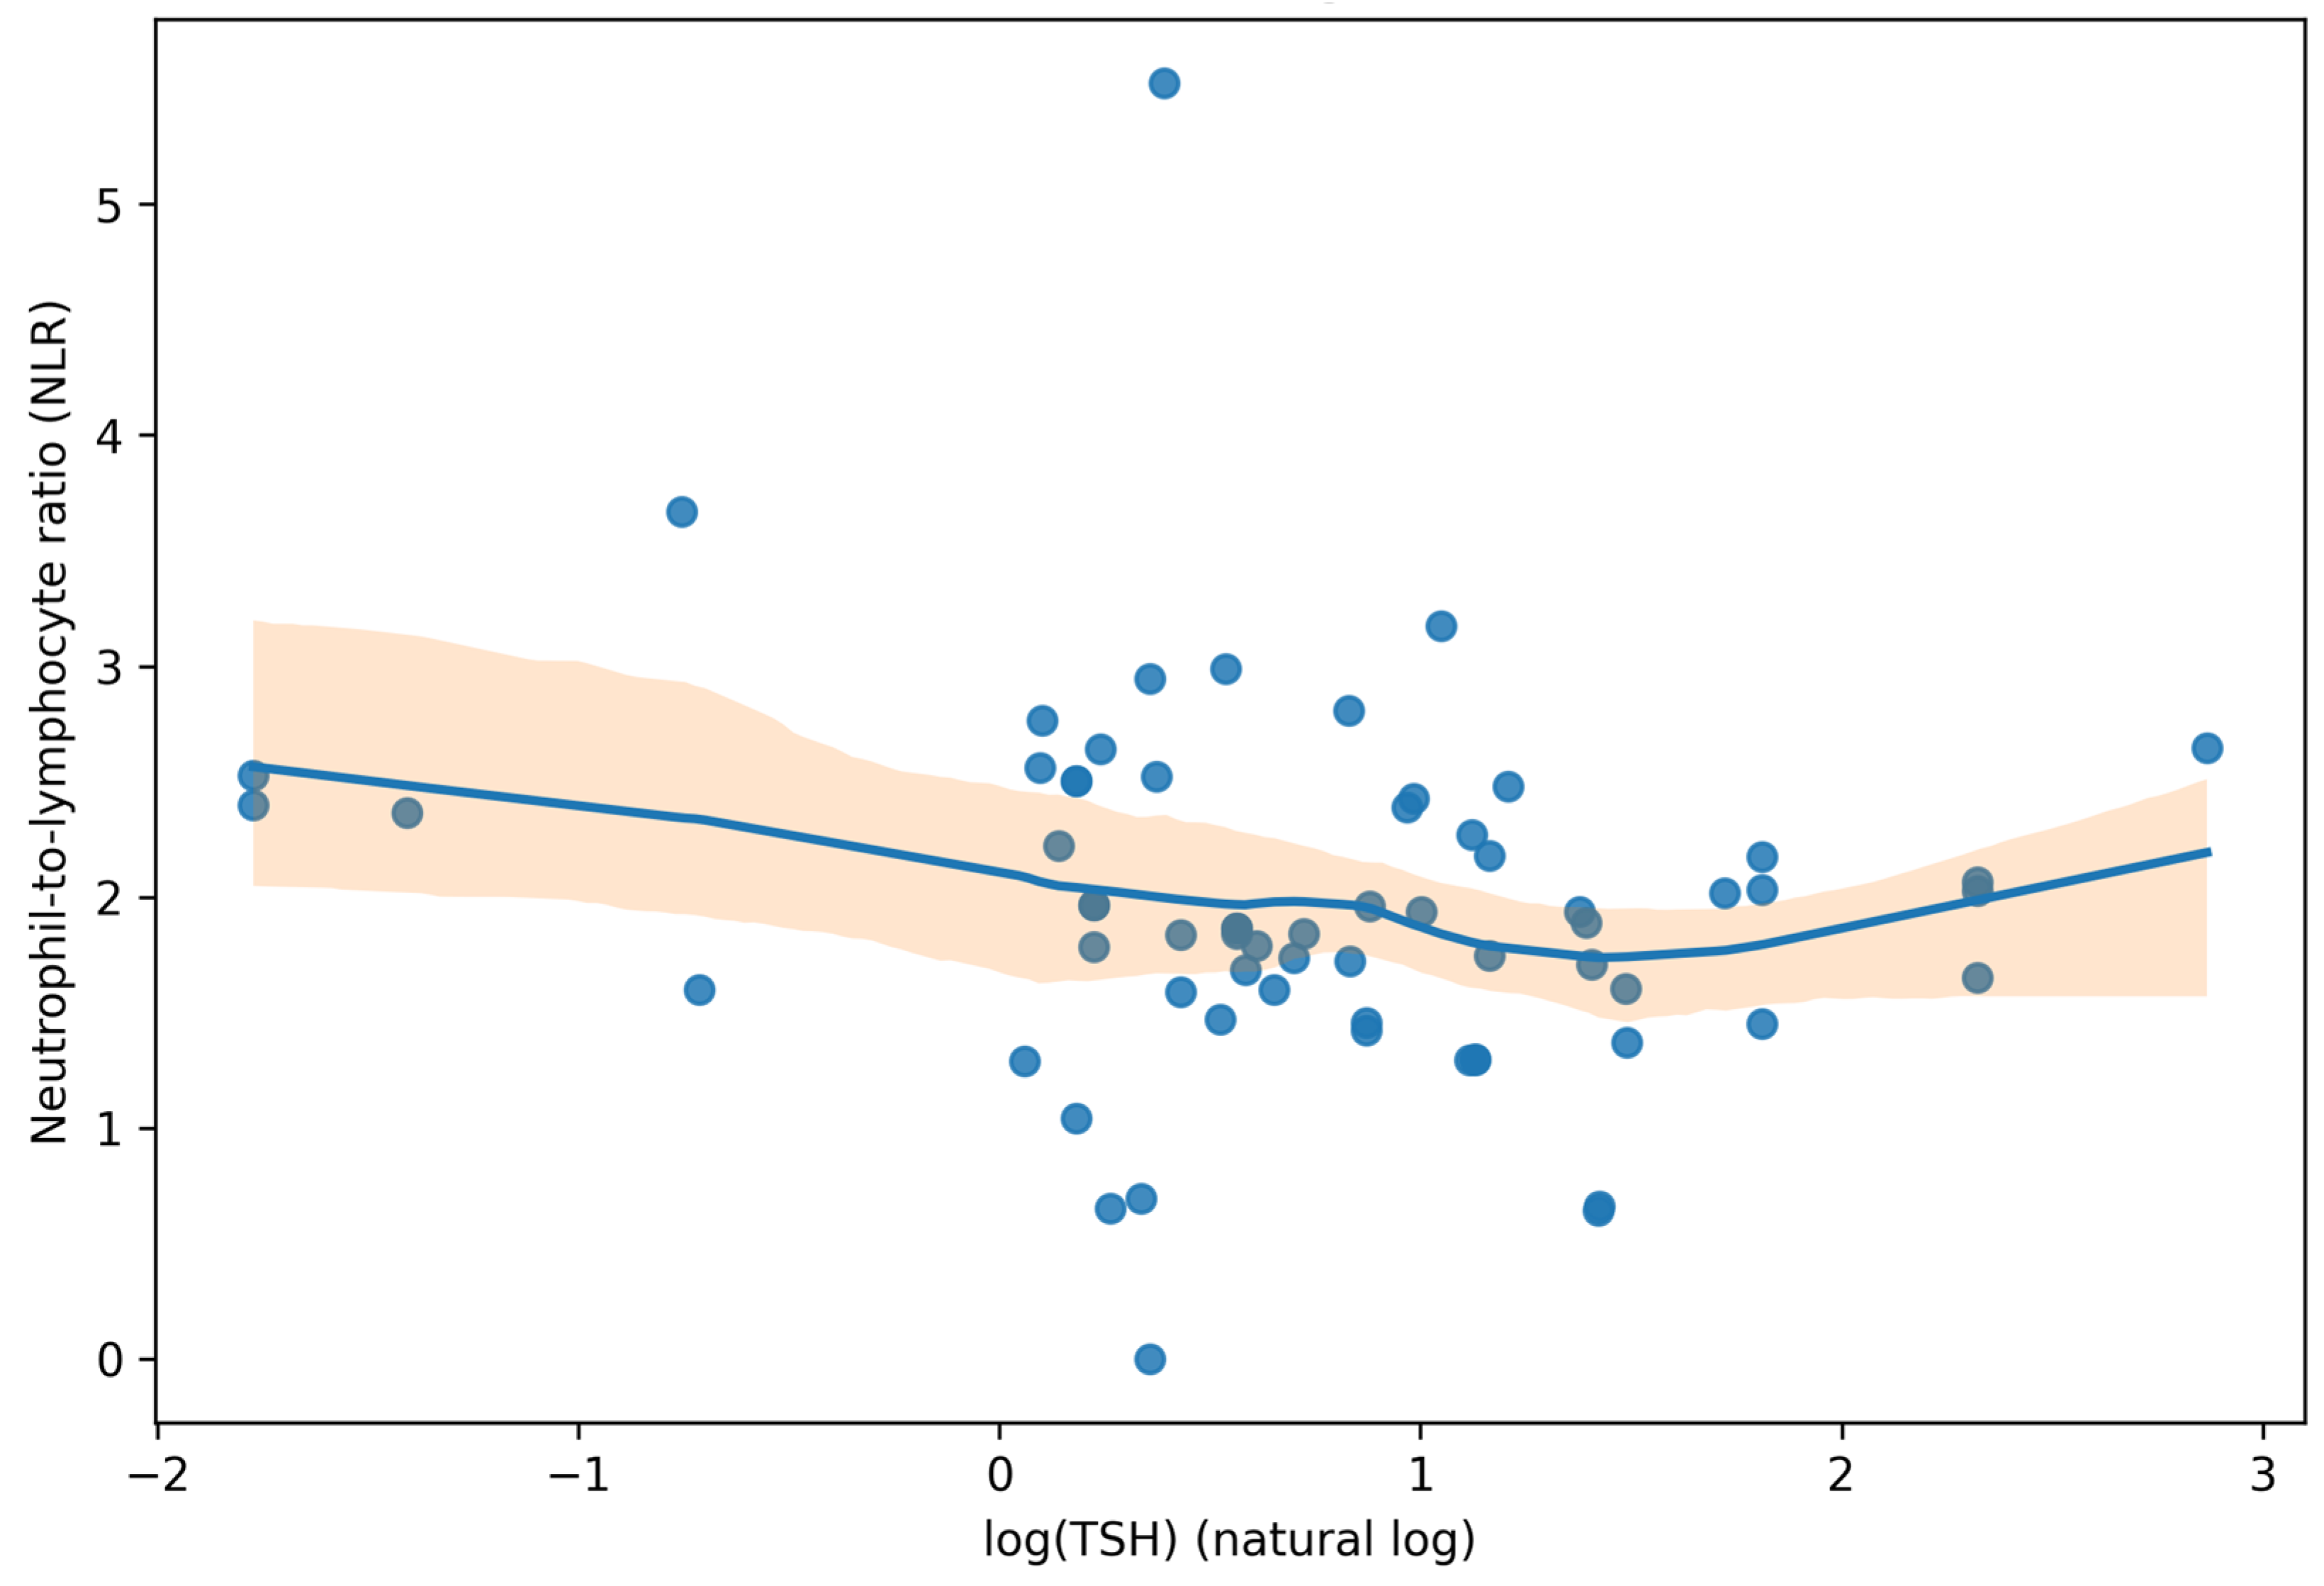
3.4.2. Inflammatory–Metabolic Coupling: NLR and HDL-C
3.4.3. Exploratory Endocrine Markers in Relation to Thyroid Status
3.4.4. Thyroid Ultrasound Metrics in Relation to TSH and Free T4
3.4.5. Multivariable Analysis for Low HDL-C
3.4.6. Data Completeness Checks for Endocrine Panels
3.5. Integrated Pattern of Associations Across Domains
4. Discussion
5. Conclusions
Author Contributions
Funding
Institutional Review Board Statement
Informed Consent Statement
Data Availability Statement
Acknowledgments
Conflicts of Interest
References
- Dréno, B.; Bagatin, E.; Blume-Peytavi, U.; Rocha, M.; Gollnick, H. Female Type of Adult Acne: Physiological and Psychological Considerations and Management. J. Dtsch. Dermatol. Ges. 2018, 16, 1185–1194. [Google Scholar] [CrossRef] [PubMed]
- Bagatin, E.; Freitas, T.H.P.; Rivitti-Machado, M.C.; Machado, M.C.R.; Ribeiro, B.M.; Nunes, S. Adult Female Acne: A Guide to Clinical Practice. Int. J. Womens Dermatol. 2019, 5, 85–92. [Google Scholar] [CrossRef] [PubMed]
- Carmina, E.; Azziz, R.; Bergfeld, W.F.; Escobar-Morreale, H.F.; Futterweit, W.; Huddleston, H.G.; Spritzer, P.M.; Tan, M.H.; Witchel, S.F.; Yildiz, B.O. Female Adult Acne and Androgen Excess: A Report from the Multidisciplinary Androgen Excess and PCOS Committee. J. Endocr. Soc. 2022, 6, bvac003. [Google Scholar] [CrossRef] [PubMed]
- Vergou, T.; Mantzou, E.; Tseke, P.; Moustou, A.E.; Katsambas, A.; Alevizaki, M.; Antoniou, C. Association of Thyroid Autoimmunity with Acne in Adult Women. J. Eur. Acad. Dermatol. Venereol. 2012, 26, 413–416. [Google Scholar] [CrossRef] [PubMed]
- Ekiz, O.; Balta, I.; Unlu, E.; Bulbul Sen, B.; Rifaioğlu, E.N.; Dogramaci, A.C. Assessment of thyroid function and lipid profile in patients with postadolescent acne in a Mediterranean population from Turkey. Int. J. Dermatol. 2015, 54, 1376–1381. [Google Scholar] [CrossRef] [PubMed]
- Sobhan, M.; Seif Rabiei, M.A.; Amerifar, M. Correlation Between Lipid Profile and Acne Vulgaris. Clin. Cosmet. Investig. Dermatol. 2020, 13, 67–71. [Google Scholar] [CrossRef] [PubMed]
- Wiesel, V.; Weissmann, S.; Cohen, B.; Golan-Tripto, I.; Horev, A. Elevated hematologic ratios are correlated with acne severity: A national, retrospective cohort study. Front. Med. 2024, 11, 1475117. [Google Scholar] [CrossRef] [PubMed] [PubMed Central]
- Chen, T.; Chen, Y.; Shao, X.; Chen, J.; Liu, L.; Li, Y.; Pu, Y.; Chen, J. Hematological parameters in patients with acnes. J Cosmet Dermatol. 2023, 22, 2099–2104. [Google Scholar] [CrossRef] [PubMed]
- Bungau, A.F.; Tit, D.M.; Bungau, S.G.; Vesa, C.M.; Radu, A.-F.; Marin, R.C.; Endres, L.M.; Moleriu, L.-C. Exploring the Metabolic and Endocrine Preconditioning Associated with Thyroid Disorders: Risk Assessment and Association with Acne Severity. Int. J. Mol. Sci. 2024, 25, 721. [Google Scholar] [CrossRef] [PubMed]
- James, W.D. Acne. N. Engl. J. Med. 2005, 352, 1463–1472. [Google Scholar] [CrossRef] [PubMed]
- Niepomniszcze, H.; Amad, R.H. Skin Disorders and Thyroid Diseases. J. Endocrinol. Investig. 2001, 24, 628–638. [Google Scholar] [CrossRef] [PubMed]
- Endres, L.; Tit, D.M.; Bungau, S.; Pascalau, N.A.; Maghiar Țodan, L.; Bimbo-Szuhai, E.; Iancu, G.M.; Negrut, N. Incidence and Clinical Implications of Autoimmune Thyroiditis in the Development of Acne in Young Patients. Diagnostics 2021, 11, 794. [Google Scholar] [CrossRef]
- Nuzzo, V.; Tauchmanova, L.; Colasanti, P.; Zuccoli, A.; Colao, A. Idiopathic chronic urticaria and thyroid autoimmunity: Experience of a single center. Derm. Endocrinol. 2011, 3, 255–258. [Google Scholar] [CrossRef] [PubMed][Green Version]
- Bucurica, S.; Nancoff, A.S.; Dutu, M.; Mititelu, M.R.; Gaman, L.E.; Ioniță-Radu, F.; Jinga, M.; Maniu, I.; Ruța, F. Exploring the Relationship between Lipid Profile, Inflammatory State and 25-OH Vitamin D Serum Levels in Hospitalized Patients. Biomedicines 2024, 12, 1686. [Google Scholar] [CrossRef] [PubMed]
- Cao, N.; Li, X.; Zhang, W.; Wang, Q.; Liang, Y.; Zhou, F.; Xiao, X. Research progress of signaling pathways of the natural substances intervene dyslipidemia (Review). Exp. Ther. Med. 2022, 24, 494. [Google Scholar] [CrossRef] [PubMed]
- Ionita-Radu, F.; Patoni, C.; Nancoff, A.S.; Marin, F.-S.; Gaman, L.; Bucurica, A.; Socol, C.; Jinga, M.; Dutu, M.; Bucurica, S. Berberine Effects in Pre-Fibrotic Stages of Non-Alcoholic Fatty Liver Disease—Clinical and Pre-Clinical Overview and Systematic Review of the Literature. Int. J. Mol. Sci. 2024, 25, 4201. [Google Scholar] [CrossRef] [PubMed]
- Petranović Ovčariček, P.; Giovanella, L. Thyroid Ultrasonography: Much Ado About Nothing? A Provocative Analysis. Cancers 2025, 17, 1764. [Google Scholar] [CrossRef] [PubMed]
- Carnazza, M.; Quaranto, D.; DeSouza, N.; Moscatello, A.L.; Garber, D.; Hemmerdinger, S.; Islam, H.K.; Tiwari, R.K.; Li, X.-M.; Geliebter, J. The Current Understanding of the Molecular Pathogenesis of Papillary Thyroid Cancer. Int. J. Mol. Sci. 2025, 26, 4646. [Google Scholar] [CrossRef] [PubMed]
- Boostani, M.; Bánvölgyi, A.; Goldust, M.; Cantisani, C.; Pietkiewicz, P.; Lőrincz, K.; Holló, P.; Wikonkál, N.M.; Paragh, G.; Kiss, N. Diagnostic Performance of GPT-4o and Gemini Flash 2.0 in Acne and Rosacea. Int. J. Dermatol. 2025, 64, 1881–1882. [Google Scholar] [CrossRef] [PubMed]



| Domain | Variable | n | Missing, n (%) | Median [IQR] | Min–Max |
| Thyroid function | |||||
| Thyroid function | TSH (mIU/L) | 65 | 15 (18.8%) | 2.01 [1.30–3.20] | 0.17–17.60 |
| Thyroid function | Free T4 (ng/dL) | 70 | 10 (12.5%) | 1.08 [0.92–1.17] | 0.28–3.23 |
| Thyroid autoimmunity | |||||
| Thyroid autoimmunity | Anti-TPO antibodies (IU/mL) | 31 | 49 (61.3%) | 3.5 [2.3–12.1] | 1.5–876.0 |
| Thyroid autoimmunity | Anti-thyroglobulin antibodies (IU/mL) | 31 | 49 (61.3%) | 12.6 [5.0–25.6] | 0.1–207.0 |
| Thyroid ultrasound (numeric subset) | |||||
| Thyroid ultrasound | Isthmus thickness (mm) | 66 | 14 (17.5%) | 4.0 [4.0–4.0] | 3.0–7.0 |
| Thyroid ultrasound | Left lobe volume (mL) | 61 | 19 (23.8%) | 2.28 [1.95–3.21] | 1.10–7.41 |
| Thyroid ultrasound | Right lobe volume (mL) | 60 | 20 (25.0%) | 2.28 [1.95–3.23] | 0.48–7.79 |
| Thyroid ultrasound | Total thyroid volume (mL) | 60 | 20 (25.0%) | 4.52 [4.07–6.47] | 2.50–15.20 |
| Thyroid ultrasound | Ultrasound recorded as “normal” (text-only) | 80 | 0 (0.0%) | 20/80 (25.0%) | 16.8–35.5% |
| Metabolic profile | |||||
| Metabolic profile | Plasma glucose (mg/dL) | 66 | 14 (17.5%) | 113.4 [100.8–115.2] | 63.0–122.4 |
| Metabolic profile | Total cholesterol (mg/dL) | 63 | 17 (21.2%) | 172.0 [160.0–180.0] | 99.0–290.0 |
| Metabolic profile | LDL-C (mg/dL) | 66 | 14 (17.5%) | 80.0 [71.0–89.0] | 21.0–180.0 |
| Metabolic profile | HDL-C (mg/dL) | 66 | 14 (17.5%) | 54.0 [44.2–58.0] | 28.1–77.0 |
| Metabolic profile | Triglycerides (mg/dL) | 65 | 15 (18.8%) | 65.0 [45.0–68.0] | 3.0–390.0 |
| Metabolic profile | Non-HDL-C (mg/dL) | 62 | 18 (22.5%) | 121.5 [108.5–130.0] | 27.0–241.0 |
| Metabolic profile | TG/HDL ratio | 63 | 17 (21.2%) | 1.20 [0.82–1.46] | 0.07–12.58 |
| Renal function and electrolytes | |||||
| Renal/electrolytes | Urea (mg/dL) | 64 | 16 (20.0%) | 18.0 [18.0–18.0] | 15.0–19.0 |
| Renal/electrolytes | Creatinine (mg/dL) | 66 | 14 (17.5%) | 0.56 [0.52–0.59] | 0.38–0.71 |
| Renal/electrolytes | Uric acid (mg/dL) | 32 | 48 (60.0%) | 3.2 [3.2–3.2] | 3.0–13.2 |
| Renal/electrolytes | Sodium (mmol/L) | 30 | 50 (62.5%) | 137.0 [136.2–138.0] | 136.0–148.0 |
| Renal/electrolytes | Potassium (mmol/L) | 57 | 23 (28.7%) | 4.55 [4.20–5.60] | 3.90–6.10 |
| Renal/electrolytes | Chloride (mmol/L) | 30 | 50 (62.5%) | 103.5 [101.2–105.0] | 100.0–106.0 |
| Renal/electrolytes | Calcium (mg/dL) | 48 | 32 (40.0%) | 9.30 [9.20–9.30] | 9.00–9.50 |
| Liver enzymes | |||||
| Liver enzymes | ALT (U/L) | 47 | 33 (41.2%) | 16.0 [15.0–16.0] | 12.0–19.0 |
| Liver enzymes | AST (U/L) | 46 | 34 (42.5%) | 19.0 [18.0–19.0] | 10.0–20.0 |
| Hematology and inflammation | |||||
| Hematology | Hemoglobin (g/dL) | 77 | 3 (3.8%) | 12.9 [12.8–12.9] | 12.6–13.7 |
| Hematology | White blood cells (103/µL) | 77 | 3 (3.8%) | 18.80 [18.80–18.90] | 1.80–39.80 |
| Hematology | Platelets (103/µL) | 75 | 5 (6.2%) | 330 [328–376] | 165–393 |
| Hematology | Neutrophils (%) | 79 | 1 (1.3%) | 60.0 [56.1–64.2] | 34.7–80.1 |
| Hematology | Lymphocytes (%) | 79 | 1 (1.3%) | 32.5 [27.0–36.3] | 14.5–54.4 |
| Hematology | Monocytes (%) | 79 | 1 (1.3%) | 6.0 [4.9–7.0] | 0.0–10.0 |
| Hematology | Eosinophils (%) | 79 | 1 (1.3%) | 1.4 [1.3–1.9] | 0.0–11.6 |
| Hematology | Basophils (%) | 79 | 1 (1.3%) | 0.5 [0.5–0.6] | 0.0–11.0 |
| Hematology | ESR (mm/h) | 60 | 20 (25.0%) | 5 [5–6] | 4–7 |
| Exploratory endocrine markers | |||||
| Endocrine | Total testosterone (ng/dL) | 19 | 61 (76.2%) | 25.0 [16.8–54.0] | 10.0–90.0 |
| Endocrine | LH (mIU/mL) | 20 | 60 (75.0%) | 6.15 [4.88–7.39] | 3.00–9.50 |
| Endocrine | FSH (mIU/mL) | 42 | 38 (47.5%) | 6.18 [4.64–10.50] | 0.21–27.00 |
| Endocrine | Prolactin (mIU/mL) | 44 | 36 (45.0%) | 33.1 [14.6–186.8] | 2.3–473.0 |
| Endocrine | Estradiol (pg/mL) | 37 | 43 (53.8%) | 57.3 [28.0–84.6] | 0.4–293.9 |
| Endocrine | Progesterone (ng/mL) | 10 | 70 (87.5%) | 0.38 [0.24–0.76] | 0.10–12.70 |
| Endocrine | Cortisol (ng/dL) | 8 | 72 (90.0%) | 8.1 [7.1–9.3] | 7.0–17.8 |
| Endocrine | ACTH (pg/mL) | 22 | 58 (72.5%) | 18.0 [7.6–30.8] | 6.6–53.8 |
| Endocrine | Parathyroid hormone (pg/mL) | 34 | 46 (57.5%) | 35.6 [21.7–51.9] | 1.0–67.6 |
| Parameter | n/N (%) | 95% CI | N Available |
| Thyroid status (TSH 0.4–4.5 mIU/L; free T4 0.8–1.8 ng/dL) | |||
| Low TSH (<0.4 mIU/L) | 3/65 (4.6%) | 1.6–12.7% | 65 |
| High TSH (>4.5 mIU/L) | 8/65 (12.3%) | 6.4–22.5% | 65 |
| Low free T4 (<0.8 ng/dL) | 5/70 (7.1%) | 3.1–15.7% | 70 |
| High free T4 (>1.8 ng/dL) | 3/70 (4.3%) | 1.5–11.9% | 70 |
| Subclinical hypothyroidism (TSH > 4.5 with normal FT4) | 9/61 (14.8%) | 8.1–25.5% | 61 |
| Overt hypothyroidism (TSH > 4.5 with low FT4) | 0/61 (0.0%) | 0.0–5.9% | 61 |
| Subclinical hyperthyroidism (TSH < 0.4 with normal FT4) | 0/61 (0.0%) | 0.0–5.9% | 61 |
| Overt hyperthyroidism (TSH < 0.4 with high FT4) | 3/61 (4.9%) | 1.7–13.5% | 61 |
| Any thyroid dysfunction (any non-euthyroid combined pattern) | 16/61 (27.9%) | 16.8–38.4% | 61 |
| Inflammatory and endocrine markers (subset-dependent) | |||
| Leukocytosis (WBC > 10 × 103/µL) † | 76/77 (98.7%) | 93.0–99.8% | 77 |
| NLR > 2.0 | 30/79 (38.0%) | 28.1–49.0% | 79 |
| Prolactin > 25 (as recorded) | 26/44 (59.1%) | 44.4–72.4% | 44 |
| Metabolic abnormalities | |||
| Low HDL-C (<50 mg/dL) | 26/66 (39.4%) | 28.5–51.5% | 66 |
| Total cholesterol ≥ 200 mg/dL | 2/63 (3.2%) | 0.9–10.9% | 63 |
| LDL-C ≥ 130 mg/dL | 1/66 (1.5%) | 0.3–8.1% | 66 |
| Triglycerides ≥ 150 mg/dL | 1/65 (1.5%) | 0.3–8.2% | 65 |
| Hypoglycemia (glucose < 70 mg/dL) ‡ | 1/66 (1.5%) | 0.3–8.1% | 66 |
| Glucose ≥ 100 mg/dL ‡ | 54/66 (81.8%) | 70.9–89.3% | 66 |
| Glucose ≥ 126 mg/dL ‡ | 0/66 (0.0%) | 0.0–5.5% | 66 |
| Liver enzymes | |||
| ALT > 45 U/L | 0/47 (0.0%) | 0.0–7.6% | 47 |
| AST > 43 U/L | 0/46 (0.0%) | 0.0–7.7% | 46 |
| Thyroid antibodies and ultrasound | |||
| Anti-TPO > 35 IU/mL | 3/31 (9.7%) | 3.3–24.9% | 31 |
| Anti-thyroglobulin > 40 IU/mL | 6/31 (19.4%) | 9.2–36.3% | 31 |
| Enlarged thyroid volume (>18 mL, women) | 0/60 (0.0%) | 0.0–6.0% | 60 |
| Ultrasound documented as “normal” (text-only) | 20/80 (25.0%) | 16.8–35.5% | 80 |
| Comparison | N (Available) | Low HDL in Group 1 | Low HDL in Group 2 | OR (95% CI) | p-Value (Fisher) |
|---|---|---|---|---|---|
| Thyroid dysfunction vs. euthyroid (combined TSH + free T4; TSH ULN 4.5) | 51 | 9/16 (56.2%), 95% CI 33.2–76.9% | 13/35 (37.1%), 95% CI 23.2–53.7% | 2.18 (0.65–7.24) | 0.235 |
| High TSH (>4.5 mIU/L) vs. non-high TSH | 54 | 7/8 (87.5%), 95% CI 56.5–98.0% | 16/46 (33.3%), 95% CI 21.4–47.9% | 13.30 (1.48–116.27) | 0.007 |
| Association | n | Spearman ρ | 95% CI | p-Value |
|---|---|---|---|---|
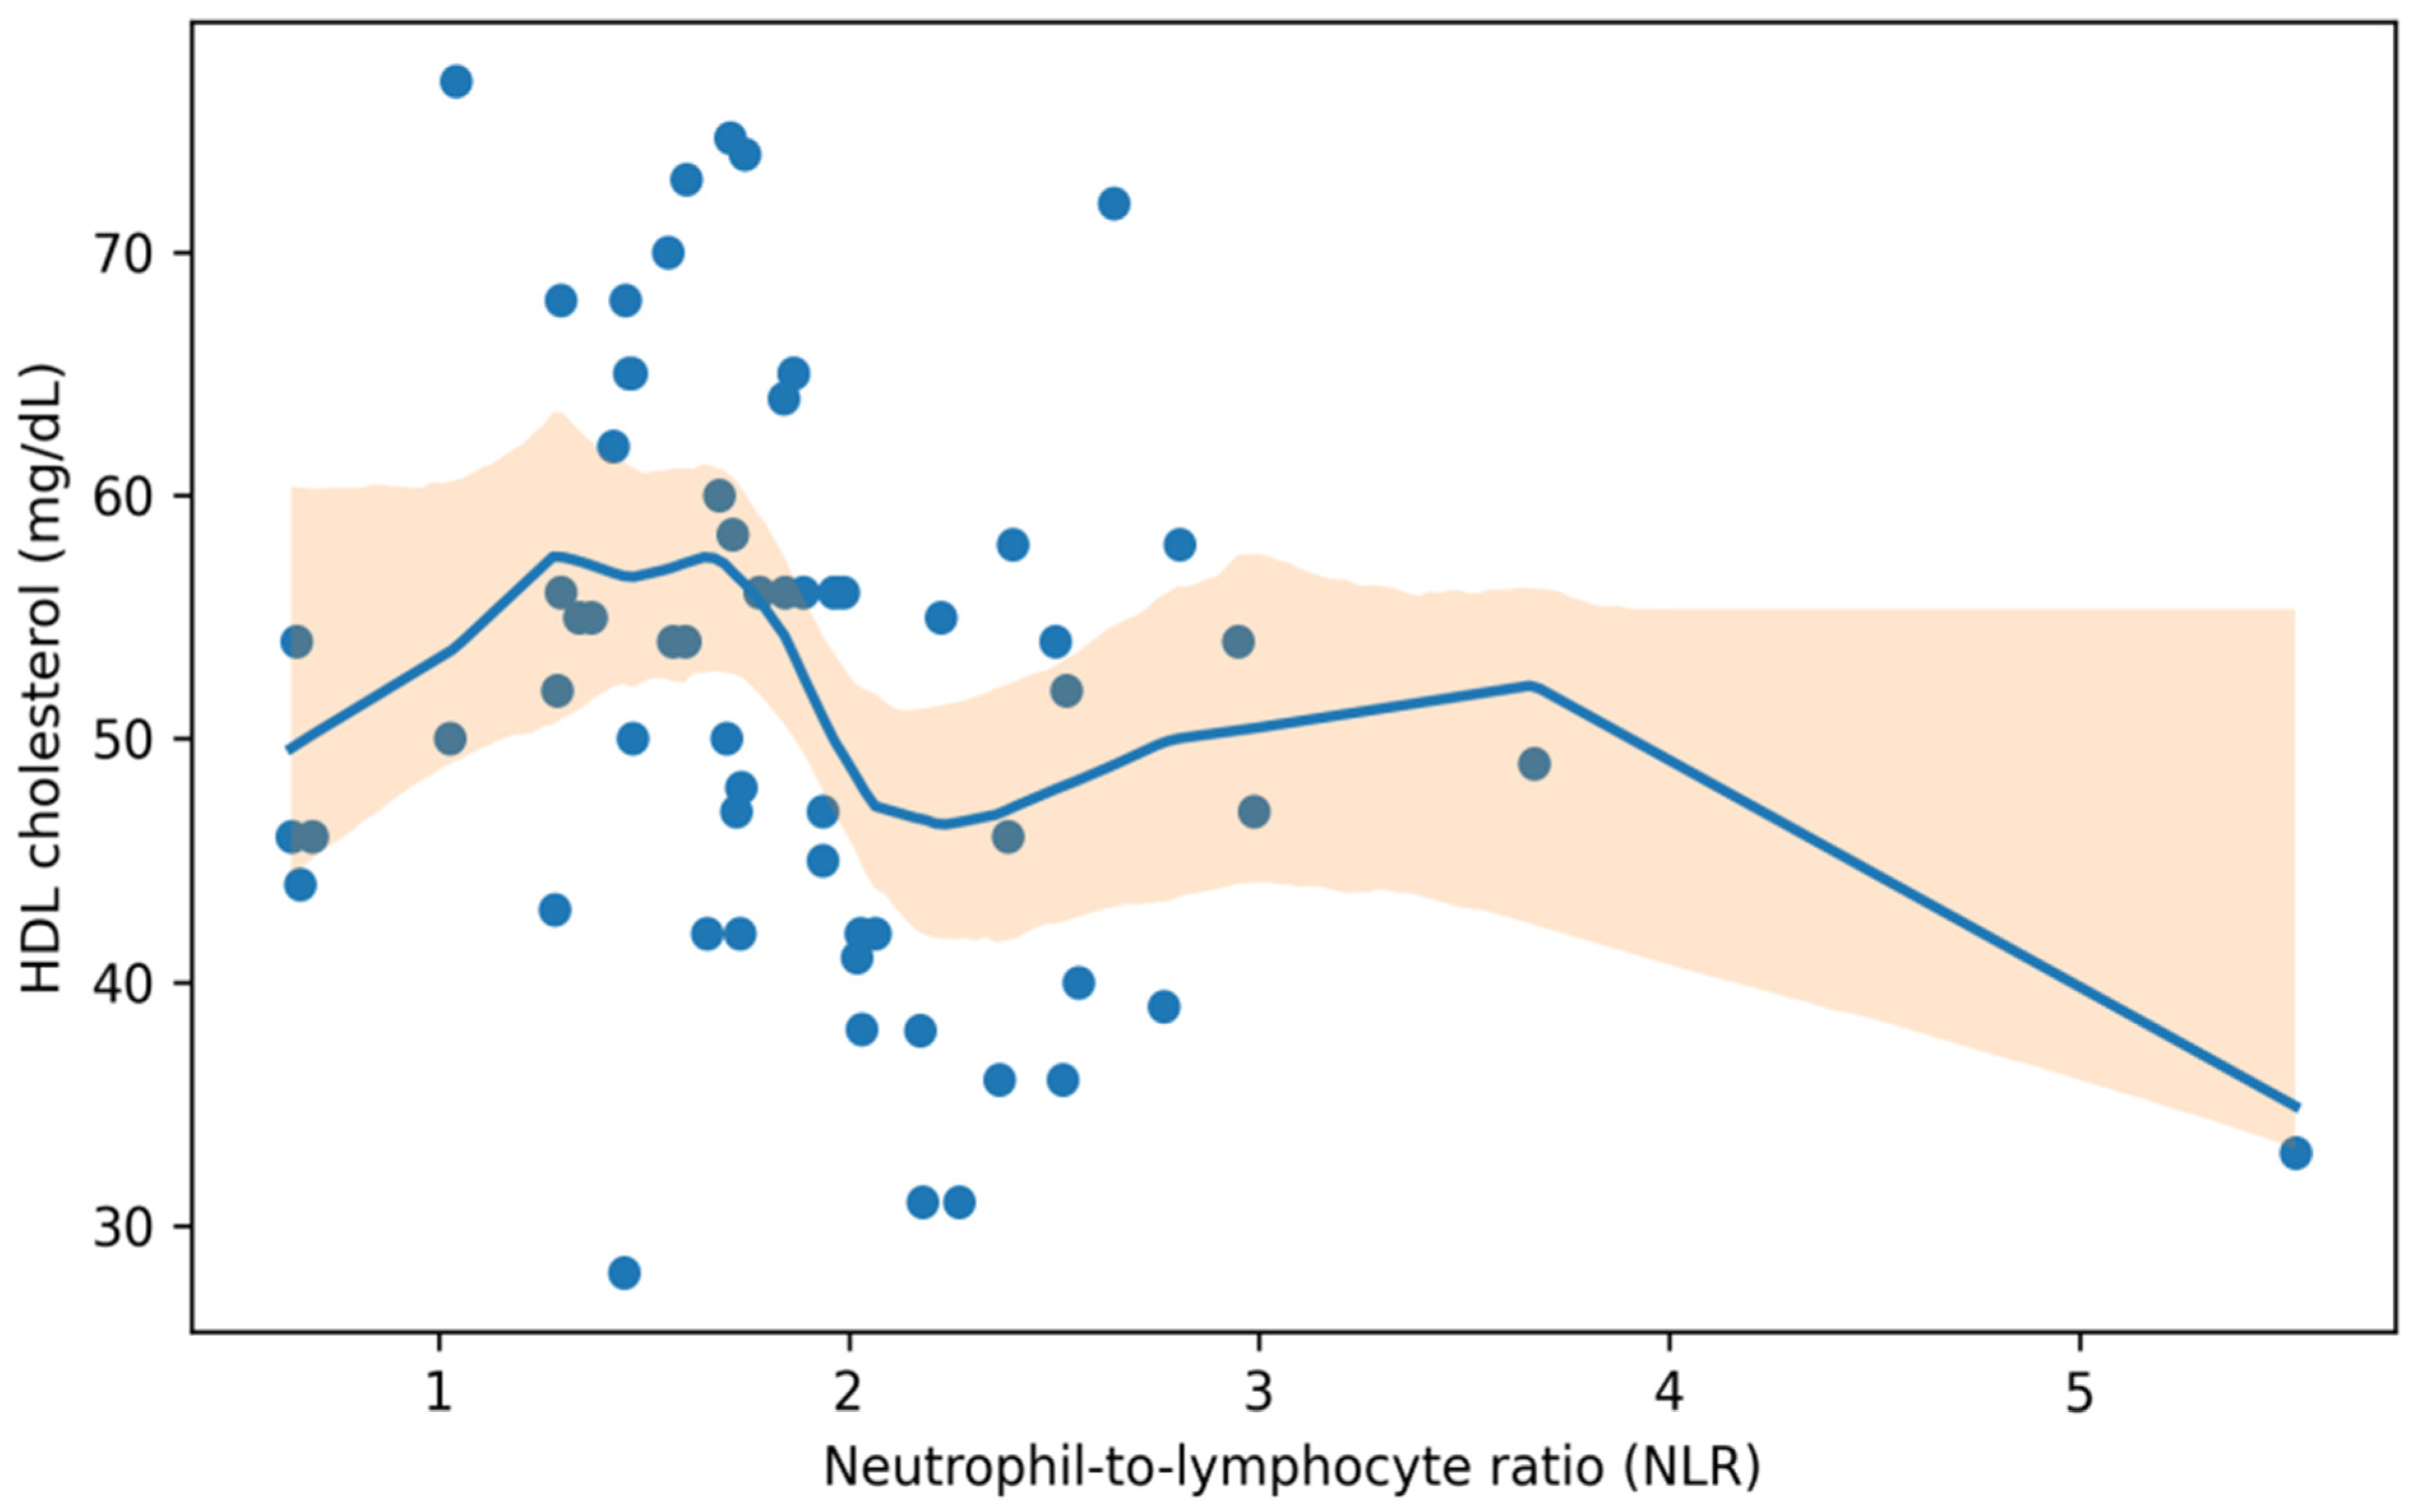
| NLR vs. HDL-C | 65 | −0.28 | −0.50–−0.03 | 0.023 |
| (A) Group Comparisons (Thyroid Dysfunction vs. Euthyroid) | ||||||||||
| Marker | n (Dysfunction) | Median [IQR] (Dysfunction) | n (Euthyroid) | Median [IQR] (Euthyroid) | HL Δ (dys−eu) | HL 95% CI | Rank-Biserial r | r 95% CI | p-Value | q (BH–FDR) |
| Total testosterone (ng/dL) | 6 | 31.50 [17.92–51.75] | 7 | 35.00 [14.75–63.50] | 2.75 | −37.00–33.75 | 0.13 | −0.56–0.70 | 0.720 | 0.751 |
| FSH (mIU/mL) | 5 | 15.20 [5.38–15.20] | 28 | 6.92 [4.60–10.35] | 4.95 | −0.93–16.50 | −0.52 | −1.00–0.49 | 0.083 | 0.501 |
| Prolactin (as recorded) | 13 | 33.10 [25.20–183.00] | 24 | 45.05 [10.07–164.25] | 8.35 | −31.90–47.02 | −0.13 | −0.46–0.27 | 0.535 | 0.751 |
| Estradiol (pg/mL) | 7 | 100.00 [23.35–185.55] | 17 | 57.40 [31.70–68.50] | 31.50 | −35.40–202.50 | −0.20 | −0.74–0.47 | 0.465 | 0.751 |
| Cortisol (ng/dL) | 3 | 9.30 [9.20–9.30] | 4 | 7.05 [7.00–9.78] | 2.15 | −8.50–2.30 | −0.50 | −1.00–0.50 | 0.368 | 0.751 |
| ACTH (pg/mL) | 8 | 24.45 [14.62–31.00] | 11 | 12.60 [7.18–30.80] | 8.80 | −15.70–21.40 | −0.25 | −0.61–0.14 | 0.225 | 0.675 |
| (B) Spearman Correlations with log(TSH) and Free T4 | ||||||||||
| Marker | Predictor | n | Spearman ρ | 95% CI | p-Value | q (BH–FDR) | ||||
| Total testosterone (ng/dL) | log(TSH) | 16 | 0.27 | −0.26–0.64 | 0.313 | 0.626 | ||||
| Free T4 (ng/dL) | 16 | −0.23 | −0.65–0.25 | 0.392 | 0.669 | |||||
| LH (mIU/mL) | log(TSH) | 17 | 0.13 | −0.29–0.56 | 0.625 | 0.729 | ||||
| Free T4 (ng/dL) | 19 | −0.28 | −0.65–0.18 | 0.251 | 0.586 | |||||
| FSH (mIU/mL) | log(TSH) | 34 | 0.13 | −0.25–0.44 | 0.478 | 0.669 | ||||
| Free T4 (ng/dL) | 28 | −0.06 | −0.44–0.27 | 0.756 | 0.819 | |||||
| Prolactin (as recorded) | log(TSH) | 39 | 0.34 | 0.09–0.57 | 0.033 | 0.233 | ||||
| Free T4 (ng/dL) | 42 | −0.05 | −0.35–0.20 | 0.737 | 0.819 | |||||
| Estradiol (pg/mL) | log(TSH) | 11 | −0.06 | −0.45–0.47 | 0.873 | 0.873 | ||||
| Free T4 (ng/dL) | 11 | −0.14 | −0.53–0.45 | 0.708 | 0.819 | |||||
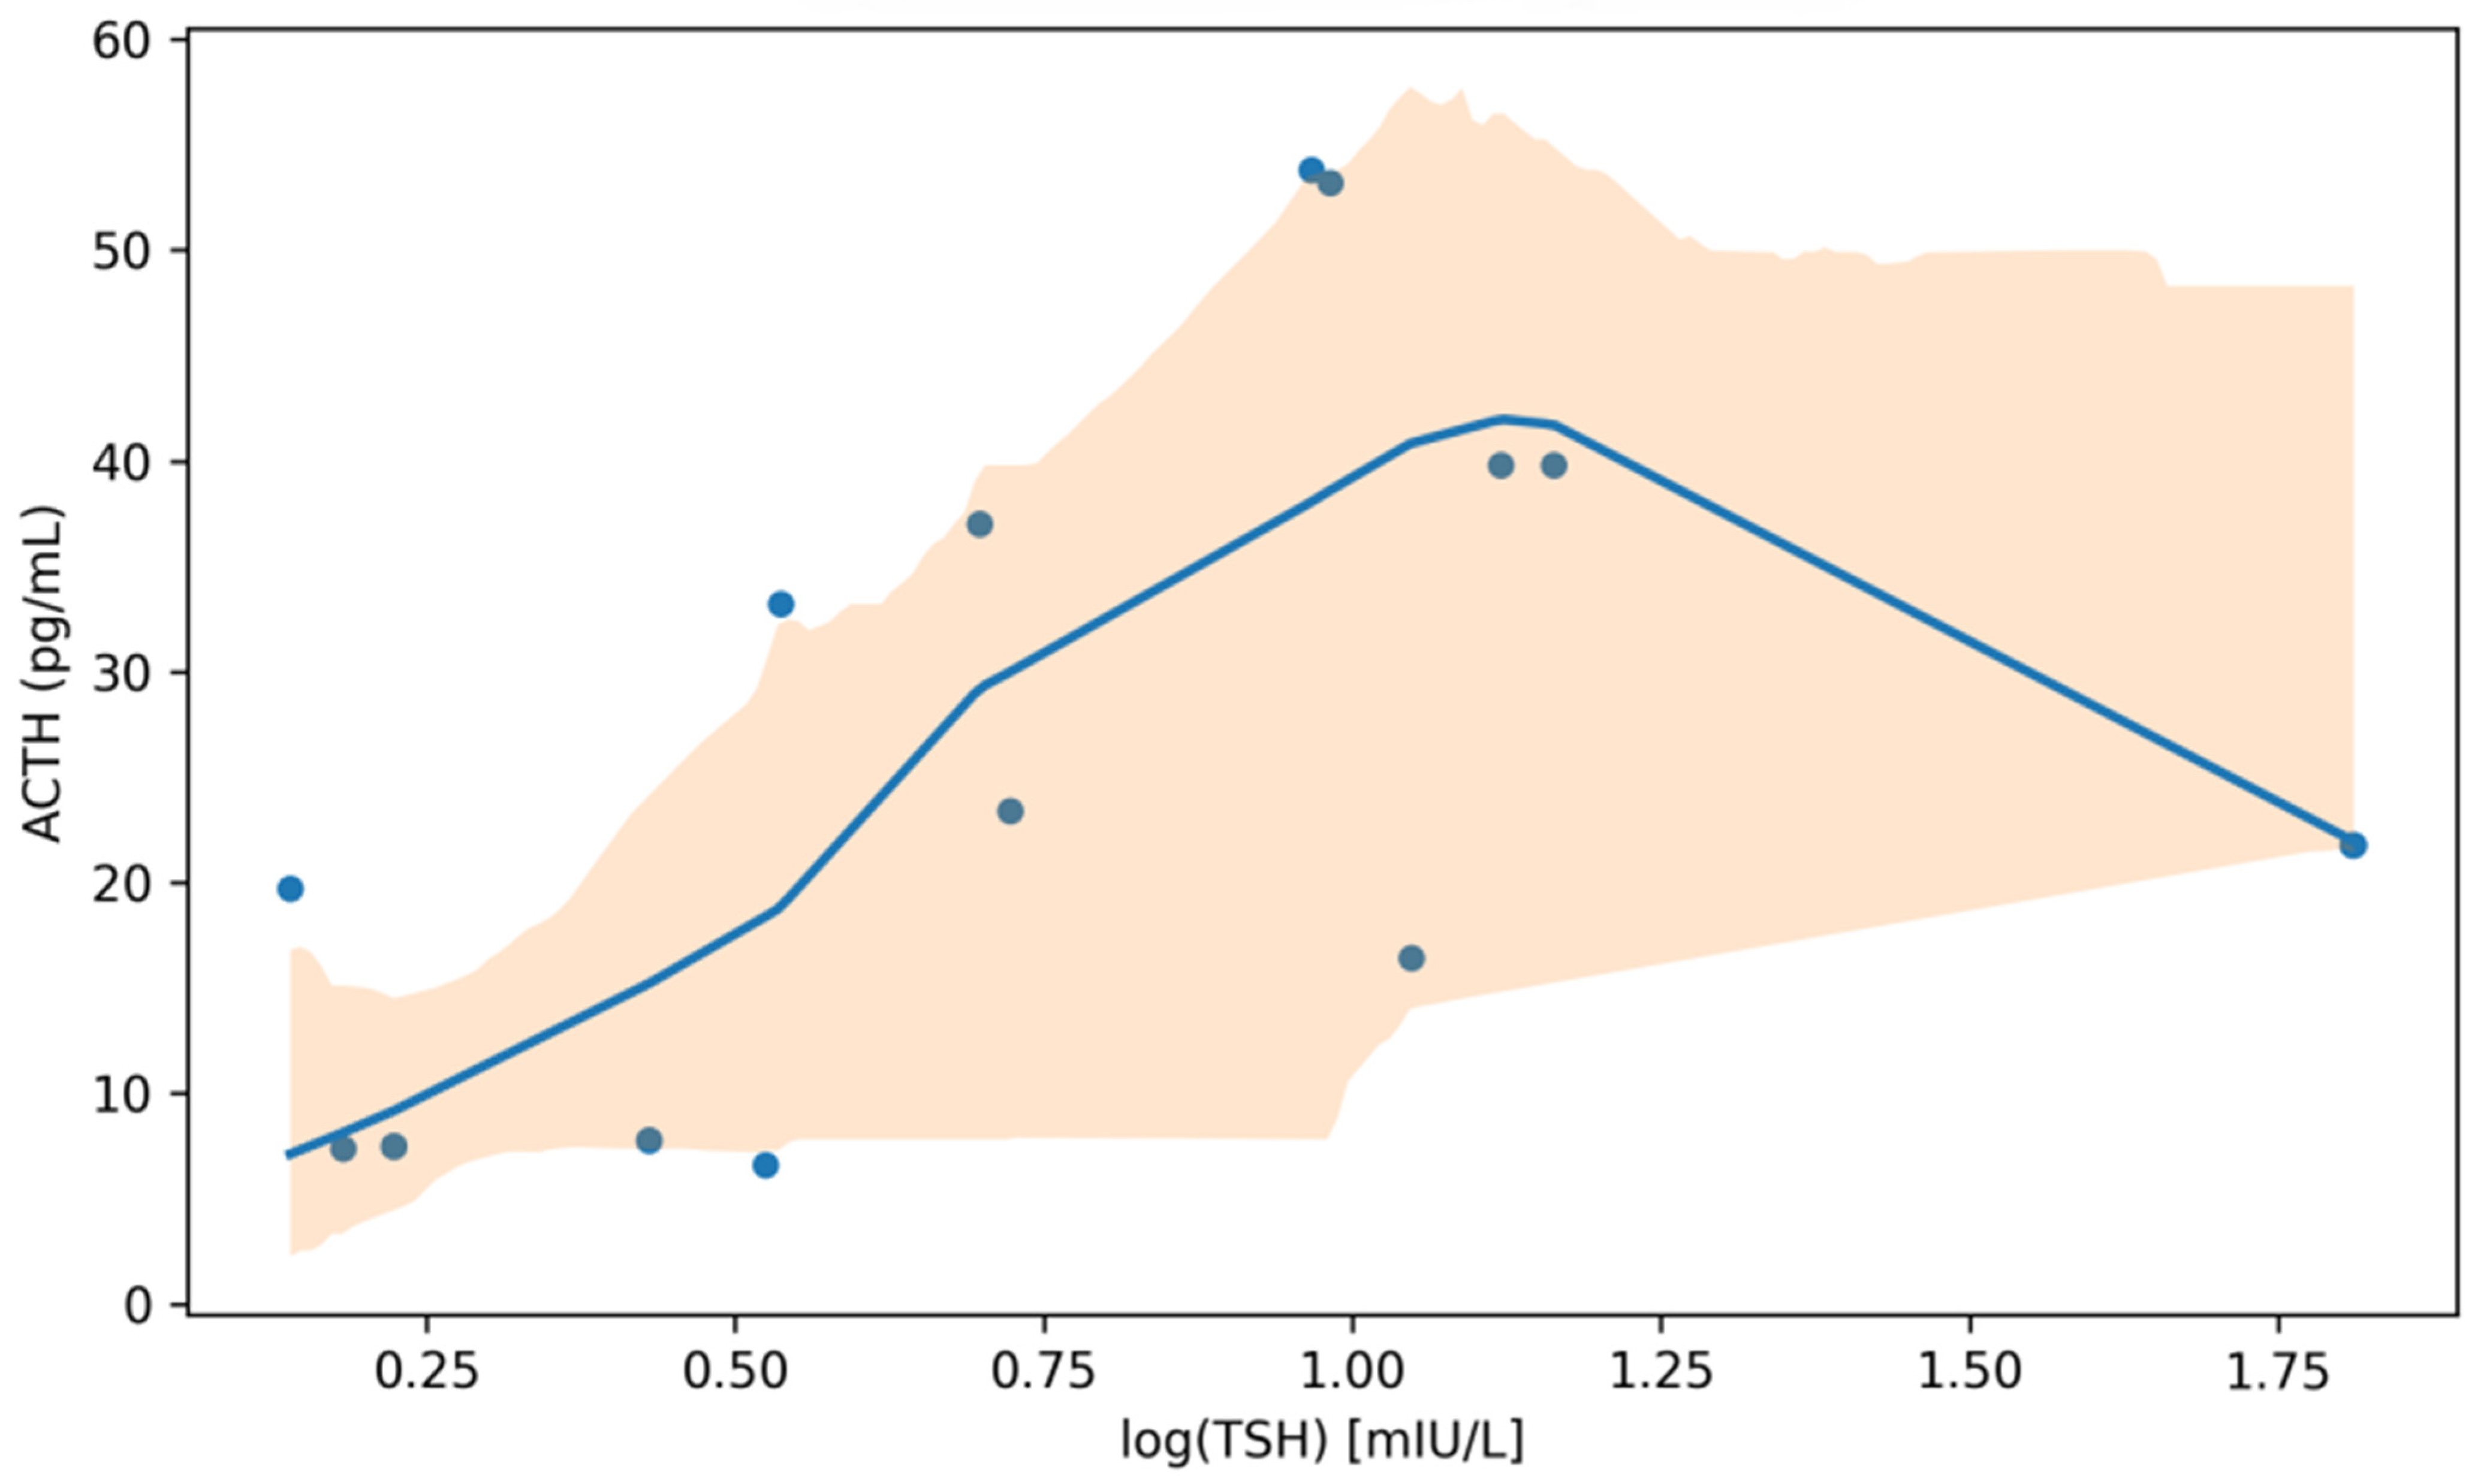
| ACTH (pg/mL) | log(TSH) | 19 | 0.62 | 0.42–0.81 | 0.004 | 0.063 | ||||
| Free T4 (ng/dL) | 19 | −0.12 | −0.57–0.45 | 0.617 | 0.729 | |||||
| Cortisol (ng/dL) | log(TSH) | 7 | −0.39 | −0.91–0.63 | 0.389 | 0.669 | ||||
| Free T4 (ng/dL) | 7 | 0.00 | −0.75–0.75 | 1.000 | 1.000 | |||||
| (A) Spearman Correlations of Ultrasound Metrics with log(TSH) and Free T4. | ||||||||
| Ultrasound Metric | Predictor | n | Spearman ρ | 95% CI | p-Value | q (BH–FDR) | ||
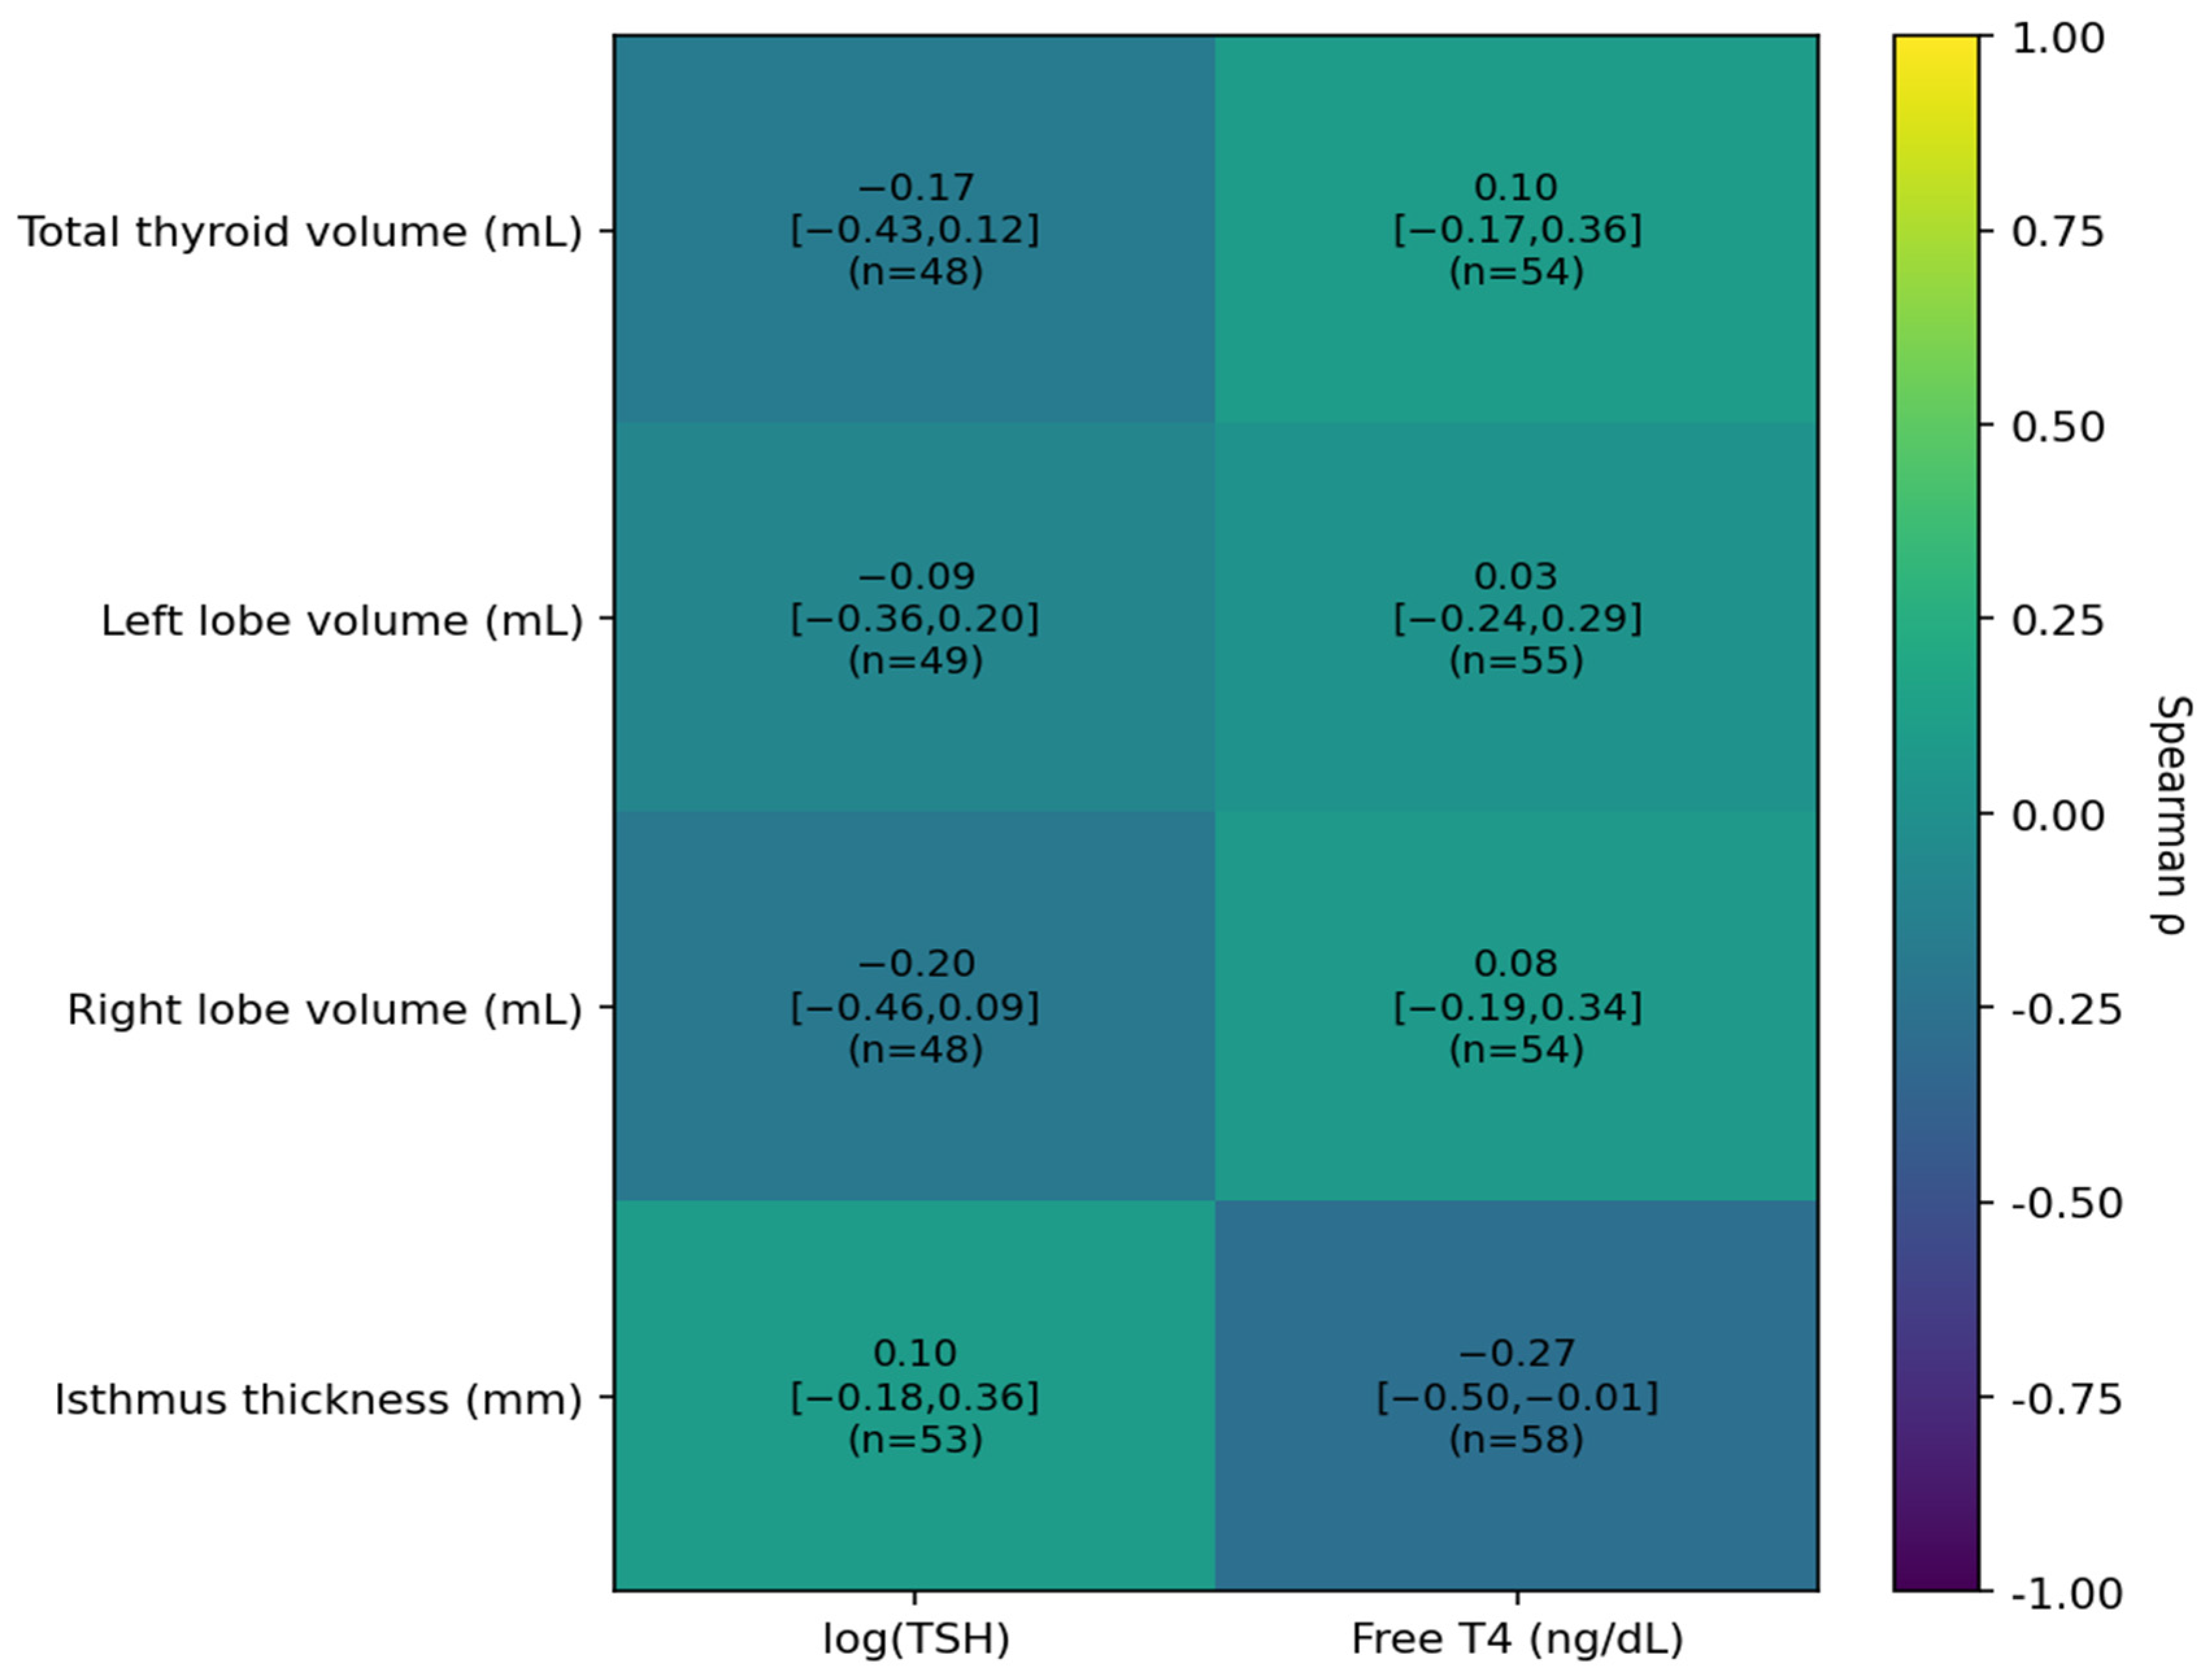
| Total thyroid volume (mL) | log(TSH) | 48 | −0.17 | −0.43–0.12 | 0.250 | 0.655 | ||
| Free T4 (ng/dL) | 54 | 0.10 | −0.17–0.36 | 0.456 | 0.655 | |||
| Left lobe volume (mL) | log(TSH) | 49 | −0.09 | −0.36–0.20 | 0.546 | 0.655 | ||
| Free T4 (ng/dL) | 55 | 0.03 | −0.24–0.29 | 0.831 | 0.831 | |||
| Right lobe volume (mL) | log(TSH) | 48 | −0.20 | −0.46–0.09 | 0.168 | 0.655 | ||
| Free T4 (ng/dL) | 54 | 0.08 | −0.19–0.34 | 0.573 | 0.655 | |||
| Isthmus thickness (mm) | log(TSH) | 53 | 0.10 | −0.18–0.36 | 0.477 | 0.655 | ||
| Free T4 (ng/dL) | 58 | −0.27 | −0.50–−0.01 | 0.039 | 0.312 | |||
| (B) Group Comparisons of Ultrasound Metrics (Thyroid Dysfunction vs. Euthyroid). | ||||||||
| Ultrasound Metric | n (Dysfunction) | Median [IQR] (Dysfunction) | n (Euthyroid) | Median [IQR] (Euthyroid) | HL Δ (dys−eu) | HL 95% CI | p-Value | q (BH–FDR) |
| Total thyroid volume (mL) | 13 | 4.74 [4.16–7.33] | 33 | 4.49 [4.10–6.43] | 0.12 | −0.52–1.53 | 0.788 | 0.884 |
| Left lobe volume (mL) | 13 | 2.47 [1.95–3.42] | 34 | 2.25 [1.95–3.11] | 0.19 | −0.13–0.91 | 0.391 | 0.782 |
| Right lobe volume (mL) | 13 | 2.33 [2.09–2.74] | 33 | 2.28 [1.95–3.29] | −0.03 | −0.45–0.46 | 0.884 | 0.884 |
| Isthmus thickness (mm) | 14 | 4.00 [4.00–4.00] | 36 | 4.00 [4.00–4.00] | 0.0 | 0.00–0.00 | 0.119 | 0.476 |
| Predictor | Adjusted OR (95% CI) | p-Value |
|---|---|---|
| High TSH (>4.5 mIU/L) | 12.93 (1.44–115.70) | 0.022 |
| NLR (per +1 unit) | 1.88 (0.85–4.16) | 0.121 |
Disclaimer/Publisher’s Note: The statements, opinions and data contained in all publications are solely those of the individual author(s) and contributor(s) and not of MDPI and/or the editor(s). MDPI and/or the editor(s) disclaim responsibility for any injury to people or property resulting from any ideas, methods, instructions or products referred to in the content. |
© 2026 by the authors. Licensee MDPI, Basel, Switzerland. This article is an open access article distributed under the terms and conditions of the Creative Commons Attribution (CC BY) license.
Share and Cite
Singer, M.M.; Vintilescu, Ș.B.; Pirscoveanu, D.F.V.; Rădulescu, V.M.; Mocanu, A.G.; Nicolaescu, O.-E.; Varut, R.M.; Preoteasa, D.; Stepan, M.D.; Pluta, I.D.; et al. Thyroid Function, Inflammation, and HDL-Cholesterol in Women with Acne: A Real-World Cross-Sectional Study Integrating Biochemistry and Thyroid Ultrasound. J. Clin. Med. 2026, 15, 1768. https://doi.org/10.3390/jcm15051768
Singer MM, Vintilescu ȘB, Pirscoveanu DFV, Rădulescu VM, Mocanu AG, Nicolaescu O-E, Varut RM, Preoteasa D, Stepan MD, Pluta ID, et al. Thyroid Function, Inflammation, and HDL-Cholesterol in Women with Acne: A Real-World Cross-Sectional Study Integrating Biochemistry and Thyroid Ultrasound. Journal of Clinical Medicine. 2026; 15(5):1768. https://doi.org/10.3390/jcm15051768
Chicago/Turabian StyleSinger, Maria Madalina, Ștefănița Bianca Vintilescu, Denisa Floriana Vasilica Pirscoveanu, Virginia Maria Rădulescu, Andreea Gabriela Mocanu, Oana-Elena Nicolaescu, Renata Maria Varut, Denisa Preoteasa, Mioara Desdemona Stepan, Ion Dorin Pluta, and et al. 2026. "Thyroid Function, Inflammation, and HDL-Cholesterol in Women with Acne: A Real-World Cross-Sectional Study Integrating Biochemistry and Thyroid Ultrasound" Journal of Clinical Medicine 15, no. 5: 1768. https://doi.org/10.3390/jcm15051768
APA StyleSinger, M. M., Vintilescu, Ș. B., Pirscoveanu, D. F. V., Rădulescu, V. M., Mocanu, A. G., Nicolaescu, O.-E., Varut, R. M., Preoteasa, D., Stepan, M. D., Pluta, I. D., & Singer, C. E. (2026). Thyroid Function, Inflammation, and HDL-Cholesterol in Women with Acne: A Real-World Cross-Sectional Study Integrating Biochemistry and Thyroid Ultrasound. Journal of Clinical Medicine, 15(5), 1768. https://doi.org/10.3390/jcm15051768