Article

Construction and Validation of a 90-Day Mortality Risk Prediction Model Based on Interpretable Machine Learning for Acute Ischemic Stroke Patients Undergoing Mechanical Thrombectomy

1
Department of Neurology, West China Hospital, Sichuan University/West China School of Nursing, Sichuan University, Chengdu 610041, China
2
Department of Emergency, West China Tianfu Hospital, Sichuan University, Chengdu 610213, China
3
Trauma Centre of West China Hospital, Sichuan University, Chengdu 610041, China
4
Department of Neurology, West China Tianfu Hospital, Sichuan University, Chengdu 610213, China
5
Department of Gastroenterology, West China Hospital, Sichuan University/West China School of Nursing, Sichuan University, Chengdu 610041, China
*
Author to whom correspondence should be addressed.
J. Clin. Med. 2026, 15(12), 4702; https://doi.org/10.3390/jcm15124702
Submission received: 17 April 2026 / Revised: 26 May 2026 / Accepted: 11 June 2026 / Published: 17 June 2026
(This article belongs to the Special Issue Acute Ischemic Stroke Management Strategies)

Abstract

Background/Objectives: The accurate prediction of postprocedural mortality is critical for clinical decision-making; however, research on mortality risk models for patients undergoing mechanical thrombectomy remains limited. This study aimed to develop and validate machine learning models for predicting 90-day post-mechanical thrombectomy mortality. Methods: A retrospective-prospective cohort study involving 699 retrospective patients (January 2019–December 2022) and 274 prospective patients (January 2023–June 2024) from a single institution in Sichuan was conducted. The primary outcome was all-cause mortality within 90 days, ascertained via telephone follow-up. Predictors were identified using univariate analysis and LASSO regression. Eight predictive models were developed and evaluated using existing machine learning methods via 10-fold cross-validation. Model performance was assessed through discrimination, calibration, decision curve analysis, and interpretability via Shapley additive explanations. Results: The final dataset included 593 patients in the modeling set and 247 in the validation set. The 90-day mortality rates were 25.6% and 32.0%, respectively. Key predictors included age, hyperlipidemia, atrial fibrillation, pre-stroke statin use, antiplatelet/anticoagulant therapy within 48 h of onset, dysphagia, D-dimer levels, and activities of daily living scores. Logistic regression demonstrated superior performance in the modeling cohort (AUC = 0.87), whereas the multilayer perceptron model exhibited the greatest efficacy in the validation cohort (AUC = 0.77). Conclusions: Machine learning algorithms can accurately predict 90-day mortality among patients undergoing mechanical thrombectomy. The multilayer perceptron model demonstrated robust validation performance and offers a potential tool for personalized risk assessment and optimization of clinical decision-making.

1. Introduction

Stroke is the second leading cause of mortality among non-communicable diseases worldwide, affecting approximately 11.9 million individuals annually and resulting in nearly 5 million deaths or instances of disability [1,2]. In China, stroke is the primary cause of adult mortality and disability, with the nation reporting the highest global incidence rate of 39.9%. More than 2 million new stroke cases and 1.9 million stroke-related fatalities are recorded in China annually [3]. Driven by the aging global population and the increasing incidence of chronic conditions, stroke represents a significant threat to public health.
Acute ischemic stroke (AIS) accounts for 69.6% to 72.8% of new stroke cases in China and poses a considerable public health burden [4]. In recent years, mechanical thrombectomy (MT) has emerged as a cornerstone treatment for AIS, facilitating rapid recanalization by physically extracting the thrombus to restore cerebral perfusion [5]. Meta-analyses of landmark trials, including RESCUE-Japan LIMIT, ANGEL-ASPECT, and SELECT2, have demonstrated that compared with pharmacologic therapy alone, MT significantly improves 90-day survival and functional outcomes, even in patients with large infarct cores [6]. Despite the adoption of MT as the standard of care, post-treatment mortality remains a critical concern, with highly variable clinical prognoses [7]. Reports indicate that post-MT morbidity and mortality rates range from 18.4% to 38.2%, highlighting a persistently high-risk profile [8,9,10,11]. Consequently, accurate prediction of mortality risk in MT patients is essential for optimizing treatment strategies and enhancing clinical outcomes. Given that ML has successfully improved risk stratification in other fields—such as predicting lung cancer risk in individuals undergoing low-dose CT screening [12]—there is a clear opportunity to apply these methods to prognostic assessment following MT.
Machine learning (ML) is an interdisciplinary field that integrates statistics and computer science and uses sophisticated algorithms and large-scale datasets to facilitate classification, prediction, and the discovery of latent patterns. ML has been extensively applied across various sectors, particularly in healthcare [13]. With rapid technological advancements, ML has become an essential tool for predicting stroke risk because of its ability to model complex data relationships and high-dimensional features [14,15]. Numerous studies have developed ML-based models to predict post-stroke mortality [16,17]. However, mortality prediction models specifically developed for patients undergoing MT remain limited. Current predictive models for MT often fail to adequately incorporate procedure-specific variables that may significantly influence prognosis, such as the number of thrombectomy passes, surgical techniques, and anesthesia grading [18]. Furthermore, the majority of contemporary models are derived from single-center datasets with limited sample sizes and lack robust external validation, which restricts their generalizability and clinical applicability [19]. Finally, many existing clinical prediction models lack interpretability, providing insufficient decision support for clinicians and thereby hindering their implementation in real-world settings [20].
This study aimed to develop and temporally validate ML models for predicting 90-day all-cause mortality in patients with AIS treated with MT. By integrating demographic factors, clinical characteristics, medication usage, procedural data, and laboratory indicators, we sought to identify clinically significant predictors of mortality. Furthermore, we employed Shapley Additive Explanations (SHAP) analysis to elucidate the contribution of specific variables to model predictions, thereby enhancing model transparency and facilitating personalized risk stratification in clinical practice.

2. Materials and Methods

2.1. Research Design and Participants

Data for the model development cohort were retrospectively gathered from patients with MT treated from January 2019 to December 2022. Temporal validation was conducted utilizing a prospective cohort of patients treated between January 2023 and June 2024. This research was performed in the Department of Neurology at a major general hospital in Sichuan, China, which functions as a stroke center in southwestern China and offers representative data on MT patients. This research complied with the TRIPOD+AI reporting standard [21]. The clinical characteristics of the entire cohort and the results of the intergroup comparisons are presented in Table 1.
The inclusion and exclusion criteria were applied consistently across both cohorts. Patients were included if they met the following criteria: (1) age ≥ 18 years; (2) diagnosis of acute ischemic stroke (AIS) in accordance with the 2023 Chinese Guidelines for the Diagnosis and Treatment of AIS, confirmed by cranial CT or MRI; (3) candidacy for MT; (4) provision of informed consent for emergency MT; and (5) completion of laboratory tests within 24 h of admission, with available follow-up data obtained via in-person visits or telephone interviews. Patients were excluded if they met any of the following criteria: (1) the presence of pre-existing severe intracranial dysfunction or genetic disorders; (2) end-stage organ failure (e.g., cardiac, pulmonary, hepatic, or renal) or critical conditions such as malignant neoplasms or severe hematological disorders; (3) concurrent acute extracerebral arterial embolism; (4) pregnancy; (5) a modified Thrombolysis in Cerebral Infarction (mTICI) score < 2b; (6) inability to access complete medical records from the electronic system; or (7) incomplete data hindering effective analysis.

2.2. Sample Size

The sample size for the model development cohort was determined using the dichotomous clinical prediction model approach developed by Riley et al., implemented via the pmsampsize package [22]. On the basis of a literature-derived event rate of approximately 38% and the inclusion of 10 candidate predictors, a sample size of 363 was required to achieve an area under the curve (AUC) of at least 0.8. The validation cohort size was determined using the minimum sample size formula for the external validation of dichotomous clinical prediction models [23]. On the basis of an anticipated mortality rate of 0.38, an average AUC of 0.75, an expected calibration slope of 0.8, an observed/expected (O/E) statistic error <0.05, and a clinical probability threshold of 0.3, a minimum of 171 cases was needed.

2.3. Research Indicators

Predictors were selected on the basis of an extensive literature review and expert consultation. Clinical data included the following: (1) Demographics: age, gender, ethnicity, body mass index (BMI), education level, and smoking/alcohol history; (2) Disease characteristics: admission vital signs, TOAST classification, vascular occlusion site, stroke severity [National Institutes of Health Stroke Scale (NIHSS): <4 (mild), 4–15 (moderate), 16–24 (severe), and ≥25 (very severe)], admission modified Rankin Scale (mRS) score, Barthel Index (ADL), and presence of dysphagia; (3) Medication: pre-stroke statin, anticoagulant, or antiplatelet use, and initiation of antithrombotic therapy within 48 h of onset; (4) Procedural data: bridging therapy, thrombectomy technique, number of passes, anesthesia method and classification [American Society of Anesthesiologists (ASA) Physical Status], onset-to-puncture time (OPT), puncture-to-reperfusion time (PNT), and adjunct procedures (endotracheal intubation, balloon dilation, or stenting); and (5) Laboratory measures: albumin, lymphocyte, C-reactive protein (CRP), total cholesterol, monocyte, neutrophil, platelet, uric acid, D-dimer, fibrinogen, triglycerides, low-density lipoprotein cholesterol, and high-density lipoprotein cholesterol. The primary outcome was 90-day all-cause mortality.

2.4. Data Collection

Data were extracted from the hospital information system by two trained professionals. Clinical nurses conducted outcome follow-up via telephone 90 days post-stroke. A neurologist assessed disease-specific metrics and procedural data, including the TOAST classification, mRS score, and NIHSS score.

2.5. Data Preprocessing and Statistical Analysis

Variables with >20% missing values were excluded. Missing data for the remaining variables were imputed using the missForest algorithm (5 iterations) via the R mice package. MissForest is an iterative imputation technique that uses random forest, which forecasts missing values by developing a nonparametric ensemble model from other observable variables and progressively refining the estimates over successive iterations until convergence [24]. The Kolmogorov–Smirnov test was used to evaluate data normality. Normally distributed data are presented as the mean ± standard deviation, whereas nonnormally distributed data are presented as medians with interquartile ranges (25th and 75th percentiles). Categorical variables are presented as frequencies and percentages. A univariate study was conducted to determine characteristics correlated with mortality in patients who underwent MT. Due to the nonnormal distribution of continuous data, the Mann–Whitney U test was employed for group comparisons. Categorical variables were examined utilizing either the χ2 test or Fisher’s exact test, as deemed appropriate. LASSO regression analysis was performed utilizing glmnet software (version 4.1-8) to identify pertinent factors and mitigate multicollinearity. All the statistical analyses were conducted with R software (version 4.3.2). A two-tailed p value of less than 0.05 was considered to indicate statistical significance.

2.6. Modeling

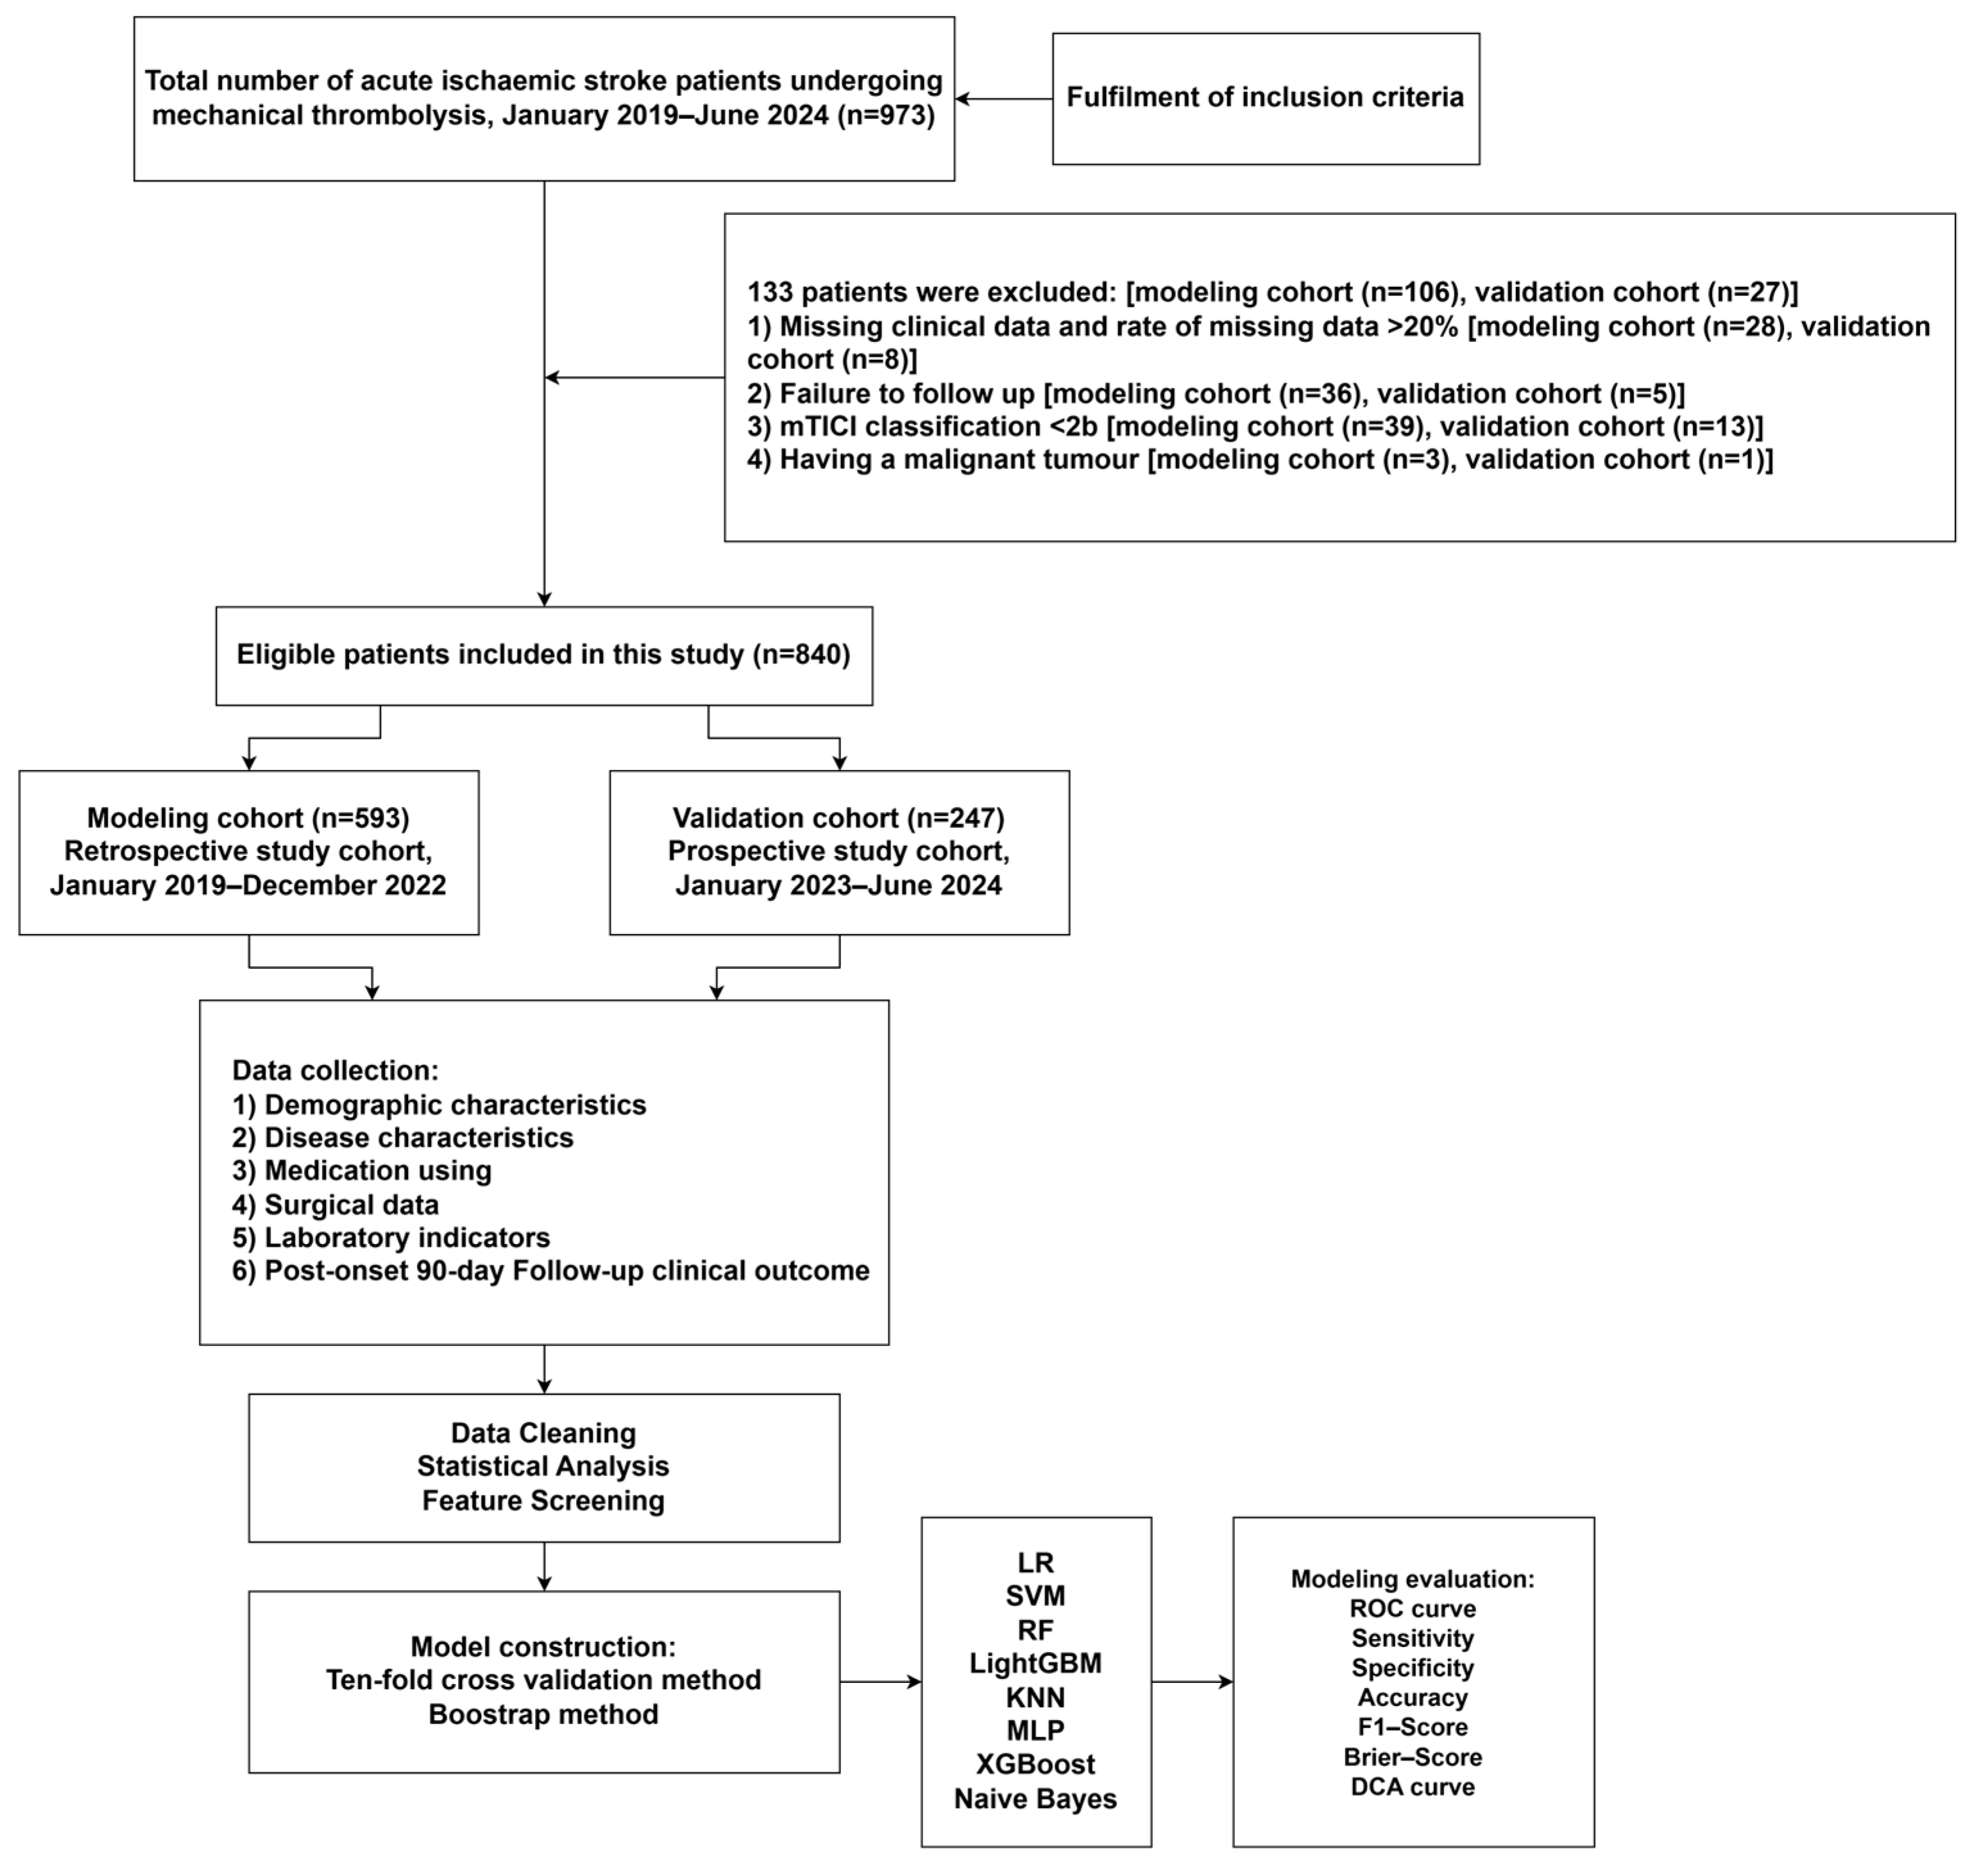
Model construction was performed in Python 3.13. Eight ML algorithms were evaluated: logistic regression (LR), support vector machine (SVM), random forest (RF), light gradient boosting machine (LightGBM), k-nearest neighbors (KNN), multilayer perceptron (MLP), eXtreme Gradient Boosting (XGBoost), and naive Bayes. Hyperparameter optimization was conducted via the Optuna framework. To ensure reproducibility, random seeds were fixed for data partitioning and training. To reduce the risk of overfitting and improve model robustness, 10-fold cross-validation was applied during both model development and validation performance assessment. Model performance was evaluated using the AUC, sensitivity, specificity, accuracy, F1 score, calibration slope/intercept, and Brier score. Discrimination, calibration, and clinical utility were assessed via receiver operating characteristic (ROC), calibration, and decision curve analysis (DCA), respectively. Finally, the model with the best overall performance in the temporal validation cohort was interpreted using SHAP. The patient selection and modeling process are shown in Figure 1.

3. Results

3.1. Baseline Data

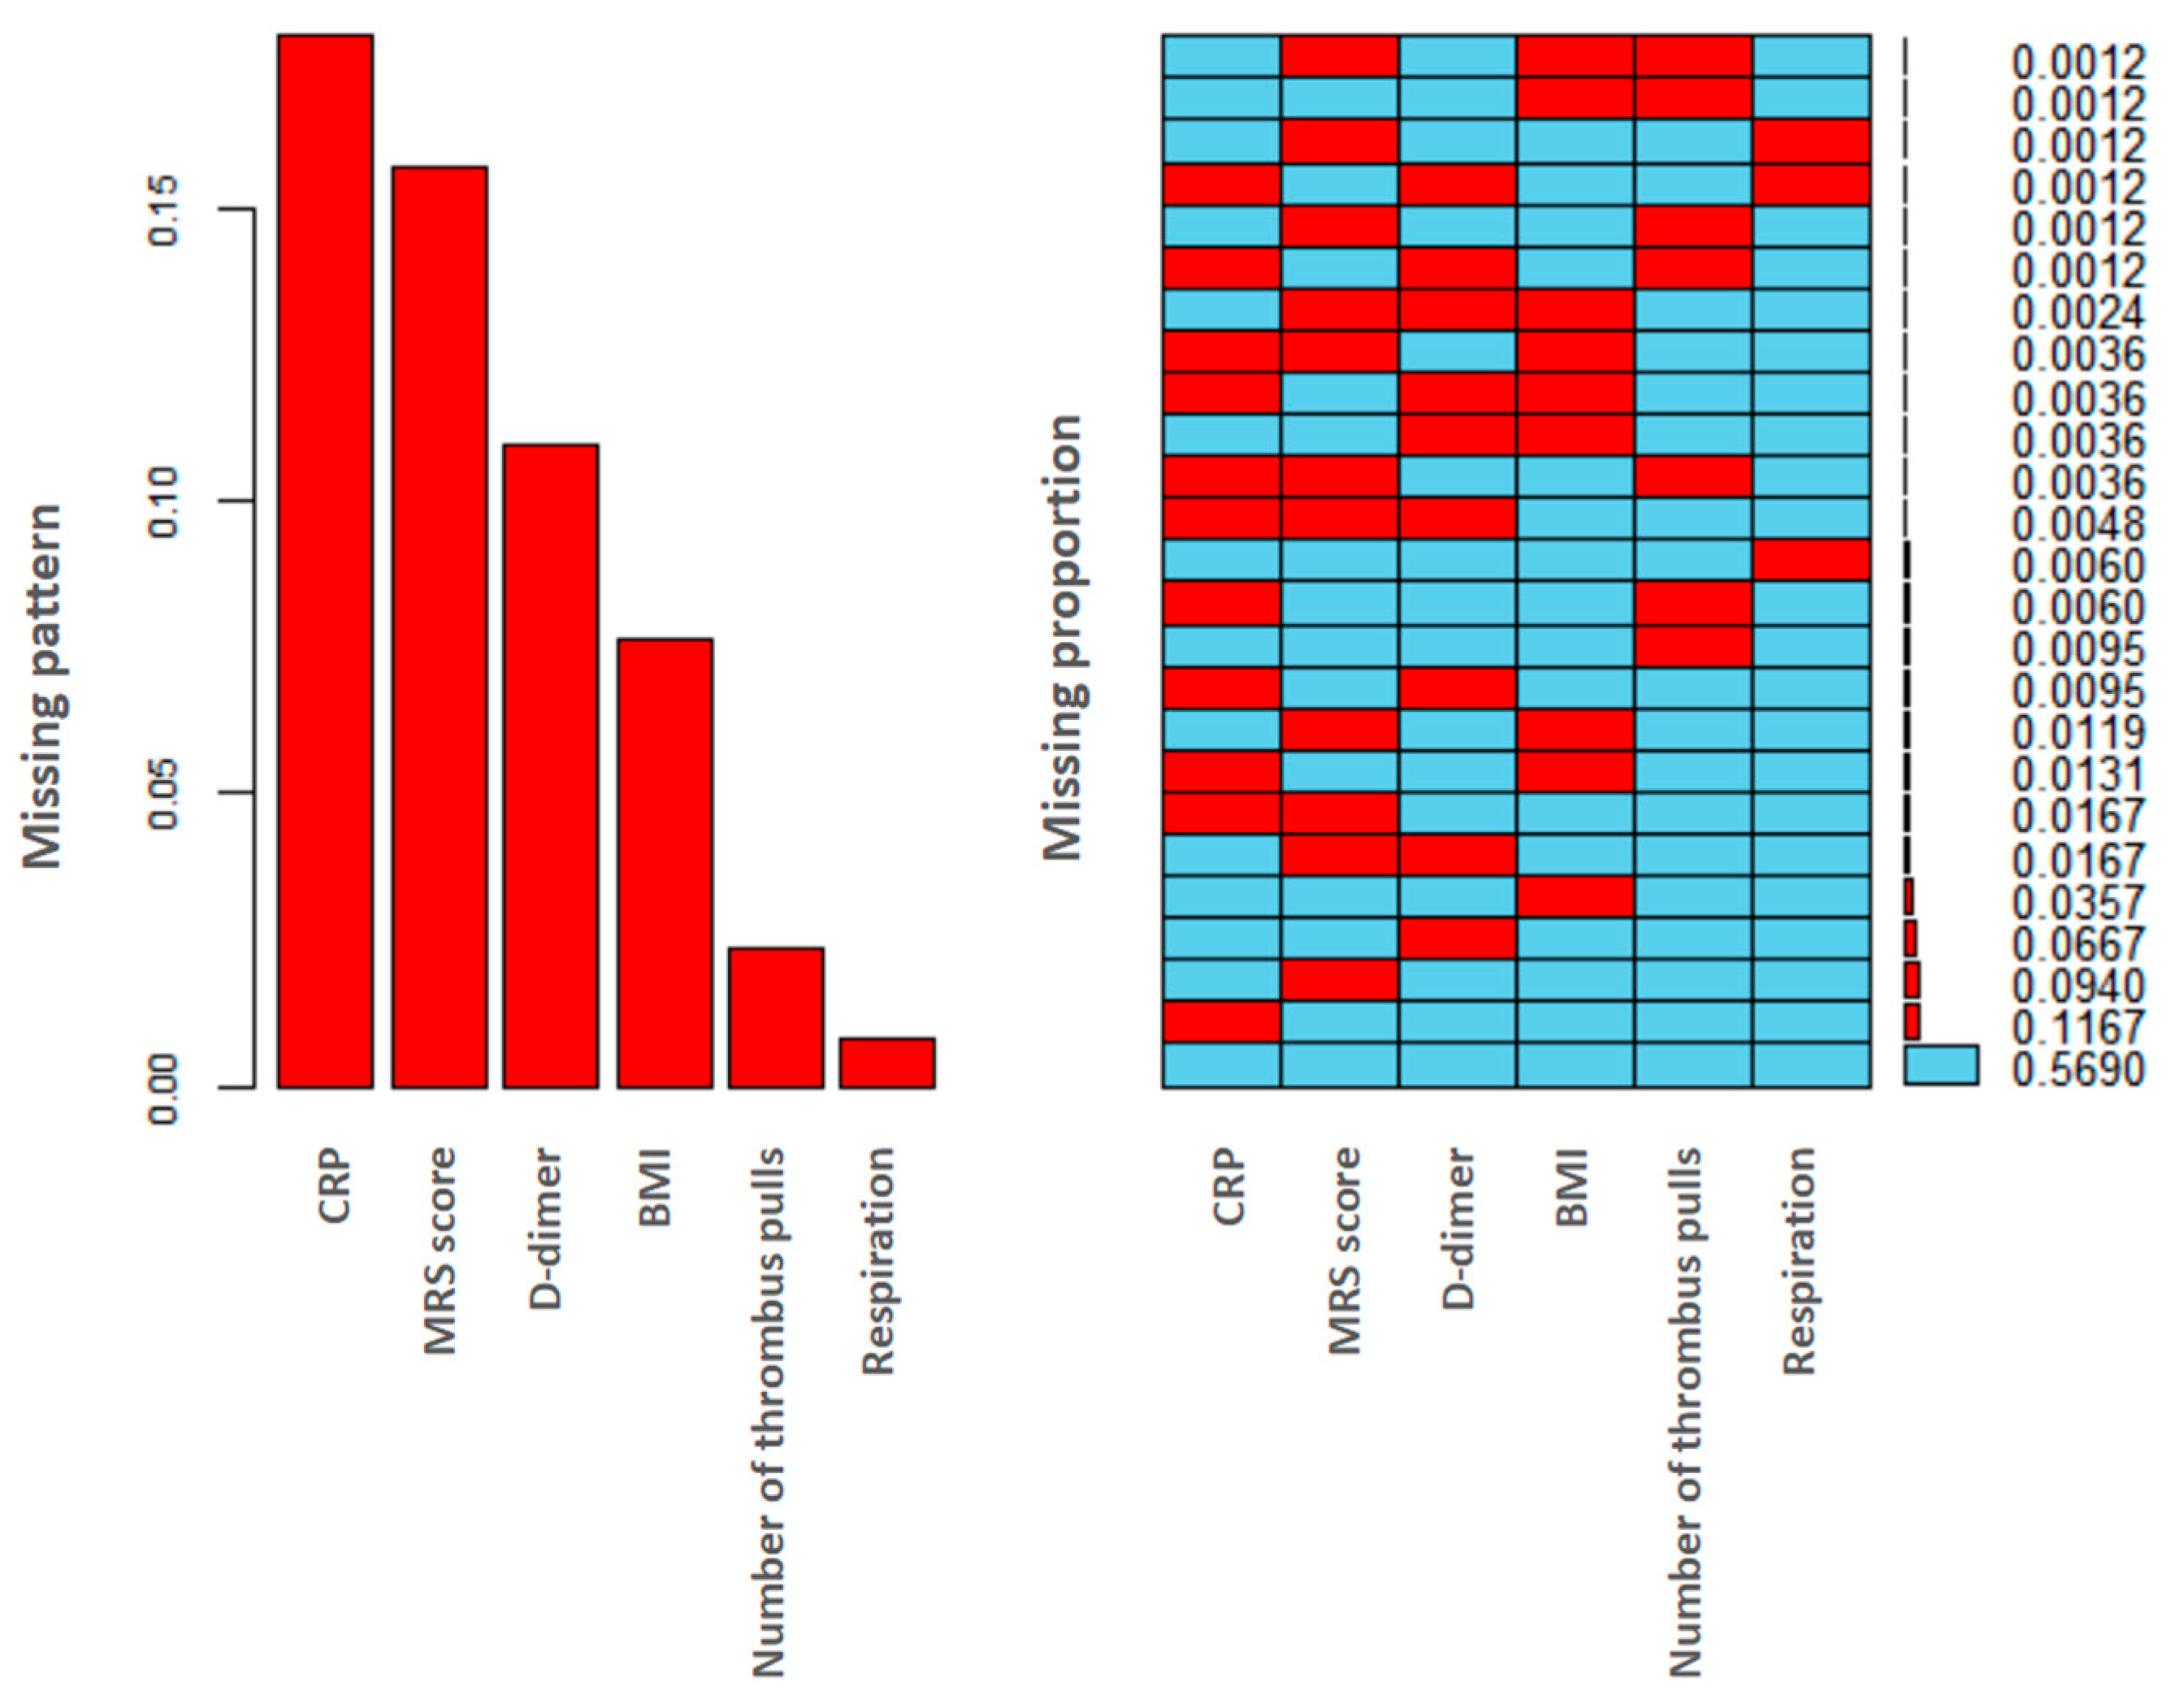
Between January 2019 and December 2022, a total of 699 patients with MT were included in the modeling cohort. Following the exclusion of 106 patients, data from 593 patients were used for modeling purposes. Temporal validation data were gathered from January 2023 to June 2024 and included 274 patients. After 27 individuals were excluded, the validation cohort comprised 247 participants. This investigation involved the imputation of 463 missing variables. Five comprehensive datasets were generated using MissForest multiple imputation, with the missing patterns and variable proportions illustrated in Figure 2. The absence rates for all included variables were under 20%, namely, CRP (17.98%), mRS score (15.71%), D-dimer (10.95%), BMI (7.26%), number of thrombus pulls (2.38%), and respiration (0.83%).
In the modeling cohort, there were 152 patient fatalities (25.6%), while in the temporal validation cohort, 79 fatalities (32%) were documented. The univariate analysis results of mortality in patients with MT in the modeling cohort revealed that numerous factors significantly predicted postoperative death, including age, gender, hyperlipidemia, atrial fibrillation, other cardiac conditions, the NIHSS score, the ADL score, admission dysphagia, prior use of antiplatelet drugs, statins, and anticoagulants, as well as antiplatelet/anticoagulant therapy administered within 48 h, thrombectomy methods, the number of thrombus pulls, anesthesia grading, PNT, balloon dilation/stenting, albumin levels, lymphocyte counts, CRP levels, and D-dimer levels (p < 0.05). Table 1 illustrates the distribution of particular features between the surviving and deceased groups. A comparison of baseline data between the modeling cohort and the temporal validation set, as illustrated in Table 2, identified five distinct variables: admission ADL score, albumin, CRP, monocyte count, and D-dimer, but the other characteristics did not demonstrate significant variations.

3.2. Screening of Predictive Features

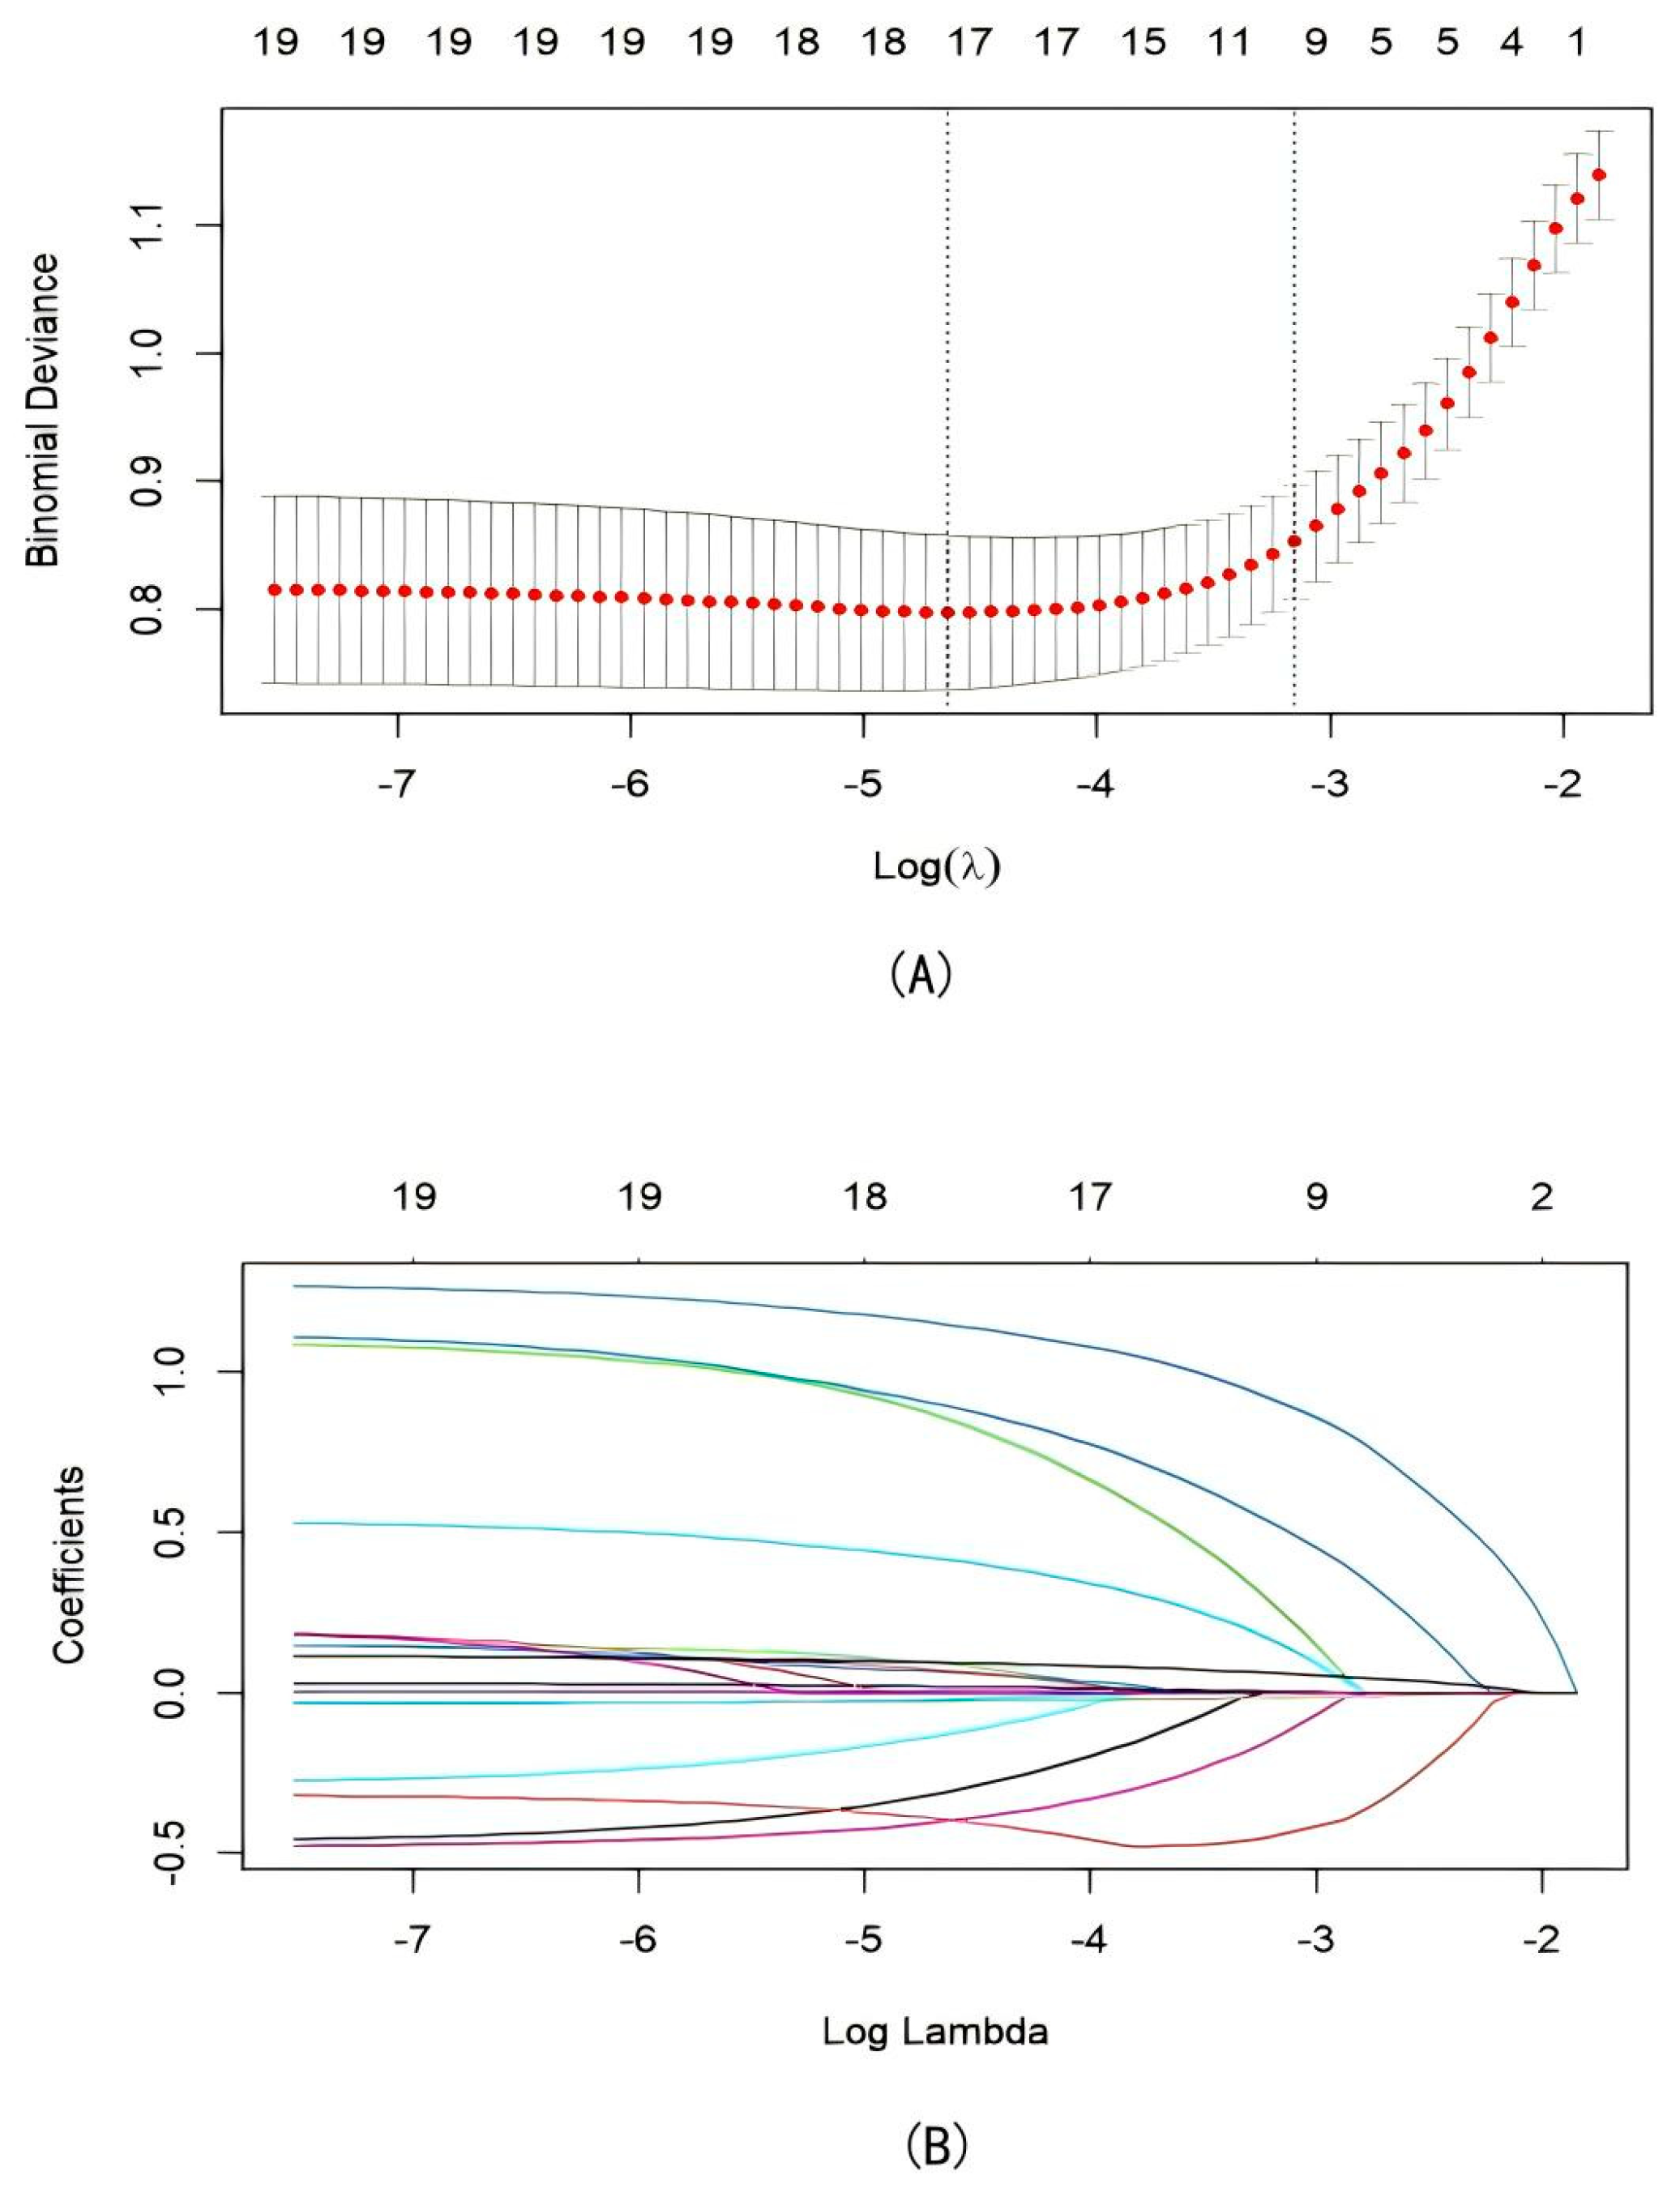
LASSO regression analysis was employed to identify the 20 clinically important factors from the univariate study. The binomial deviation obtained from cross-validation plotted against log(λ) is shown in Figure 3A. The numbers above the graphic reflect the number of variables kept in the model under different penalty strengths. The coefficient profiles of the variables are shown in Figure 3B, with the y-axis denoting the regression coefficients and the x-axis indicating log(λ). As λ increases, the regularization constraint intensifies, causing the coefficients of the variables to progressively diminish near zero. In accordance with the standard of λ = 1, the optimal λ value was 0.0088, resulting in the selection of eight variables with non-zero coefficients: age, hyperlipidemia, atrial fibrillation and other cardiac diseases, pre-stroke statin use, antiplatelet/anticoagulation therapy within 48 h, admission ADL score, dysphagia, and D-dimer level. These variables were later incorporated into the model development.

3.3. Evaluation of the Modeling Cohort and Validation Cohort Model Performance

To assess the efficacy and generalizability of the developed models, the dataset was partitioned into a modeling cohort (for model creation and internal validation) and an independent validation cohort (for temporal validation). The modeling cohort was utilized to train all the ML models and evaluate their internal performance by 10-fold cross-validation, whereas the validation cohort was employed to examine model generalizability in an independent cohort.

3.3.1. Evaluation of Modeling Cohort Model Performance

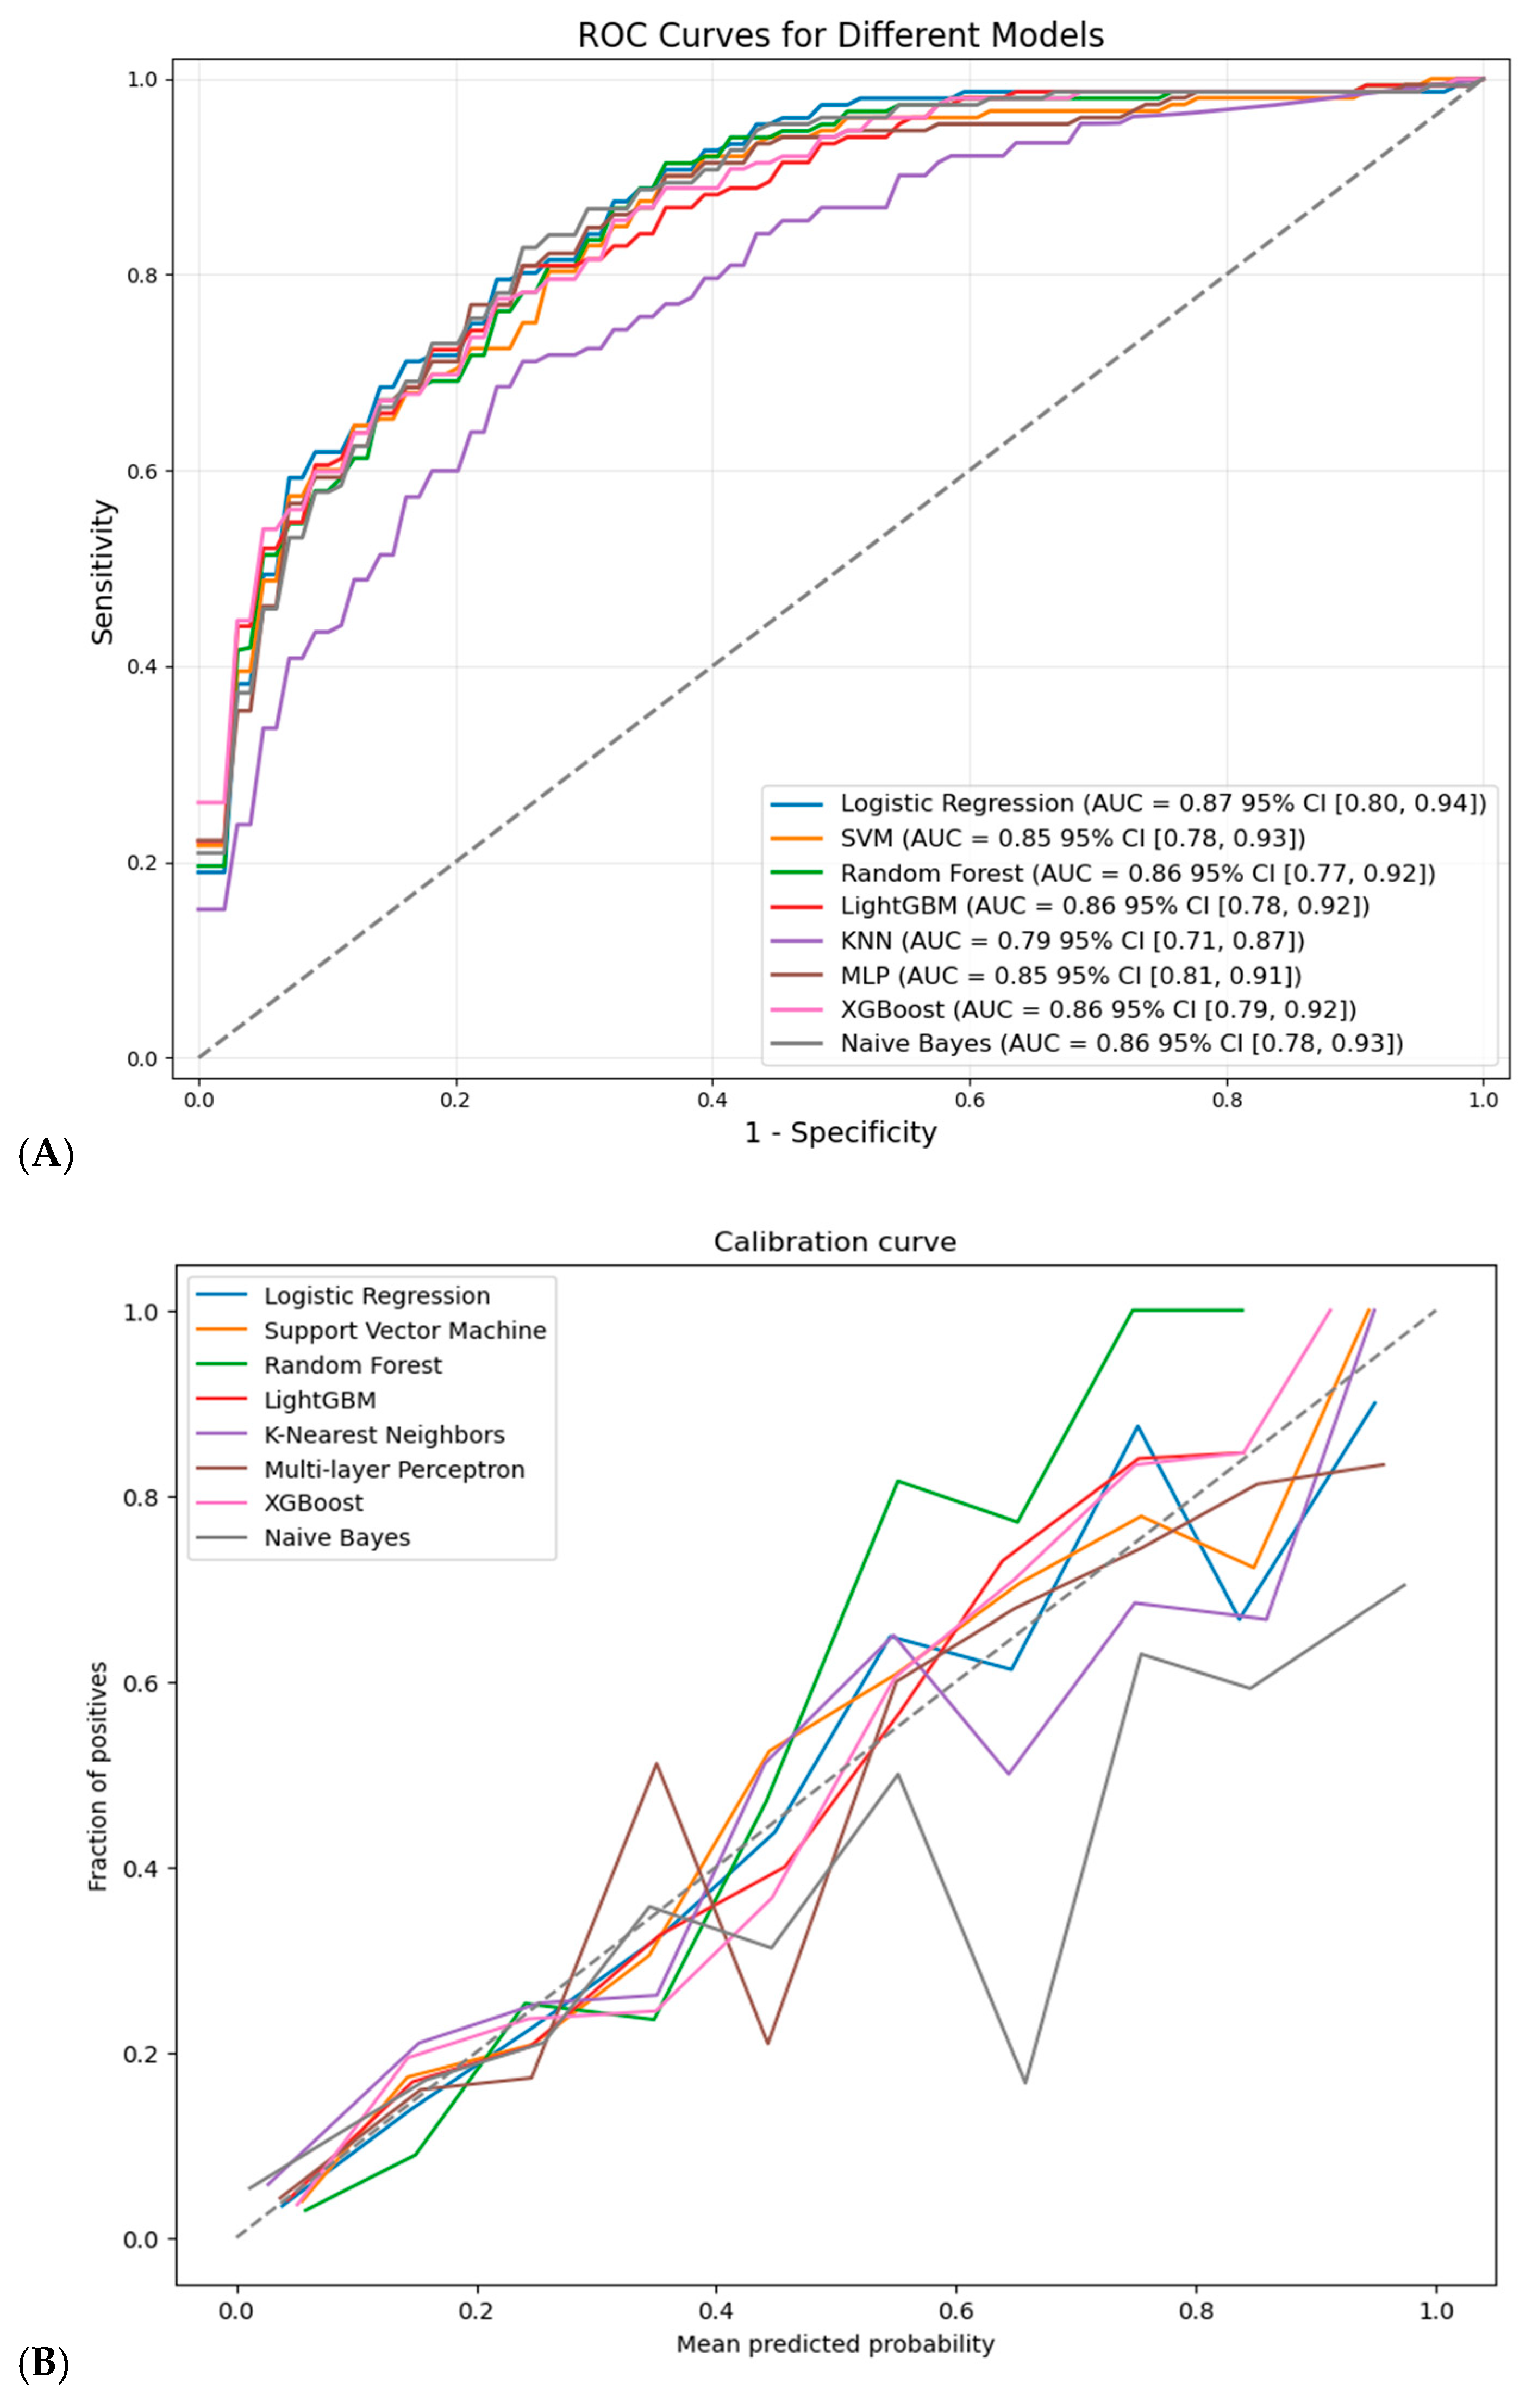
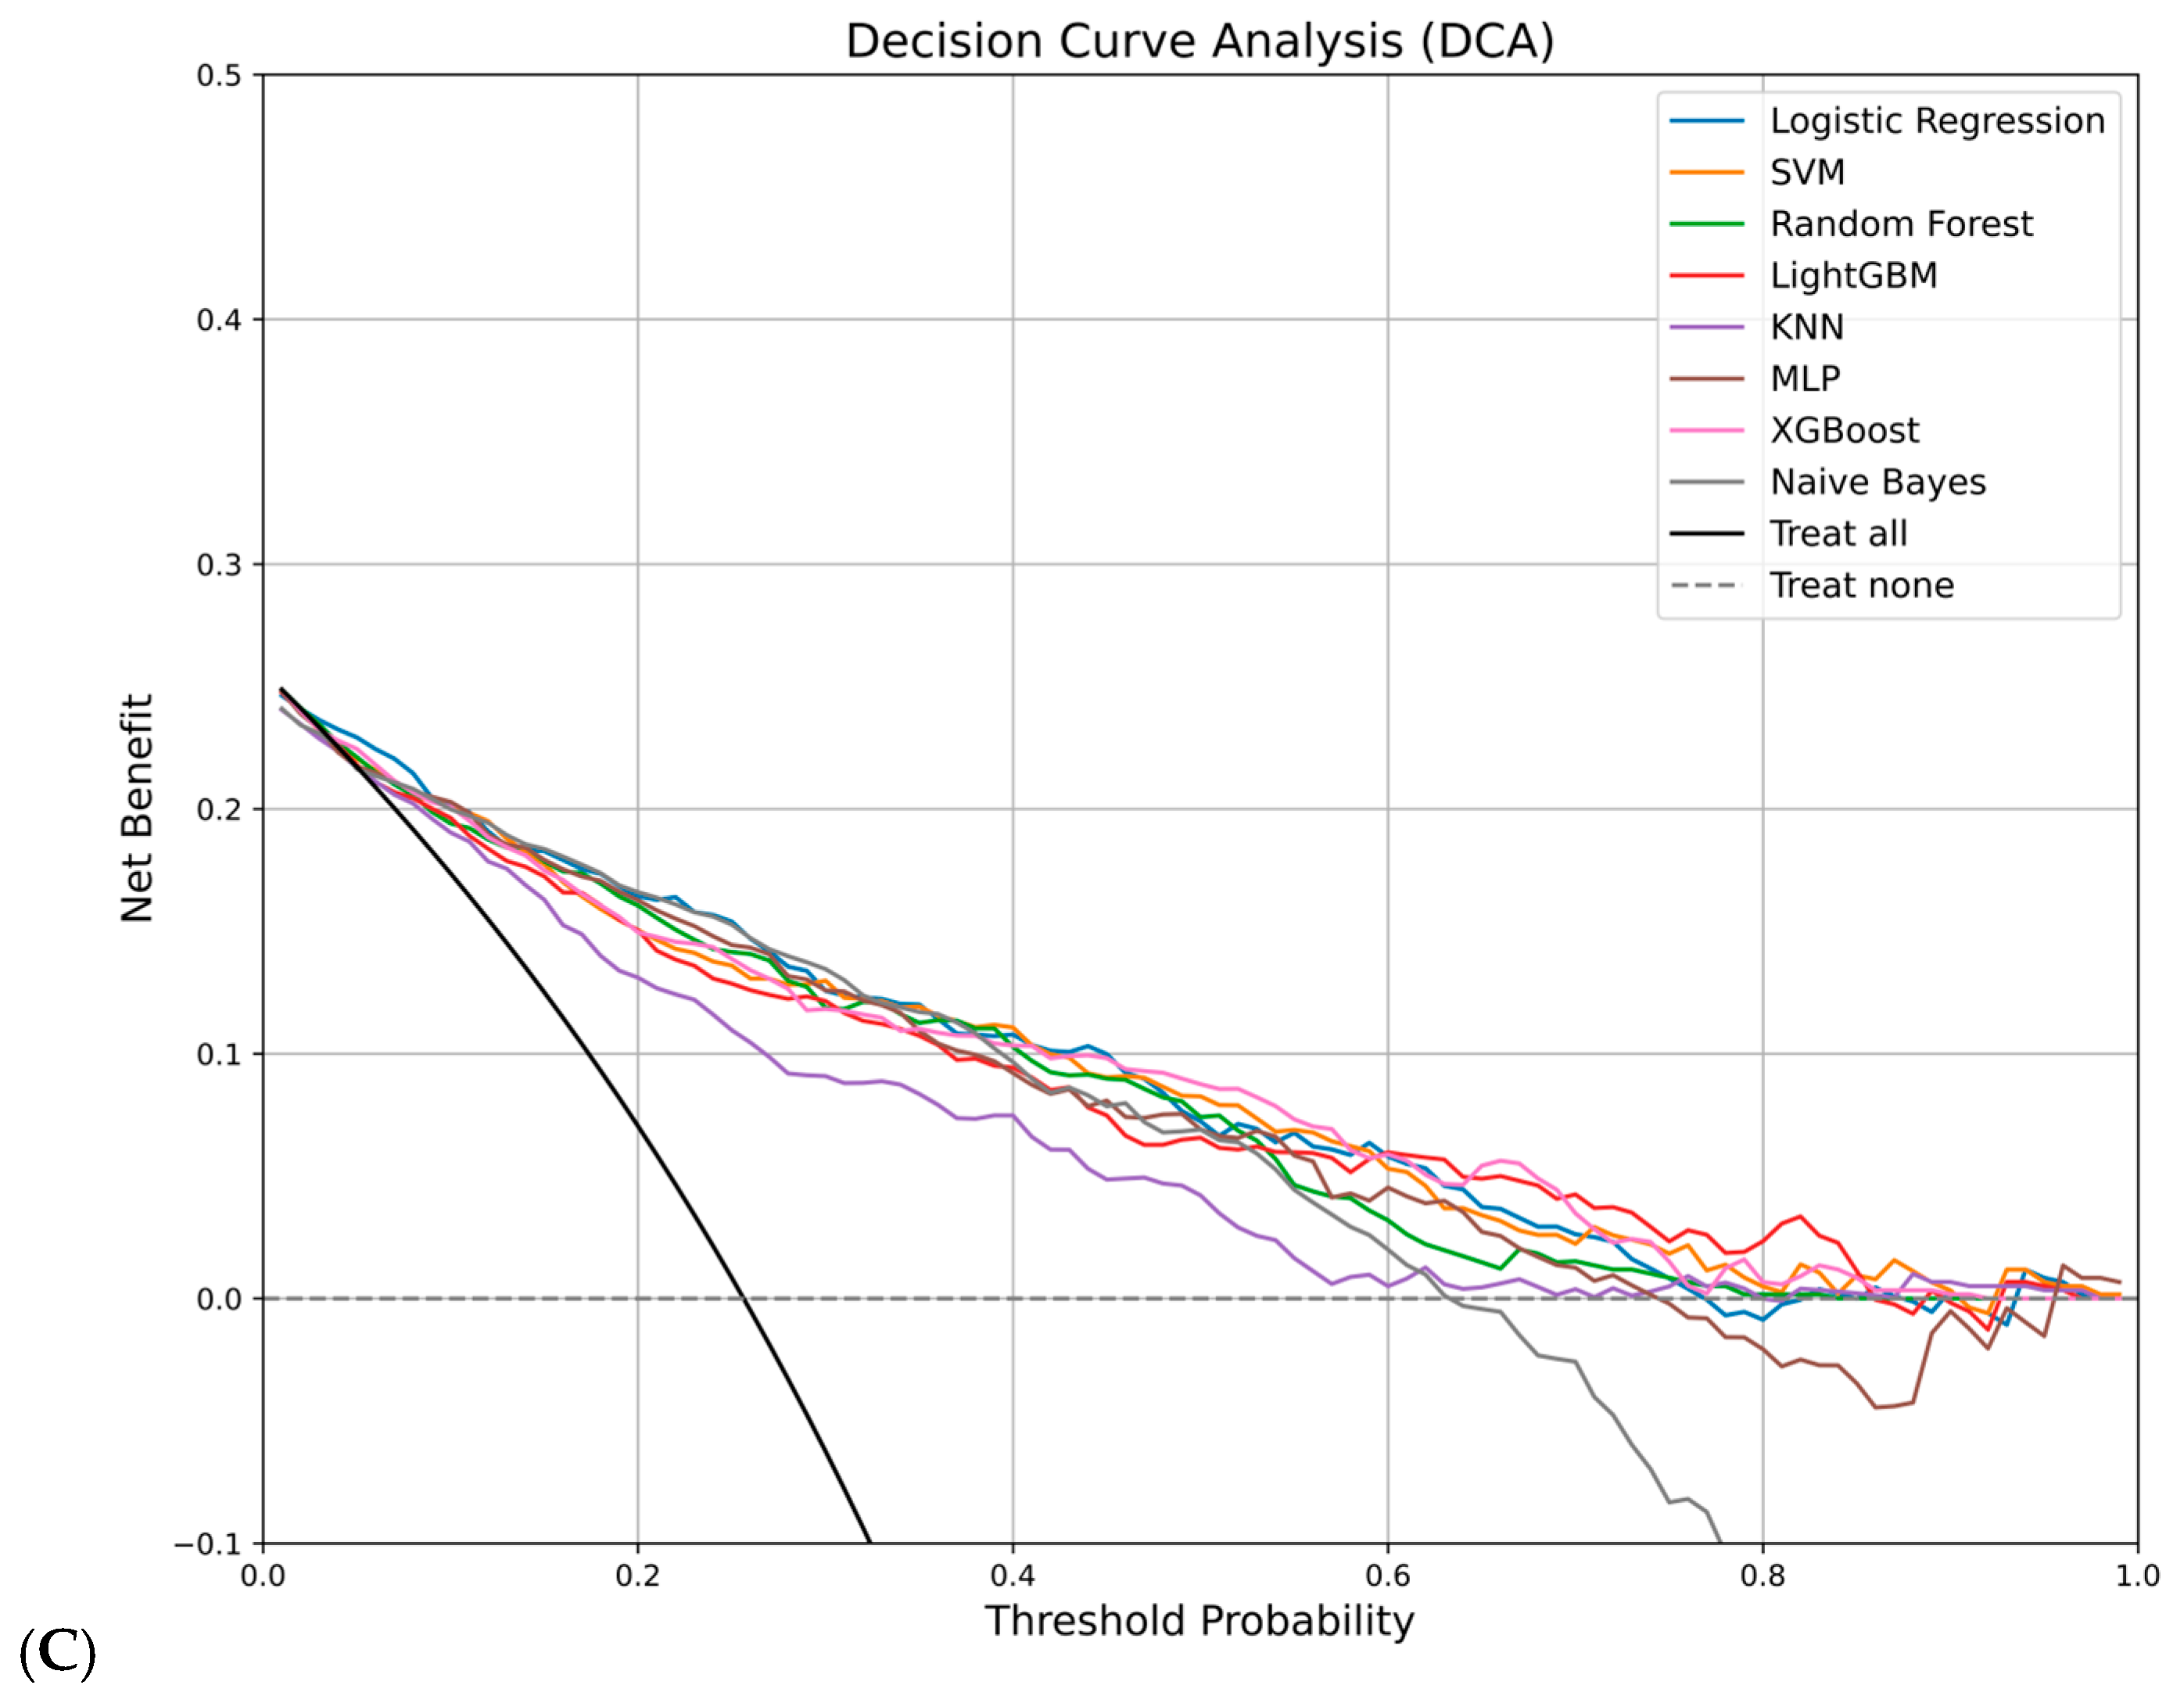
The data in Figure 4A demonstrate that all the models displayed robust discriminative ability, with the LR model attaining the maximum discriminatory power (AUC = 0.87; 95% CI: 0.80–0.94). The data in Table 3 indicate that the RF model exhibited the greatest sensitivity, whereas the MLP model attained the highest specificity, accuracy, and F1 score. The results of the model calibration are shown in Figure 4B. The calibration curve of XGBoost aligns most closely with the diagonal line; the SVM has a calibration slope nearest to 1, and the LR model has a calibration intercept closest to 1 and the lowest Brier score, indicating the most favorable overall calibration performance. The DCA depicted in Figure 4C indicated that the KNN and naive Bayes models yielded greater net benefits than the “treat-all” and “treat-none” strategies did within a threshold probability range of approximately 0.1–0.6, whereas the other models exhibited greater net benefits across a wider threshold probability range of approximately 0.1–0.8. Compared with the other ML models, the LR model had the greatest net benefit across most of the threshold probability ranges. For example, with a threshold probability of 0.3, the net benefit of the LR model was approximately 0.12, which was greater than that of the “treat-all” strategy, where the net benefit was negative and superior to that of the other ML models.

3.3.2. Evaluation of Validation Group Model Performance

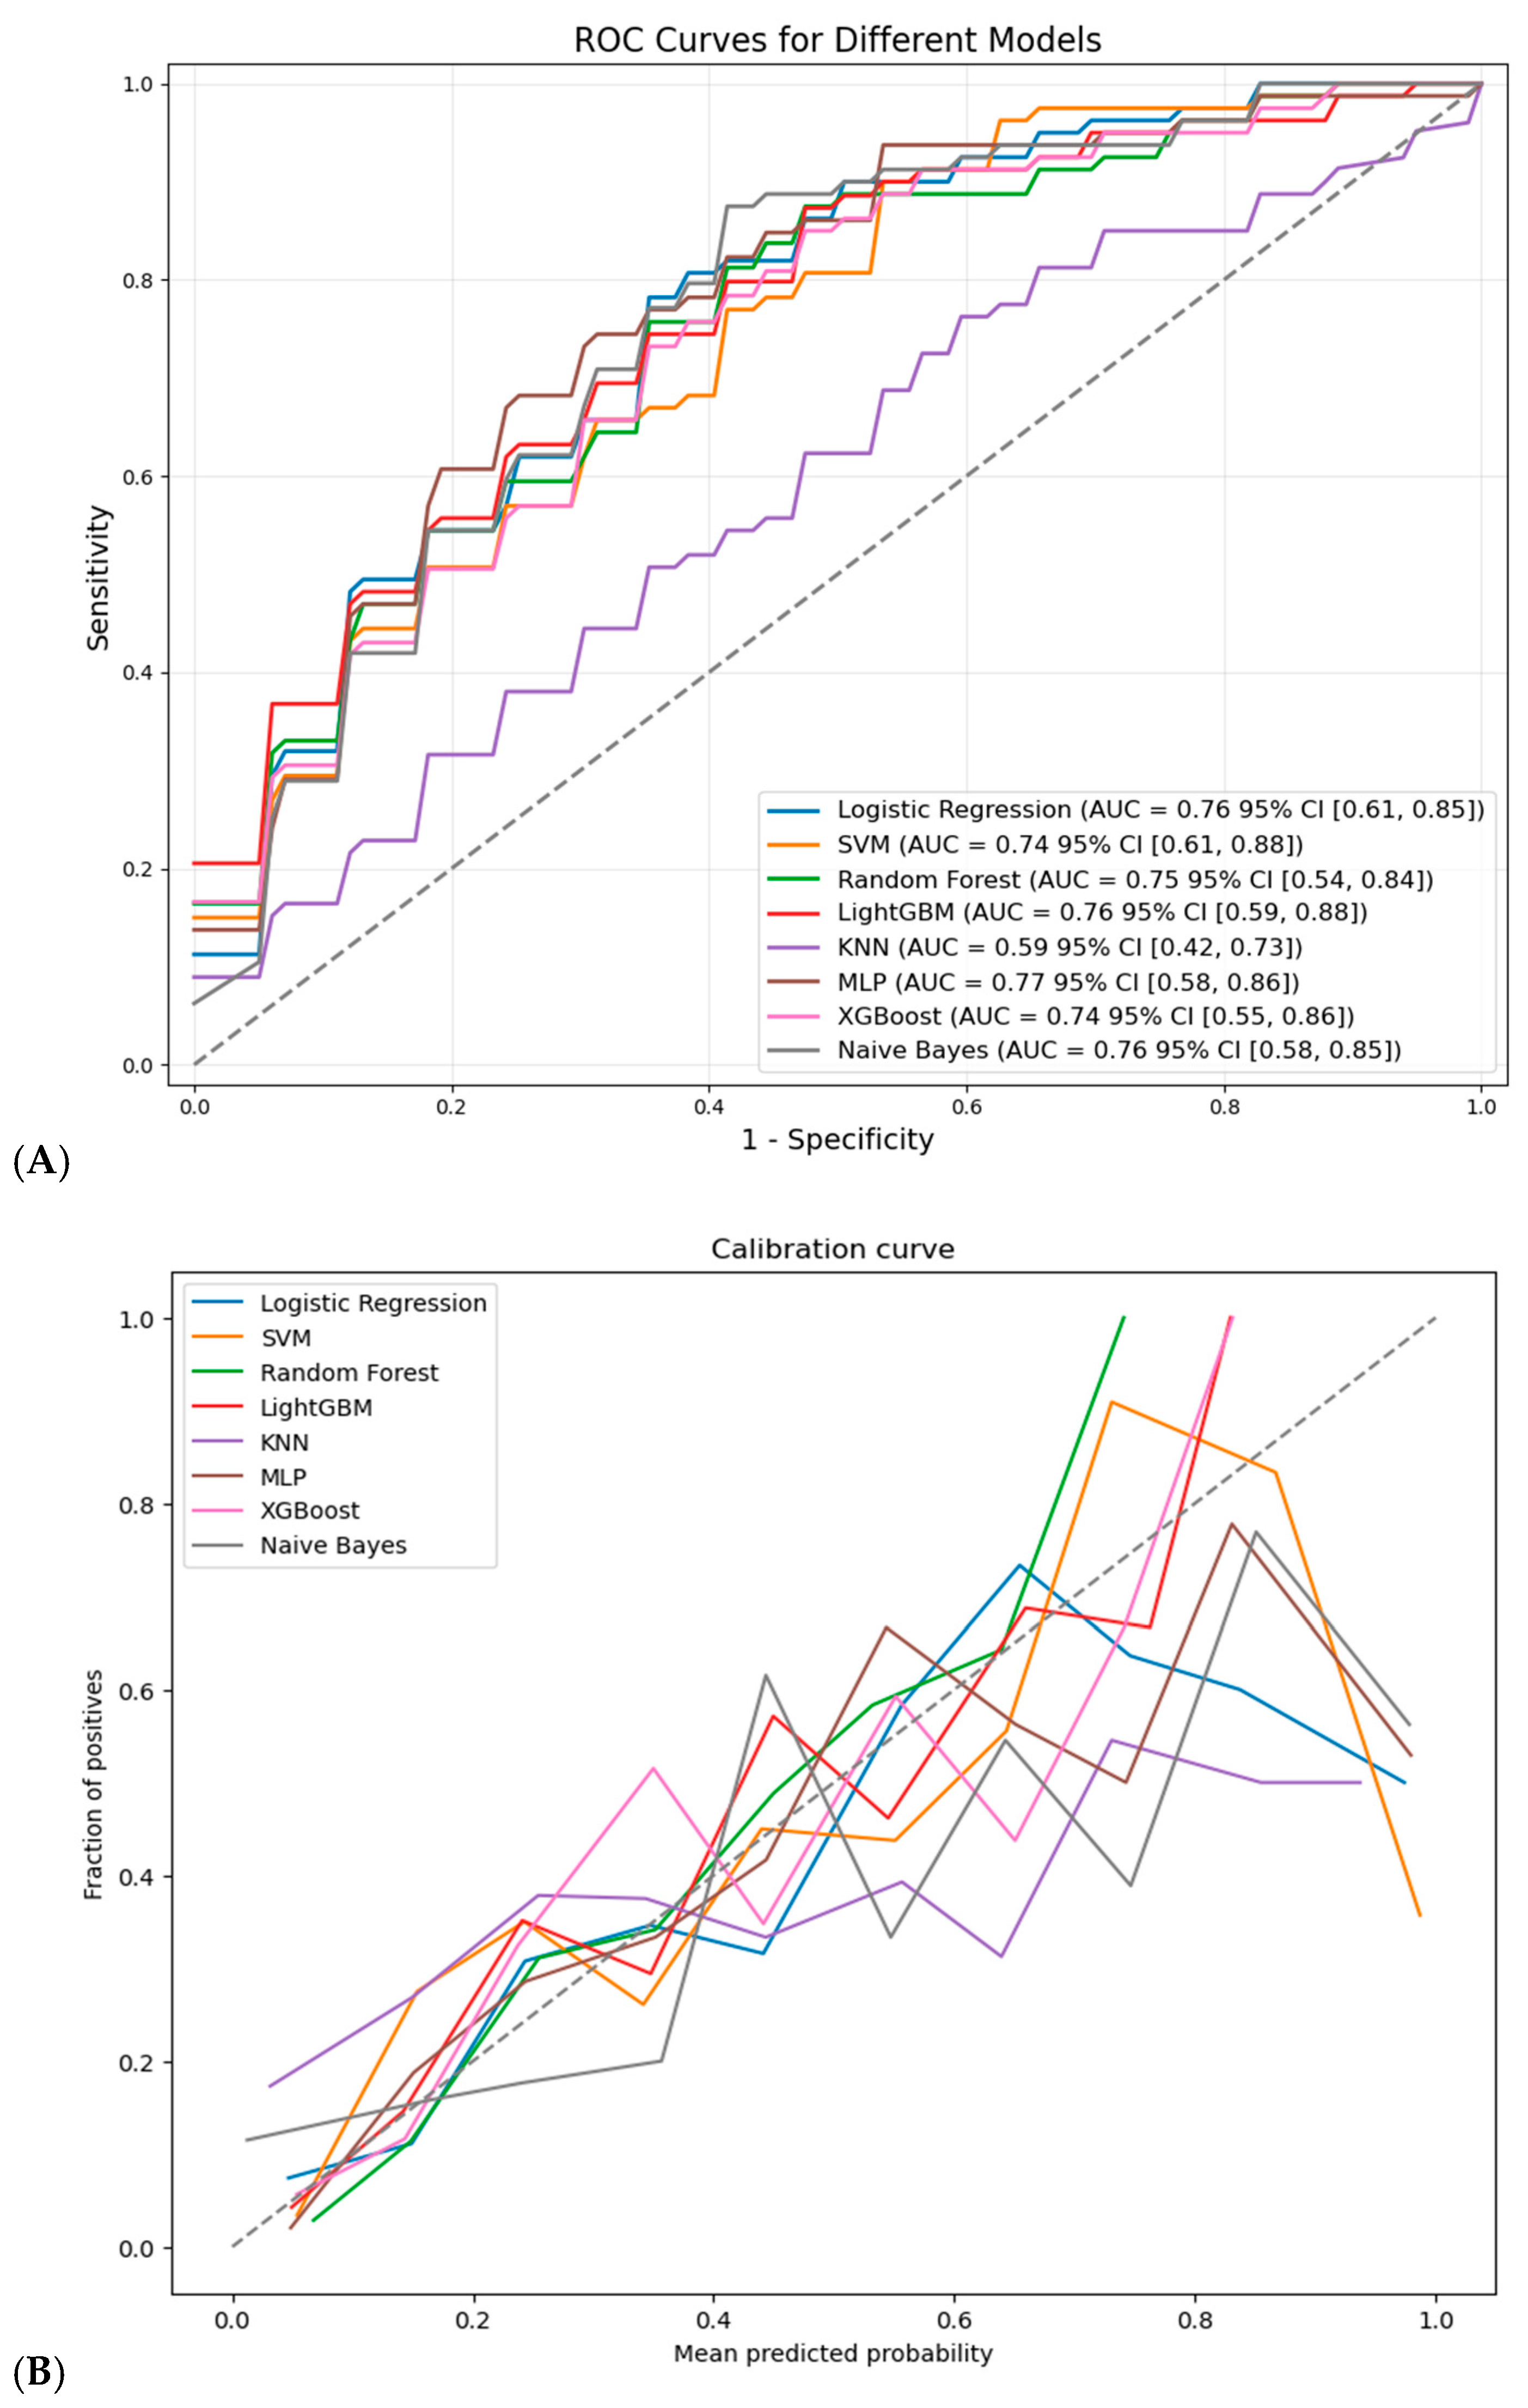
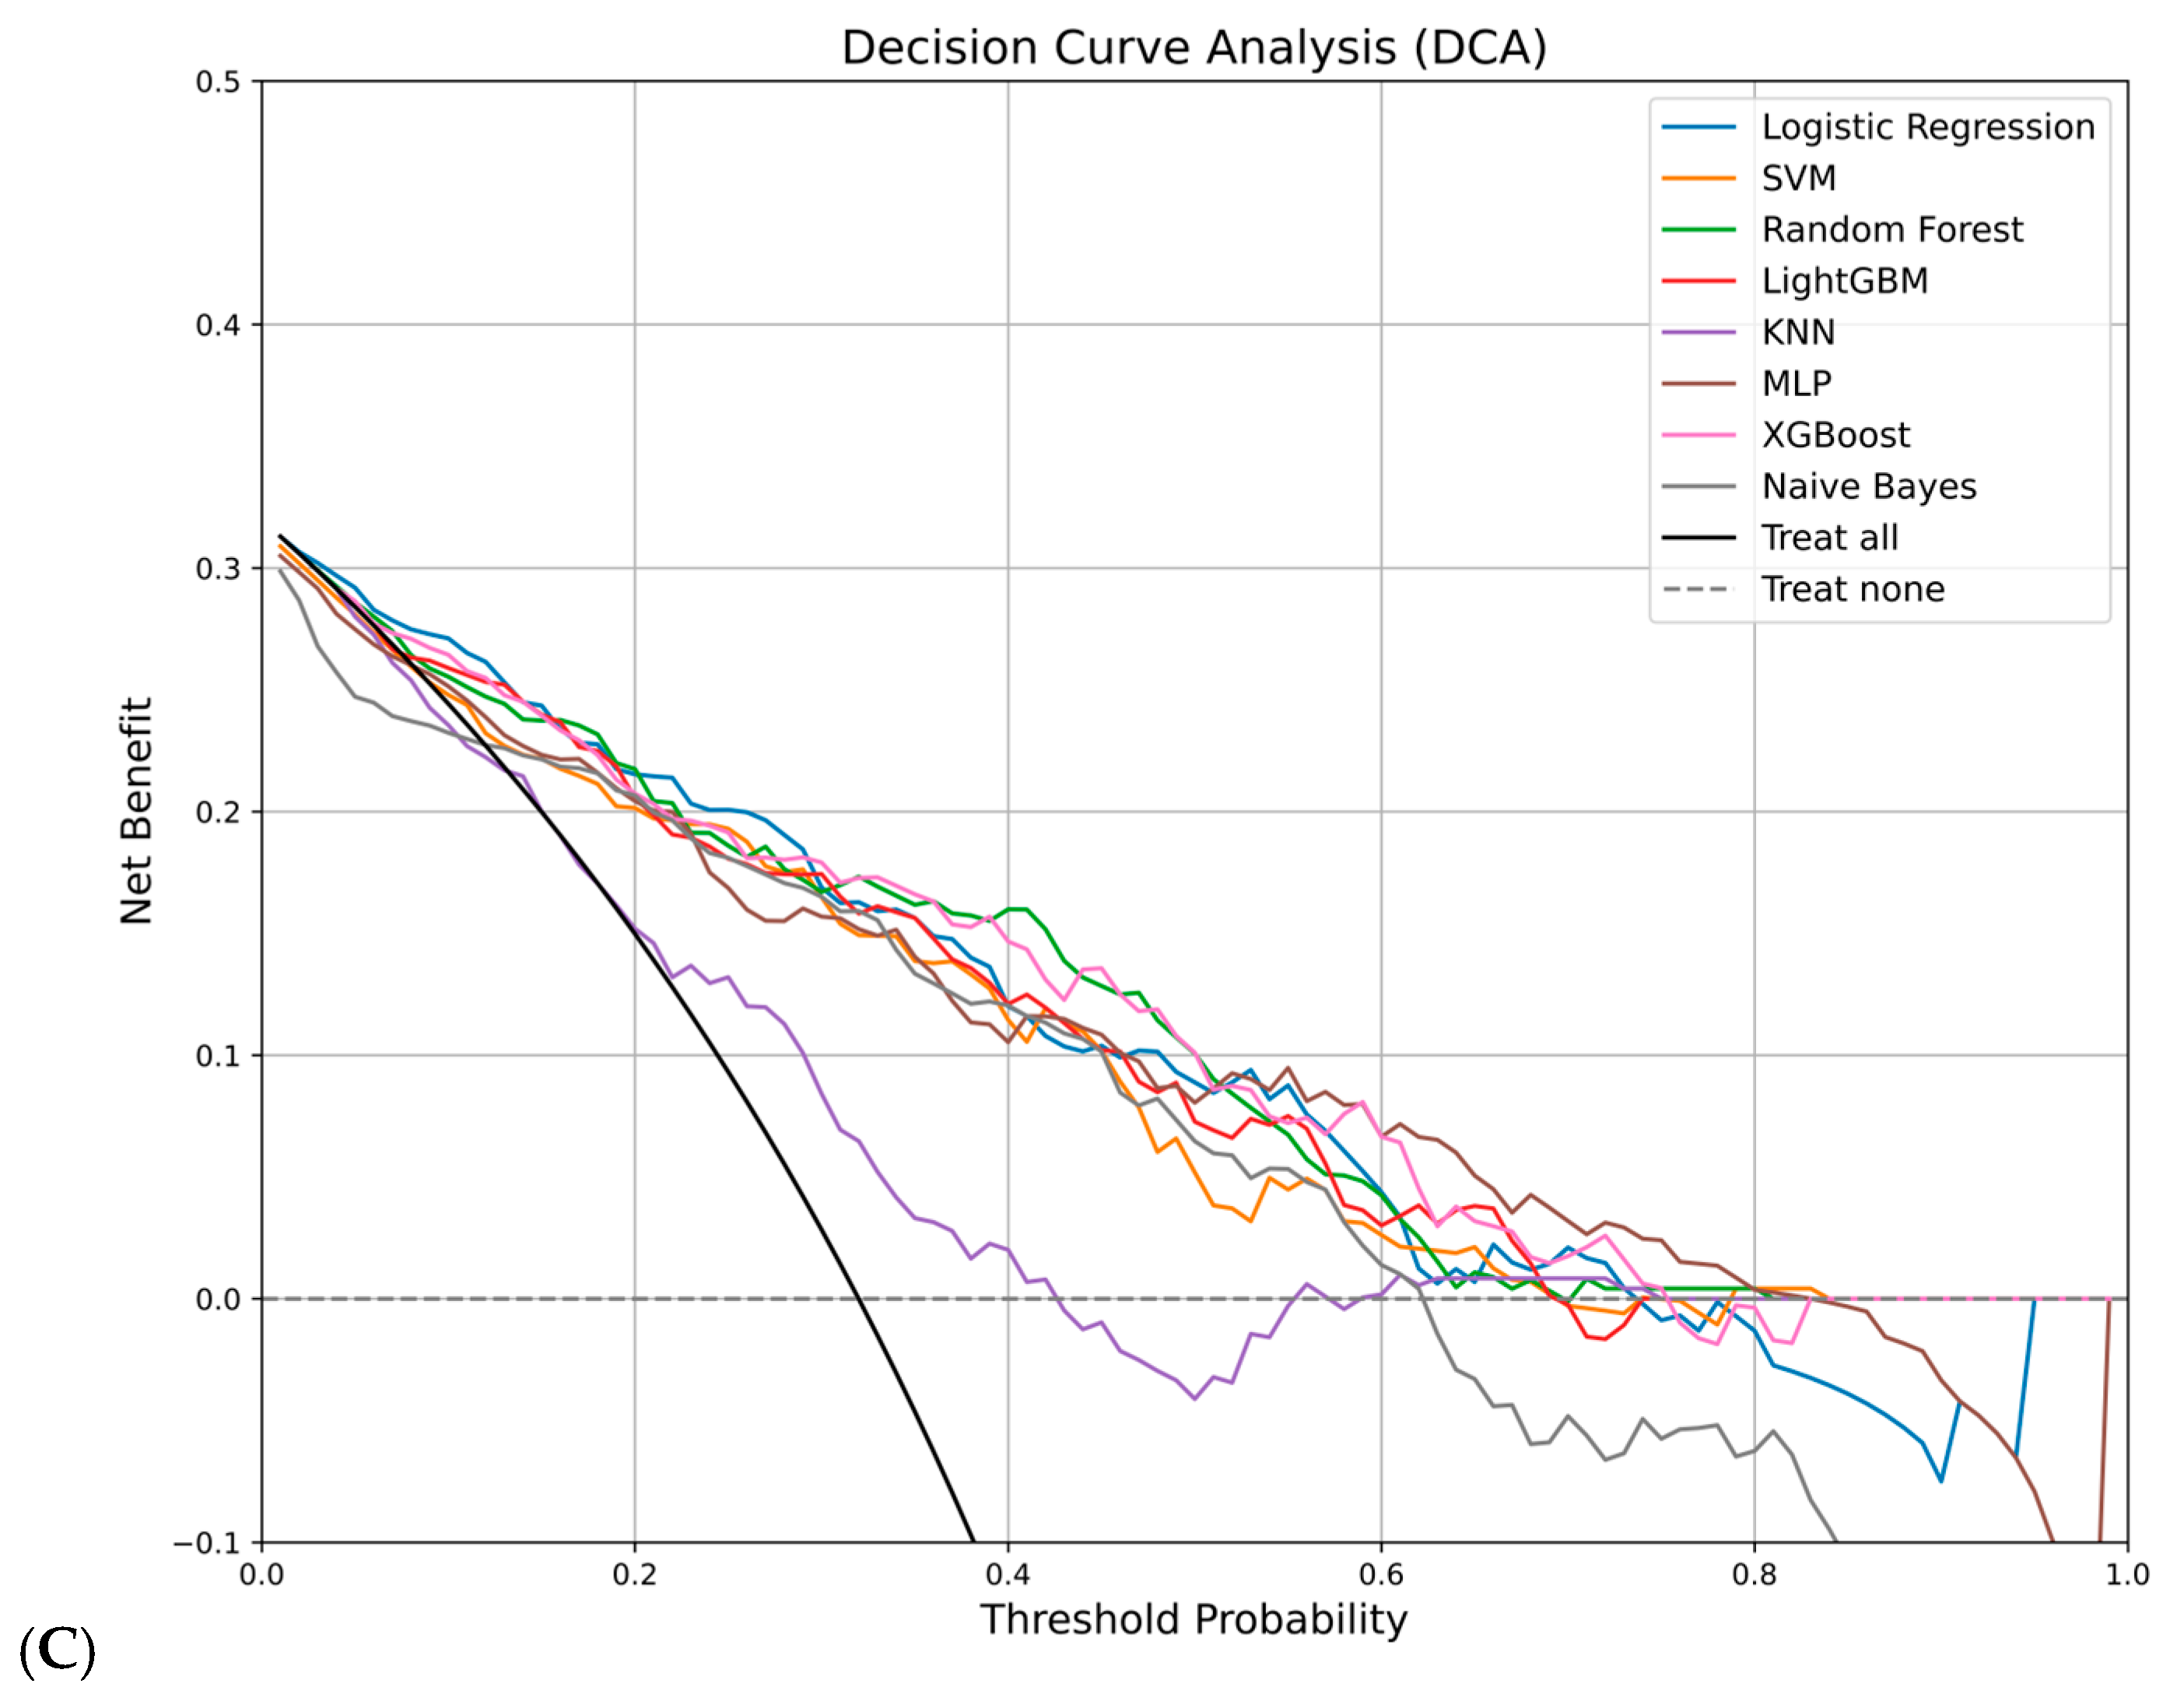
An overall drop in prediction performance was noted across all models when compared to the modelling group. Figure 5A illustrates that the ROC curves reveal the MLP model exhibited enhanced discriminative efficacy (AUC = 0.77, 95% CI: 0.58–0.86). In Table 4, the performance metrics indicate that the LightGBM model exhibited the maximum sensitivity, while the Naive Bayes model achieved the highest specificity, accuracy, and F1 score. Figure 5B demonstrates that the calibration curve of the LightGBM model is nearer to the diagonal. The XGBoost model attained the minimal Brier score, with its calibration slope and intercept nearest to 1. Figure 5C illustrates that the DCA revealed the KNN model yielded a superior net benefit compared to the “treat-all” and “treat-none” strategies within a threshold probability range of approximately 0.1–0.4, the MLP model within approximately 0.1–0.8, and the other models within approximately 0.1–0.7. The MLP model had the greatest net benefit across the majority of threshold probability ranges in comparison to the other ML models. At a threshold probability of 0.6, the net benefit of the MLP model was roughly 0.08, surpassing the negative net benefit of the “treat-all” method and outperforming other ML models.

3.4. Interpretation of the Model Analyses

Upon examining the performance metrics of each model in the modeling cohort and the temporal validation cohort, we determined that no individual model consistently surpassed the others across all the assessment metrics. Despite the LR model exhibiting robust discriminatory ability in the modeling cohort and several models displaying superiority in particular measures, its performance fluctuated across other datasets. The MLP model exhibited notably improved and more balanced prediction performance in both the modeling and temporal validation sets. We subsequently employed the SHAP technique to elucidate the MLP model.
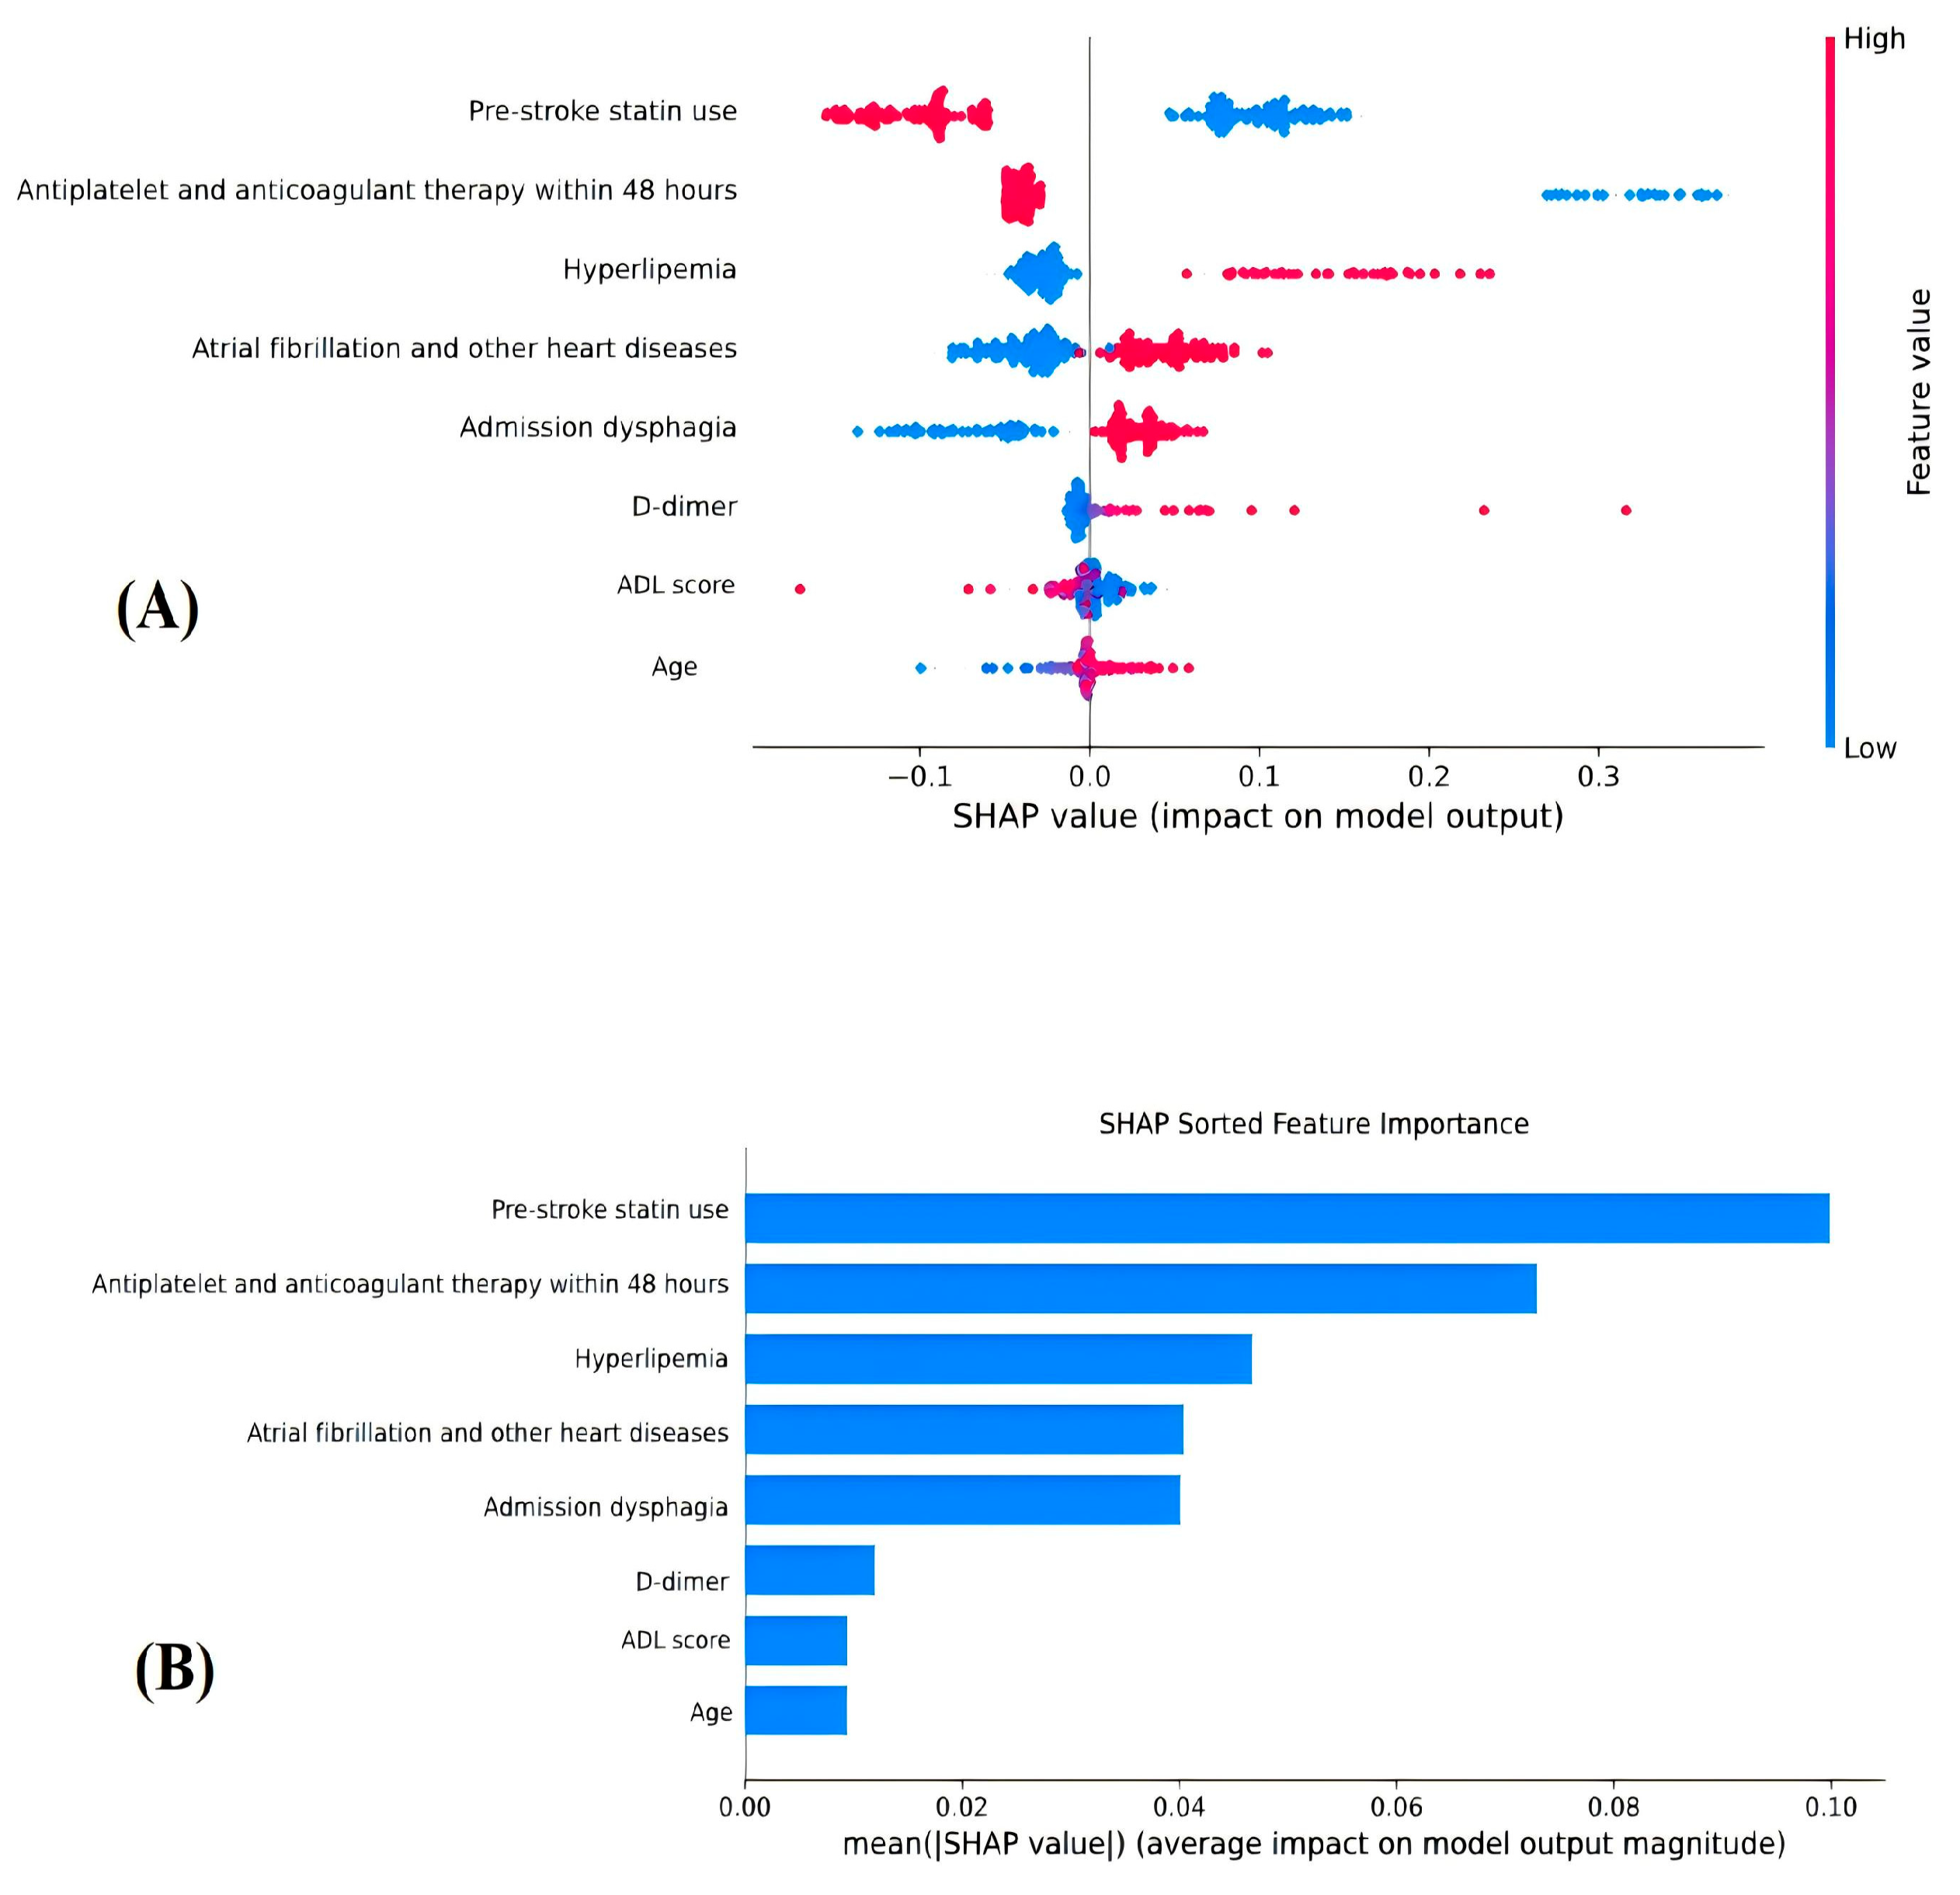
The distribution and ranking of the SHAP values for the clinical characteristics are shown in Figure 6. The impact of these feature values on the outcomes of death predictions is shown in Figure 6A. For example, pre-stroke statin utilization is indicated by red dots, which primarily cluster in areas with negative SHAP values. This suggests that prior statin use is linked to a decreased probability of mortality post-stroke; in contrast, the lack of statin use (shown by blue dots) is associated with an elevated risk of death. A bar chart of feature importance, arranged by ascending mean absolute SHAP values, demonstrating the degree of impact each clinical feature has on the model’s predictions, is shown in Figure 6B. According to the feature importance ranking, the primary predictors of 90-day post-MT mortality risk were pre-stroke statin use, early antiplatelet/anticoagulant therapy (within 48 h), hyperlipidemia, atrial fibrillation (or other cardiac disorders), and admission dysphagia.
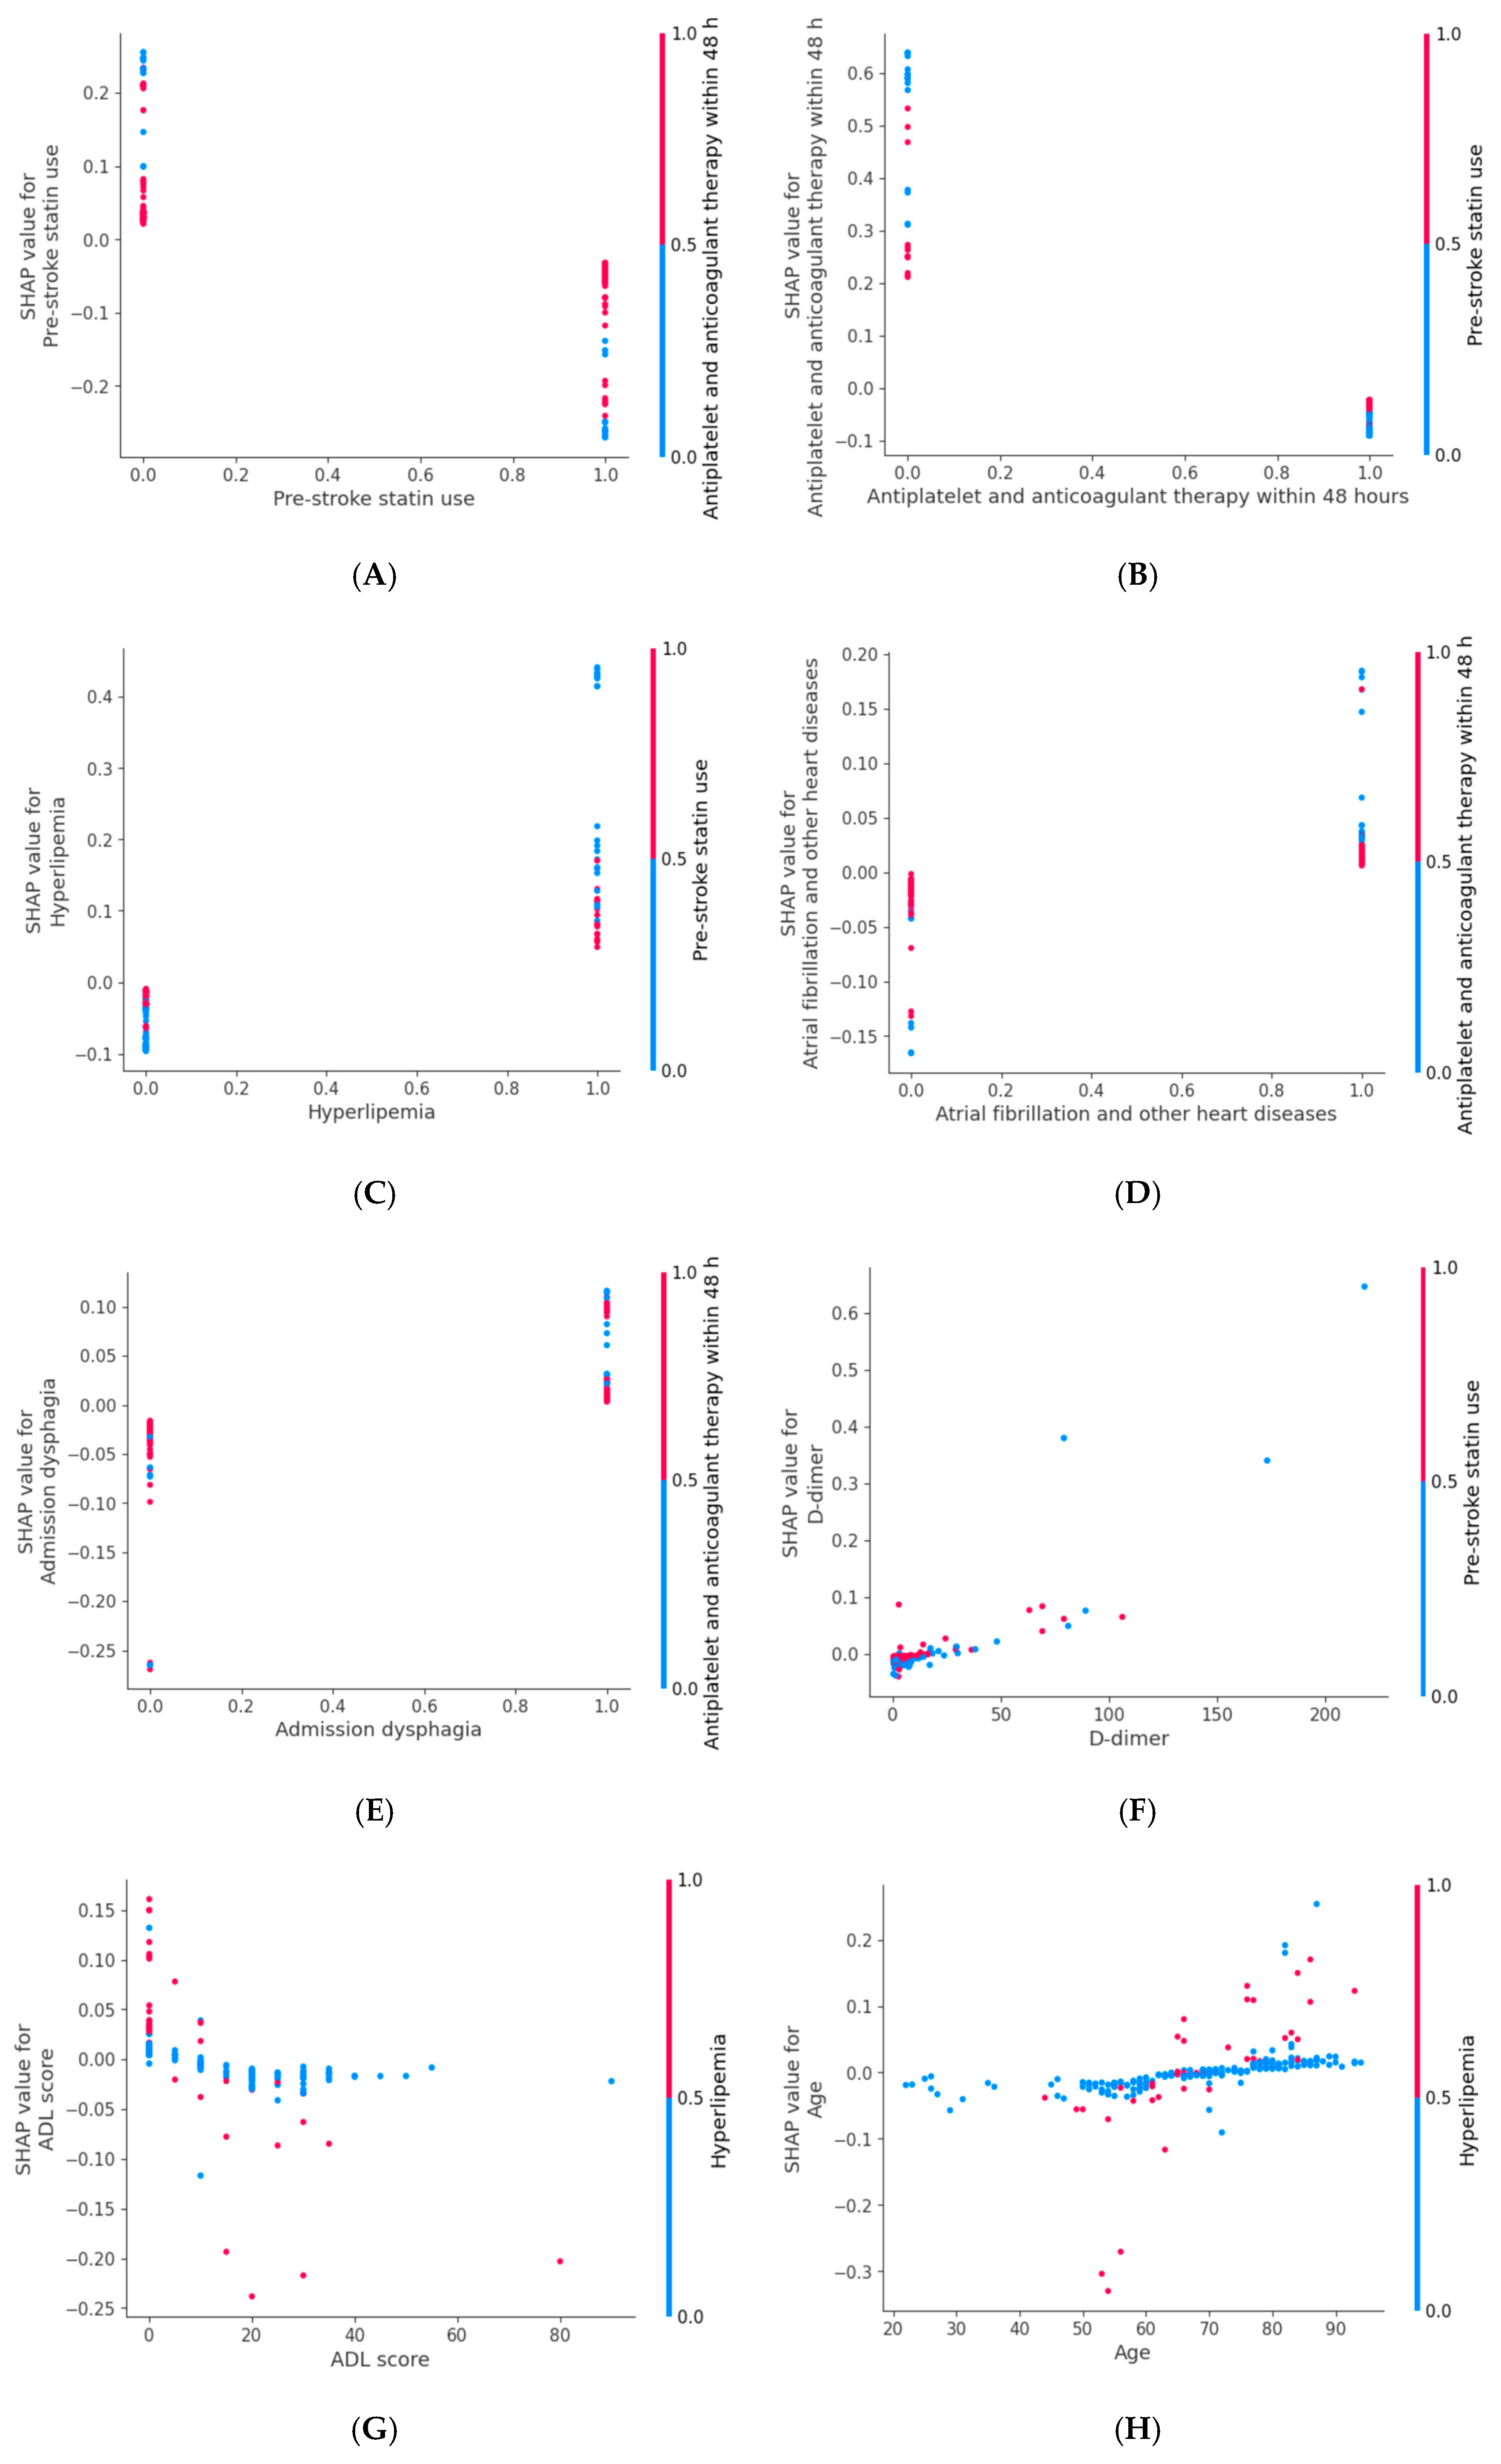
The SHAP dependence plot (Figure 7) demonstrates the relationship between the features and the SHAP values of the model predictions, highlighting the influence of varying feature values on the predictions. The data in Figure 7C demonstrate that patients with hyperlipidemia display markedly elevated SHAP levels relative to those without the disease. This trait influences the administration of lipid-modifying medications, as patients utilizing these treatments exhibit a decreased risk of mortality. In Figure 7H, the influence of age on mortality risk in individuals with MT appears to be largely stable. Nonetheless, in association with the characteristics of hyperlipidemia, starting at age 50, advancing age is correlated with an increased SHAP value, hence heightening the mortality risk among these patients.

4. Discussion

In this study, eight independent predictors of 90-day mortality in patients who underwent MT were identified. We created and evaluated several ML models utilizing clinical data. Of the eight algorithms assessed, the MLP model exhibited superior overall performance in both internal and temporal validation, with relatively better discrimination, calibration, and clinical utility. Furthermore, model interpretability was augmented by the SHAP method, which allowed for the visualization of the contributions of individual predictors, thereby enhancing transparency and aiding clinical integration.
In this study, the mortality rates in the modeling and validation cohorts ranged from 25.6% to 32%, which is consistent with the findings of other studies [11,25]. Numerous studies have reported comparably elevated mortality rates, underscoring the necessity of investigating factors that affect mortality in MT patients and creating a comprehensive mortality risk prediction model. Significantly, differences were detected between the modeling and validation cohorts for the ADL score, serum albumin concentration and serum CRP concentration, monocyte count, and D-dimer level. These disparities may be ascribed to individual variability in the indicators, patients’ underlying illnesses, and therapeutic measures. Despite these variances, only two parameters (ADL score and D-dimer) that exhibited substantial differences were ultimately incorporated into the model. Nevertheless, the model’s performance remained consistent, and these disparities did not significantly impact its predictive capability. These findings suggest that the model retained relatively stable predictive performance despite certain inter-cohort differences.
Through univariate and LASSO regression models, this study revealed multiple predictors of death in patients with AIS who received MT. Among these parameters, age proved to be a major prognostic predictor, with advancing age worsening the mortality risk in AIS patients [26]. Older patients typically face a heightened risk of comorbidities and demonstrate a reduced ability for cerebrovascular repair, both of which increase mortality risk [27]. Previous research has shown that cardiovascular disorders, including hyperlipidemia and atrial fibrillation, increase the severity of AIS and increase death rates, supporting the conclusions of this study [28,29]. Hyperlipidemia and other cardiac disorders, such as atrial fibrillation, not only increase the risk of AIS but also aggravate the pathophysiological mechanisms following MT by compromising vascular endothelial function and disrupting hemodynamics.
Research conducted by M’barek et al. [30] demonstrated that elevated D-dimer levels upon admission increased the 1-year mortality risk in patients with AIS by 1.55 times, corroborating the findings of the current study. Elevated D-dimer, a biomarker reflecting coagulation and fibrinolytic activity, is correlated with an increased risk of thrombotic events and stroke recurrence. Dysphagia at admission is a prevalent complication among stroke patients. This study revealed a significant association between dysphagia and mortality risk in patients who underwent MT, supporting the conclusions of Li et al. [31] Thus, the prompt recognition and treatment of dysphagia may improve patient outcomes.
This study demonstrated that pre-stroke statin utilization is correlated with a reduced mortality risk. Prior research has indicated that pre-stroke statin administration may increase anti-inflammatory, antioxidant, and atherosclerotic plaque stabilization and improve vascular function, thus alleviating neurological symptoms and decreasing mortality risk [32,33]. The current investigation revealed that antiplatelet and anticoagulant medication administered within 48 h was linked to a decreased mortality risk in patients with MT. Numerous extensive clinical trials, including TIMING [34] and ELAN [35], have substantiated the significance of early antiplatelet and anticoagulant therapy. Nonetheless, the existing evidence remains inadequate to definitively endorse the vigorous pursuit of early anticoagulation in patients with MT. Consequently, clinicians must select a suitable therapeutic regimen on the basis of the patient’s particular condition. This study revealed that a higher ADL score at admission was inversely correlated with the likelihood of mortality. The ADL score serves as a measure of functional state, indicating overall illness condition, neurological impairments, and rehabilitation potential, thereby holding clinical significance for determining mortality risk [36].
Despite the NIHSS score being a recognized measure of stroke severity and its extensive correlation with prognosis in AIS patients, it was excluded from the final model following LASSO regression. An explanation may be that the predicted information provided by the NIHSS score coincided with other retained characteristics associated with neurological impairment and functional status, notably the entry ADL score and dysphagia. LASSO regression selects variables that provide the greatest incremental predictive value while reducing redundancy and model complexity. Consequently, clinically significant variables may not persist in the final model following penalization. The resulting model exhibited adequate discrimination and calibration performance in both the internal and external validation datasets, suggesting that the omission of the NIHSS did not substantially impair model performance within the current dataset.
This study involved the construction and evaluation of eight ML models to assess their efficacy in predicting the prognosis of stroke patients. In comparison to the other models, the MLP models demonstrated relatively better predictive performance in both the modeling cohort and the temporal validation set, achieving AUC values of 0.85 and 0.77, respectively, thereby underscoring the efficacy of the MLP models in capturing intricate nonlinear relationships and feature interactions [37]. A decline in model performance between the modeling and validation cohorts was noted, a phenomenon that is relatively common in clinical prediction modeling [21] and may be linked to variations in data distribution between cohorts, multicenter heterogeneity, and the inherent complexity of ML algorithms [38]. Furthermore, the implementation of 10-fold cross-validation during model development may have helped reduce overfitting and improve the stability of the performance estimation. Nevertheless, because neither nested cross-validation nor bootstrap optimism correction was performed, some degree of model optimism cannot be excluded. Although the models maintained acceptable predictive performance in the temporal validation cohort, further multicenter external validation is still needed to confirm their generalizability.
The predictive models developed by Li [39] and Matsukawa et al. [18] utilizing the LR algorithm for predicting mechanical thrombus extraction outcomes achieved AUCs of 0.87 and 0.79, respectively, during internal validation, demonstrating strong performance and significant clinical value. Tong et al. [40] effectively employed the XGBoost algorithm to predict the prognosis of MT patients, achieving AUCs of 0.93 and 0.77 for the model test set and validation set, respectively. Compared with previous studies, the MLP model in this research demonstrated comparable predictive performance. This performance was further confirmed by temporal validation, highlighting its potential utility for clinical decision-making and prognostic evaluation in stroke patients. Notably, in the modeling cohort, the LR model exhibited robust discrimination and satisfactory calibration; nevertheless, its net therapeutic benefit was comparatively diminished in the DCA. This mismatch can be attributed to the fundamental assumption of linear relationships in linear regression models, which constrains their capacity to include intricate nonlinear effects and interactions among predictors [41]. Conversely, more adaptable ML models, such as MLPs, can more effectively capture intricate patterns, resulting in enhanced clinical decision-making ability across a broader spectrum of threshold probabilities [42].
In contrast to conventional ML models grounded in linear regression, such as LR, some advanced ML models—such as the MLP employed in this study—are regarded as “black-box” models owing to their intricate internal architectures and opacity. This paper presents the SHAP algorithm to improve interpretability and ensure transparency in healthcare applications. This novel approach for evaluating diverse black-box ML models offers both local and global insights, clarifies the impact of specific variables on the model’s predictive capability, and fosters trust between physicians and artificial intelligence algorithms [43,44]. An interpretative analysis of the MLP model utilizing the SHAP algorithm indicated that pre-stroke statin use, antiplatelet/anticoagulant therapy within 48 h, hyperlipidemia, the presence of atrial fibrillation and other cardiac diseases, and admission dysphagia were significant factors enhancing the model’s predictive efficacy. Various findings indicate the proportional impact of various variables on the model’s decision-making process. This information can be used to facilitate clinicians’ understanding of individual risk forecasts and to promote better informed and individualized clinical decision-making. It is important to note that SHAP analysis is a model-agnostic interpretability tool that elucidates the contribution of each variable to the model’s predictive output rather than determining causal links between variables and clinical outcomes.
This study offers four primary contributions. First, rather than relying on a single algorithm, we developed and evaluated eight conventional ML models to predict 90-day mortality following MT. Second, we integrated 10-fold cross-validation with temporal validation to rigorously assess model stability and generalizability, thereby providing a more comprehensive assessment of model performance and potential clinical utility. Third, the models were comprehensively evaluated on the basis of discrimination, calibration, and clinical utility. Fourth, the SHAP method was employed to elucidate the primary predictors, thereby facilitating personalized clinical decision-making. Collectively, this clinically oriented framework—encompassing model comparison, multistage validation, and interpretability analysis—enhances the translational value of ML in prognostic prediction for stroke patients.
This study has several limitations. First, its single-center design and the use of a temporal validation cohort from the same institution may introduce selection bias. Furthermore, the reliance on a population primarily from one region in China potentially limits the generalizability and fairness of the model across diverse ethnic cohorts, hospital settings, and healthcare systems. Consequently, external validation using multicenter and multiethnic cohorts is warranted to rigorously evaluate the robustness of the model. In addition, although temporal validation was performed, both the modeling and validation cohorts originated from the same institution. Therefore, the current validation strategy cannot fully eliminate the possibility of model optimism or institutional bias. Second, despite the inclusion of numerous clinical variables, certain critical imaging predictors typically utilized in thrombectomy prognosis studies were omitted because of data inconsistency inherent in this retrospective design. Similarly, the lack of granular data concerning operator experience may leave residual procedural confounding. Future multicenter investigations incorporating standardized imaging parameters and detailed procedural metrics are essential for enhancing model performance. Third, while univariate pre-selection prior to LASSO regression may have excluded predictors with weak univariate but significant multivariable associations, this step served as an initial dimensionality reduction technique, followed by rigorous refinement via LASSO and ML. Future studies with larger datasets could explore alternative variable-selection strategies to validate our approach. Fourth, pre-stroke statin and antiplatelet/anticoagulant use may introduce confounding effects, as these factors likely reflect baseline health status, healthcare access, or stroke characteristics. Furthermore, the reliance on binary (yes/no) data—lacking information on dosage, duration, or adherence—may result in exposure misclassification. Finally, residual confounding remains a concern. Owing to the retrospective nature of this study, data concerning ICU and in-hospital complications (e.g., pneumonia, aspiration, infections, mechanical ventilation duration, and cardiac events) were not consistently available and thus excluded, potentially affecting the comprehensiveness of the model.

5. Conclusions

In this study, we developed and validated a prognostic model for 90-day mortality in patients who underwent MT. Eight independent predictors were identified: age, hyperlipidemia, atrial fibrillation (or other cardiac disorders), pre-stroke statin use, antiplatelet/anticoagulant therapy within 48 h, admission dysphagia, ADL score, and D-dimer level. Among the evaluated algorithms, the MLP model demonstrated relatively favorable predictive performance within the current dataset in terms of discrimination, calibration, and clinical utility. These findings may support individualized risk assessment for patients undergoing MT. However, given the single-center retrospective design and the absence of independent multicenter external validation, the model should be interpreted cautiously prior to clinical implementation.

Author Contributions

Conceptualization, Q.J., R.W., Y.H. and L.F.; methodology, Q.J., L.H. and L.F.; software, Q.J., R.W. and L.H.; validation, R.W. and L.H.; formal analysis, N.W.; investigation, Q.J., Y.H., N.W., J.P. and J.Z.; resources, Y.H., N.W., J.P. and J.Z.; data curation, Y.H., N.W. and J.Z.; writing—original draft preparation, Q.J.; writing—review and editing, R.W. and L.F.; visualization, R.W. and J.P.; supervision, L.H. and L.F.; project administration, L.F.; funding acquisition, L.F. All authors have read and agreed to the published version of the manuscript.

Funding

This work was supported by the Sichuan Province Cadres Health Project [grant number 2024-118] and the Graduate Education and Teaching Reform Research Project, Sichuan University [grant number GSSCU2023089].

Institutional Review Board Statement

The study was conducted in accordance with the Declaration of Helsinki and approved by the Ethics Committee of West China Hospital, Sichuan University (protocol code: 20241126 and date of approval: 18 June 2024).

Informed Consent Statement

This study consisted of a retrospective cohort for model development and a prospective cohort for external validation. The retrospective cohort study was approved by the ethics committee with a waiver of informed consent due to the use of anonymized data without personal privacy concerns. For the prospective cohort, informed consent was obtained from all participants prior to enrollment.

Data Availability Statement

Due to privacy restrictions, all raw data and code generated or analysed during this study are available from the corresponding author upon reasonable request.

Acknowledgments

We sincerely thank the participating department for their support in data collection and all study participants for their valuable contributions.

Conflicts of Interest

The authors declare no conflicts of interest.

Abbreviations

The following abbreviations are used in this manuscript:
AISAcute Ischemic Stroke
MTMechanical Thrombectomy
MLMachine Learning
SHAPShapley Additive Explanations
mTICImodified Thrombolysis in Cerebral Infarction
AUCarea under the curve
NIHSSNational Institutes of Health Stroke Scale
mRSmodified Rankin Scale
ADLactivities of daily living
LRlogistic regression
SVMSupport Vector Machine
RFRandom Forest
LightGBMLight Gradient Boosting Machine
KNNK-Nearest Neighbors
MLPMulti-Layer Perceptron
XGBoosteXtreme Gradient Boosting
ROCreceiver operating characteristic
DCAdecision curve analysis

References

  1. GBD 2021 Stroke Risk Factor Collaborators. Global, regional, and national burden of stroke and its risk factors, 1990–2021: A systematic analysis for the global burden of disease study 2021. Lancet Neurol. 2024, 23, 973–1003. [CrossRef] [Scilit] [PubMed]
  2. Bernhardt, J.; Urimubenshi, G.; Gandhi, D.B.C.; Eng, J.J. Stroke rehabilitation in low-income and middle-income countries: A call to action. Lancet 2020, 396, 1452–1462. [Google Scholar] [CrossRef] [Scilit] [PubMed]
  3. GBD 2021 Diseases and Injuries Collaborators. Global incidence, prevalence, years lived with disability (YLDs), disability-adjusted life-years (DALYs), and healthy life expectancy (HALE) for 371 diseases and injuries in 204 countries and territories and 811 subnational locations, 1990–2021: A systematic analysis for the global burden of disease study 2021. Lancet 2024, 403, 2133–2161. [CrossRef] [Scilit] [PubMed]
  4. Ma, Q.; Li, R.; Wang, L.; Yin, P.; Wang, Y.; Yan, C.; Ren, Y.; Qian, Z.; Vaughn, M.G.; McMillin, S.E.; et al. Temporal trend and attributable risk factors for stroke burden in China, 1990–2013: An analysis for the global burden of disease study 2019. Lancet Public Health 2021, 6, e897–e906. [Google Scholar] [CrossRef] [Scilit] [PubMed]
  5. Goyal, M.; Menon, B.K.; van Zwam, W.H.; Dippel, D.W.; Mitchell, P.J.; Demchuk, A.M.; Dávalos, A.; Majoie, C.B.L.M.; Van Der Lugt, A.; De Miquel, M.A.; et al. Endovascular thrombectomy after large-vessel ischemic stroke: A meta-analysis of individual patient data from five randomized trials. Lancet 2016, 387, 1723–1731. [Google Scholar] [CrossRef] [Scilit] [PubMed]
  6. Li, Q.; Abdalkader, M.; Siegler, J.E.; Yaghi, S.; Sarraj, A.; Campbell, B.C.V.; Yoo, A.J.; Zaidat, O.O.; Kaesmacher, J.; Pujara, D.; et al. Mechanical thrombectomy for large ischemic stroke: A systematic review and meta-analysis. Neurology 2023, 101, e922–e932. [Google Scholar] [CrossRef] [Scilit] [PubMed]
  7. Nguyen, T.N.; Abdalkader, M.; Fischer, U.; Qiu, Z.; Nagel, S.; Chen, H.-S.; Miao, Z.; Khatri, P. Endovascular management of acute stroke. Lancet 2024, 404, 1265–1278. [Google Scholar] [CrossRef] [Scilit] [PubMed]
  8. Jovin, T.G.; Chamorro, A.; Cobo, E.; de Miquel, M.A.; Molina, C.A.; Rovira, A.; Román, L.S.; Serena, J.; Abilleira, S.; Ribo, M.; et al. Thrombectomy within 8 hours after symptom onset in ischemic stroke. N. Engl. J. Med. 2015, 372, 2296–2306. [Google Scholar] [CrossRef] [Scilit] [PubMed]
  9. Li, H.; Ye, S.S.; Wu, Y.L.; Huang, S.M.; Li, Y.X.; Lu, K.; Huang, J.-B.; Chen, L.; Li, H.-Z.; Wu, W.-J.; et al. Predicting mortality in acute ischemic stroke treated with mechanical thrombectomy: Analysis of a multicenter prospective registry. BMJ Open 2021, 11, e043415. [Google Scholar] [CrossRef] [Scilit] [PubMed]
  10. Huo, X.; Ma, G.; Tong, X.; Zhang, X.; Pan, Y.; Nguyen, T.N.; Yuan, G.; Han, H.; Chen, W.; Wei, M.; et al. Trial of endovascular therapy for acute ischemic stroke with large infarct. N. Engl. J. Med. 2023, 388, 1272–1283. [Google Scholar] [CrossRef] [Scilit] [PubMed]
  11. Sarraj, A.; Hassan, A.E.; Abraham, M.G.; Ortega-Gutierrez, S.; Kasner, S.E.; Hussain, M.S.; Chen, M.; Blackburn, S.; Sitton, C.W.; Churilov, L.; et al. Trial of endovascular thrombectomy for large ischemic strokes. N. Engl. J. Med. 2023, 388, 1259–1271. [Google Scholar] [CrossRef] [Scilit] [PubMed]
  12. Devanth, L.; Janzen, I.; Lam, S.; Yuan, R.; MacAulay, C. Predicting future lung cancer risk in low-dose CT screening patients with AI tools. In SPIE Medical Imaging 2018: Computer-Aided Diagnosis; SPIE: Bellingham, WA, USA, 2025. [Google Scholar] [CrossRef] [Scilit]
  13. Haug, C.J.; Drazen, J.M. Artificial Intelligence and Machine Learning in Clinical Medicine, 2023. N. Engl. J. Med. 2023, 388, 1201–1208. [Google Scholar] [CrossRef] [Scilit] [PubMed]
  14. Heo, J.; Yoon, J.G.; Park, H.; Kim, Y.D.; Nam, H.S.; Heo, J.H. Machine learning–based model for prediction of outcomes in acute stroke. Stroke 2019, 50, 1263–1265. [Google Scholar] [CrossRef] [Scilit] [PubMed]
  15. Lee, J.; Park, K.M.; Park, S. Interpretable machine learning for prediction of clinical outcomes in acute ischemic stroke. Front. Neurol. 2023, 14, 1234046. [Google Scholar] [CrossRef] [Scilit] [PubMed]
  16. Wang, K.; Gu, L.; Liu, W.; Xu, C.; Yin, C.; Liu, H.; Rong, L.; Li, W.; Wei, X. The predictors of death within 1 year in acute ischemic stroke patients based on machine learning. Front. Neurol. 2023, 14, 1092534. [Google Scholar] [CrossRef] [Scilit] [PubMed]
  17. Otieno, J.A.; Häggström, J.; Darehed, D.; Eriksson, M. Developing machine learning models to predict multiclass functional outcomes and death three months after stroke in Sweden. PLoS ONE 2024, 19, e0303287. [Google Scholar] [CrossRef] [Scilit] [PubMed]
  18. Matsukawa, H.; Elawady, S.S.; Cunningham, C.; Sowlat, M.-M.; Uchida, K.; Maier, I.; Al Kasab, S.; Jabbour, P.; Kim, J.-T.; Quintero, S.C.; et al. Development and validation of a prediction model for outcome in mechanical thrombectomy for large-vessel occlusion anterior circulation stroke with low aspects. Stroke 2024, 55, AWP205. [Google Scholar] [CrossRef] [Scilit]
  19. Mutke, M.A.; Madai, V.I.; Hilbert, A.; Zihni, E.; Potreck, A.; Weyland, C.S.; Möhlenbruch, M.A.; Heiland, S.; Ringleb, P.A.; Nagel, S.; et al. Comparing poor and favorable outcome prediction with machine learning after mechanical thrombectomy in acute ischemic stroke. Front. Neurol. 2022, 13, 737667. [Google Scholar] [CrossRef] [Scilit] [PubMed]
  20. Reyes, M.; Meier, R.; Pereira, S.; Silva, C.A.; Dahlweid, F.-M.; Tengg-Kobligk, H.V.; Summers, R.M.; Wiest, R. On the interpretability of artificial intelligence in radiology: Challenges and opportunities. Radiol. Artif. Intell. 2020, 2, e190043. [Google Scholar] [CrossRef] [Scilit] [PubMed]
  21. Collins, G.S.; Reitsma, J.B.; Altman, D.G.; Moons, K.G. Transparent reporting of a multivariable prediction model for individual prognosis or diagnosis (TRIPOD): The TRIPOD Statement. Eur. J. Clin. Investig. 2015, 45, 204–214. [Google Scholar] [CrossRef] [Scilit] [PubMed]
  22. Riley, R.D.; Ensor, J.; Snell, K.I.; Harrell, F.E.; Martin, G.P.; Reitsma, J.B.; Moons, K.G.M.; Collins, G.; van Smeden, M. Calculating the sample size required for developing a clinical prediction model. BMJ 2020, 368, m441. [Google Scholar] [CrossRef] [Scilit] [PubMed]
  23. Riley, R.D.; Debray, T.P.A.; Collins, G.S.; Archer, L.; Ensor, J.; Van Smeden, M.; Snell, K.I.E. Minimum sample size for external validation of a clinical prediction model with a binary outcome. Stat. Med. 2021, 40, 4230–4251. [Google Scholar] [CrossRef] [Scilit] [PubMed]
  24. Stekhoven, D.J.; Bühlmann, P. MissForest—Non-parametric missing value imputation for mixed-type data. Bioinformatics 2012, 28, 112–118. [Google Scholar] [CrossRef] [Scilit] [PubMed]
  25. Compagne, K.C.; Kappelhof, M.; Hinsenveld, W.H.; Brouwer, J.; Goldhoorn, R.-J.B.; Uyttenboogaart, M.; Bokkers, R.P.; Schonewille, W.J.; Martens, J.M.; Hofmeijer, J.; et al. Improvements in endovascular treatment for acute ischemic stroke: A longitudinal study in the mr clean registry. Stroke 2022, 53, 1863–1872. [Google Scholar] [CrossRef] [Scilit] [PubMed]
  26. Sluis, W.M.; Hinsenveld, W.H.; Goldhoorn, R.-J.B.; Potters, L.H.; Bruggeman, A.A.; van der Hoorn, A.; Bot, J.C.; van Oostenbrugge, R.J.; Lingsma, H.F.; Hofmeijer, J.; et al. Timing and causes of death after endovascular thrombectomy in patients with acute ischemic stroke. Eur. Stroke J. 2023, 8, 215–223. [Google Scholar] [CrossRef] [Scilit] [PubMed]
  27. Bres-Bullrich, M.; Fridman, S.; Sposato, L.A. Relative effect of stroke severity and age on outcomes of mechanical thrombectomy in acute ischemic stroke. Stroke 2021, 52, 2846–2848. [Google Scholar] [CrossRef] [Scilit] [PubMed]
  28. Imeh-Nathaniel, E.; Imeh-Nathaniel, S.; Imeh-Nathaniel, A.; Coker-Ayo, O.; Kulkarni, N.; Nathaniel, T.I. Sex differences in severity and risk factors for ischemic stroke in patients with hyperlipidemia. Neurosci. Insights 2024, 19, 26331055241246745. [Google Scholar] [CrossRef] [Scilit] [PubMed]
  29. Xu, Y.; Liu, C.; Li, W.; Nie, X.; Huang, S.; Li, X.; Wu, Y.; Jin, W.-S.; Jiang, J.; Dong, J.; et al. Efficacy and safety of early anticoagulation after endovascular treatment in patients with atrial fibrillation. Stroke Vasc. Neurol. 2023, 8, 405–412. [Google Scholar] [CrossRef] [Scilit] [PubMed]
  30. M’barek, L.; Jin, A.; Pan, Y.; Lin, J.; Jiang, Y.; Meng, X.; Wang, Y. Stroke prognosis: The impact of combined thrombotic, lipid, and inflammatory markers. J. Atheroscler. Thromb. 2025, 32, 458–473. [Google Scholar] [CrossRef] [Scilit] [PubMed]
  31. Li, S.; Zhang, Y.; Zhang, X.; Zhang, G.; Han, N.; Ma, H.; Ge, H.; Zhao, Y.; Zhang, L.; Wang, Y.; et al. The functional prognosis of rescue conscious sedation during mechanical thrombectomy on patients with acute anterior circulation ischemic stroke: A single-center retrospective study. Neurol. Ther. 2023, 12, 1777–1789. [Google Scholar] [CrossRef] [Scilit] [PubMed]
  32. Mori, T.; Yoshioka, K.; Miyazaki, Y. Pre-stroke statin use is associated with mild neurological symptoms at the onset of acute ischemic stroke. J. Cardiovasc. Dev. Dis. 2022, 9, 396. [Google Scholar] [CrossRef] [Scilit] [PubMed]
  33. Souza, K.A.; Varella, A.C.; Olmos, R.D.; Romagnolli, C.; Gooden, T.E.; Thomas, G.N.; Lip, G.Y.; Santos, I.S.; A Lotufo, P.; Benseñor, I.M.; et al. Cardiovascular medications and long-term mortality among stroke survivors in the brazilian study of stroke mortality and morbidity (emma). Geriatr. Gerontol. Int. 2022, 22, 715–722. [Google Scholar] [CrossRef] [Scilit] [PubMed]
  34. Oldgren, J.; Åsberg, S.; Hijazi, Z.; Wester, P.; Bertilsson, M.; Norrving, B.; for the National TIMING Collaborators. Early versus delayed non–vitamin k antagonist oral anticoagulant therapy after acute ischemic stroke in atrial fibrillation (timing): A registry-based randomized controlled noninferiority study. Circulation 2022, 146, 1056–1066. [Google Scholar] [CrossRef] [Scilit] [PubMed]
  35. Fischer, U.; Koga, M.; Strbian, D.; Branca, M.; Abend, S.; Trelle, S.; Paciaroni, M.; Thomalla, G.; Michel, P.; Nedeltchev, K.; et al. Early versus later anticoagulation for stroke with atrial fibrillation. N. Engl. J. Med. 2023, 388, 2411–2421. [Google Scholar] [CrossRef] [Scilit] [PubMed]
  36. Nijboer, T.; van de Port, I.; Schepers, V.; Post, M.; Visser-Meily, A. Predicting functional outcome after stroke: The influence of neglect on basic activities in daily living. Front. Hum. Neurosci. 2013, 7, 182. [Google Scholar] [CrossRef] [Scilit] [PubMed]
  37. Alkadri, S.; Ledwos, N.; Mirchi, N.; Reich, A.; Yilmaz, R.; Driscoll, M.; Del Maestro, R.F. Utilizing a multilayer perceptron artificial neural network to assess a virtual reality surgical procedure. Comput. Biol. Med. 2021, 136, 104770. [Google Scholar] [CrossRef] [Scilit] [PubMed]
  38. Dusko, G.N. Assessing the performance of risk prediction models. Eur. J. Cardio-Thorac. 2020, 58, 401. [Google Scholar] [CrossRef] [Scilit] [PubMed]
  39. Li, L.; Lv, J.; Han, J.J.; Gao, Y.; Yan, Z.X.; Wu, Q.; Zhang, X.-L.; Gao, F. Nomogram model of functional outcome for endovascular treatment in patients with acute basilar artery occlusion. Front. Neurol. 2023, 14, 1277189. [Google Scholar] [CrossRef] [Scilit] [PubMed]
  40. Tong, L.; Sun, Y.; Zhu, Y.; Luo, H.; Wan, W.; Wu, Y. Prognostic estimation for acute ischemic stroke patients undergoing mechanical thrombectomy within an extended therapeutic window using an interpretable machine learning model. Front. Neuroinform. 2023, 17, 1273827. [Google Scholar] [CrossRef] [Scilit] [PubMed]
  41. Harrell, F.E., Jr. Regression Modeling Strategies: With Applications to Linear Models, Logistic Regression, and Survival Analysis, 2nd ed.; Springer: Cham, Switzerland, 2015. [Google Scholar] [CrossRef] [Scilit]
  42. Deo, R.C. Machine Learning in Medicine. Circulation 2015, 132, 1920–1930. [Google Scholar] [CrossRef] [Scilit] [PubMed]
  43. Alabi, R.O.; Almangush, A.; Elmusrati, M.; Leivo, I.; Mäkitie, A.A. An interpretable machine learning prognostic system for risk stratification in oropharyngeal cancer. Int. J. Med. Inform. 2022, 168, 104896. [Google Scholar] [CrossRef] [Scilit] [PubMed]
  44. Yoshie, T.; Yoshimura, S.; Wada, S.; Sakuraba, M.; Suzuki, T.; Yoko, S.; Miwa, K.; Miyamoto, Y.; Toyoda, K.; Koga, M. Abstract wp203: Prediction of outcome after endovascular therapy for acute ischemic stroke: A machine learning approach from Japan stroke data bank. Stroke 2024, 55, AWP203. [Google Scholar] [CrossRef] [Scilit]
Figure 1. Workflow diagram for this study.
Jcm 15 04702 g001
Figure 2. Missing pattern and proportion.
Jcm 15 04702 g002
Figure 3. LASSO regression variable screening: (A) selection process of parameter λ; (B) dynamic process of λ with variables.
Jcm 15 04702 g003
Figure 4. Modeling cohort model performance evaluation diagram: (A) ROC curves for individual models in the modeling cohort; (B) calibration curves for individual models in the modeling cohort; (C) DCA curves for individual models of the modeling cohort.
Jcm 15 04702 g004aJcm 15 04702 g004b
Figure 5. Validation cohort model performance evaluation diagram: (A) ROC curves for individual models in the validation cohort; (B) calibration curvesfor individual models in the validation cohort; (C) DCA curves for individual models of the validation cohort.
Jcm 15 04702 g005aJcm 15 04702 g005b
Figure 6. Distribution and ranking of feature SHAP values: (A) distribution of feature SHAP values; (B) distribution of feature importance. Note: (1) Positions on the vertical axis in Figure (A) are determined by the clinical features ranked in order of importance, and positions on the horizontal axis are determined by the SHAP values; (2) Each sample in Figure (A) is represented by a dot, the greater the dispersion of the dots is, the more pronounced the effect of the feature, and the color indicates the height of the feature value (high in red, low in blue); (3) Figure (B) shows a conventional bar chart in which each row corresponds to a characteristic, and a higher SHAP value indicates a higher risk of death.
Jcm 15 04702 g006
Figure 7. SHAP feature dependency graph. Note: In (AE) the x-axis value of 0 means ‘no’ and 1 means ‘yes’, in (FH) the x-axis is the actual value of the feature, and the y-axis on the left side is the value of the shape of each feature, and on the right side is the value of the second feature corresponding to the interaction of the feature being plotted.
Jcm 15 04702 g007
Table 1. Baseline clinical characteristics of patients in the modeling cohort [M * (IQR, 25, 75), n (%)].
VariablesSurvivor Group
(n = 441)
Death Group
(n = 152)
U /x2 ‡/Fisher §p
Age70 (58, 78)76.5 (67.25, 82)5.356<0.001
Gender 4.1850.041
Female187 (42.4%)79 (52%)
Male254 (57.6%)73 (48%)
Ethnicity Fisher0.963
Han Chinese433 (98.2%)150 (98.7%)
Other minorities8 (1.8)2 (1.3%)
BMI (kg/m2)23.44 (21.48, 25.66)22.99 (20.55, 25.39)−1.7870.074
Educational background 12.4080.053
Illiteracy31 (7.0%)21 (13.8%)
Primary school134 (30.4%)56 (36.8%)
Junior middle school111 (25.2%)34 (22.4%)
High school48 (10.9%)15 (9.9%)
Vocational secondary school33 (7.5%)9 (5.9%)
Junior college32 (7.2%)6 (3.9%)
Undergraduate or above52 (11.8%)11 (7.3%)
Smoking history 0.2320.63
No316 (71.7%)112 (73.7%)
Yes125 (28.3%)40 (26.3%)
Drinking history 0.0330.855
No311 (70.5%)106 (69.7%)
Yes130 (29.5%)46 (30.3%)
History of stroke 2.1190.146
No406 (92.1%)134 (88.2%)
Yes35 (7.9%)18 (11.8%)
TIA Fisher0.972
No436 (98.9%)151 (99.3%)
Yes5 (1.1%)1 (0.7%)
Hypertension 0.0870.768
No171 (38.8%)61 (40.1%)
Yes270 (61.2%)91 (59.9%)
Diabetes 0.4840.487
No336 (76.2%)120 (78.9%)
Yes105 (23.8%)32 (21.1%)
Hyperlipemia 17.069<0.001
No379 (85.9%)108 (71.1%)
Yes62 (14.1%)44 (28.9%)
Atrial fibrillation and other cardiac diseases 73.435<0.001
No298 (67.6%)58 (38.2%)
Yes143 (32.4%)94 (61.8%)
Atherosclerosis 3.7220.054
No360 (81.6%)113 (74.3%)
Yes81 (18.4%)39 (25.7%)
Temperature36.5 (36.3, 36.6)36.5 (36.3, 36.6)0.1830.855
Pulse78 (68, 87)79 (72, 90)1.7670.077
Respiration19 (14, 20)18 (14, 20)−1.7410.082
Systolic pressure134 (118, 150)134 (117, 153)0.2160.829
Diastolic pressure76 (68, 87)76 (66, 87)−1.1270.26
TOAST typology 2.1750.717
Atherosclerotic sclerotic type240 (54.4%)79 (52%)
Cardioembolic type131 (29.7%)53 (34.8%)
Arteriole occlusion type5 (1.1%)1 (0.7%)
Other etiology-identified type18 (4.1%)7 (4.6%)
Unknown cause type47 (10.7%)12 (7.9%)
Vascular occlusion site 2.0000.368
ICA137 (31.1%)49 (32.2%)
MCA228 (51.7%)70 (46.1%)
BA + VA76 (17.2%)33 (21.7%)
NIHSS score 25.93<0.001
Mild < 4 points20 (4.5%)1 (0.7%)
Moderate < 16 points266 (60.3%)68 (44.7%)
Severe < 25 points121 (27.5%)54 (35.5%)
Very severe ≥ 25 points34 (7.7%)29 (19.1%)
mRS score 6.4660.249
Level 010 (2.3%)0 (0%)
Level 15 (1.1%)3 (2%)
Level 215 (3.4%)4 (2.6%)
Level 317 (3.9%)4 (2.6%)
Level 4114 (25.8%)33 (21.7%)
Level 5280 (63.5%)108 (71.1%)
ADL score20 (0, 50)0 (0, 10)−9.188<0.001
Admission dysphagia 76.893<0.001
No211 (47.8%)12 (7.9%)
Yes230 (52.2%)140 (92.1%)
Pre-stroke statin use 28.361<0.001
No117 (26.5%)76 (50%)
Yes324 (73.5%)76 (50%)
Pre-stroke anticoagulants use 15.157<0.001
No275 (62.4%)121 (79.6%)
Yes166 (37.6%)31 (20.4%)
Pre-stroke antiplatelet use 28.939<0.001
No86 (19.5%)63 (41.4%)
Yes355 (80.5%)89 (58.6%)
Antiplatelet/anticoagulant therapy within 48 h 47.73<0.001
No63 (14.3%)62 (40.8%)
Yes378 (85.7%)90 (59.2%)
Bridging treatment 1.2740.259
No369 (83.7%)133 (87.5%)
Yes72 (16.3%)19 (12.5%)
Methods of thrombectomy 6.0160.049
Aspiration thrombectomy186 (42.2%)47 (30.9%)
Stent retriever thrombectomy132 (29.9%)55 (36.2%)
Aspiration thrombectomy + Stent retriever thrombectomy123 (27.9%)50 (32.9%)
Number of thrombus pulls 15.954<0.001
1 time242 (54.9%)58 (38.2%)
2–3 times154 (34.9%)64 (42.1%)
>3 times45 (10.2%)30 (19.7%)
Anesthesia methods 0.4280.513
Local anesthetic83 (18.8%)25 (16.4%)
General anesthetic358 (81.2%)127 (83.6%)
Anesthesia grading 23.242<0.001
Level 221 (4.8%)3 (2%)
Level 3361 (81.8%)103 (67.7%)
Level 459 (13.4%)46 (30.3%)
OPT310 (240, 471)306.5 (234.3, 430)−0.660.509
PNT60 (40, 90)71 (44, 108)2.5280.011
Endotracheal Intubation 1.5810.209
No87 (19.7%)23 (15.1%)
Yes354 (80.3%)129 (84.9%)
Balloon dilation/stenting 4.5710.033
No328 (74.4%)126 (82.9%)
Yes113 (25.6%)26 (17.1%)
Albumin40.2 (37.8, 42.7)39.2 (36.7, 42)−2.3410.019
Lymphocyte count (109/L)1.1 (0.83, 1.6)0.88 (0.6, 1.43)−3.871<0.001
CRP (mg/L)10.99 (8.11, 22.15)18.53 (8.18, 44.26)3.339<0.001
Total cholesterol (mmol/L)4.08 (3.4, 4.78)4.14 (3.51, 4.76)0.5790.563
Monocyte count (109/L)0.53 (0.39, 0.71)0.54 (0.37, 0.78)0.4380.661
Neutrophil count (109/L)6.89 (4.76, 9.45)7.31 (4.86, 10.96)1.7890.074
Platelet count (109/L)169 (136, 211)163 (126, 214)−0.8850.376
Uric acid (umol/L)309 (242, 381)337 (238, 401)1.4350.151
D-dimer (mg/L FEU)1.38 (0.62, 2.44)2.54 (1.37, 8.45)6.667<0.001
Fibrinogen (g/L)2.76 (2.29, 3.25)2.85 (2.28, 3.59)0.9640.335
Triglycerides (mmol/L)1.16 (0.85, 1.76)1.13 (0.82, 1.56)−0.5370.591
Low-density lipoprotein cholesterol (mmol/L)2.4 (1.79, 3)2.36 (1.95, 2.97)0.2610.794
High-density lipoprotein cholesterol (mmol/L)1.19 (0.98, 1.44)1.25 (1.06, 1.48)1.4710.141
*: M, median. : U, Mann-Whitney U test. : x2, chi-square test. §: Fisher, Fisher’s exact test. Abbreviations: (1) IQR, interquartile range; (2) BMI, body mass index; (3) TIA, transient ischemic attack; (4) ICA, internal carotid artery; (5) MCA, middle cerebral artery; (6) BA, basilar artery; (7) VA, vertebral artery.
Table 2. Comparison of baseline information between the modeling and validation cohorts [M * (IQR 25, 75), n (%)].
VariablesModeling Cohort
(n = 593)
Validation Cohort
(n = 247)
U /x2 ‡p
Age71 (59.5, 79)69 (59, 79)−0.4860.627
Gender 2.0030.157
Female266 (44.9%)124 (50.2%)
Male327 (55.1%)123 (49.8%)
Ethnicity 1.2340.267
Han Chinese583 (98.3%)236 (95.5%)
Other minorities10 (1.7%)7 (2.8%)
BMI (kg/m2)23.44 (21.39, 25.59)23.81 (21.97, 25.69)1.1880.235
Educational background 7.4290.283
Illiteracy52 (8.8%)29 (11.7%)
Primary school190 (32.0%)69 (27.9%)
Junior middle school145 (24.5%)62 (25.2%)
High school63 (10.6%)27 (10.9%)
Vocational secondary school42 (7.1%)16 (6.5%)
Junior college38 (6.4%)25 (10.1%)
Undergraduate or above63 (10.6%)19 (7.7%)
Smoking history 0.2540.614
No428 (72.2%)180 (72.9%)
Yes165 (27.8%)67 (27.1%)
Drinking history 0.3910.532
No417 (70.3%)179 (72.5%)
Yes176 (29.7%)68 (27.5%)
History of stroke 0.8040.370
No540 (91.1%)220 (89.1%)
Yes53 (8.9%)27 (10.9%)
TIA 0.5470.459
No587 (99%)243 (98.4%)
Yes6 (1%)4 (1.6%)
Hypertension 0.1350.713
No232 (39.1%)100 (40.5%)
Yes361 (60.9%)147 (59.5%)
Diabetes 0.2460.620
No456 (76.9%)186 (75.3%)
Yes137 (23.1%)61 (24.7%)
Hyperlipemia 0.1970.657
No487 (82.1%)206 (83.4%)
Yes106 (17.9%)41 (16.6%)
Atrial fibrillation and other cardiac diseases 2.3990.121
No356 (60.0%)134 (54.3%)
Yes237 (40.0%)113 (45.7%)
Atherosclerosis 0.8460.358
No473 (79.8%)190 (76.9%)
Yes120 (20.2%)57 (23.1%)
Temperature37 (36, 37)37 (36, 37)0.3600.719
Pulse78 (69, 88)78 (70, 89)1.0020.317
Respiration19 (14, 20)19 (14, 20)−0.1680.867
Systolic pressure134 (118, 151)132 (117, 150)−0.0110.991
Diastolic pressure76 (67, 87)76 (67, 87)−0.2960.768
TOAST typology 1.0450.903
Atherosclerotic sclerotic type319 (53.8%)140 (56.7%)
Cardioembolic type184 (31%)74 (30%)
Arteriole occlusion type6 (1.1%)3 (1.2%)
Other etiology-identified type25 (4.2%)10 (4%)
Unknown cause type59 (9.9%)20 (8.1%)
Vascular occlusion site 0.7440.689
ICA186 (31.4%)85 (34.4%)
MCA298 (50.3%)119 (48.2%)
BA + VA109 (18.3%)43 (17.4%)
NIHSS score 4.7020.195
Mild < 4 points21 (3.6%)16 (6.4%)
Moderate < 16 points334 (56.3%)135 (54.7%)
Severe < 25 points175 (29.5%)65 (26.3%)
Very severe ≥ 25 points63 (10.6%)31 (12.6%)
MRS score 8.6940.122
Level 010 (1.7%)6 (2.4%)
Level 18 (1.3%)6 (2.4%)
Level 219 (3.2%)11 (4.5%)
Level 321 (3.6%)17 (6.9%)
Level 4147 (24.8%)65 (26.3%)
Level 5388 (65.4%)142 (57.5%)
ADL score10 (0, 35)0 (0, 20)−5.916<0.001
Admission dysphagia 3.5550.059
No223 (37.6%)76 (30.8%)
Yes370 (62.4%)171 (69.2%)
Pre-stroke statin use 0.5630.453
No193 (32.5%)87 (35.2%)
Yes400 (67.5%)160 (64.8%)
Pre-stroke anticoagulants use 0.8490.357
No396 (66.8%)173 (70%)
Yes197 (33.2%)74 (30%)
Pre-stroke antiplatelet use 0.5690.451
No149 (25.1%)56 (22.7%)
Yes444 (74.9%)191 (77.3%)
Antiplatelet/anticoagulant therapy within 48 h 0.0200.889
No125 (21.1%)51 (20.6%)
Yes468 (78.9%)196 (79.4%)
Bridging treatment 0.5460.460
No502 (84.7%)214 (86.6%)
Yes91 (15.3%)33 (13.4%)
Methods of thrombectomy 0.6040.739
Aspiration thrombectomy233 (39.3%)90 (36.4%)
Stent retriever thrombectomy187 (31.5%)82 (33.2%)
Aspiration thrombectomy + Stent retriever thrombectomy173 (29.2%)75 (30.4%)
Number of thrombus pulls 0.6040.739
1 time300 (50.6%)135 (54.6%)
2–3 times218 (36.8%)100 (40.5%)
>3 times75 (12.6%)12 (4.9%)
Anesthesia methods 1.1850.276
Local anesthetic108 (18.2%)53 (21.5%)
General anesthetic485 (81.8%)194 (78.5%)
Anesthesia grading 3.3640.186
Level 224 (4.1%)14 (5.7%)
Level 3464 (78.2%)179 (72.5%)
Level 4105 (17.7%)54 (21.8%)
OPT310 (240, 452)294 (230, 480)−0.6630.507
PNT64 (40, 95)67 (43, 100)0.7570.449
Endotracheal Intubation 2.2440.134
No110 (18.5%)57 (23.1%)
Yes483 (81.5%)190 (76.9%)
Balloon dilation/stenting 3.7370.053
No454 (76.6%)204 (82.6%)
Yes139 (23.4%)43 (17.4%)
Albumin40.1 (37.4, 42.6)39.1 (36.3, 41.9)−3.1780.001
Lymphocyte count (109/L)1.06 (0.79, 1.54)1.06 (0.69, 1.44)−1.4430.149
CRP (mg/L)11.6 (8.11, 28.45)10.13 (6.16, 21.9)−2.6520.008
Total cholesterol (mmol/L)4.08 (3.46, 4.78)3.96 (3.38, 4.7)−1.0980.272
Monocyte count (109/L)0.53 (0.38, 0.72)0.58 (0.4, 0.76)2.1110.035
Neutrophil count (109/L)7.01 (4.77, 9.62)7.57 (5.66, 10.45)2.5340.011
Platelet count (109/L)168 (134, 211.5)169 (126, 216)−0.1370.891
Uric acid (umol/L)313 (242, 384)302 (235, 382)−1.0250.305
D-dimer (mg/L FEU)1.38 (0.71, 3.4)1.71 (0.92, 4.48)3.0090.003
Fibrinogen (g/L)2.79 (2.29, 3.32)2.73 (2.3, 3.33)−0.4900.624
Triglycerides (mmol/L)1.15 (0.85, 1.71)1.15 (0.82, 1.64)−0.4540.650
Low-density lipoprotein cholesterol (mmol/L)2.39 (1.83, 2.99)2.4 (1.8, 2.94)−0.2660.790
High-density lipoprotein cholesterol (mmol/L)1.2 (1, 1.46)1.2 (1.01, 1.47)−0.1530.878
*: M, median. : U, Mann-Whitney U test. : x2, chi-square test. Abbreviations: (1) IQR, interquartile range; (2) BMI, body mass index; (3) TIA, transient ischemic attack; (4) ICA, internal carotid artery; (5) MCA, middle cerebral artery; (6) BA, basilar artery; (7) VA, vertebral artery.
Table 3. Individual model evaluation indicators for the modeling cohort.
ModelsOptimal ThresholdAUCSensitivitySpecificityAccuracyF1 ScoreCalibration SlopeCalibration InterceptBrier Score
LR0.2500.870.8360.7640.7830.6630.9590.0110.124
SVM0.2890.850.7370.8160.7960.6490.9780.0190.128
RF0.2520.860.8420.7170.7490.6321.345−0.0900.130
LightGBM0.2690.860.7760.7730.7740.6381.088−0.0290.128
KNN0.2360.790.7630.6780.6990.5660.8770.0440.152
MLP0.3280.850.7500.8280.8080.6670.9140.0150.125
XGBoost0.2380.860.7960.7510.7620.6321.105−0.0380.127
Naive Bayes0.2500.860.8410.7460.7710.6530.6180.0610.147
Table 4. Individual model evaluation indicators for the validation cohort.
ModelsOptimal ThresholdAUCSensitivitySpecificityAccuracyF1 ScoreCalibration SlopeCalibration InterceptBrier Score
LR0.2220.760.8990.5420.6560.6260.5490.1560.155
SVM0.2490.740.7720.6250.6720.6011.171−0.0310.167
RF0.2560.760.8730.5300.6400.6081.298−0.0840.152
LightGBM0.1880.760.9110.5000.6320.6131.128−0.0630.159
KNN0.1880.600.7980.4170.5390.5250.8670.0970.210
MLP0.2830.770.7980.6490.6960.6270.8710.0470.153
XGBoost0.2940.740.7600.6730.7000.6191.079−0.0220.151
Naive Bayes0.3970.760.7850.6960.7250.6460.5820.1750.184
Disclaimer/Publisher’s Note: The statements, opinions and data contained in all publications are solely those of the individual author(s) and contributor(s) and not of MDPI and/or the editor(s). MDPI and/or the editor(s) disclaim responsibility for any injury to people or property resulting from any ideas, methods, instructions or products referred to in the content.