

Gender Differences in Mouth Opening on Temporomandibular Disorder Patients—Implications for Diagnosis

 , , ,
, , ,  and
and
Abstract
1. Introduction
2. Materials and Methods
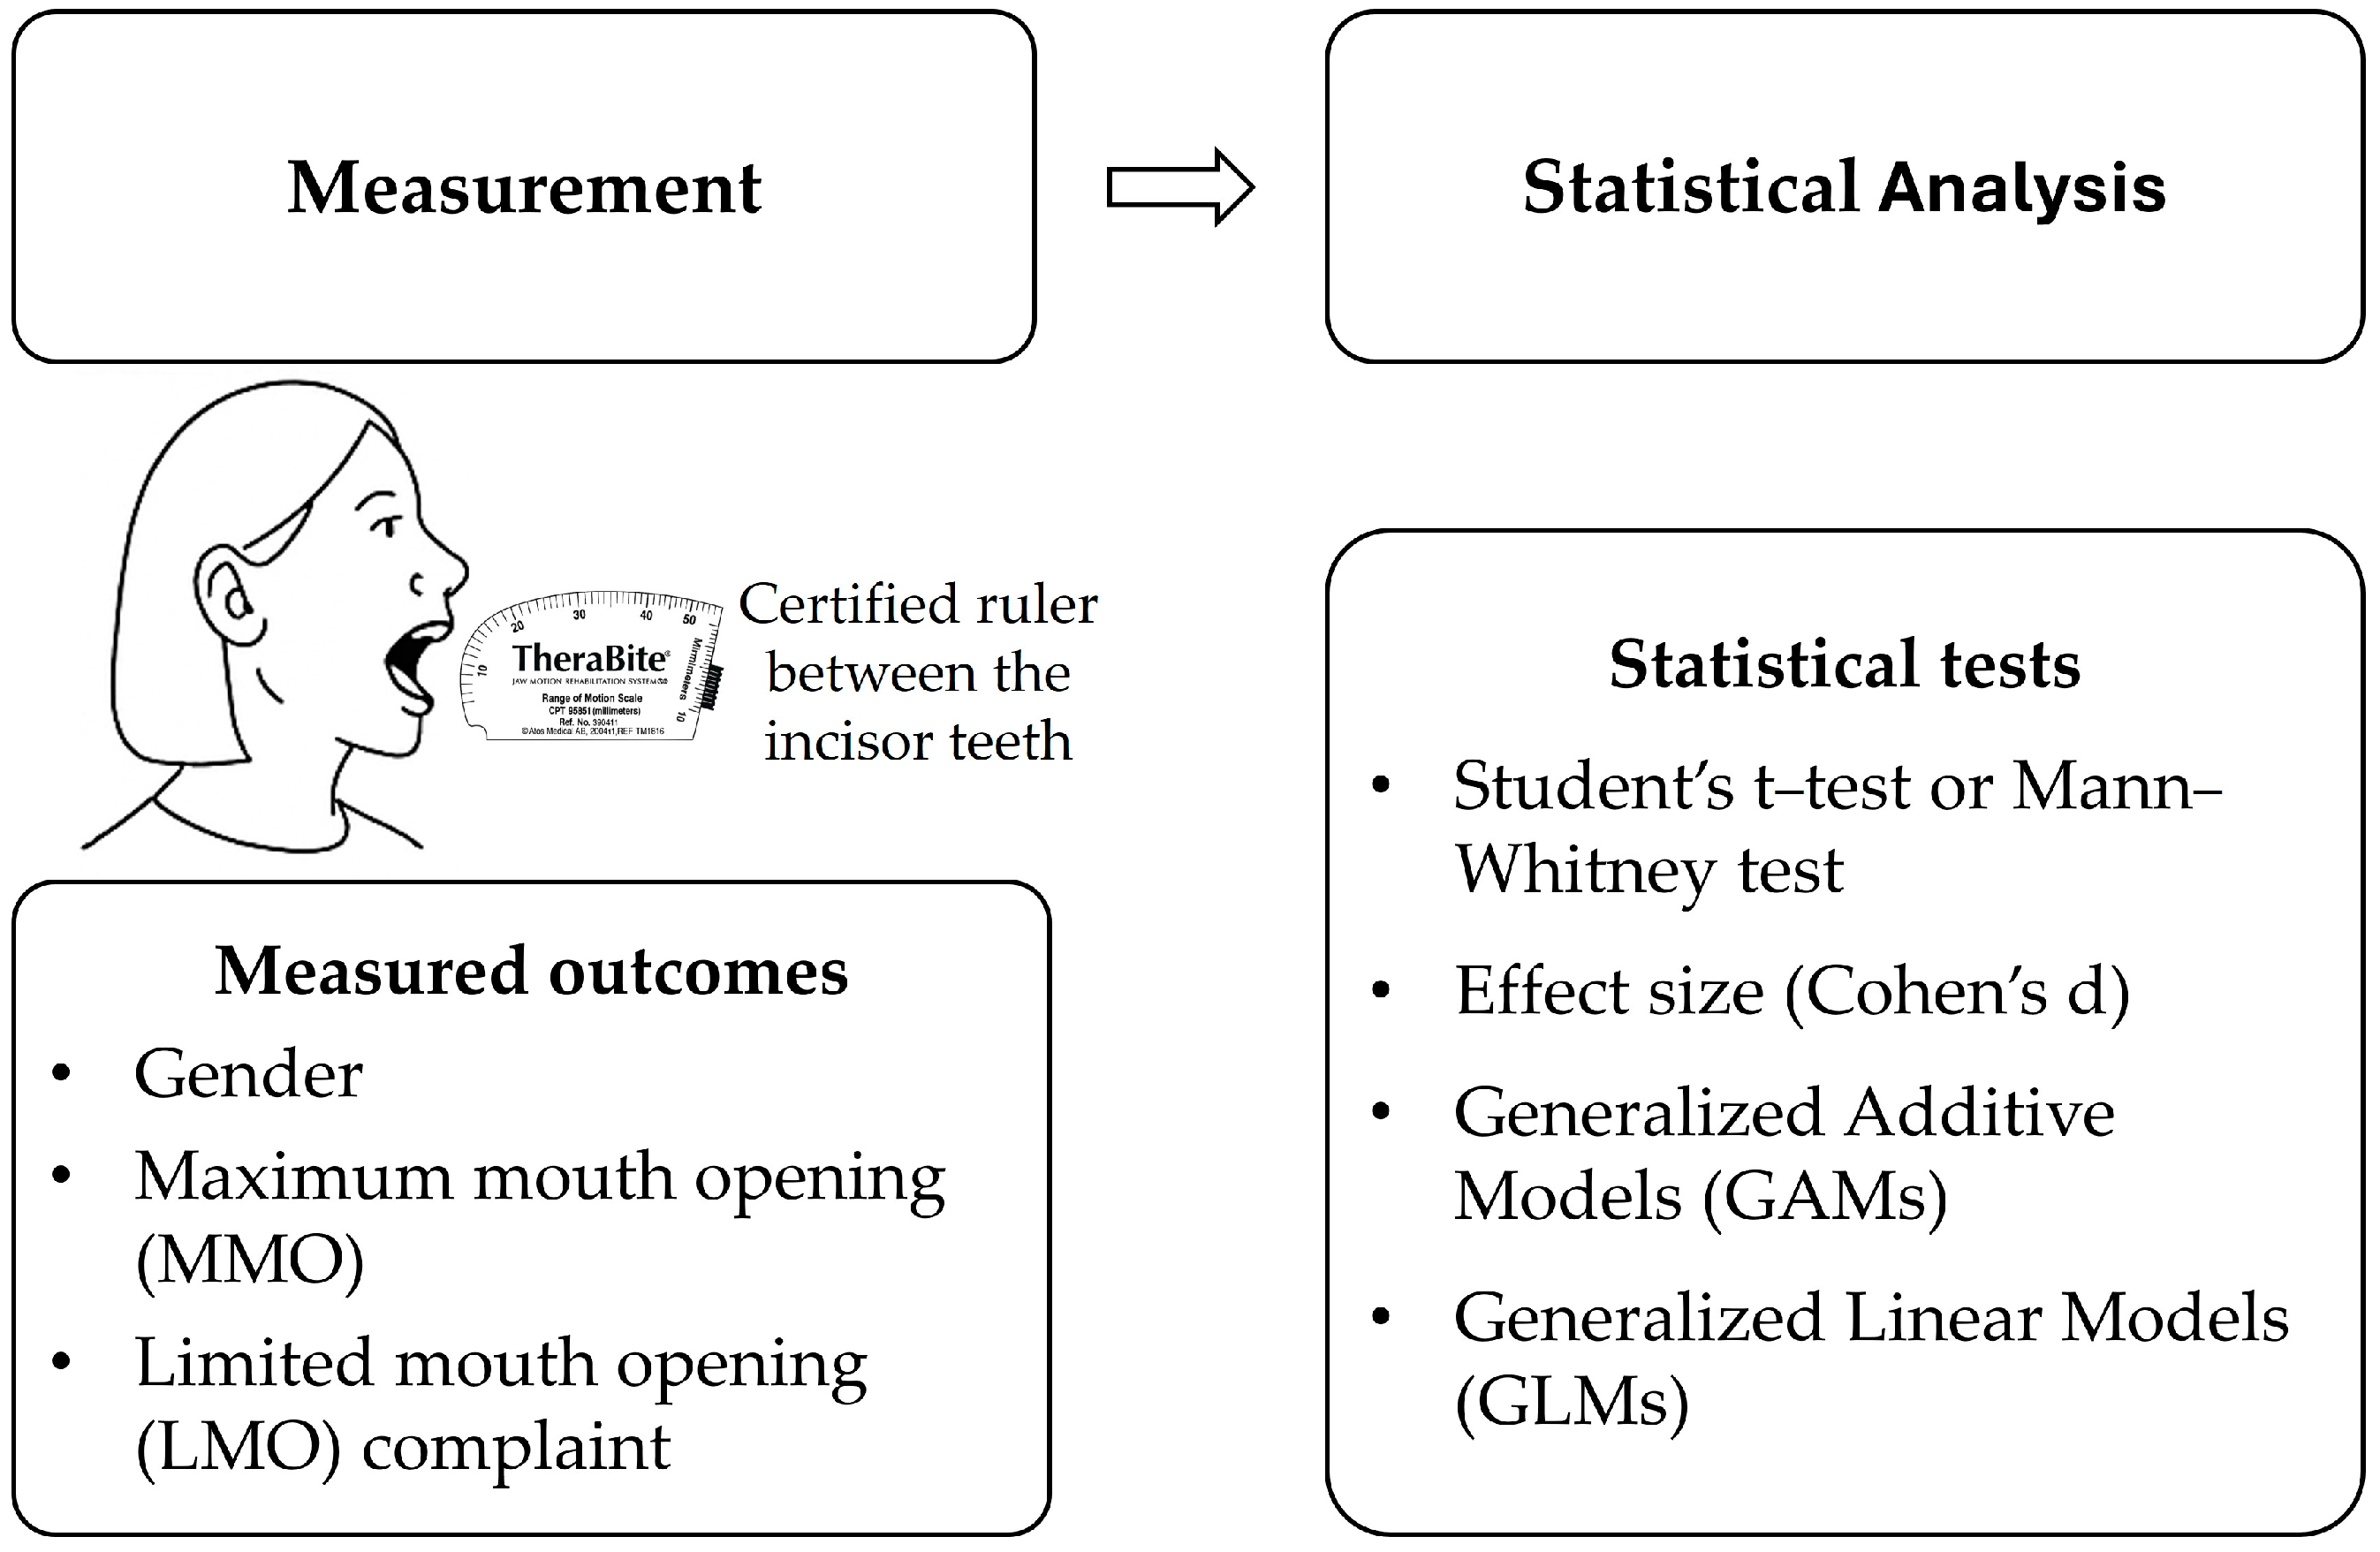
2.1. Study Design and Data Collection
2.2. Statistical Analysis
3. Results
4. Discussion
5. Conclusions
Author Contributions
Funding
Institutional Review Board Statement
Informed Consent Statement
Data Availability Statement
Conflicts of Interest
Abbreviations
References
- Ferreira, M.C.; Porto de Toledo, I.; Dutra, K.L.; Stefani, F.M.; Porporatti, A.L.; Flores-Mir, C.; De Luca Canto, G. Association between chewing dysfunctions and temporomandibular disorders: A systematic review. J. Oral. Rehabil. 2018, 45, 819–835. [Google Scholar] [CrossRef]
- Zieliński, G.; Pająk-Zielińska, B.; Ginszt, M. A Meta-Analysis of the Global Prevalence of Temporomandibular Disorders. J. Clin. Med. 2024, 13, 1365. [Google Scholar] [CrossRef]
- Müller, L.; van Waes, H.; Langerweger, C.; Molinari, L.; Saurenmann, R.K. Maximal mouth opening capacity: Percentiles for healthy children 4–17 years of age. Pediatr. Rheumatol. Online J. 2013, 11, 17. [Google Scholar] [CrossRef]
- Schiffman, E.; Ohrbach, R.; Truelove, E.; Look, J.; Anderson, G.; Goulet, J.P.; List, T.; Svensson, P.; Gonzalez, Y.; Lobbezoo, F.; et al. Diagnostic Criteria for Temporomandibular Disorders (DC/TMD) for Clinical and Research Applications. J. Oral Facial Pain Headache 2014, 28, 6–27. [Google Scholar] [CrossRef]
- Dhanrajani, P.J.; Jonaidel, O. Trismus: Aetiology, differential diagnosis and treatment. Dent. Update 2002, 29, 88–94. [Google Scholar] [CrossRef]
- Dijkstra, P.U.; Huisman, P.M.; Roodenburg, J.L. Criteria for trismus in head and neck oncology. Int. J. Oral Maxillofac. Surg. 2006, 35, 337–342. [Google Scholar] [CrossRef]
- Dinsdale, A.; Thomas, L.; Forbes, R.; Treleaven, J. Factors associated with patient-reported mouth opening activity limitations in individuals with persistent intra-articular temporomandibular disorders: A cross-sectional study exploring physical and self-reported outcomes. Musculoskelet. Sci. Pract. 2024, 73, 103166. [Google Scholar] [CrossRef]
- Marciniak, T.; Kruk-Majtyka, W.; Bobowik, P.; Marszałek, S. The Relationship between Kinesiophobia, Emotional State, Functional State and Chronic Pain in Subjects with/without Temporomandibular Disorders. J. Clin. Med. 2024, 13, 848. [Google Scholar] [CrossRef]
- Li, X.Y.; Jia, C.; Zhang, Z.C. The normal range of maximum mouth opening and its correlation with height or weight in the young adult Chinese population. J. Dent. Sci. 2017, 12, 56–59. [Google Scholar] [CrossRef]
- Greenbaum, T.; Pitance, L.; Kedem, R.; Emodi-Perlman, A. The mouth-opening muscular performance in adults with and without temporomandibular disorders: A systematic review. J. Oral. Rehabil. 2022, 49, 476–494. [Google Scholar] [CrossRef]
- Al-Dlaigan, Y.H.; Asiry, M.A. Maximum mouth opening in saudi adolescents. J. Int. Oral Health JIOH 2014, 6, 45–49. [Google Scholar] [PubMed]
- Shivananda, S.; Doddawad, V.G.; Anand, A.; Gopi, A.; Anupama, C.; Bhuyan, L. Evaluation of Normal Range of Mouth Opening Using Three-finger Index and Its Impact on Age, Gender, and Body Mass Index of an Individual. J. Head. Neck Physicians Surg. 2024, 12, 38–43. [Google Scholar] [CrossRef]
- Wetselaar, P.; Vermaire, E.J.H.; Lobbezoo, F.; Schuller, A.A. The prevalence of awake bruxism and sleep bruxism in the Dutch adult population. J. Oral. Rehabil. 2019, 46, 617–623. [Google Scholar] [CrossRef] [PubMed]
- Scheibel, J.; Schwahn, C.; Mksoud, M.; Mundt, T.; Bernhardt, O.; Kiliaridis, S.; Kocher, T.; Biffar, R.; Krüger, M.; Daboul, A. Influence of gender and bruxism on the masseter muscle: A population-based magnetic resonance imaging study. Am. J. Orthod. Dentofac. Orthop. 2025, 167, 80–88. [Google Scholar] [CrossRef]
- Zieliński, G.; Pająk, A.; Wójcicki, M. Global Prevalence of Sleep Bruxism and Awake Bruxism in Pediatric and Adult Populations: A Systematic Review and Meta-Analysis. J. Clin. Med. 2024, 13, 4259. [Google Scholar] [CrossRef]
- Fernandes, G.; Franco, A.L.; Siqueira, J.T.; Gonçalves, D.A.; Camparis, C.M. Sleep bruxism increases the risk for painful temporomandibular disorder, depression and non-specific physical symptoms. J. Oral. Rehabil. 2012, 39, 538–544. [Google Scholar] [CrossRef]
- Berger, M.; Szalewski, L.; Szkutnik, J.; Ginszt, M.; Ginszt, A. Different association between specific manifestations of bruxism and temporomandibular disorder pain. Neurol. I Neurochir. Pol. 2017, 51, 7–11. [Google Scholar] [CrossRef]
- Rodrigues, A.L.P.; Cardoso, H.J.; Ângelo, D.F. Patient experience and satisfaction with different temporomandibular joint treatments: A retrospective study. J. Cranio-Maxillo-Facial Surg. 2023, 51, 44–51. [Google Scholar] [CrossRef]
- Dos Santos, E.A.; Peinado, B.R.R.; Frazão, D.R.; Né, Y.G.S.; Fagundes, N.C.F.; Magno, M.B.; Maia, L.C.; Lima, R.R.; de Souza-Rodrigues, R.D. Association between temporomandibular disorders and anxiety: A systematic review. Front. Psychiatry 2022, 13, 990430. [Google Scholar] [CrossRef]
- Bryer, J.; Speerschneider, K. likert: Analysis and Visualization Likert Items, R package version 1.3.5; R Core Team: Vienna, Austria, 2016. [Google Scholar] [CrossRef]
- Wickham, H.; François, R.; Henry, L.; Müller, K.; Vaughan, D. dplyr: A Grammar of Data Manipulation, R package version 1.1.4; R Core Team: Vienna, Austria, 2023. [CrossRef]
- Wickham, H. Reshaping Data with the reshape Package. J. Stat. Softw. 2007, 21, 1–20. [Google Scholar] [CrossRef]
- Larmarange, J. ggstats: Extension to ‘ggplot2’ for Plotting Stats, R package version 0.9.0; R Core Team: Vienna, Austria, 2025. [Google Scholar] [CrossRef]
- Wickham, H. ggplot2: Elegant Graphics for Data Analysis; Springer: New York, NY, USA, 2016; Available online: https://ggplot2.tidyverse.org (accessed on 4 May 2025).
- Schloerke, B.; Cook, D.; Larmarange, J.; Briatte, F.; Marbach, M.; Thoen, E.; Elberg, A.; Crowley, J. GGally: Extension to ‘ggplot2’, R package version 2.2.1; R Core Team: Vienna, Austria, 2024. [Google Scholar] [CrossRef]
- Kuhn, M. Building Predictive Models in R Using the caret Package. J. Stat. Softw. 2008, 28, 1–26. [Google Scholar] [CrossRef]
- Fox, J.; Weisberg, S. (Eds.) An R Companion to Applied Regression, 3rd ed.; SAGE: Los Angeles, CA, USA, 2019. [Google Scholar]
- Therneau, T.; Atkinson, B. rpart: Recursive Partitioning and Regression Trees, R package version 4.1.23; R Core Team: Vienna, Austria, 2023. [Google Scholar] [CrossRef]
- Liaw, A.; Wiener, M. Classification and regression by randomForest. R. News 2002, 2, 18–22. [Google Scholar]
- Robin, X.; Turck, N.; Hainard, A.; Tiberti, N.; Lisacek, F.; Sanchez, J.-C.; Müller, M. pROC: An open-source package for R and S+ to analyze and compare ROC curves. BMC Bioinform. 2011, 12, 77. [Google Scholar] [CrossRef]
- Grosjean, P.; Ibanez, F. pastecs: Package for Analysis of Space-Time Ecological Series, R package version 1.4.2; R Core Team: Vienna, Austria, 2024. [Google Scholar] [CrossRef]
- R Core Team. A Language and Environment for Statistical Computing; R Foundation for Statistical Computing: Vienna, Austria, 2024. [Google Scholar]
- Milborrow, S. rpart.plot: Plot ‘rpart’ Models: An Enhanced Version of ‘plot.rpart’, R package version 3.1.2; R Core Team: Vienna, Austria, 2024. [Google Scholar] [CrossRef]
- Zieliński, G.; Gawda, P. Defining Effect Size Standards in Temporomandibular Joint and Masticatory Muscle Research. Med. Sci. Monit. Int. Med. J. Exp. Clin. Res. 2025, 31, e948365. [Google Scholar] [CrossRef] [PubMed]
- Shu, J.; Ma, H.; Liu, Y.; Zheng, T.; Shao, B.; Liu, Z. In vivo biomechanical effects of maximal mouth opening on the temporomandibular joints and their relationship to morphology and kinematics. J. Biomech. 2022, 141, 111175. [Google Scholar] [CrossRef]
- Toneva, D.H.; Nikolova, S.Y.; Fileva, N.F.; Zlatareva, D.K. Size and shape of human mandible: Sex differences and influence of age on sex estimation accuracy. Leg. Med. 2023, 65, 102322. [Google Scholar] [CrossRef]
- Chalazoniti, A.; Lattanzi, W.; Halazonetis, D.J. Shape variation and sex differences of the adult human mandible evaluated by geometric morphometrics. Sci. Rep. 2024, 14, 8546. [Google Scholar] [CrossRef]
- Al-Gunaid, T.H. Sex-related variation in the dimensions of the mandibular ramus and its relationship with lower third molar impaction. J. Taibah Univ. Med. Sci. 2020, 15, 298–304. [Google Scholar] [CrossRef]
- Zieliński, G.; Pająk-Zielińska, B. Association between Estrogen Levels and Temporomandibular Disorders: An Updated Systematic Review. Int. J. Mol. Sci. 2024, 25, 9867. [Google Scholar] [CrossRef]
- Fillingim, R.B.; Ohrbach, R.; Greenspan, J.D.; Knott, C.; Dubner, R.; Bair, E.; Baraian, C.; Slade, G.D.; Maixner, W. Potential psychosocial risk factors for chronic TMD: Descriptive data and empirically identified domains from the OPPERA case-control study. J. Pain 2011, 12, T46–T60. [Google Scholar] [CrossRef]
- Khan, A.; Liu, S.; Tao, F. Mechanisms Underlying Sex Differences in Temporomandibular Disorders and Their Comorbidity with Migraine. Brain Sci. 2024, 14, 707. [Google Scholar] [CrossRef] [PubMed]
- Pihut, M.E.; Kostrzewa-Janicka, J.; Orczykowska, M.; Biegańska-Banaś, J.; Gibas-Stanek, M.; Gala, A. Initial assessment of the psycho-emotional state of patients with temporomandibular disorders: A pilot study. Dent. Med. Probl. 2024, 61, 153–159. [Google Scholar] [CrossRef] [PubMed]
- Paz-Cortés, M.M.; Martín-Vacas, A.; Mendoza, P.A.; Rozalén, M.; Alvaredo, M. Analysis of the Effect of Exams on Perceived Stress and Temporomandibular Joint Status in Physiotherapy Students: A Pilot Study. Medicina 2024, 60, 952. [Google Scholar] [CrossRef]
- Mortazavi, N.; Tabatabaei, A.H.; Mohammadi, M.; Rajabi, A. Is bruxism associated with temporomandibular joint disorders? A systematic review and meta-analysis. Evid.-Based Dent. 2023, 24, 144. [Google Scholar] [CrossRef] [PubMed]
- Ciancaglini, R.; Gherlone, E.F.; Radaelli, G. The relationship of bruxism with craniofacial pain and symptoms from the masticatory system in the adult population. J. Oral. Rehabil. 2001, 28, 842–848. [Google Scholar] [CrossRef]
- Chattrattrai, T.; Janal, M.N.; Lobbezoo, F.; Raphael, K.G. The association between sleep bruxism and awake bruxism: Polysomnographic and electromyographic recordings in women with and without myofascial pain. J. Oral. Rehabil. 2023, 50, 822–829. [Google Scholar] [CrossRef]
- Smeets, M.; Croonenborghs, T.M.; Van Dessel, J.; Beckers, R.; Jacobs, R.; Willaert, R.; Bila, M. Evaluating the reproducibility and validity of maximal mouth opening measurement techniques. J. Stomatol. Oral Maxillofac. Surg. 2024, 126, 102107. [Google Scholar] [CrossRef]
- Venkatraman, A.; Kaval, F.; Takiar, V. Body Mass Index and Age Affect Maximum Mouth Opening in a Contemporary American Population. J. Oral. Maxillofac. Surg. 2020, 78, 1926–1932. [Google Scholar] [CrossRef]
- Verma, P.; Verma, K.G.; Das, A.; Najmuddin, M.; Khan, N.; Ahmed, M.M. Body Mass Index’s Role in Determining Maximum Mouth Opening Using the Three-Finger Index in People of Aligarh city, Uttar Pradesh. J. Indian. Acad. Oral. Med. Radiol. 2024, 36, 371–375. [Google Scholar] [CrossRef]
- Ângelo, D.F.; Faria-Teixeira, M.C.; Maffia, F.; Sanz, D.; Sarkis, M.; Marques, R.; Mota, B.; João, R.S.; Cardoso, H.J. Association of Malocclusion with Temporomandibular Disorders: A Cross-Sectional Study. J. Clin. Med. 2024, 13, 4909. [Google Scholar] [CrossRef]
- Fukui, T.; Tsuruta, M.; Murata, K.; Wakimoto, Y.; Tokiwa, H.; Kuwahara, Y. Correlation between facial morphology, mouth opening ability, and condylar movement during opening-closing jaw movements in female adults with normal occlusion. Eur. J. Orthod. 2002, 24, 327–336. [Google Scholar] [CrossRef] [PubMed]
- Kim, D.S.; Choi, S.C.; Lee, S.S.; Heo, M.S.; Huh, K.H.; Hwang, S.J.; Yi, W.J. Correlation between 3-dimensional facial morphology and mandibular movement during maximum mouth opening and closing. Oral. Surg. Oral Med. Oral Pathol. Oral Radiol. Endod. 2010, 110, 648–656. [Google Scholar] [CrossRef]


| Variables | N (%) or Median [P25;P75] | |
|---|---|---|
| Number of patients | 1045 | |
| Gender | Female | 836 (80%) |
| Male | 209 (20%) | |
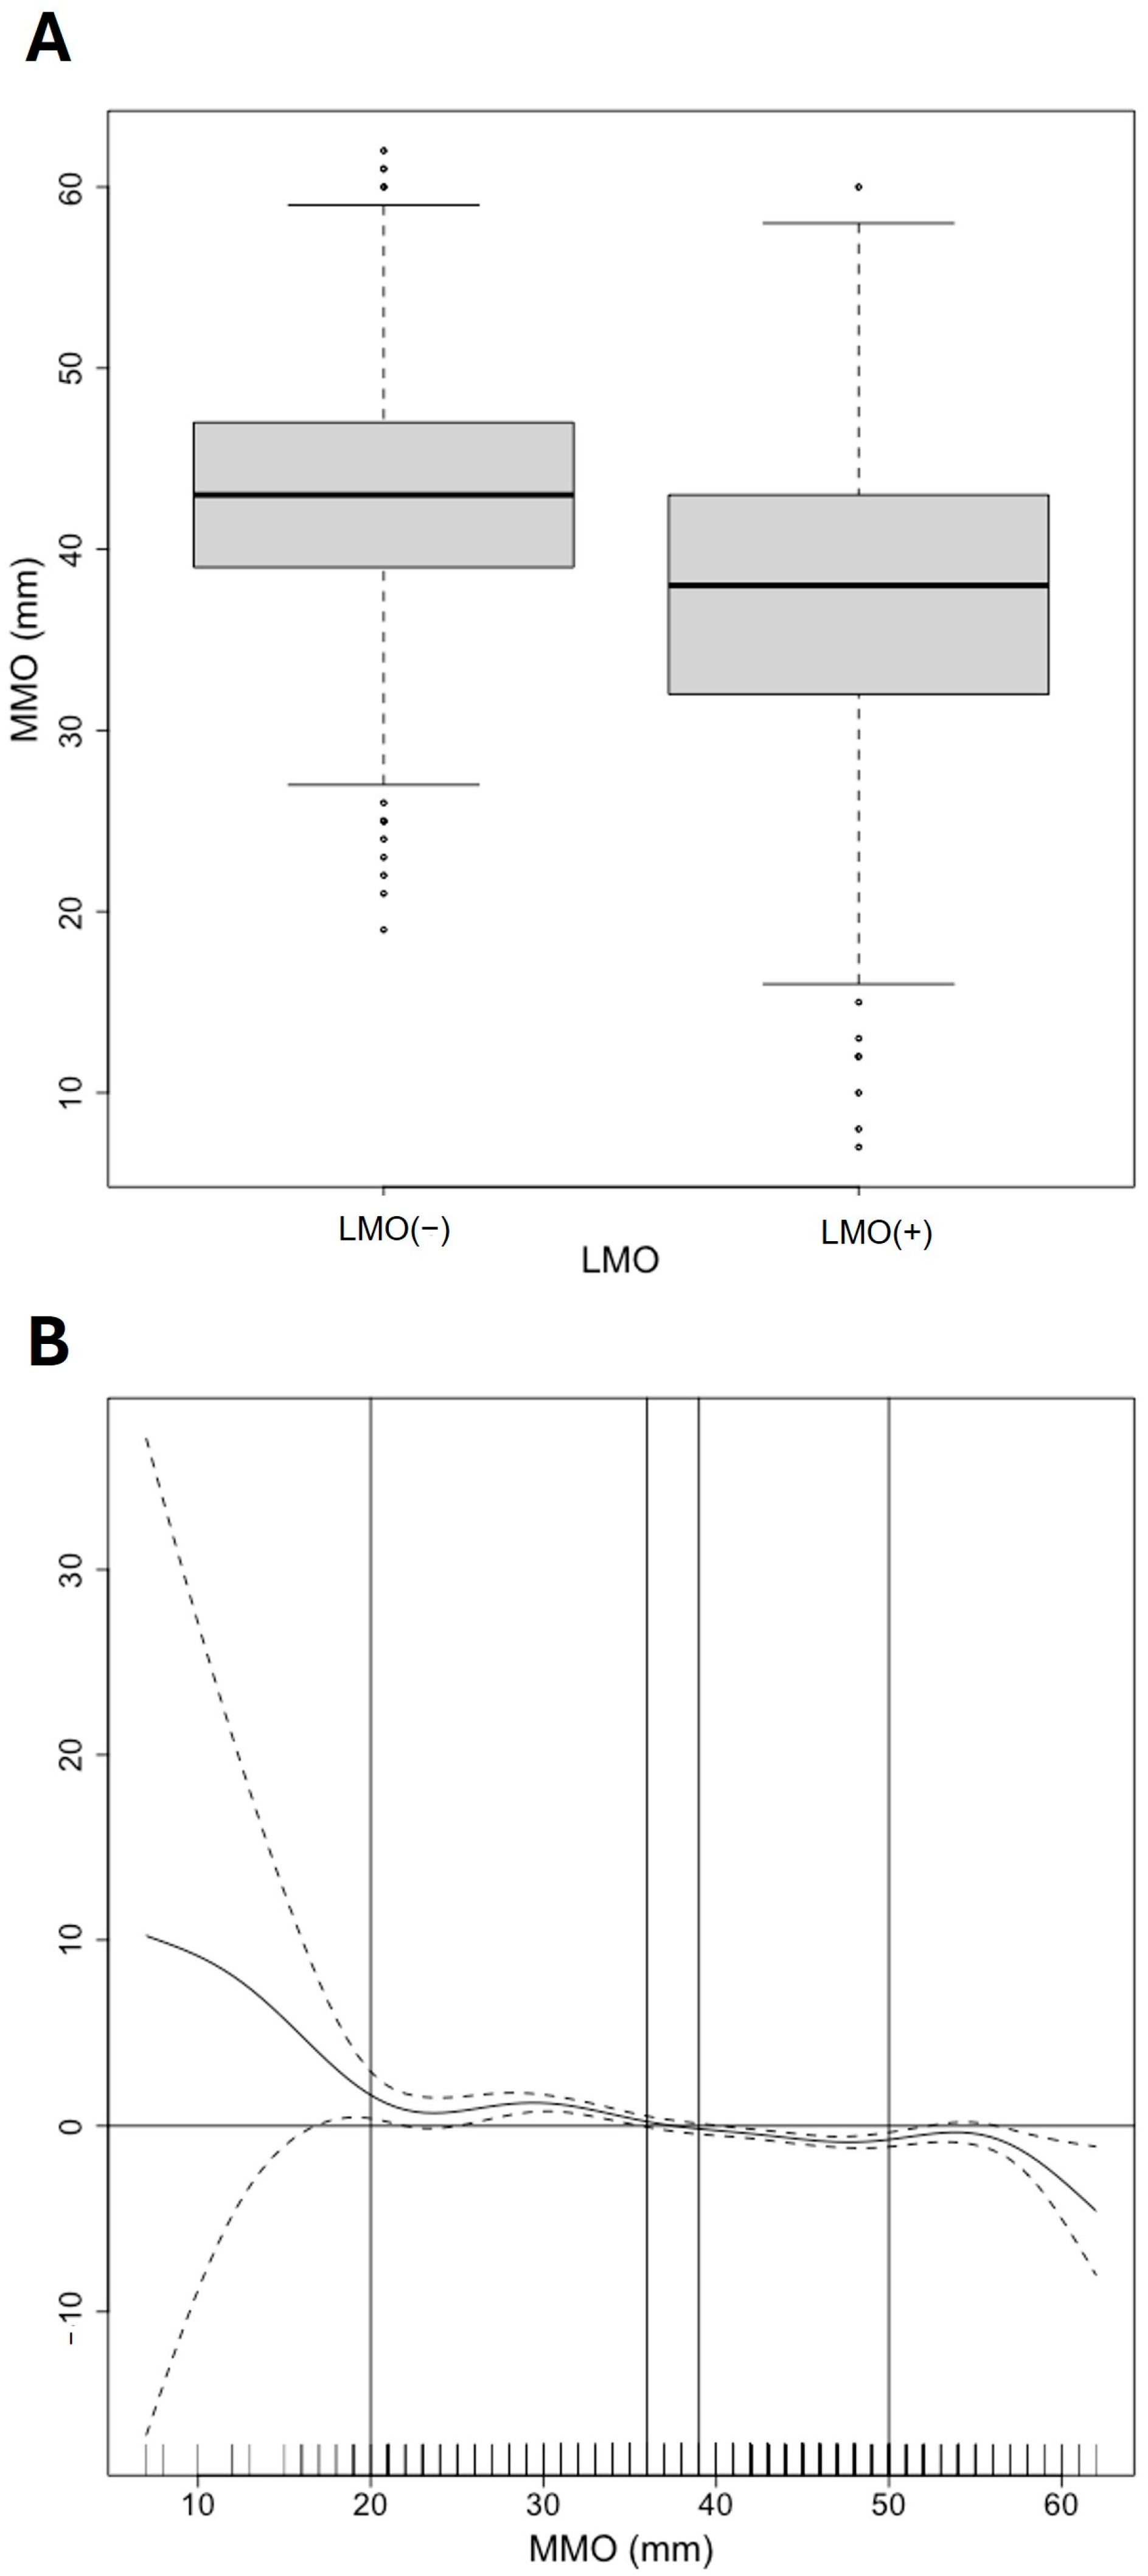
| MMO (mm) | 41.0 [34.0;45.0] | |
| Female | 40.0 [34.0;45.0] | |
| Male | 44.0 [40.0;48.0] | |
| LMO (+) | 633 (60.6%) | |
| Female | 529 (63.3%) | |
| Male | 104 (49.8%) | |
| LMO (–) | 412 (39.4%) | |
| Female | 307 (36.7%) | |
| Male | 105 (50.2%) | |
| MMO (mm) | ||
| LMO (–) | 43.0 [39.0;47.0] | |
| LMO (+) | 38.0 [32.0;43.0] | |
Disclaimer/Publisher’s Note: The statements, opinions and data contained in all publications are solely those of the individual author(s) and contributor(s) and not of MDPI and/or the editor(s). MDPI and/or the editor(s) disclaim responsibility for any injury to people or property resulting from any ideas, methods, instructions or products referred to in the content. |
© 2025 by the authors. Licensee MDPI, Basel, Switzerland. This article is an open access article distributed under the terms and conditions of the Creative Commons Attribution (CC BY) license (https://creativecommons.org/licenses/by/4.0/).
Share and Cite
Ângelo, D.F.; Cardoso, H.J.; João, R.S.; Brás-Geraldes, C.; Sanz, D.; Maffia, F.; Salvado, F. Gender Differences in Mouth Opening on Temporomandibular Disorder Patients—Implications for Diagnosis. J. Clin. Med. 2025, 14, 3865. https://doi.org/10.3390/jcm14113865
Ângelo DF, Cardoso HJ, João RS, Brás-Geraldes C, Sanz D, Maffia F, Salvado F. Gender Differences in Mouth Opening on Temporomandibular Disorder Patients—Implications for Diagnosis. Journal of Clinical Medicine. 2025; 14(11):3865. https://doi.org/10.3390/jcm14113865
Chicago/Turabian StyleÂngelo, David Faustino, Henrique José Cardoso, Ricardo São João, Carlos Brás-Geraldes, David Sanz, Francesco Maffia, and Francisco Salvado. 2025. "Gender Differences in Mouth Opening on Temporomandibular Disorder Patients—Implications for Diagnosis" Journal of Clinical Medicine 14, no. 11: 3865. https://doi.org/10.3390/jcm14113865
APA StyleÂngelo, D. F., Cardoso, H. J., João, R. S., Brás-Geraldes, C., Sanz, D., Maffia, F., & Salvado, F. (2025). Gender Differences in Mouth Opening on Temporomandibular Disorder Patients—Implications for Diagnosis. Journal of Clinical Medicine, 14(11), 3865. https://doi.org/10.3390/jcm14113865