
Association of Inflammatory and Ischemic Markers with Posterior Segment Parameters in Pseudoexfoliation Syndrome and Glaucoma

 , , , , ,
Abstract
1. Introduction
2. Materials and Methods
2.1. Patient Selection
2.2. Exclusion Criteria
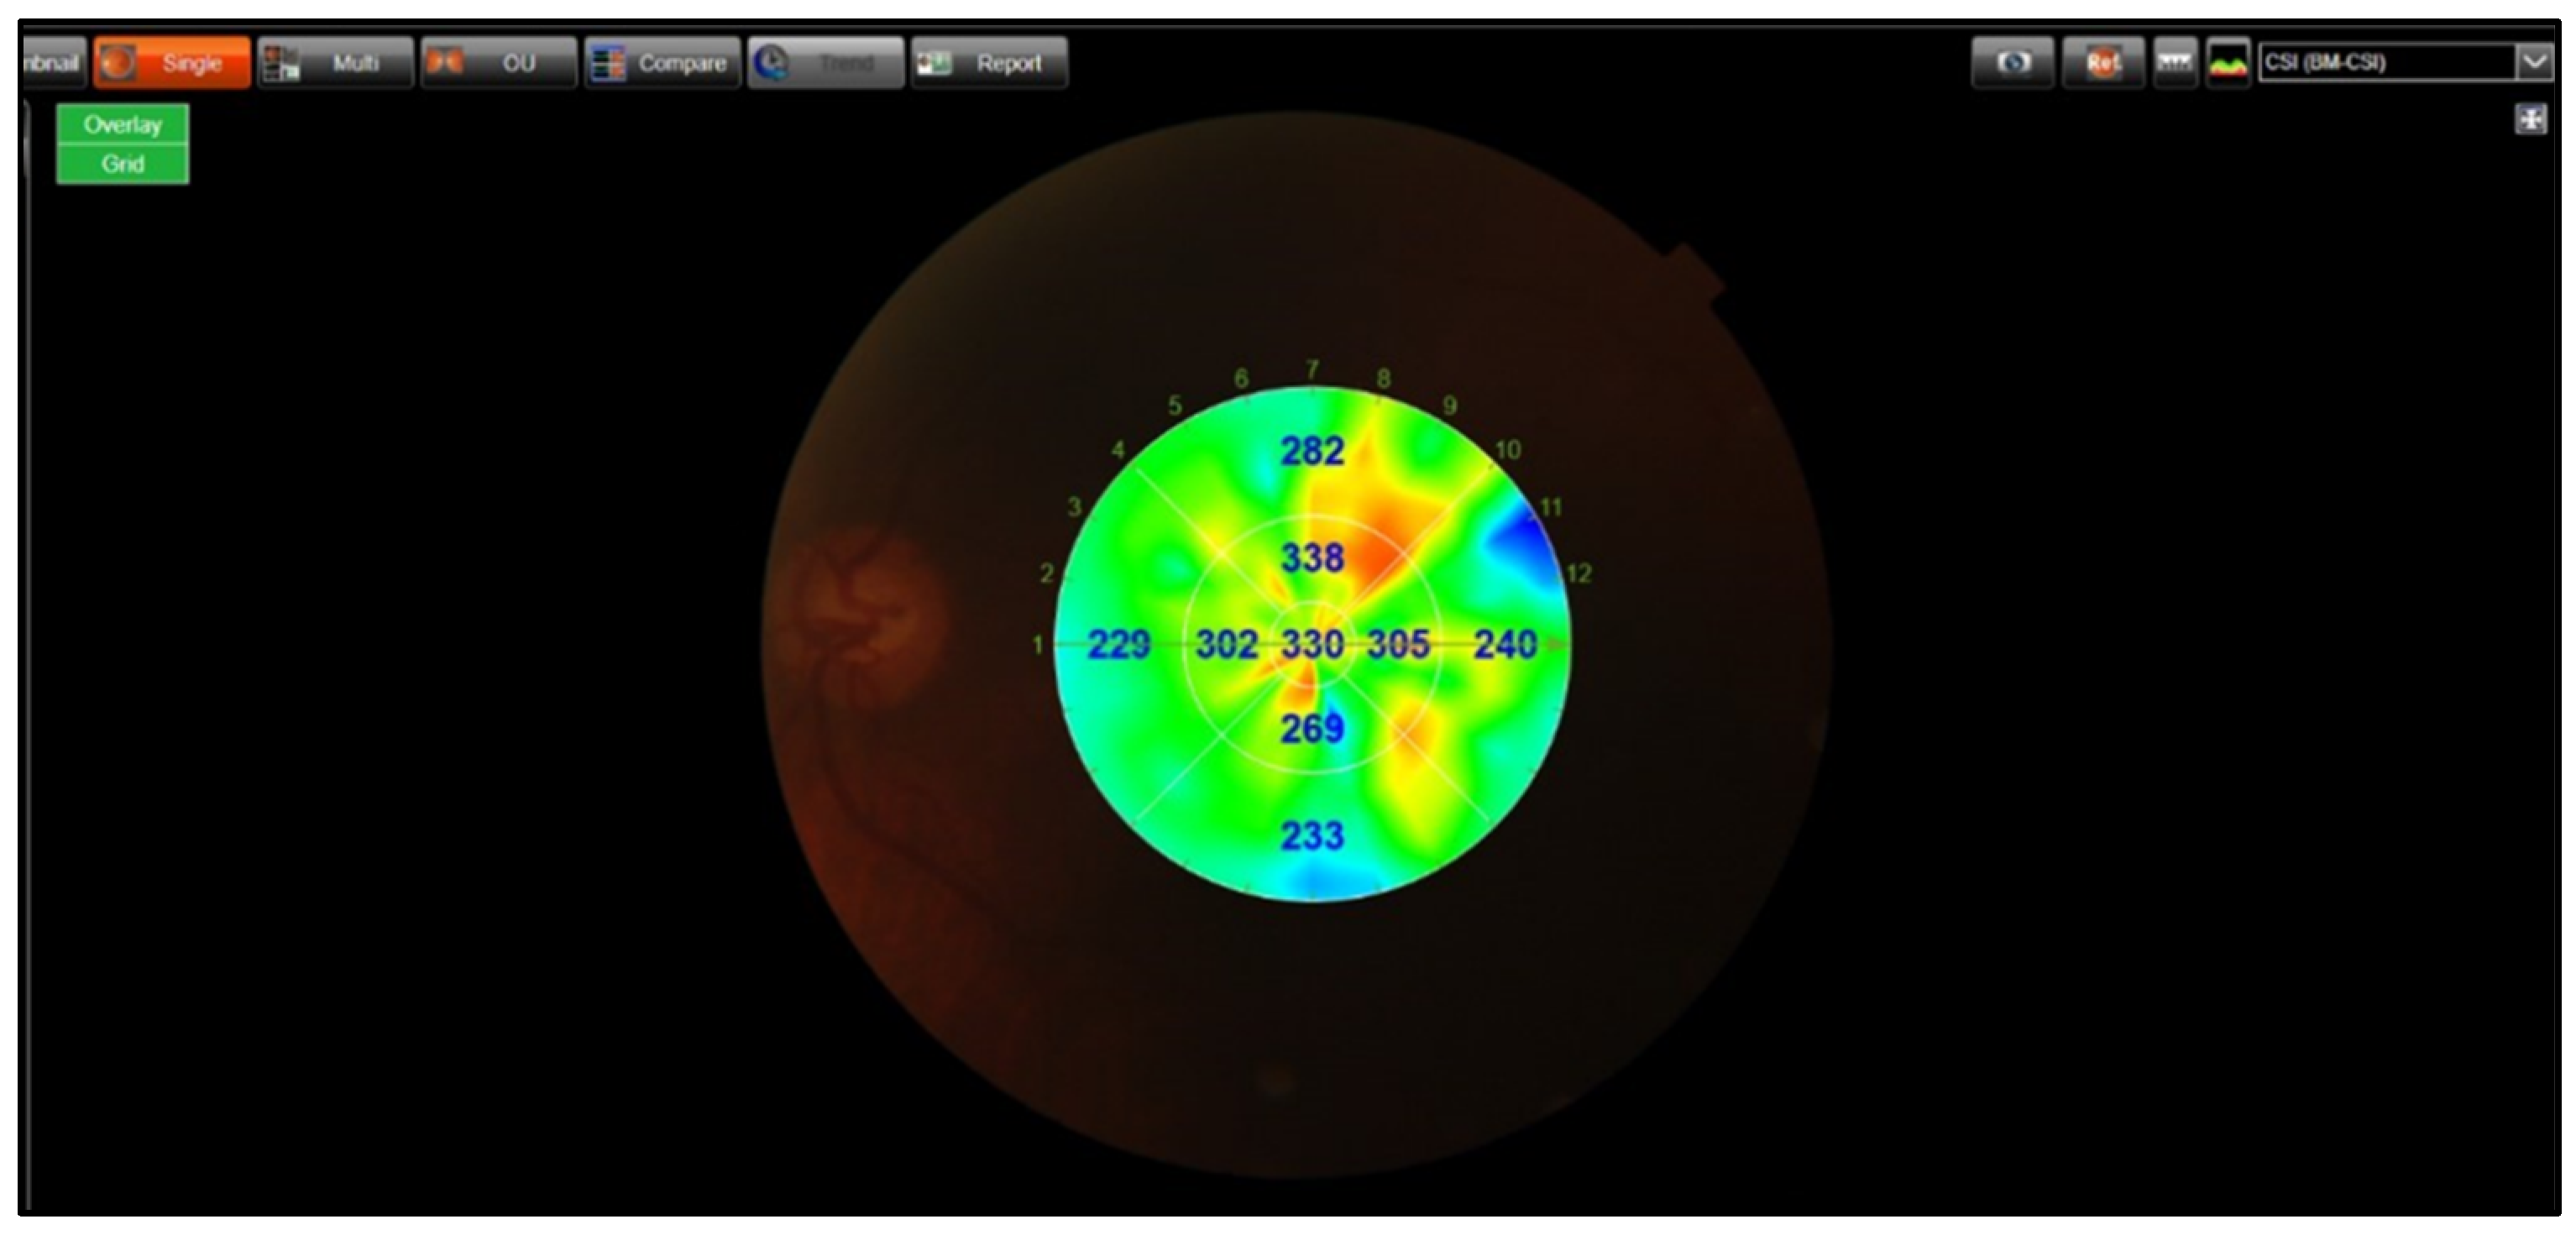
2.3. OCT Imaging
2.4. OCT-A Imaging
2.5. Measurements of Inflammatory and Ischemic Markers
2.6. Malondialdehyde (MDA)
2.7. Glutathione (GSH)
2.8. Nitric Oxide (NO)
2.9. SCUBE-1, Galectin-3,iNOS, and IL-6
2.10. Statistical Analysis
3. Results
SD: Standard Deviation
4. Discussion
5. Conclusions
Author Contributions
Funding
Institutional Review Board Statement
Informed Consent Statement
Data Availability Statement
Conflicts of Interest
References
- Tomczyk-Socha, M.; Tomczak, W.; Winkler-Lach, W.; Turno-Kręcicka, A. Pseudoexfoliation Syndrome-Clinical Characteristics of Most Common Cause of Secondary Glaucoma. J. Clin. Med. 2023, 12, 3580. [Google Scholar] [CrossRef] [PubMed]
- Elhawy, E.; Kamthan, G.; Dong, C.Q.; Danias, J. Pseudoexfoliation syndrome, a systemic disorder with ocular manifestations. Hum. Genom. 2012, 6, 22. [Google Scholar] [CrossRef] [PubMed]
- Tuteja, S.; Zeppieri, M.; Chawla, H. Pseudoexfoliation Syndrome and Glaucoma; StatPearls [Internet]: Treasure Island, FL, USA; StatPearls Publishing: St. Petersburg, FL, USA, 2021. [Google Scholar]
- Mastronikolis, S.; Pagkalou, M.; Plotas, P.; Kagkelaris, K.; Georgakopoulos, C.D. Emerging roles of oxidative stress in the pathogenesis of pseudoexfoliation syndrome (Review). Exp. Ther. Med. 2022, 24, 602. [Google Scholar] [CrossRef]
- Zenkel, M.; Lewczuk, P.; Jünemann, A.; Kruse, F.E.; Naumann, G.O.; Schlötzer-Schrehardt, U. Proinflammatory cytokines are involved in the initiation of the abnormal matrix process in pseudoexfoliation syndrome/glaucoma. Am. J. Pathol. 2010, 176, 2868–2879. [Google Scholar] [CrossRef] [PubMed]
- Mastronikolis, S.; Kagkelaris, K.; Pagkalou, M.; Tsiambas, E.; Plotas, P.; Georgakopoulos, C.D. Antioxidant Defense and Pseudoexfoliation Syndrome: An Updated Review. Med. Sci. 2022, 10, 68. [Google Scholar] [CrossRef]
- Aydın Yaz, Y.; Yıldırım, N.; Yaz, Y.; Tekin, N.; İnal, M.; Şahin, F.M. Role of Oxidative Stress in Pseudoexfoliation Syndrome and Pseudoexfoliation Glaucoma. Turk. J. Ophthalmol. 2019, 49, 61–67. [Google Scholar] [CrossRef]
- Yildirim, Z.; Yildirim, F.; Uçgun, N.I.; Sepici-Dinçel, A. The role of the cytokines in the pathogenesis of pseudoexfoliation syndrome. Int. J. Ophthalmol. 2013, 6, 50–53. [Google Scholar] [CrossRef]
- Sarenac Vulovic, T.S.; Pavlovic, S.M.; Jakovljevic, V.; Janicijevic, K.B.; Zdravkovic, N.S. Nitric oxide and tumour necrosis factor alpha in the process of pseudoexfoliation glaucoma. Int. J. Ophthalmol. 2016, 9, 1138–1142. [Google Scholar] [CrossRef]
- Chung, H.; Arora, S.; Damji, K.F.; Weis, E. Association of pseudoexfoliation syndrome with cardiovascular and cerebrovascular disease: A systematic review and meta-analysis. Can. J. Ophthalmol. J. Can. D’ophtalmologie 2018, 53, 365–372. [Google Scholar] [CrossRef]
- Dai, D.-F.; Thajeb, P.; Tu, C.-F.; Chiang, F.-T.; Chen, C.-H.; Yang, R.-B.; Chen, J.-J. Plasma Concentration of SCUBE1, a Novel Platelet Protein, Is Elevated in Patients with Acute Coronary Syndrome and Ischemic Stroke. J. Am. Coll. Cardiol. 2008, 51, 2173–2180. [Google Scholar] [CrossRef]
- Sygitowicz, G.; Maciejak-Jastrzębska, A.; Sitkiewicz, D. The Diagnostic and Therapeutic Potential of Galectin-3 in Cardiovascular Diseases. Biomolecules 2021, 12, 46. [Google Scholar] [CrossRef] [PubMed]
- Zhou, Z.; Feng, Z.; Sun, X.; Wang, Y.; Dou, G. The Role of Galectin-3 in Retinal Degeneration and Other Ocular Diseases: A Potential Novel Biomarker and Therapeutic Target. Int. J. Mol. Sci. 2023, 24, 15516. [Google Scholar] [CrossRef] [PubMed]
- Mussi, N.; Campos, M.; Gil, C. Levels of Galectin-3 is Altered in the Exfoliation Syndrome. Investig. Ophthalmol. Vis. Sci. 2020, 61, 781. [Google Scholar]
- Hata-Mizuno, M.; Uchino, Y.; Uchino, M.; Shimmura, S.; Ogawa, Y.; Tsubota, K.; Negishi, K. Analysis of the Association between Galectin-3 Concentration in Tears and the Severity of Dry Eye Disease: A Case-Control Study. J. Clin. Med. 2022, 11, 66. [Google Scholar] [CrossRef]
- Bahadır Camgöz, E.; Sekeryapan Gediz, B.; Senes, M.; Serin, F.; Elgin, K.U. Increased SCUBE-1 levels in the aqueous humour of patients with pseudoexfoliation syndrome. Clin. Exp. Optom. 2025, 1–5. [Google Scholar] [CrossRef]
- Un, Y.; Sonmez, M. Choroidal thickness measurements of subjects with pseudoexfoliative syndrome and pseudoexfoliative glaucoma: A contralateral eye study. Eur. J. Ophthalmol. 2023, 33, 1986–1996. [Google Scholar] [CrossRef]
- Egrilmez, E.D.; Ugurlu, S.K.; Atik, S.S.; Guven, Y.Z. The effect of pseudoexfoliation syndrome on choroidal thickness in open-angle glaucoma. Arq. Bras. Oftalmol. 2019, 82, 400–406. [Google Scholar] [CrossRef]
- Chatziralli, I.; Milionis, I.; Christodoulou, A.; Theodossiadis, P.; Kitsos, G. The Role of Vessel Density as Measured by Optical Coherence Tomography Angiography in the Evaluation of Pseudoexfoliative Glaucoma: A Review of the Literature. Ophthalmol. Ther. 2022, 11, 533–545. [Google Scholar] [CrossRef]
- Susanna, R., Jr.; Vessani, R.M. Staging glaucoma patient: Why and how? Open Ophthalmol. J. 2009, 3, 59–64. [Google Scholar] [CrossRef]
- Aguilar Diaz De Leon, J.; Borges, C.R. Evaluation of Oxidative Stress in Biological Samples Using the Thiobarbituric Acid Reactive Substances Assay. J. Vis. Exp. JoVE 2020, 159, 10–3791. [Google Scholar] [CrossRef]
- Rahman, I.; Kode, A.; Biswas, S.K. Assay for quantitative determination of glutathione and glutathione disulfide levels using enzymatic recycling method. Nat. Protoc. 2006, 1, 3159–3165. [Google Scholar] [CrossRef] [PubMed]
- Demircan, S.; Uğur, Y.; Erkut, K.; Döndü, U.M.; Mustafa, A.; Ahmet, G.; Zararsız, G. The Effect of Pseudoexfoliation Syndrome on the Retinal Nerve Fiber Layer and Choroid Thickness. Semin. Ophthalmol. 2017, 32, 341–347. [Google Scholar] [CrossRef] [PubMed]
- Kazantzis, D.; Machairoudia, G.; Theodossiadis, P.; Chatziralli, I. Subfoveal choroidal thickness changes in patients with pseudoexfoliation syndrome (PEX) compared to healthy controls: A systematic review and meta-analysis. Photodiagn. Photodyn. Ther. 2024, 47, 104095. [Google Scholar] [CrossRef]
- Yu, J.G.; Huang, Q.; Zhou, X.F.; Ding, Y.; Li, J.; Xiang, Y. Retinal Nerve Fiber Layer Thickness Changes in the Pseudoexfoliation Syndrome: A Meta-Analysis of Case-Control Studies. Ophthalmic Res. 2017, 59, 14–23. [Google Scholar] [CrossRef]
- Turan-Vural, E.; Yenerel, N.; Okutucu, M.; Yildiz, E.; Dikmen, N. Measurement of Subfoveal Choroidal Thickness in Pseudoexfoliation Syndrome Using Enhanced Depth Imaging Optical Coherence Tomography. Ophthalmologica 2015, 233, 204–208. [Google Scholar] [CrossRef] [PubMed]
- Toptan, M.; Simsek, A. Evaluation of the Effect of Duration on Retinal Nerve Fiber Layer Thickness and Choroidal Thickness in Exfoliation Syndrome and Exfoliative Glaucoma. Diagnostics 2023, 13, 314. [Google Scholar] [CrossRef]
- Yüksel, N.; Altintaş, O.; Celik, M.; Ozkan, B.; Cağlar, Y. Analysis of retinal nerve fiber layer thickness in patients with pseudoexfoliation syndrome using optical coherence tomography. Ophthalmologica 2007, 221, 299–304. [Google Scholar] [CrossRef]
- Ozmen, M.C.; Aktas, Z.; Yildiz, B.K.; Hasanreisoglu, M.; Hasanreisoglu, B. Retinal vessel diameters and their correlation with retinal nerve fiber layer thickness in patients with pseudoexfoliation syndrome. Int. J. Ophthalmol. 2015, 8, 332–336. [Google Scholar] [CrossRef]
- Paul, A.; Naik, A.; Ramesh, P.V.; Ghosh, T. Orbital Blood Flow and Pseudoexfoliation Syndrome—A Narrative Review. TNOA J. Ophthalmic Sci. Res. 2024, 62, 404–411. [Google Scholar] [CrossRef]
- Kocaturk, T.; Isikligil, I.; Uz, B.; Dayanir, V.; Dayanir, Y.O. Ophthalmic artery blood flow parameters in pseudoexfoliation glaucoma. Eur. J. Ophthalmol. 2016, 26, 124–127. [Google Scholar] [CrossRef]
- Ocakoglu, O.; Koyluoglu, N.; Kayiran, A.; Tamcelik, N.; Ozkan, S. Microvascular blood flow of the optic nerve head and peripapillary retina in unilateral exfoliation syndrome. Acta Ophthalmol. Scand. 2004, 82, 49–53. [Google Scholar] [CrossRef] [PubMed]
- Dursun, A.; Ozec, A.V.; Dogan, O.; Dursun, F.G.; Toker, M.I.; Topalkara, A.; Arici, M.K.; Erdogan, H. Evaluation of Choroidal Thickness in Patients with Pseudoexfoliation Syndrome and Pseudoexfoliation Glaucoma. J. Ophthalmol. 2016, 2016, 3545180. [Google Scholar] [CrossRef] [PubMed]
- Bayhan, H.A.; Bayhan, S.A.; Can, İ. Evaluation of the Macular Choroidal Thickness Using Spectral Optical Coherence Tomography in Pseudoexfoliation Glaucoma. J. Glaucoma 2016, 25, 184–187. [Google Scholar] [CrossRef]
- Çınar, E.; Yüce, B.; Aslan, F. Retinal and Choroidal Vascular Changes in Eyes with Pseudoexfoliation Syndrome: A Comparative Study Using Optical Coherence Tomography Angiography. Balk. Med. J. 2019, 37, 9–14. [Google Scholar] [CrossRef] [PubMed]
- Rebolleda, G.; Pérez-Sarriegui, A.; De Juan, V.; Ortiz-Toquero, S.; Muñoz-Negrete, F.J. A comparison of two optical coherence tomography-angiography devices in pseudoexfoliation glaucoma versus primary open-angle glaucoma and healthy subjects. Eur. J. Ophthalmol. 2019, 29, 636–644. [Google Scholar] [CrossRef]
- Durmuş Ece, B.Ş.; Sarıcaoğlu, M.S. Examination of retinal vascular density changes via optical coherence tomography angiography in patients with glaucoma. Int. Ophthalmol. 2021, 41, 687–698. [Google Scholar] [CrossRef]
- Hirbo, J.B.; Pasutto, F.; Gamazon, E.R.; Evans, P.; Pawar, P.; Berner, D.; Sealock, J.; Tao, R.; Straub, P.S.; Konkashbaev, A.I.; et al. Analysis of genetically determined gene expression suggests role of inflammatory processes in exfoliation syndrome. BMC Genom. 2023, 24, 75. [Google Scholar] [CrossRef]
- Tukenmez Dikmen, N.; Un, Y. Systemic immuno-inflammatory index in patients with pseudoexfoliation syndrome and pseudoexfoliative glaucoma. Ther. Adv. Ophthalmol. 2023, 15, 25158414231197072. [Google Scholar] [CrossRef]
- Cumurcu, T.; Gunduz, A.; Ozyurt, H.; Nurcin, H.; Atis, O.; Egri, M. Increased oxidative stress in patients with pseudoexfoliation syndrome. Ophthalmic Res. 2010, 43, 169–172. [Google Scholar] [CrossRef]
- Yağci, R.; Gürel, A.; Ersöz, I.; Keskin, U.C.; Hepşen, I.F.; Duman, S.; Yiğitoğlu, R. Oxidative stress and protein oxidation in pseudoexfoliation syndrome. Curr. Eye Res. 2006, 31, 1029–1032. [Google Scholar] [CrossRef]
- Ghasemi, H. Roles of IL-6 in Ocular Inflammation: A Review. Ocul. Immunol. Inflamm. 2018, 26, 37–50. [Google Scholar] [CrossRef] [PubMed]
- Sarenac Vulovic, T.S.; Pavlovic, S.M.; Zdravkovic, N.S. Proinflammatory Cytokines Induce XFG Development. Ocul. Immunol. Inflamm. 2016, 24, 671–677. [Google Scholar] [CrossRef]
- Erdinest, N.; London, N.; Ovadia, H.; Levinger, N. Nitric Oxide Interaction with the Eye. Vision 2021, 5, 29. [Google Scholar] [CrossRef]
- Altintaş, Ö.; Maral, H.; Yüksel, N.; Karabaş, V.L.; Dillioğlugil, M.Ö.; Çağlar, Y. Homocysteine and nitric oxide levels in plasma of patients with pseudoexfoliation syndrome, pseudoexfoliation glaucoma, and primary open-angle glaucoma. Graefe’s Arch. Clin. Exp. Ophthalmol. 2005, 243, 677–683. [Google Scholar] [CrossRef] [PubMed]
- Borazan, M.; Karalezli, A.; Kucukerdonmez, C.; Bayraktar, N.; Kulaksizoglu, S.; Akman, A.; Akova, Y.A. Aqueous humor and plasma levels of vascular endothelial growth factor and nitric oxide in patients with pseudoexfoliation syndrome and pseudoexfoliation glaucoma. J. Glaucoma 2010, 19, 207–211. [Google Scholar] [CrossRef] [PubMed]
- Kotikoski, H.; Moilanen, E.; Vapaatalo, H.; Aine, E. Biochemical markers of the L-arginine-nitric oxide pathway in the aqueous humour in glaucoma patients. Acta Ophthalmol. Scand. 2002, 80, 191–195. [Google Scholar] [CrossRef] [PubMed]
- Gericke, A.; Buonfiglio, F. Physiological and Pathophysiological Relevance of Nitric Oxide Synthases (NOS) in Retinal Blood Vessels. Front. Biosci.—Landmark 2024, 29, 190. [Google Scholar] [CrossRef]
- Cavet, M.E.; Vittitow, J.L.; Impagnatiello, F.; Ongini, E.; Bastia, E. Nitric Oxide (NO): An Emerging Target for the Treatment of Glaucoma. Investig. Ophthalmol. Vis. Sci. 2014, 55, 5005–5015. [Google Scholar] [CrossRef]
- Pitts, K.M.; Neeson, C.E.; Hall, N.E.; Lin, J.B.; Falah, H.K.; Wang, S.L.; Lo, K.T.; Song, C.E.; Margeta, M.A.; Solá-Del Valle, D.A. Neurodegeneration Markers Galectin-3 and Apolipoprotein E Are Elevated in the Aqueous Humor of Eyes with Glaucoma. Transl. Vis. Sci. Technol. 2022, 11, 1. [Google Scholar] [CrossRef]
- Singh, A.; Kukreti, R.; Saso, L.; Kukreti, S. Oxidative Stress: A Key Modulator in Neurodegenerative Diseases. Molecules 2019, 24, 1583. [Google Scholar] [CrossRef]
- Varadhan, S.; Venkatachalam, R.; Perumal, S.M.; Ayyamkulamkara, S.S. Evaluation of Oxidative Stress Parameters and Antioxidant Status in Coronary Artery Disease Patients. Arch. Razi Inst. 2022, 77, 853–859. [Google Scholar] [CrossRef] [PubMed]
- Shu, D.Y.; Chaudhary, S.; Cho, K.-S.; Lennikov, A.; Miller, W.P.; Thorn, D.C.; Yang, M.; McKay, T.B. Role of Oxidative Stress in Ocular Diseases: A Balancing Act. Metabolites 2023, 13, 187. [Google Scholar] [CrossRef] [PubMed]
- Nucci, C.; Di Pierro, D.; Varesi, C.; Ciuffoletti, E.; Russo, R.; Gentile, R.; Cedrone, C.; Pinazo Duran, M.D.; Coletta, M.; Mancino, R. Increased malondialdehyde concentration and reduced total antioxidant capacity in aqueous humor and blood samples from patients with glaucoma. Mol. Vis. 2013, 19, 1841–1846. [Google Scholar] [PubMed]


| Control (1) (n = 25) | PES (2) (n = 30) | PXG (3) (n = 25) | p-Value | |
|---|---|---|---|---|
| Age (years) (mean ± SD) | 72 ± 7.2 | 74 ± 6.9 | 73 ± 7.1 | 0.46 |
| Gender (n) (male/female) | 12/13 | 16/14 | 14/11 | 0.84 |
| Intraocular pressure (mmHg) (mean ± SD) | 15.8 ± 3.5 | 16.2 ± 3.4 | 17.02 ± 3.1 | 0.41 |
| Central corneal thickness (mean ± SD) | 567.1 ± 32.3 | 563.05 ± 22.7 | 561.3 ± 25.1 | >0.05 * |
| Control (1) | PES (2) | PXG (3) | p-Value | ||
|---|---|---|---|---|---|
| (n = 25) | (n = 30) | (n = 25) | |||
| RNFL | |||||
| Average | |||||
| Mean ± SD | 102.1 ± 5.2 | 100.9 ± 9.8 | 62.7 ± 11.2 | <0.001 * | 1–3; 2–3 |
| Median (min–max) | 103 (92–110) | 100.5 (84–129) | 62 (41–87) | ||
| Inferior | |||||
| Mean ± SD | 125.2 ± 13.4 | 125.8 ± 17.2 | 70.6 ± 20.7 | <0.001 * | 1–3; 2–3 |
| Median (min–max) | 125 (101–151) | 126 (93–153) | 66 (39–114) | ||
| Superior | |||||
| Mean ± SD | 120.8 ± 14.3 | 118.6 ± 15.3 | 72.9 ± 14.8 | <0.001 * | 1–3; 2–3 |
| Median (min–max) | 121 (93–148) | 115.5 (93–149) | 72 (54–120) | ||
| Nasal | |||||
| Mean ± SD | 84.7 ± 12 | 85.5 ± 12.7 | 57.1 ± 13.1 | <0.001 * | 1–3; 2–3 |
| Median (min–max) | 85 (53–102) | 84 (59–110) | 57 (33–85) | ||
| Temporal | |||||
| Mean ± SD | 74.6 ± 13.9 | 72.7 ± 14.5 | 51.3 ± 12.3 | <0.001 * | 1–3; 2–3 |
| Median (min–max) | 72 (52–115) | 70 (53–113) | 50 (30–83) | ||
| Peripapillary Choroidal Thickness | |||||
| Average | |||||
| Mean ± SD | 151.2 ± 12.9 | 128.6 ± 31.1 | 94.1 ± 26.5 | <0.001 * | 1– 2; 1–3; 2–3 |
| Median (min–max) | 147.8 (134–185) | 124.2 (85–196) | 87.5 (58–171) | ||
| Nasal | |||||
| Mean ± SD | 137.88 ± 15.42 | 133.3 ± 30.98 | 108.24 ± 32.24 | <0.001 * | 1–3; 2–3 |
| Median (min–max) | 139 (102–172) | 125 (80–200) | 100 (51–162) | ||
| Superonasal | |||||
| Mean ± SD | 146.56 ± 18.82 | 135.3 ± 23.34 | 106.84 ± 27.30 | <0.001 * | 1–3; 2–3 |
| Median (min–max) | 142 (110–176) | 133.5(101–186) | 96 (75–188) | ||
| Superotemporal | |||||
| Mean ± SD | 160.08 ± 12.84 | 129.93 ± 30.79 | 99.56 ± 35.71 | <0.001 * | 1–2; 1–3; 2–3 |
| Median (min–max) | 160 (131–182) | 126.5 (78–222) | 98 (51–215) | ||
| Temporal | |||||
| Mean ± SD | 156.32 ± 9.43 | 128.7 ± 31.59 | 102.72 ± 23.57 | <0.001 * | 1–2; 1–3; 2–3 |
| Median (min–max) | 155 (140–179) | 128 (74–206) | 98 (70–164) | ||
| Inferotemporal | |||||
| Mean ± SD | 141.88 ± 17.26 | 116.6 ± 35.03 | 88.08 ± 21.91 | <0.001 * | 1–2; 1–3; 2–3 |
| Median (min–max) | 136 (111–182) | 118 (51–205) | 85 (58–145) | ||
| Inferonasal | |||||
| Mean ± SD | 135.96 ± 23.02 | 130.03 ± 24.12 | 102.56 ± 21.85 | <0.001 * | 1–3; 2–3 |
| Median (min–max) | 133 (101–197) | 127 (84–207) | 102(55–165) | ||
| Macular Choroid Thickness | |||||
| Average | |||||
| Mean ± SD | 226.9 ± 21.1 | 204.1 ± 40.3 | 186.8 ± 25.7 | <0.001 * | 1–3 |
| Median (min–max) | 225.7 (187–275) | 210.9 (123–268) | 182.4 (137–227) | ||
| Subfoveal | |||||
| Mean ± SD | 285.84 ± 17.16 | 253.13 ± 46.25 | 223.76 ± 31.30 | <0.001 * | 1–2; 1–3;2–3 |
| Median (min–max) | 283 (248–317) | 256.5 (175–324) | 217 (172–278) | ||
| Inner Temporal | |||||
| Mean ± SD | 222.2 ± 26.55 | 210.27 ± 46.78 | 206.48 ± 26.58 | 0.657 | |
| Median (min–max) | 224 (180–298) | 219 (134–274) | 198 (163–254) | ||
| Outer Temporal | |||||
| Mean ± SD | 210.2 ± 25.2 | 201.57 ± 49.91 | 197.16 ± 27.06 | 0.647 | |
| Median (min–max) | 211 (168–263) | 211 (114–269) | 187 (158–243) | ||
| Inner Nasal | |||||
| Mean ± SD | 214.44 ± 29.41 | 185.47 ± 27.22 | 155.12 ± 26.15 | <0.001 * | 1–2; 1–3; 2–3 |
| Median (min–max) | 221 (116–262) | 182.5 (134–248) | 158 (108–224) | ||
| Outer Nasal | |||||
| Mean ± SD | 186.44 ± 25.26 | 157.83 ± 30.87 | 127.16 ± 27.34 | <0.001 * | 1–2; 1–3; 2–3 |
| Median (min–max) | 185(143–234) | 158.5 (104–240) | 124 (80–214) | ||
| Superficial Vessel Density | |||||
| Average | |||||
| Mean ± SD | 43.5 ± 2.9 | 38 ± 2.8 | 33.3 ± 1.5 | <0.001 * | 1–2; 1–3; 2–3 |
| Median (min–max) | 43.9 (36–50) | 38.2 (31–42) | 33.4 (30–36) | ||
| Foveal | |||||
| Mean ± SD | 23.6 ± 4.8 | 18.7 ± 2.8 | 13.7 ± 1.9 | <0.001 * | 1–2; 1–3; 2–3 |
| Median (min–max) | 24.6 (13.5–31.3) | 18.4 (13.9–23.8) | 14 (9.9–18) | ||
| Inferior | |||||
| Mean ± SD | 47.5 ± 3.9 | 42.3 ± 4.8 | 37.6 ± 2.6 | <0.001 * | 1–2; 1–3; 2–3 |
| Median (min–max) | 48 (38.2–56.3) | 42.5 (31.7–49.9) | 37.4 (33–44) | ||
| Superior | |||||
| Mean ± SD | 49.2 ± 3.2 | 43.1 ± 3.1 | 38.4 ± 2.1 | <0.001 * | 1–2; 1–3; 2–3 |
| Median (min–max) | 49.6 (42.6–56.4) | 44.2 (35.1–48.3) | 38.6 (34–42.6) | ||
| Nasal | |||||
| Mean ± SD | 48.3 ± 2.7 | 42.6 ± 4.1 | 38.1 ± 2.3 | <0.001 * | 1–2; 1–3; 2–3 |
| Median (min–max) | 48.7 (42.4–54.1) | 43.5 (31.7–48.7) | 38.5 (30.5–42.1) | ||
| Temporal | <0.001 * | 1–2; 1–3; 2–3 | |||
| Mean ± SD | 48.9 ± 3.1 | 43.2 ± 3.5 | 38.5 ± 2.3 | ||
| Median (min–max) | 49.3 (43–57.6) | 43.4 (31.8–48.5) | 38.2 (34.7–43.3) | ||
| Deep Vessel Density | |||||
| Average | |||||
| Mean ± SD | 38.3 ± 2.0 | 37.4 ± 2.6 | 35.2 ± 1.9 | <0.001* | 1–3; 2–3 |
| Median (min–max) | 37.7 (33–42) | 37.6 (30–43) | 35.5 (31–39) | ||
| Fovea | |||||
| Mean ± SD | 18.4 ± 4 | 17 ± 2.5 | 12.7 ± 2.6 | <0.001 * | 1–3; 2–3 |
| Median (min–max) | 17.6 (12.5–26.5) | 16.5 (12.1–22) | 13.3 (6.6–16.8) | ||
| Inferior | |||||
| Mean ± SD | 43.1 ± 2.3 | 42.1 ± 4.1 | 36.7 ± 2.1 | <0.001 * | 1–3; 2–3 |
| Median (min–max) | 43.3 (38.2–46.4) | 42.8 (31.6–48.9) | 37.5 (31.2–39.6) | ||
| Superior | |||||
| Mean ± SD | 43.3 ± 2.9 | 42.6 ± 4.4 | 42 ± 2.5 | 0.251 | |
| Median (min–max) | 43.2 (36.2–48.2) | 42.5 (25.5–48.9) | 42.2 (37.7–46) | ||
| Nasal | |||||
| Mean ± SD | 43.4 ± 2.6 | 43 ± 3.8 | 42.9 ± 3.3 | 0.664 | |
| Median (min–max) | 43.2 (38.1–48.2) | 43.7 (32.5–48.5) | 42.1 (36–48.6) | ||
| Temporal | |||||
| Mean ± SD | 43.1 ± 2.1 | 42 ± 3.4 | 41.8 ± 3 | 0.339 | |
| Median (min–max) | 43.2 (39.6–47) | 42.6 (34.6–47.4) | 42.1 (35.8–47.5) | ||
| Control (1) | PES (2) | PXG (3) | p-Value | ||
|---|---|---|---|---|---|
| (n = 25) | (n = 30) | (n = 25) | |||
| Biomarkers | |||||
| MDA | |||||
| Mean ± SD | 12.3 ± 2.4 | 17.8 ± 5.3 | 20 ± 3.1 | <0.001 * | 1–2; 1–3 |
| Median (min–max) | 12.8 (7.7–16.4) | 18.1 (9.3–34.8) | 19.4 (14.7–29.5) | ||
| GSH | |||||
| Mean ± SD | 0.4 ± 0.1 | 0.2 ± 0.1 | 0.2 ± 0.1 | <0.001* | 1–2; 1–3 |
| Median (min–max) | 0.4 (0.2–0.9) | 0.2 (0.1–0.4) | 0.2 (0.1–0.4) | ||
| IL-6 | |||||
| Mean ± SD | 1.2 ± 1.3 | 2.9 ± 1.6 | 1.2 ± 0.7 | <0.001 * | 1–2; 2–3 |
| Median (min–max) | 0.7 (0–4.5) | 2.9 (0.6–7.4) | 1.1 (0.3–4.1) | ||
| NO | |||||
| Mean ± SD | 0.1 ± 0 | 0.1 ± 0 | 0.1 ± 0 | 0.821 | |
| Median (min–max) | 0.1 (0.1–0.2) | 0.1 (0.1–0.2) | 0.1 (0.1–0.3) | ||
| iNOS | |||||
| Mean ± SD | 4 ± 1.5 | 6 ± 0.8 | 8 ± 1.1 | <0.001 * | 1–2; 1–3; 2–3 |
| Median (min–max) | 4 (0.6–6.3) | 6.2 (3.3–6.8) | 8.3 (4.1–8.7) | ||
| Galectin-3 | |||||
| Mean ± SD | 5 ± 2.9 | 7.3 ± 2 | 11.7 ± 1.1 | <0.001 * | 1–3; 2–3 |
| Median (min–max) | 4.2 (1–9.8) | 7.5 (1.1–11.2) | 11.7 (9.4–13.4) | ||
| SCUBE-1 | |||||
| Mean ± SD | 1.4 ± 0.5 | 1.4 ± 0.7 | 2.9 ± 0.6 | <0.001 * | 1–3; 2–3 |
| Median (min–max) | 1.5 (0.6–2.2) | 1.3 (0.1–3.4) | 2.8 (1.4–4.1) |
| Age | MDA | GSH | IL-6 | NO | iNOS | Galectin-3 | SCUBE-1 | ||
|---|---|---|---|---|---|---|---|---|---|
| Retinal Nerve Fiber Layer Thickness | |||||||||
| Average | r | −0.116 | 0.067 | 0.267 | 0.104 | −0.060 | 0.336 | 0.198 | 0.140 |
| p | 0.542 | 0.726 | 0.154 | 0.585 | 0.753 | 0.069 | 0.295 | 0.459 | |
| Inferior | r | −0.020 | −0.111 | 0.068 | −0.210 | −0.130 | 0.144 | 0.015 | 0.095 |
| p | 0.915 | 0.561 | 0.719 | 0.265 | 0.494 | 0.447 | 0.937 | 0.619 | |
| Superior | r | −0.091 | 0.179 | 0.109 | 0.120 | −0.233 | 0.114 | 0.076 | 0.182 |
| p | 0.631 | 0.343 | 0.565 | 0.527 | 0.214 | 0.549 | 0.690 | 0.337 | |
| Nasal | r | −0.101 | 0.145 | 0.062 | 0.114 | −0.036 | −0.453 | −0.007 | −0.383 |
| p | 0.596 | 0.445 | 0.745 | 0.547 | 0.848 | 0.012 | 0.971 | 0.037 | |
| Temporal | r | −0.147 | 0.020 | 0.188 | −0.001 | 0.069 | 0.137 | 0.048 | 0.156 |
| p | 0.439 | 0.918 | 0.319 | 0.994 | 0.716 | 0.470 | 0.801 | 0.410 | |
| Peripapillary Choroidal Thickness | |||||||||
| Nasal | r | 0.157 | −0.106 | 0.065 | 0.268 | 0.105 | 0.072 | 0.152 | 0.171 |
| p | 0.408 | 0.577 | 0.731 | 0.152 | 0.582 | 0.704 | 0.422 | 0.365 | |
| Superonasal | r | 0.151 | −0.143 | 0.089 | 0.210 | 0.063 | 0.124 | 0.226 | −0.040 |
| p | 0.425 | 0.450 | 0.640 | 0.264 | 0.740 | 0.514 | 0.231 | 0.833 | |
| Superotemporal | r | 0.049 | 0.168 | 0.276 | 0.137 | −0.015 | 0.043 | 0.344 | 0.198 |
| p | 0.796 | 0.375 | 0.140 | 0.471 | 0.937 | 0.821 | 0.063 | 0.294 | |
| Temporal | r | 0.056 | 0.186 | 0.182 | 0.124 | 0.069 | 0.087 | 0.317 | 0.123 |
| p | 0.769 | 0.325 | 0.335 | 0.515 | 0.718 | 0.648 | 0.088 | 0.518 | |
| Inferotemporal | r | 0.231 | 0.085 | 0.053 | 0.172 | 0.050 | −0.091 | 0.189 | 0.088 |
| p | 0.220 | 0.617 | 0.783 | 0.363 | 0.763 | 0.633 | 0.318 | 0.645 | |
| Inferonasal | r | 0.016 | 0.067 | 0.439 | 0.109 | −0.013 | 0.094 | 0.176 | 0.006 |
| p | 0.935 | 0.725 | 0.015 | 0.565 | 0.956 | 0.620 | 0.351 | 0.976 | |
| Macular Choroidal Thickness | |||||||||
| Subfoveal | r | −0.245 | 0.313 | 0.441 | 0.209 | −0.183 | 0.116 | 0.163 | 0.044 |
| p | 0.192 | 0.092 | 0.015 | 0.268 | 0.334 | 0.541 | 0.389 | 0.818 | |
| Inner Temporal | r | −0.176 | 0.348 | 0.415 | 0.062 | −0.040 | −0.072 | −0.450 | 0.124 |
| p | 0.352 | 0.060 | 0.022 | 0.744 | 0.816 | 0.707 | 0.013 | 0.513 | |
| Outer Temporal | r | −0.196 | 0.322 | 0.420 | 0.026 | −0.041 | −0.098 | −0.457 | 0.125 |
| p | 0.299 | 0.082 | 0.021 | 0.892 | 0.828 | 0.606 | 0.011 | 0.510 | |
| Inner Nasal | r | −0.177 | 0.236 | 0.146 | −0.268 | 0.046 | 0.059 | 0.102 | −0.070 |
| p | 0.350 | 0.209 | 0.445 | 0.153 | 0.809 | 0.756 | 0.593 | 0.711 | |
| Outer Nasal | r | −0.102 | 0.152 | 0.256 | −0.023 | 0.069 | 0.002 | 0.230 | 0.087 |
| p | 0.592 | 0.423 | 0.473 | 0.903 | 0.717 | 0.993 | 0.222 | 0.648 | |
| Superficial Vessel Density | |||||||||
| Foveal | r | 0.046 | −0.538 | −0.063 | 0.075 | −0.080 | −0.163 | −0.128 | 0.268 |
| p | 0.810 | 0.002 | 0.741 | 0.694 | 0.674 | 0.389 | 0.501 | 0.153 | |
| Inferior | r | 0.009 | −0.172 | 0.270 | −0.191 | −0.172 | 0.033 | 0.196 | −0.096 |
| p | 0.963 | 0.363 | 0.150 | 0.313 | 0.364 | 0.863 | 0.299 | 0.615 | |
| Superior | r | −0.260 | −0.008 | 0.453 | −0.057 | −0.016 | 0.110 | −0.423 | −0.108 |
| p | 0.166 | 0.966 | 0.012 | 0.765 | 0.934 | 0.563 | 0.020 | 0.569 | |
| Nasal | r | 0.023 | −0.350 | 0.227 | −0.113 | 0.043 | 0.286 | 0.297 | −0.228 |
| p | 0.903 | 0.058 | 0.228 | 0.553 | 0.823 | 0.126 | 0.111 | 0.226 | |
| Temporal | r | 0.111 | −0.060 | 0.267 | −0.089 | −0.065 | 0.056 | 0.300 | 0.043 |
| p | 0.560 | 0.752 | 0.153 | 0.642 | 0.733 | 0.768 | 0.107 | 0.821 | |
| Deep Vessel Density | |||||||||
| Foveal | r | 0.069 | −0.451 | 0.006 | 0.045 | −0.047 | −0.032 | −0.181 | 0.134 |
| p | 0.717 | 0.012 | 0.973 | 0.814 | 0.807 | 0.866 | 0.339 | 0.480 | |
| Inferior | r | −0.247 | 0.304 | 0.252 | −0.068 | −0.213 | 0.061 | 0.200 | −0.056 |
| p | 0.188 | 0.103 | 0.179 | 0.721 | 0.259 | 0.751 | 0.288 | 0.770 | |
| Superior | r | −0.295 | 0.064 | 0.196 | −0.058 | 0.075 | −0.396 | −0.398 | 0.034 |
| p | 0.113 | 0.737 | 0.298 | 0.760 | 0.695 | 0.030 | 0.029 | 0.858 | |
| Nasal | r | −0.184 | −0.049 | 0.069 | −0.083 | −0.099 | −0.058 | 0.133 | −0.142 |
| p | 0.331 | 0.796 | 0.719 | 0.664 | 0.602 | 0.760 | 0.485 | 0.455 | |
| Temporal | r | −0.130 | 0.264 | 0.330 | −0.143 | −0.182 | 0.010 | 0.260 | 0.097 |
| p | 0.495 | 0.158 | 0.075 | 0.451 | 0.336 | 0.959 | 0.166 | 0.611 | |
| Age | MDA | GSH | IL-6 | NO | iNOS | Galectin-3 | SCUBE-1 | ||
|---|---|---|---|---|---|---|---|---|---|
| Retinal Nerve Fiber Layer Thickness | |||||||||
| Average | r | 0.102 | 0.275 | −0.219 | −0.145 | 0.166 | −0.358 | 0.106 | 0.082 |
| p | 0.626 | 0.183 | 0.293 | 0.488 | 0.429 | 0.079 | 0.616 | 0.697 | |
| Inferior | r | −0.151 | 0.201 | −0.096 | −0.201 | 0.082 | −0.154 | 0.035 | −0.053 |
| p | 0.472 | 0.335 | 0.648 | 0.336 | 0.696 | 0.461 | 0.869 | 0.803 | |
| Superior | r | 0.019 | 0.184 | −0.270 | 0.002 | 0.240 | −0.282 | −0.048 | −0.120 |
| p | 0.930 | 0.378 | 0.191 | 0.992 | 0.247 | 0.173 | 0.821 | 0.567 | |
| Nasal | r | 0.001 | 0.114 | −0.311 | −0.247 | 0.260 | −0.403 | −0.116 | 0.058 |
| p | 0.995 | 0.587 | 0.130 | 0.234 | 0.209 | 0.046 | 0.580 | 0.784 | |
| Temporal | r | 0.261 | 0.285 | −0.284 | −0.116 | 0.186 | −0.072 | 0.076 | 0.263 |
| p | 0.207 | 0.168 | 0.169 | 0.580 | 0.374 | 0.732 | 0.717 | 0.204 | |
| Peripapillary Choroidal Thickness | |||||||||
| Nasal | r | −0.311 | −0.101 | 0.411 | −0.472 | 0.264 | 0.145 | 0.186 | 0.015 |
| p | 0.131 | 0.632 | 0.041 | 0.017 | 0.202 | 0.491 | 0.372 | 0.945 | |
| Superonasal | r | −0.218 | −0.206 | 0.651 | −0.294 | 0.421 | 0.110 | 0.114 | −0.001 |
| p | 0.296 | 0.323 | 0.002 | 0.154 | 0.036 | 0.600 | 0.587 | 0.995 | |
| Superotemporal | r | −0.088 | −0.644 | 0.419 | 0.095 | −0.088 | 0.012 | 0.095 | 0.080 |
| p | 0.674 | 0.001 | 0.037 | 0.651 | 0.674 | 0.953 | 0.652 | 0.703 | |
| Temporal | r | −0.118 | −0.318 | 0.529 | 0.091 | 0.342 | −0.031 | −0.004 | −0.040 |
| p | 0.575 | 0.121 | 0.006 | 0.674 | 0.094 | 0.885 | 0.986 | 0.848 | |
| Inferotemporal | r | −0.323 | −0.128 | 0.137 | 0.266 | 0.445 | −0.118 | 0.012 | 0.028 |
| p | 0.115 | 0.543 | 0.514 | 0.198 | 0.026 | 0.573 | 0.953 | 0.893 | |
| Inferonasal | r | −0.379 | −0.153 | 0.180 | 0.136 | 0.624 | 0.103 | −0.089 | 0.012 |
| p | 0.062 | 0.466 | 0.390 | 0.518 | 0.001 | 0.623 | 0.674 | 0.956 | |
| Macular Choroidal Thickness | |||||||||
| Subfoveal | r | −0.287 | −0.190 | 0.200 | −0.073 | −0.010 | −138 | 0.247 | 0.032 |
| p | 0.165 | 0.364 | 0.364 | 0.727 | 0.963 | 0.509 | 0.234 | 0.879 | |
| Inner Temporal | r | −0.459 | −0.311 | 0.166 | −0.089 | 0.083 | −0.243 | 0.242 | 0.001 |
| p | 0.021 | 0.130 | 0.429 | 0.674 | 0.694 | 0.242 | 0.224 | 0.996 | |
| Outer Temporal | r | −0.448 | −0.263 | 0.268 | −0.139 | 0.184 | −0.211 | 0.258 | 0.016 |
| p | 0.025 | 0.205 | 0.195 | 0.507 | 0.380 | 0.311 | 0.212 | 0.938 | |
| Inner Nasal | r | −0.184 | −0.240 | 0.527 | −0.120 | 0.204 | 0.078 | 0.329 | −0.014 |
| p | 0.379 | 0.247 | 0.007 | 0.568 | 0.328 | 0.709 | 0.108 | 0.945 | |
| Outer Nasal | r | −0.129 | −0.327 | 0.738 | −0.152 | 0.437 | −0.179 | 0.333 | −0.021 |
| p | 0.538 | 0.110 | 0.001 | 0.468 | 0.029 | 0.593 | 0.104 | 0.919 | |
| Superficial Vessel Density | |||||||||
| Foveal | r | 0.043 | −0.375 | 0.188 | 0.304 | −0.479 | 0.066 | 0.181 | −0.020 |
| p | 0.839 | 0.065 | 0.368 | 0.140 | 0.015 | 0.753 | 0.387 | 0.924 | |
| Inferior | r | −0.145 | −0.277 | −0.020 | −0.006 | 0.091 | −0.386 | 0.100 | −0.117 |
| p | 0.488 | 0.180 | 0.924 | 0.978 | 0.665 | 0.057 | 0.636 | 0.578 | |
| Superior | r | 0.145 | −0.571 | −0.054 | 0.137 | 0.179 | −0.298 | −0.292 | 0.189 |
| p | 0.488 | 0.003 | 0.798 | 0.514 | 0.392 | 0.148 | 0.157 | 0.365 | |
| Nasal | r | −0.072 | −0.372 | 0.008 | −0.024 | 0.081 | −0.624 | 0.044 | 0.078 |
| p | 0.734 | 0.067 | 0.968 | 0.910 | 0.702 | 0.001 | 0.835 | 0.711 | |
| Temporal | r | 0.105 | −0.394 | 0.240 | 0.163 | 0.030 | −0.305 | −0.050 | −0.112 |
| p | 0.619 | 0.051 | 0.248 | 0.437 | 0.888 | 0.139 | 0.812 | 0.595 | |
| Deep Vessel Density | |||||||||
| Foveal | r | −0.023 | −0.481 | −0.013 | 0.421 | −0.074 | −0.454 | 0.254 | 0.055 |
| p | 0.912 | 0.015 | 0.951 | 0.063 | 0.726 | 0.023 | 0.221 | 0.794 | |
| Inferior | r | −0.023 | −0.434 | −0.169 | 0.250 | −0.263 | −0.393 | −0.129 | −0.192 |
| p | 0.912 | 0.030 | 0.420 | 0.228 | 0.203 | 0.052 | 0.539 | 0.357 | |
| Superior | r | −0.042 | −0.377 | −0.122 | 0.291 | −0.044 | −0.515 | −0.045 | −0.168 |
| p | 0.843 | 0.063 | 0.562 | 0.158 | 0.835 | 0.008 | 0.829 | 0.422 | |
| Nasal | r | −0.084 | −0.076 | 0.140 | −0.212 | 0.062 | −0.077 | 0.059 | 0.103 |
| p | 0.689 | 0.718 | 0.505 | 0.310 | 0.769 | 0.716 | 0.779 | 0.623 | |
| Temporal | r | −0.086 | −0.507 | 0.073 | −0.086 | −0.201 | 0.013 | −0.102 | −0.108 |
| p | 0.683 | 0.010 | 0.730 | 0.682 | 0.336 | 0.952 | 0.629 | 0.607 | |
| Coefficients | |||||||
|---|---|---|---|---|---|---|---|
| Model | Unstandardized Coefficients | Standardized Coefficients | 95% Confidence Interval | ||||
| Retinal Nerve Fiber Layer Thickness (R2: 0.471; p = 0.049) | |||||||
| β | Standard Error | Β | t-Value | p-Value | Lower Bound | Upper Bound | |
| Constant | 75.949 | 29.762 | 2.552 | 0.02 | 13.422 | 138.476 | |
| iNOS | −5.816 | 2.483 | −0.561 | −2.342 | 0.031 | −11.031 | −0.6 |
| SCUBE-1 | −0.638 | 3.286 | −0.023 | −0.132 | 0.897 | −7.017 | 8.293 |
| IL-6 | −4.877 | 3.358 | −0.319 | −1.516 | 0.146 | −12.16 | 1.951 |
| Galectin-3 | −1.201 | 2.203 | −0.119 | −0.545 | 0.592 | −5.829 | 3.426 |
| MDA | 1.377 | 0.715 | 0.421 | 1.927 | 0.07 | −0.124 | 2.878 |
| GSH | 4.071 | 37.232 | 0.026 | 0.109 | 0.914 | −74.152 | 82.293 |
| Peripapillary Choroidal Thickness (R2: 0.726; p = 0.562) | |||||||
| Constant | 29.153 | 58.636 | 0.497 | 0.625 | −129.753 | 200.075 | |
| iNOS | −0.118 | 4.747 | −0.006 | −0.025 | 0.980 | −13.390 | 14.122 |
| SCUBE-1 | 0.041 | 7.134 | 0.001 | 0.006 | 0.995 | −17.234 | 23.144 |
| IL-6 | −0.053 | 6.557 | −0.002 | −0.008 | 0.994 | −14.106 | 23.111 |
| Galectin-3 | 0.730 | 4.300 | 0.037 | 0.170 | 0.867 | −10.171 | 14.238 |
| MDA | 3.712 | 1.575 | 0.525 | 2.356 | 0.060 | −1.958 | 5.960 |
| GSH | −45.056 | 73.646 | −0.150 | −0.613 | 0.547 | −299.006 | 113.616 |
| Macular Choroidal Thickness (R2: 0.726; p = 0.486) | |||||||
| Constant | 106.463 | 68.834 | 1.547 | 0.139 | −33.115 | 249.174 | |
| iNOS | −4.232 | 5.572 | −0.178 | −0.759 | 0.457 | −16.717 | 6.829 |
| SCUBE-1 | −0.738 | 8.374 | −0.017 | −0.088 | 0.931 | −17.015 | 17.544 |
| IL-6 | −5.765 | 7.697 | −0.157 | −0.749 | 0.464 | −23.043 | 8.810 |
| Galectin-3 | 7.932 | 5.048 | 0.343 | 1.571 | 0.134 | −2.759 | 18.132 |
| MDA | 2.009 | 1.849 | 0.240 | 1.086 | 0.292 | −1.310 | 5.467 |
| GSH | −115.145 | 86.254 | −0.324 | −1.335 | 0.199 | −288.484 | 64.665 |
| Superficial Vessel Density (R2: 0.662; p = 0.002) | |||||||
| Constant | 39.741 | 2.871 | 13.844 | <0.001 | 33.710 | 45.772 | |
| iNOS | −0.786 | 0.232 | −0.570 | −3.382 | 0.003 | −1.274 | −0.298 |
| SCUBE-1 | 0.016 | 0.349 | 0.006 | 0.045 | 0.964 | −0.718 | 0.750 |
| IL-6 | −0.206 | 0.321 | −0.097 | −0.641 | 0.530 | −0.880 | 0.469 |
| Galectin-3 | 0.101 | 0.211 | 0.075 | 0.478 | 0.638 | −0.342 | 0.543 |
| MDA | −0.246 | 0.077 | −0.507 | −3.187 | 0.005 | −0.408 | −0.084 |
| GSH | 3.069 | 3.597 | 0.149 | 0.853 | 0.405 | −4.486 | 10.626 |
| Deep Vessel Density (R2: 0.726; p = 0.022) | |||||||
| Constant | 46.218 | 4.308 | 10.729 | <0.001 | 37.167 | 55.269 | |
| iNOS | −0.977 | 0.349 | −0.559 | −2.802 | 0.012 | −1.710 | −0.245 |
| SCUBE-1 | 0.050 | 0.524 | 0.016 | 0.096 | 0.925 | −1.051 | 1.151 |
| IL-6 | −0.786 | 0.482 | −0.291 | −1.633 | 0.120 | −1.798 | 0.226 |
| Galectin-3 | −0.100 | 0.316 | −0.059 | −0.316 | 0.755 | −0.764 | 0.564 |
| MDA | −0.261 | 0.116 | −0.423 | −2.251 | 0.037 | −0.504 | −0.017 |
| GSH | 0.903 | 5.398 | 0.034 | 0.167 | 0.869 | −10.438 | 12.244 |
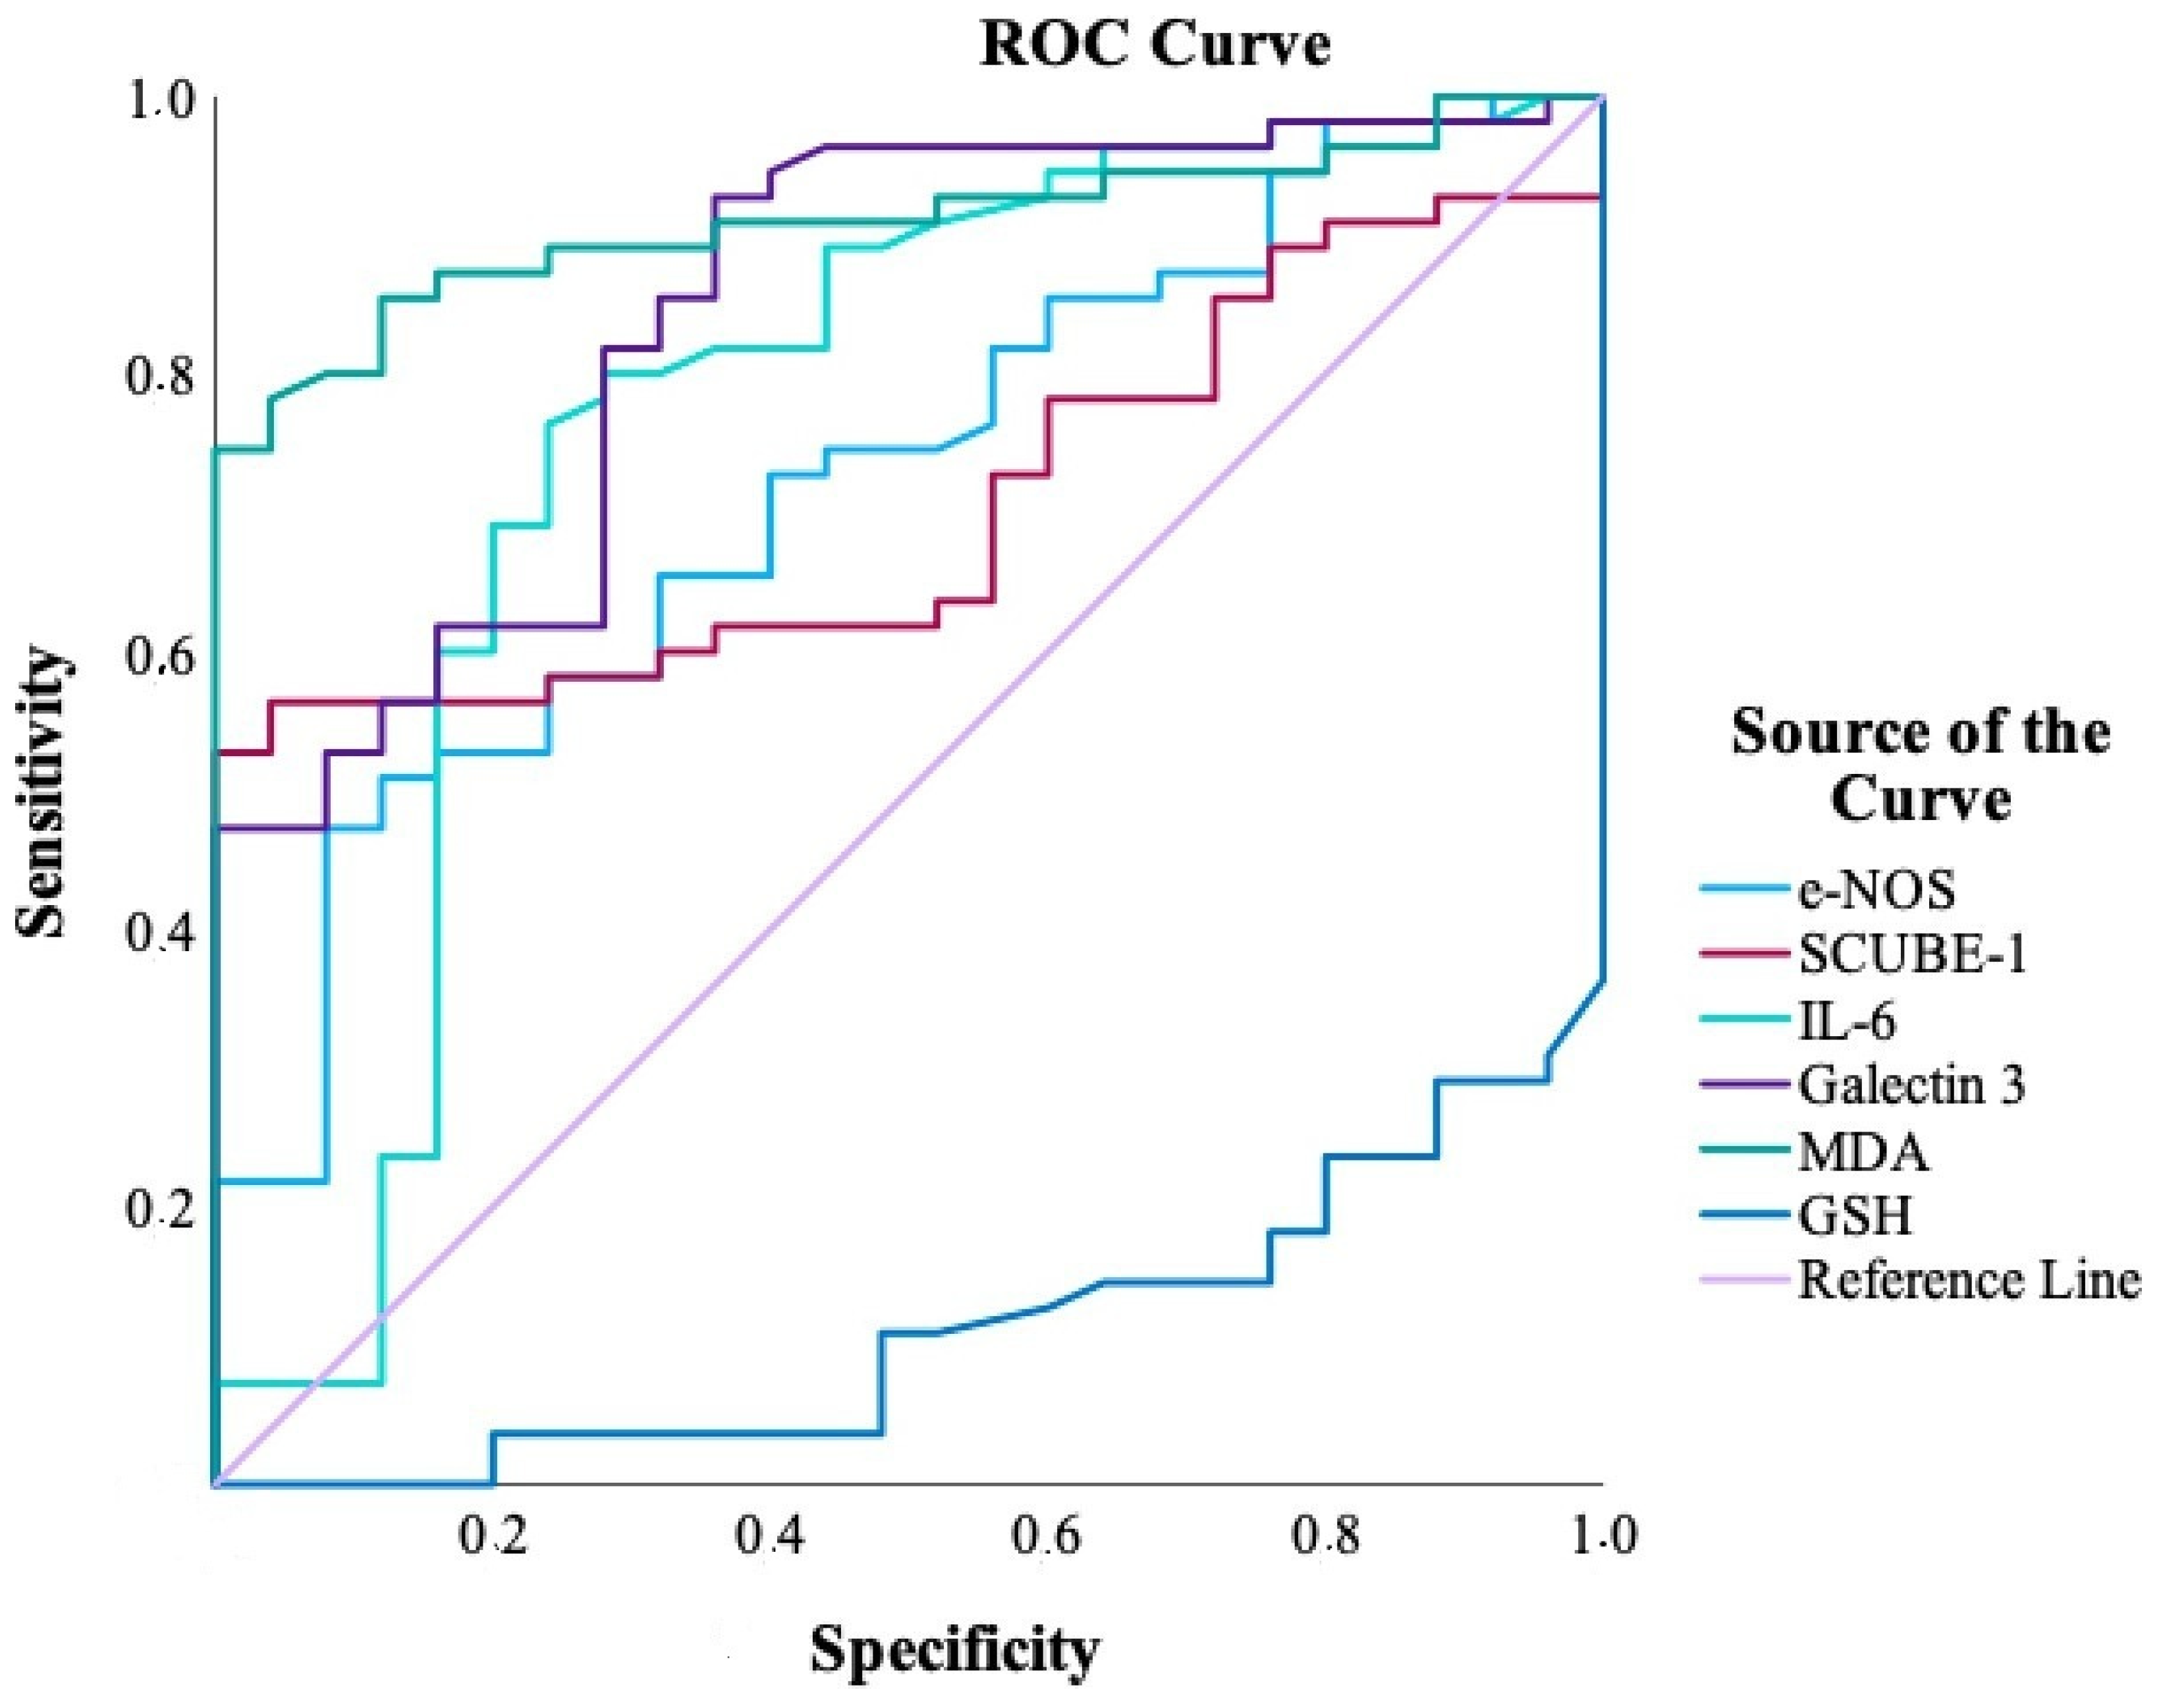
| Biomarker | AUC (95% CI) | p Value | Cut-Off | Sensitivity (%) | Specificity (%) |
|---|---|---|---|---|---|
| MDA | 0.909 (0.846–0.973) | <0.001 | >16.36 | 74.5 | 100.0 |
| GSH | 0.890 (0.822–0.958) | <0.001 | ≤0.25 | 70.9 | 96.0 |
| Galectin-3 | 0.843 (0.752–0.933) | <0.001 | >6.12 | 92.7 | 64.0 |
| IL-6 | 0.766 (0.637–0.895) | <0.001 | >0.98 | 76.4 | 76.0 |
| iNOS | 0.723 (0.609–0.838) | 0.001 | >5.81 | 47.3 | 92.0 |
| SCUBE-1 | 0.705 (0.594–0.816) | 0.003 | >2.22 | 52.7 | 100.0 |
Disclaimer/Publisher’s Note: The statements, opinions and data contained in all publications are solely those of the individual author(s) and contributor(s) and not of MDPI and/or the editor(s). MDPI and/or the editor(s) disclaim responsibility for any injury to people or property resulting from any ideas, methods, instructions or products referred to in the content. |
© 2025 by the authors. Licensee MDPI, Basel, Switzerland. This article is an open access article distributed under the terms and conditions of the Creative Commons Attribution (CC BY) license (https://creativecommons.org/licenses/by/4.0/).
Share and Cite
Satilmaz, M.F.; Uzun, F.; Findik, H.; Atak, M.; Kaim, M.; Okutucu, M.; Aslan, M.G. Association of Inflammatory and Ischemic Markers with Posterior Segment Parameters in Pseudoexfoliation Syndrome and Glaucoma. J. Clin. Med. 2025, 14, 3833. https://doi.org/10.3390/jcm14113833
Satilmaz MF, Uzun F, Findik H, Atak M, Kaim M, Okutucu M, Aslan MG. Association of Inflammatory and Ischemic Markers with Posterior Segment Parameters in Pseudoexfoliation Syndrome and Glaucoma. Journal of Clinical Medicine. 2025; 14(11):3833. https://doi.org/10.3390/jcm14113833
Chicago/Turabian StyleSatilmaz, Muhammed Fatih, Feyzahan Uzun, Hüseyin Findik, Mehtap Atak, Muhammet Kaim, Murat Okutucu, and Mehmet Gökhan Aslan. 2025. "Association of Inflammatory and Ischemic Markers with Posterior Segment Parameters in Pseudoexfoliation Syndrome and Glaucoma" Journal of Clinical Medicine 14, no. 11: 3833. https://doi.org/10.3390/jcm14113833
APA StyleSatilmaz, M. F., Uzun, F., Findik, H., Atak, M., Kaim, M., Okutucu, M., & Aslan, M. G. (2025). Association of Inflammatory and Ischemic Markers with Posterior Segment Parameters in Pseudoexfoliation Syndrome and Glaucoma. Journal of Clinical Medicine, 14(11), 3833. https://doi.org/10.3390/jcm14113833