
Impact of SARS-CoV-2 on Aerobic and Anaerobic Capacity in Professional Ice Hockey Players
 , , , , ,
  ,
,  , , and
Abstract
1. Introduction
2. Materials and Methods
2.1. Participants
2.2. Research Design
2.3. Statistical Analyses
3. Results
4. Discussion
Study Limitations
5. Conclusions
Author Contributions
Funding
Institutional Review Board Statement
Informed Consent Statement
Data Availability Statement
Conflicts of Interest
References
- Carey, D.G.; Drake, M.M.; Pliego, G.J.; Raymond, R.L. Do hockey players need aerobic fitness? Relation between VO₂MAX and fatigue during high-intensity intermittent ice skating. J. Strength Cond. Res. 2007, 21, 963–966. [Google Scholar] [PubMed]
- Cox, M.H.; Miles, D.S.; Verde, T.J.; Rhodes, E.C. Applied physiology of ice hockey. Sports Med. 1995, 19, 184–201. [Google Scholar] [CrossRef]
- Hvidberg, C. Steady-state thermomechanical modelling of ice flow near the centre of large ice sheets with the finite-element technique. Ann. Glaciol. 1996, 23, 116–123. [Google Scholar] [CrossRef]
- Montgomery, D.L.; Lockwood, K. Physiological profile of professional hockey players—A longitudinal comparison. Appl. Physiol. Nutr. Metab. 2006, 31, 181–185. [Google Scholar] [CrossRef] [PubMed]
- Quinney, H.A.; Dewart, R.; Game, A.; Snydmiller, G.; Warburton, D.; Bell, G. A 26-year physiological description of a National Hockey League team. Appl. Physiol. Nutr. Metab. 2008, 33, 753–760. [Google Scholar] [CrossRef] [PubMed]
- Green, M.; Pivarnik, J.; Carrier, D.; Womack, C. Relationship between physiological profiles and on-ice performance of a national collegiate athletic association division i hockey team. J. Strength Cond. Res. 2006, 20, 43–46. [Google Scholar] [CrossRef]
- Roczniok, R.; Stanula, A.; Gabryś, T.; Szmatlan-Gabryś, U.; Gołaś, A.; Stastny, P. Physical fitness and performance of Polish ice-hockey players competing at different sports levels. J. Hum. Kinet. 2016, 51, 201–208. [Google Scholar] [CrossRef]
- Rice, M.; Warburton, D.; Gaytán-González, A.; Jamnik, V.; Kaufman, K.; Warburton, D.; Souster, M.; Bredin, S. The relationship between off-ice testing and on-ice performance in male youth Ice hockey players. Front. Sports Act. Living 2024, 6, 1418713. [Google Scholar] [CrossRef]
- Stanula, A.; Roczniok, R. Game intensity analysis of elite adolescent ice hockey players. J. Hum. Kinet. 2014, 44, 211–221. [Google Scholar] [CrossRef]
- Vescovi, J.D.; Murray, T.M.; Fiala, K.A.; Vanheest, J.L. Off-ice performance and draft status of elite ice hockey players. Int. J. Sports Physiol. Perform. 2006, 1, 207–221. [Google Scholar] [CrossRef]
- Stanula, A.; Gabryś, T.; Roczniok, R.; Szmatlan-Gabryś, U.; Ozimek, M.; Mostowik, A. Quantification of the demands during an ice-hockey game based on intensity zones determined from the incremental test outcomes. J. Strength Cond. Res. 2016, 30, 176–183. [Google Scholar] [CrossRef] [PubMed]
- Stastny, P.; Tufano, J.J.; Kregl, J.; Petr, M.; Blazek, D.; Steffl, M.; Roczniok, R.; Fiala, M.; Gołas, A.; Zmijewski, P. The role of visual feedback on power output during intermittent Wingate testing in ice hockey players. Sports 2018, 6, 32. [Google Scholar] [CrossRef] [PubMed]
- Montgomery, D.L. Physiology of ice hockey. Sports Med. 1988, 5, 99–126. [Google Scholar] [CrossRef]
- Shang, W.; Yang, Y.; Rao, Y.; Rao, X. The outbreak of SARS-CoV-2 pneumonia calls for viral vaccines. NPJ Vaccines 2020, 5, 18. [Google Scholar] [CrossRef]
- WHO. Coronavirus Disease 2019 (COVID-19): Situation Report—41. 29 March 2020. Available online: https://www.who.int/docs/default-source/coronaviruse/situation-reports/20200301-sitrep-41-covid-19.pdf (accessed on 25 March 2022).
- Li, R.; Pei, S.; Chen, B.; Song, Y.; Zhang, T.; Yang, W.; Shaman, J. Substantial undocumented infection facilitates the rapid dissemination of novel coronavirus (SARS-CoV-2). Science 2020, 368, 489–493. [Google Scholar] [CrossRef] [PubMed]
- Li, Q.; Guan, X.; Wu, P.; Wang, X.; Zhou, L.; Tong, Y.; Ren, R.; Leung, K.S.M.; Lau, E.H.Y.; Wong, J.Y.; et al. Early transmission dynamics in Wuhan, China, of novel coronavirus–infected pneumonia. N. Engl. J. Med. 2020, 382, 1199–1207. [Google Scholar] [CrossRef]
- Huang, C.; Wang, Y.; Li, X.; Ren, L.; Zhao, J.; Hu, Y.; Zhang, L.; Fan, G.; Xu, J.; Gu, X.; et al. Clinical features of patients infected with 2019 novel coronavirus in Wuhan, China. Lancet 2020, 395, 497–506. [Google Scholar] [CrossRef]
- Wan, Y.; Shang, J.; Graham, R.; Baric, R.S.; Li, F. Receptor recognition by the novel coronavirus from Wuhan: An analysis based on decade-long structural studies of SARS coronavirus. J. Virol. 2020, 94, e00127-20. [Google Scholar] [CrossRef]
- Lu, R.; Zhao, X.; Li, J.; Niu, P.; Yang, B.; Wu, H.; Wang, W.; Song, H.; Huang, B.; Zhu, N.; et al. Genomic characterisation and epidemiology of 2019 novel coronavirus: Implications for virus origins and receptor binding. Lancet 2020, 395, 565–574. [Google Scholar] [CrossRef]
- Ren, L.-L.; Wang, Y.-M.; Wu, Z.-Q.; Xiang, Z.-C.; Guo, L.; Xu, T.; Jiang, Y.-Z.; Xiong, Y.; Li, Y.-J.; Li, X.-W.; et al. Identification of a novel coronavirus causing severe pneumonia in humans: A descriptive study. Chin. Med. J. 2020, 133, 1015–1024. [Google Scholar] [CrossRef]
- Zou, L.; Ruan, F.; Huang, M.; Liang, L.; Huang, H.; Hong, Z.; Yu, J.; Kang, M.; Song, Y.; Xia, J.; et al. SARS-CoV-2 viral load in upper respiratory specimens of infected patients. N. Engl. J. Med. 2020, 382, 1175–1177. [Google Scholar] [CrossRef]
- Kuipers, H.; Verstappen, F.T.J.; Keizer, H.A.; Geurten, P.; van Kranenburg, G. Variability of aerobic performance in the laboratory and its physiologic correlates. Int. J. Sports Med. 1985, 6, 197–201. [Google Scholar] [CrossRef]
- Durocher, J.J.; Leetun, D.T.; Carter, J.R. Sport-specific assessment of lactate threshold and aerobic capacity throughout a collegiate hockey season. Appl. Physiol. Nutr. Metab. 2008, 33, 1165–1171. [Google Scholar] [CrossRef] [PubMed]
- Tesch, P.A.; Wright, J.E. Recovery from short term intense exercise: Its relation to capillary supply and blood lactate concentration. Eur. J. Appl. Physiol. Occup. Physiol. 1983, 52, 98–103. [Google Scholar] [CrossRef]
- Colliander, E.B.; Dudley, G.A.; Tesch, P.A. Skeletal muscle fiber type composition and performance during repeated bouts of maximal, concentric contractions. Eur. J. Appl. Physiol. 1988, 58, 81–86. [Google Scholar] [CrossRef] [PubMed]
- Karakoç, B.; Akalan, C.; Alemdaroğlu, U.; Arslan, E. The relationship between the Yo-Yo tests, anaerobic performance and aerobic performance in young soccer players. J. Hum. Kinet. 2012, 35, 81–88. [Google Scholar] [CrossRef] [PubMed]
- McMahon, S. The relationship between aerobic fitness and both power output and subsequent recovery during maximal intermittent exercise. J. Sci. Med. Sport 1998, 1, 219–227. [Google Scholar] [CrossRef]
- Takahashi, H.; Inaki, M.; Fujimoto, K.; Katsuta, S.; Anno, I.; Nitsu, M.; Itai, Y. Control of the rate of phosphocreatine resynthesis after exercise in trained and untrained human quadriceps muscles. Eur. J. Appl. Physiol. Occup. Physiol. 1995, 71, 396–404. [Google Scholar] [CrossRef]
- Yagüe, P.L.; Del Valle, M.E.; Egocheaga, J.; Linnamo, V.; Fernández, A. The competitive demands of elite male rink hockey. Biol. Sport 2013, 30, 195–199. [Google Scholar] [CrossRef]
- Tomlin, D.L.; Wenger, H.A. The Relationship Between Aerobic Fitness and Recovery from High Intensity Intermittent Exercise. Sports Med. 2001, 31, 1–11. [Google Scholar] [CrossRef]
- Holloszy, J.O.; Coyle, E.F. Adaptations of skeletal muscle to endurance exercise and their metabolic consequences. J. Appl. Physiol. 2016, 121, 831–838. [Google Scholar] [CrossRef] [PubMed]
- Gharbi, Z.; Dardouri, W.; Haj-Sassi, R.; Castagna, C.; Chamari, K.; Souissi, N. Effect of the number of sprint repetitions on the variation of blood lactate concentration in repeated sprint sessions. Biol. Sport 2014, 31, 151–156. [Google Scholar] [CrossRef] [PubMed]
- Gibala, M.J.; Little, J.P.; van Essen, M.; Wilkin, G.P.; Burgomaster, K.A.; Safdar, A.; Raha, S.; Tarnopolsky, M.A. Short-term sprint interval versus traditional endurance training: Similar initial adaptations in human skeletal muscle and exercise performance. J. Physiol. 2006, 575, 901–911. [Google Scholar] [CrossRef] [PubMed]
- Green, H.J. Glycogen depletion patterns during continuous and intermittent ice skating. Med. Sci. Sports 1978, 10, 183–187. [Google Scholar]
- Page, E.M.; Ariëns, R.A.S. Mechanisms of thrombosis and cardiovascular complications in COVID-19. Thromb. Res. 2021, 200, 1–8. [Google Scholar] [CrossRef]


| Study Time | Variable | Group | ||
|---|---|---|---|---|
| NSG (n = 28) | CG (n = 13) | WSG (n = 9) SpO2 < 90% | ||
| M ± SD | M ± SD | M ± SD | ||
| Before the preparation period 2020/2021 | Height | 184 ± 6.17 | 184.49 ± 5.20 | 181.96 ± 5.69 |
| Weight | 86.08 ± 7.41 | 87.63 ± 6.01 | 85.47 ± 6.60 | |
| % PBF | 15.49 ± 4.72 | 15.48 ± 3.28 | 15.81 ± 4.18 | |
| After the preparatory period 2020/2021 | Height | 184 ± 6.17 | 184.49 ± 5.20 | 181.96 ± 5.69 |
| Weight | 85.04 ± 7.38 | 86.99 ± 6.03 | 85.11 ± 6.58 | |
| % PBF | 14.52 ± 4.61 | 14.62 ± 1.48 | 15.31 ± 1.43 | |
| Before the preparatory period 2021/2022 | Height | 184 ± 6.17 | 184.49 ± 5.20 | 181.96 ± 5.69 |
| Weight | 85.37 ± 7.23 | 87.64 ± 5.98 | 87.07 ± 6.92 | |
| % PBF | 14.63 ± 4.58 | 14.78 ± 1.48 | 15.02 ± 2.47 | |
| Variable | Study Time | Group | Main Effects and Interaction for Anova with Repeated Measures F/p/η2 | ||
|---|---|---|---|---|---|
| NSG (n = 28) | CG (n = 13) | WSG (n = 9) SpO2 < 90% | |||
| M ± SD (95%CI) | |||||
| Time to Peak Power [s] | BPP 2020/2021 | 2.35 ± 0.96 (1.98; 2.73) | 2.06 ± 0.62 (1.69; 2.43) | 2.04 ± 0.81 (1.43; 2.66) | Group: F = 1.03; p = 0.36; ηp2 = 0.042 Study time: F = 0.46; p = 0.63; ηp2 = 0.009 Group × study time: F = 0.060; p = 0.99; η2 = 0.003 |
| APP 2020/2021 | 2.31 ± 0.89 (1.94; 2.69) | 2.02 ± 0.62 (1.65; 2.39) | 2.03 ± 0.81 (1.41; 2.65) | ||
| BPP 2021/2022 | 2.41 ± 0.91 (2.04; 2.79) | 2.12 ± 0.62 (1.75; 2.49) | 2.25 ± 0.81 (1.64; 2.87) | ||
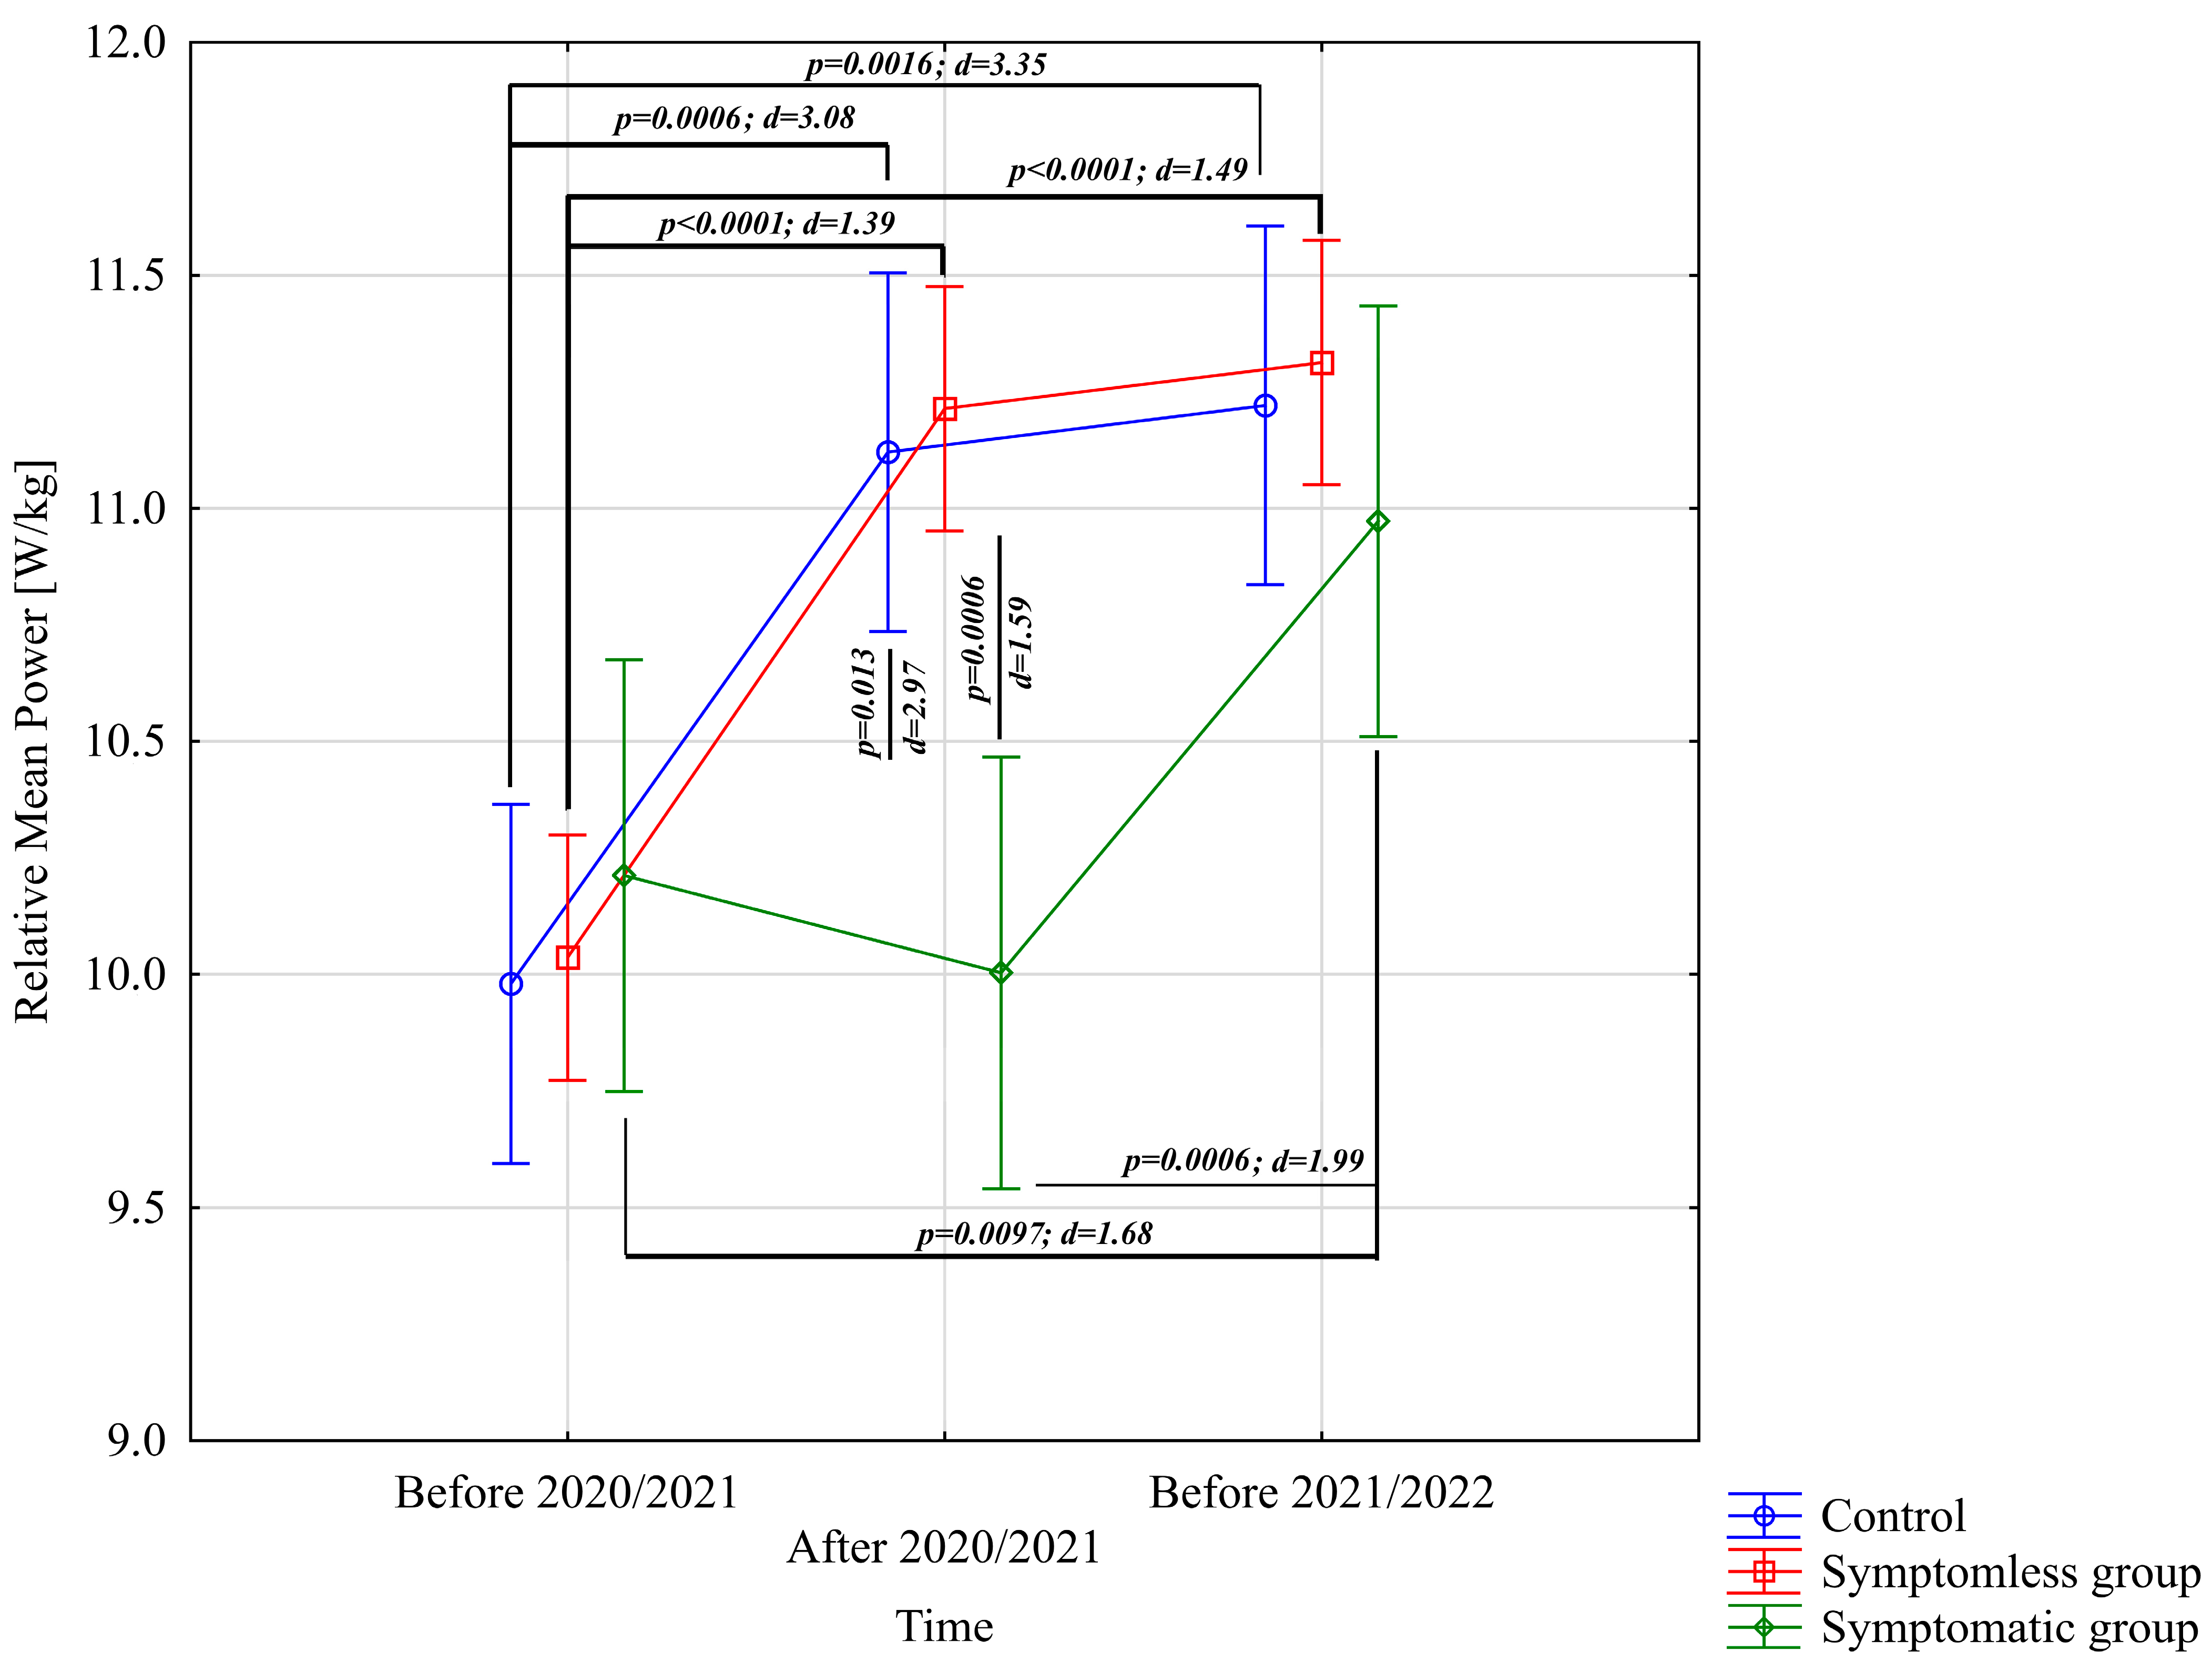
| Relative Mean Power [W/kg] | BPP 2020/2021 | 10.04 ± 0.86 (9.70; 10.37) | 9.98 ± 0.38 (9.75; 10.21) | 10.21 ± 0.37 (9.93; 10.50) | Group: F = 1.43; p = 0.25; ηp2 = 0.057 Study time: F = 35.76; p < 0.0001; ηp2 = 0.43 Group × study time: F = 6.26; p = 0.00016; ηp2 = 0.21 |
| APP 2020/2021 | 11.21 ± 0.82 (10.88; 11.55) | 11.12 ± 0.36 (10.90; 11.34) | 10.00 ± 0.40 (9.69; 10.31) | ||
| BPP 2021/2022 | 11.31 ± 0.84 (10.98; 11.65) | 11.22 ± 0.36 (11.00; 11.44) | 10.97 ± 0.52 (10.57; 11.37) | ||
| Relative Peak Power [W/kg] | BPP 2020/2021 | 17.84 ± 1.73 (17.17; 18.51) | 19.22 ± 1.39 (18.38; 20.05) | 19.15 ± 1.73 (17.83; 20.48) | Group: F = 3.26; p = 0.047; ηp2 = 0.12 Study time: F = 11.67; p < 0.0001; ηp2 = 0.20 Group × study time: F = 1.02; p = 0.40; ηp2 = 0.042 |
| APP 2020/2021 | 19.04 ± 1.62 (18.37; 19.71) | 20.46 ± 1.39 (19.62; 21.30) | 20.30 ± 1.71 (18.99; 21.62) | ||
| BPP 2021/2022 | 19.14 ± 1.84 (18.47; 19.81) | 20.56 ± 1.39 (19.72; 21.40) | 19.36 ± 1.73 (18.04; 20.69) | ||
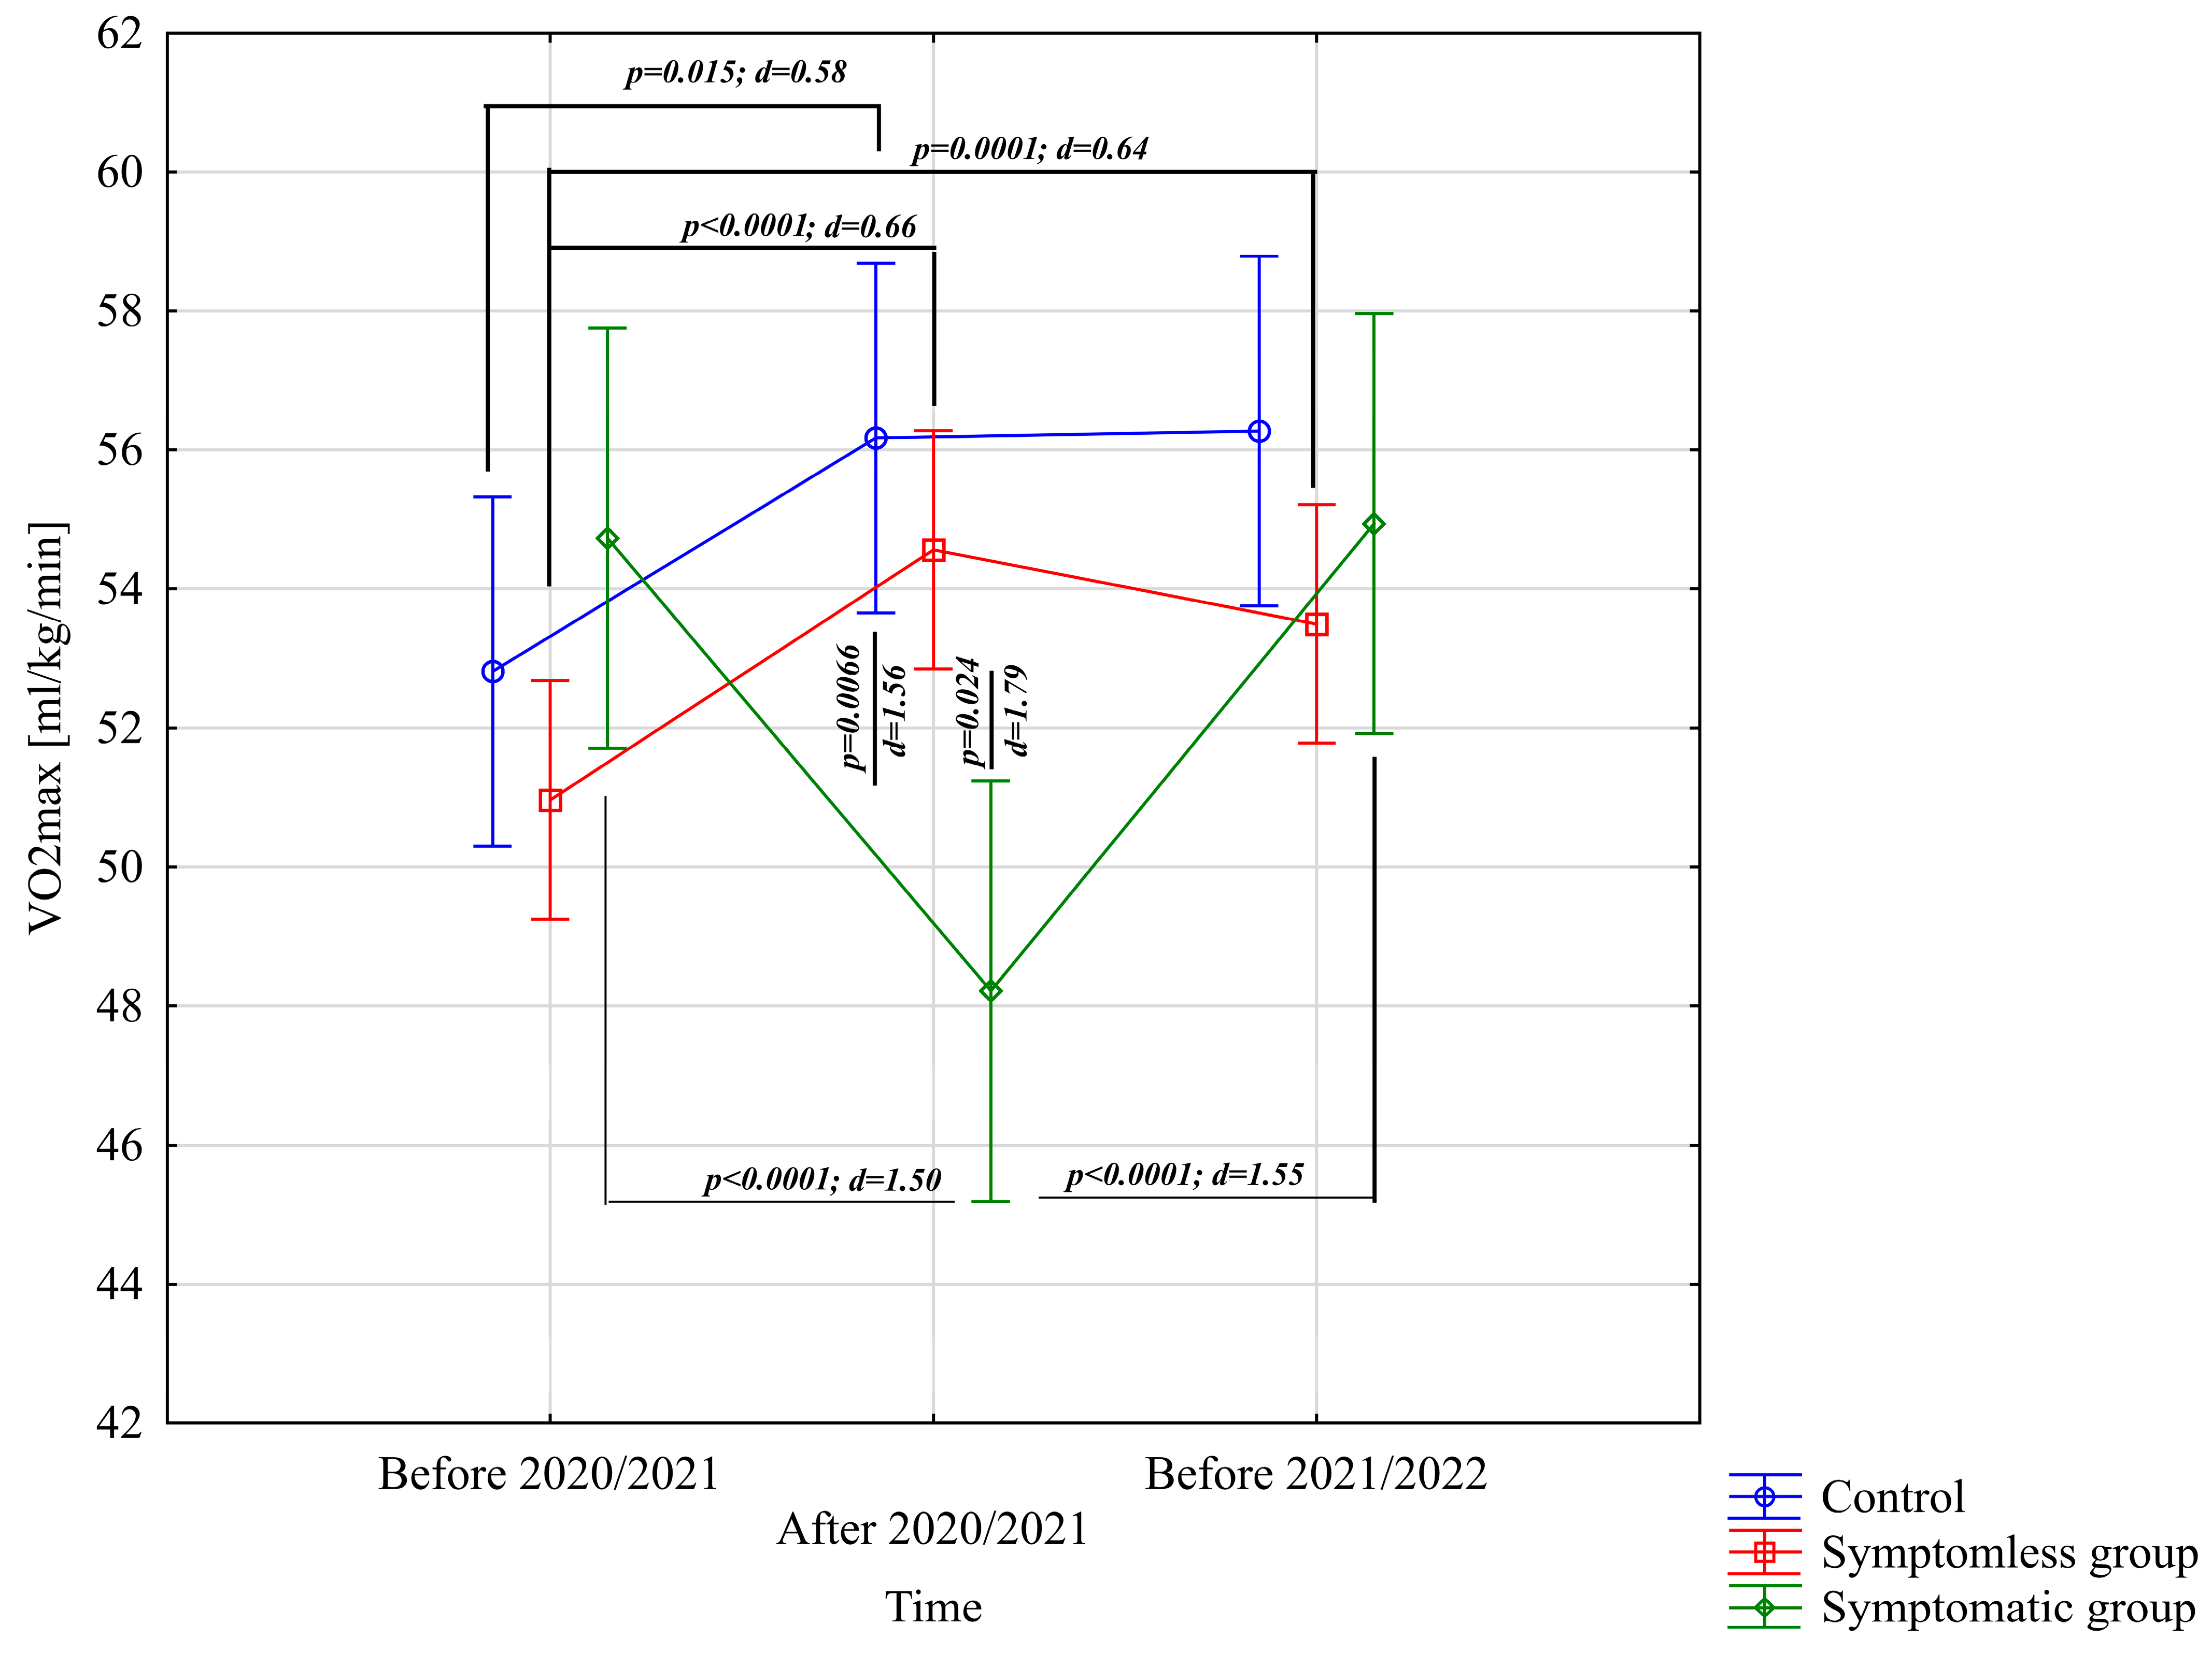
| VO2max [mL/kg/min] | BPP 2020/2021 | 50.96 ± 3.87 (49.46; 52.47) | 52.81 ± 5.35 (49.58; 56.05) | 54.73 ± 5.09 (50.82; 58.64) | Group: F = 0.52; p = 0.58; ηp2 = 0.021 Study time: F = 7.21; p = 0.0012; ηp2 = 0.13 Group × study time: F = 17.96; p < 0.0001; ηp2 = 0.43 |
| APP 2020/2021 | 54.56 ± 3.92 (53.04; 56.08) | 56.17 ± 6.15 (52.46; 59.89) | 48.22 ± 2.88 (46.00; 50.43) | ||
| BPP 2021/2022 | 53.50 ± 3.93 (51.97; 55.02) | 56.27 ± 6.15 (52.56; 59.99) | 54.94 ± 5.09 (51.03; 58.85) | ||
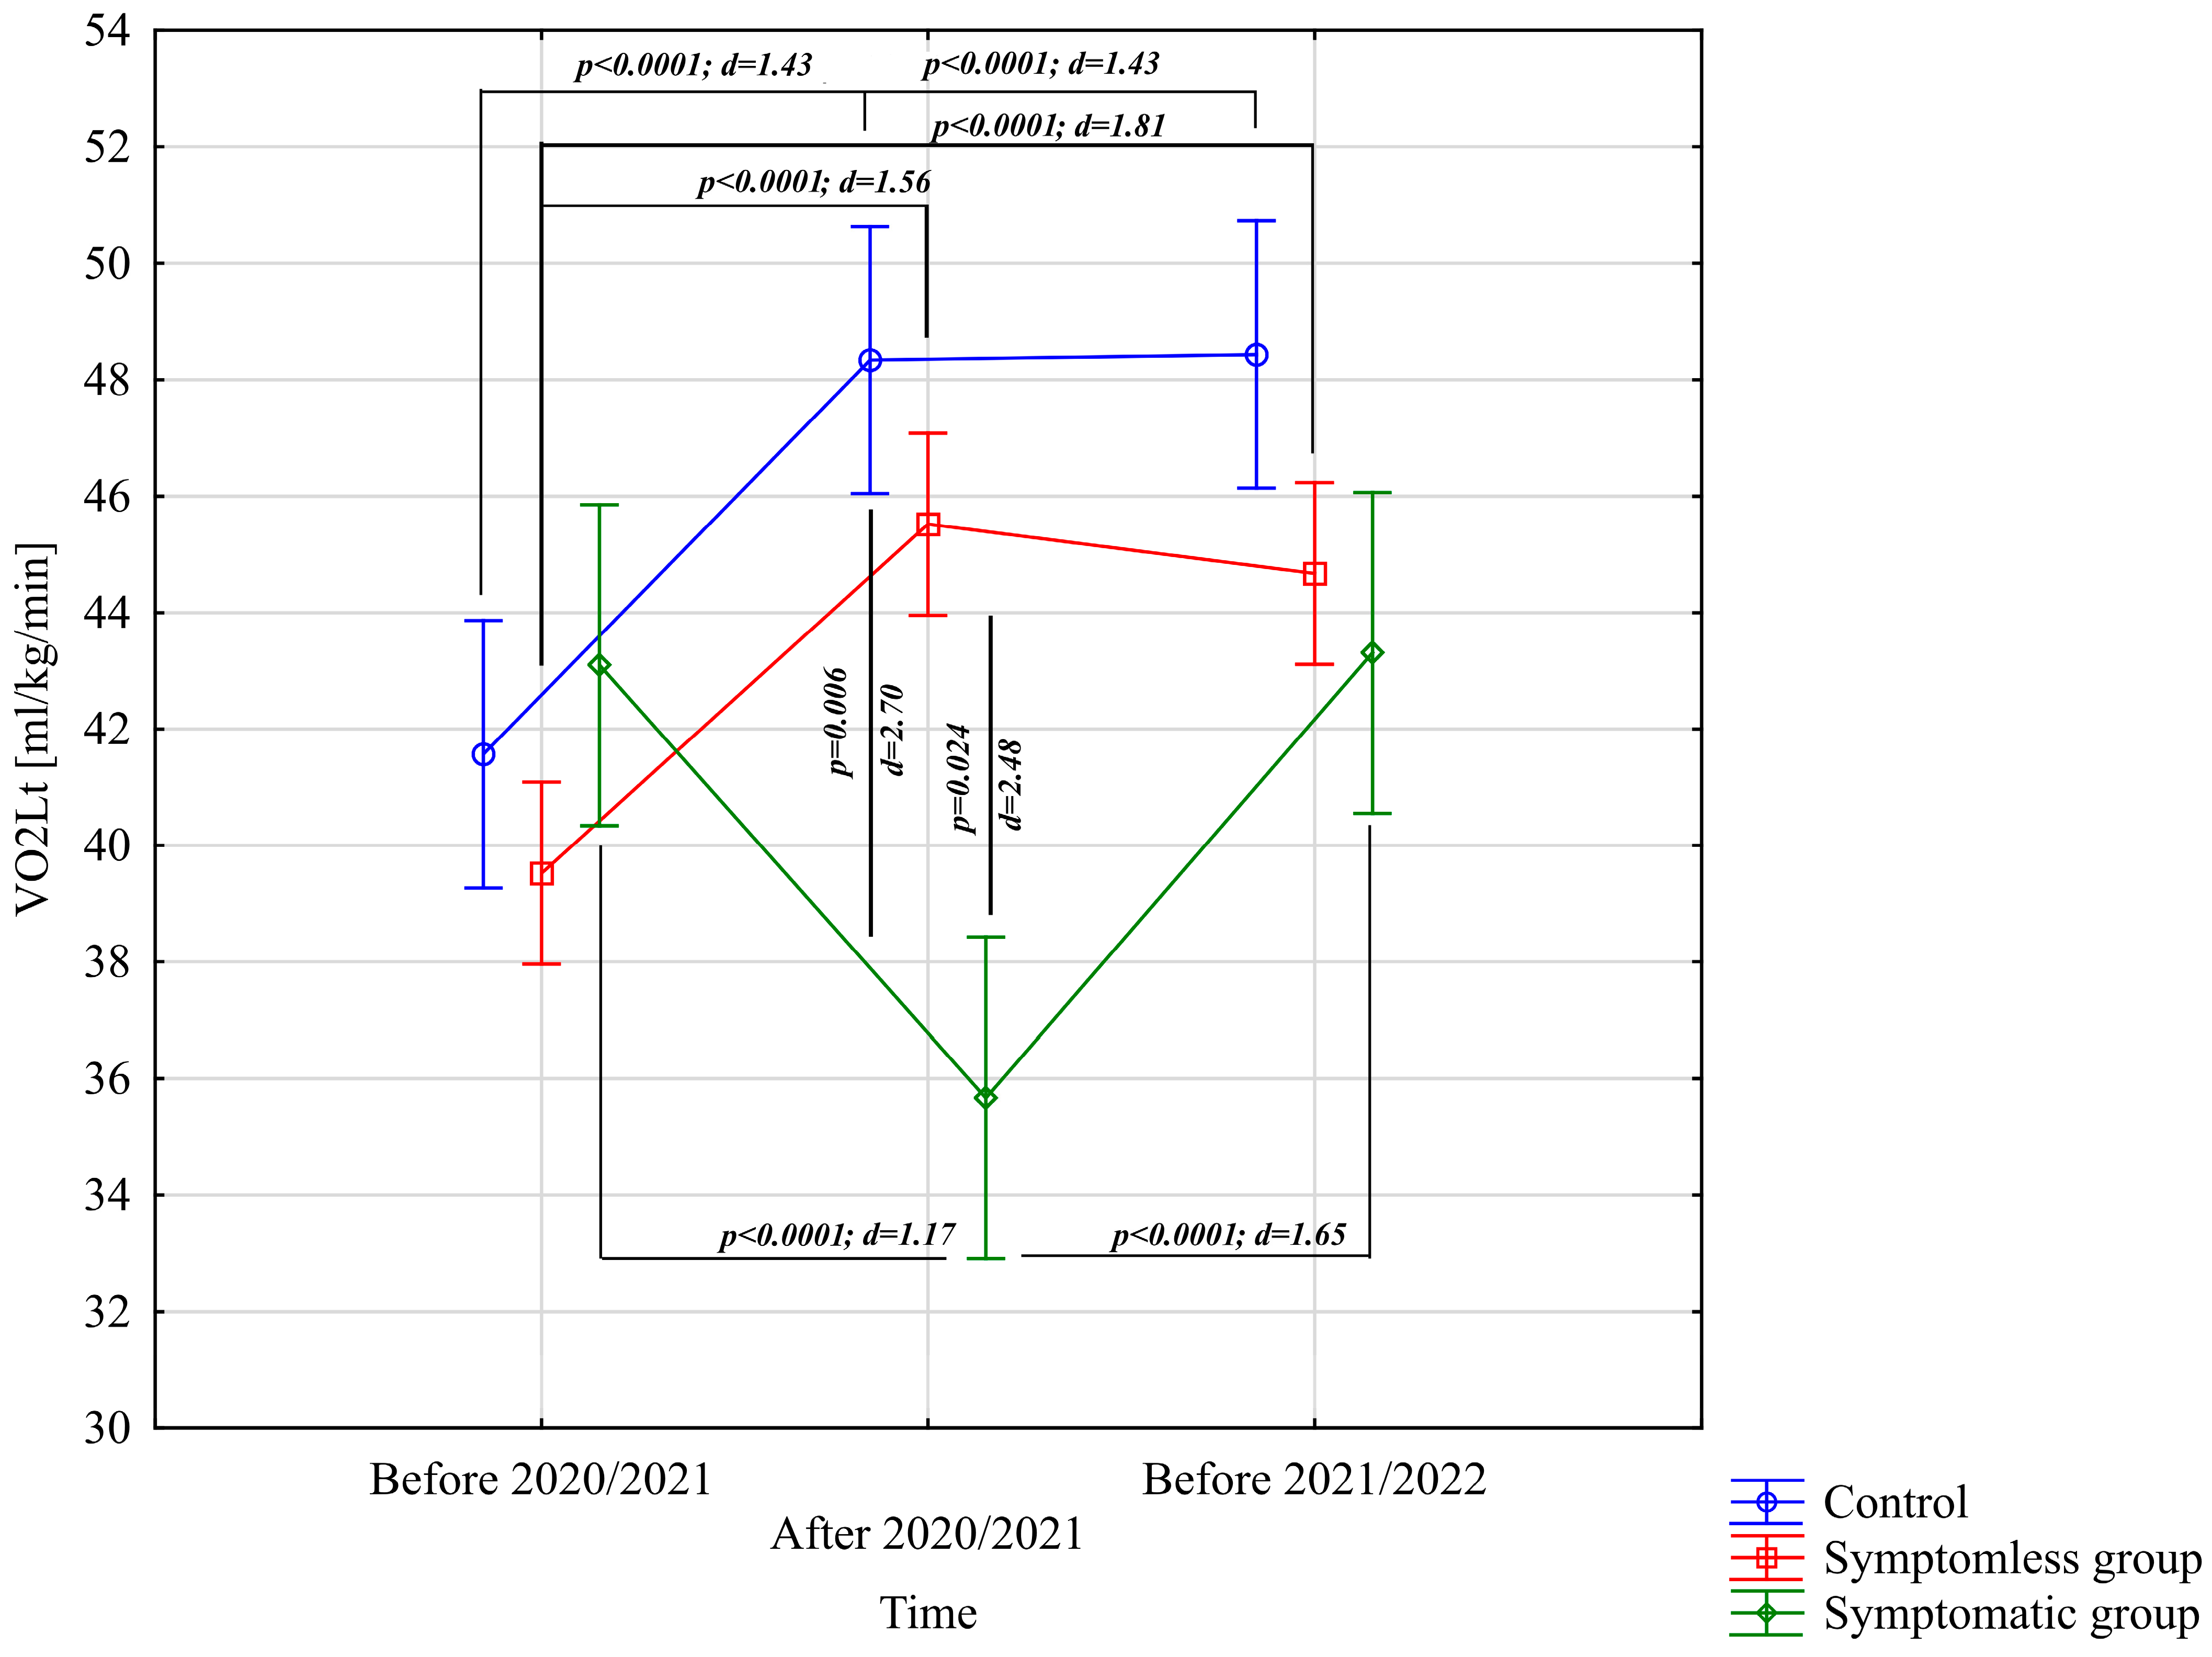
| VO2Lt [mL/kg/min] | BPP 2020/2021 | 39.52 ± 3.88 (38.02; 41.03) | 41.57 ± 4.63 (38.77; 44.36) | 43.10 ± 4.84 (39.38; 46.81) | Group: F = 2.39; p = 0.10; ηp2 = 0.092 Study time: F = 40,13; p < 0.0001; ηp2 = 0.46 Group × study time: F = 52.78; p < 0.0001; ηp2 = 0.69 |
| APP 2020/2021 | 45.52 ± 3.81 (44.04; 46.99) | 48.34 ± 4.84 (45.41; 51.26) | 35.67 ± 4.47 (32.24; 39.10) | ||
| BPP 2021/2022 | 44.67 ± 3.43 (43.34; 46.00) | 48.44 ± 4.84 (45.51; 51.36) | 43.31 ± 4.84 (39.59; 47.02) | ||
| BF [1/min] | BPP 2020/2021 | 53.19 ± 8.97 (49.71; 56.67) | 50.10 ± 6.81 (45.98; 54.21) | 49.07 ± 4.79 (45.39; 52.76) | Group: F = 0.66; p = 0.52; ηp2 = 0.027 Study time: F = 2.65; p = 0.076; ηp2 = 0.0053 Group × study time: F = 3.49; p = 0.011; ηp2 = 0.13 |
| APP 2020/2021 | 50.91 ± 8.87 (47.47; 54.35) | 48.10 ± 6.81 (43.98; 52.21) | 58.52 ± 5.88 (54.00; 63.04) | ||
| BPP 2021/2022 | 50.90 ± 8.94 (47.43; 54.37) | 48.20 ± 6.81 (44.08; 52.31) | 49.28 ± 4.79 (45.60; 52.97) | ||
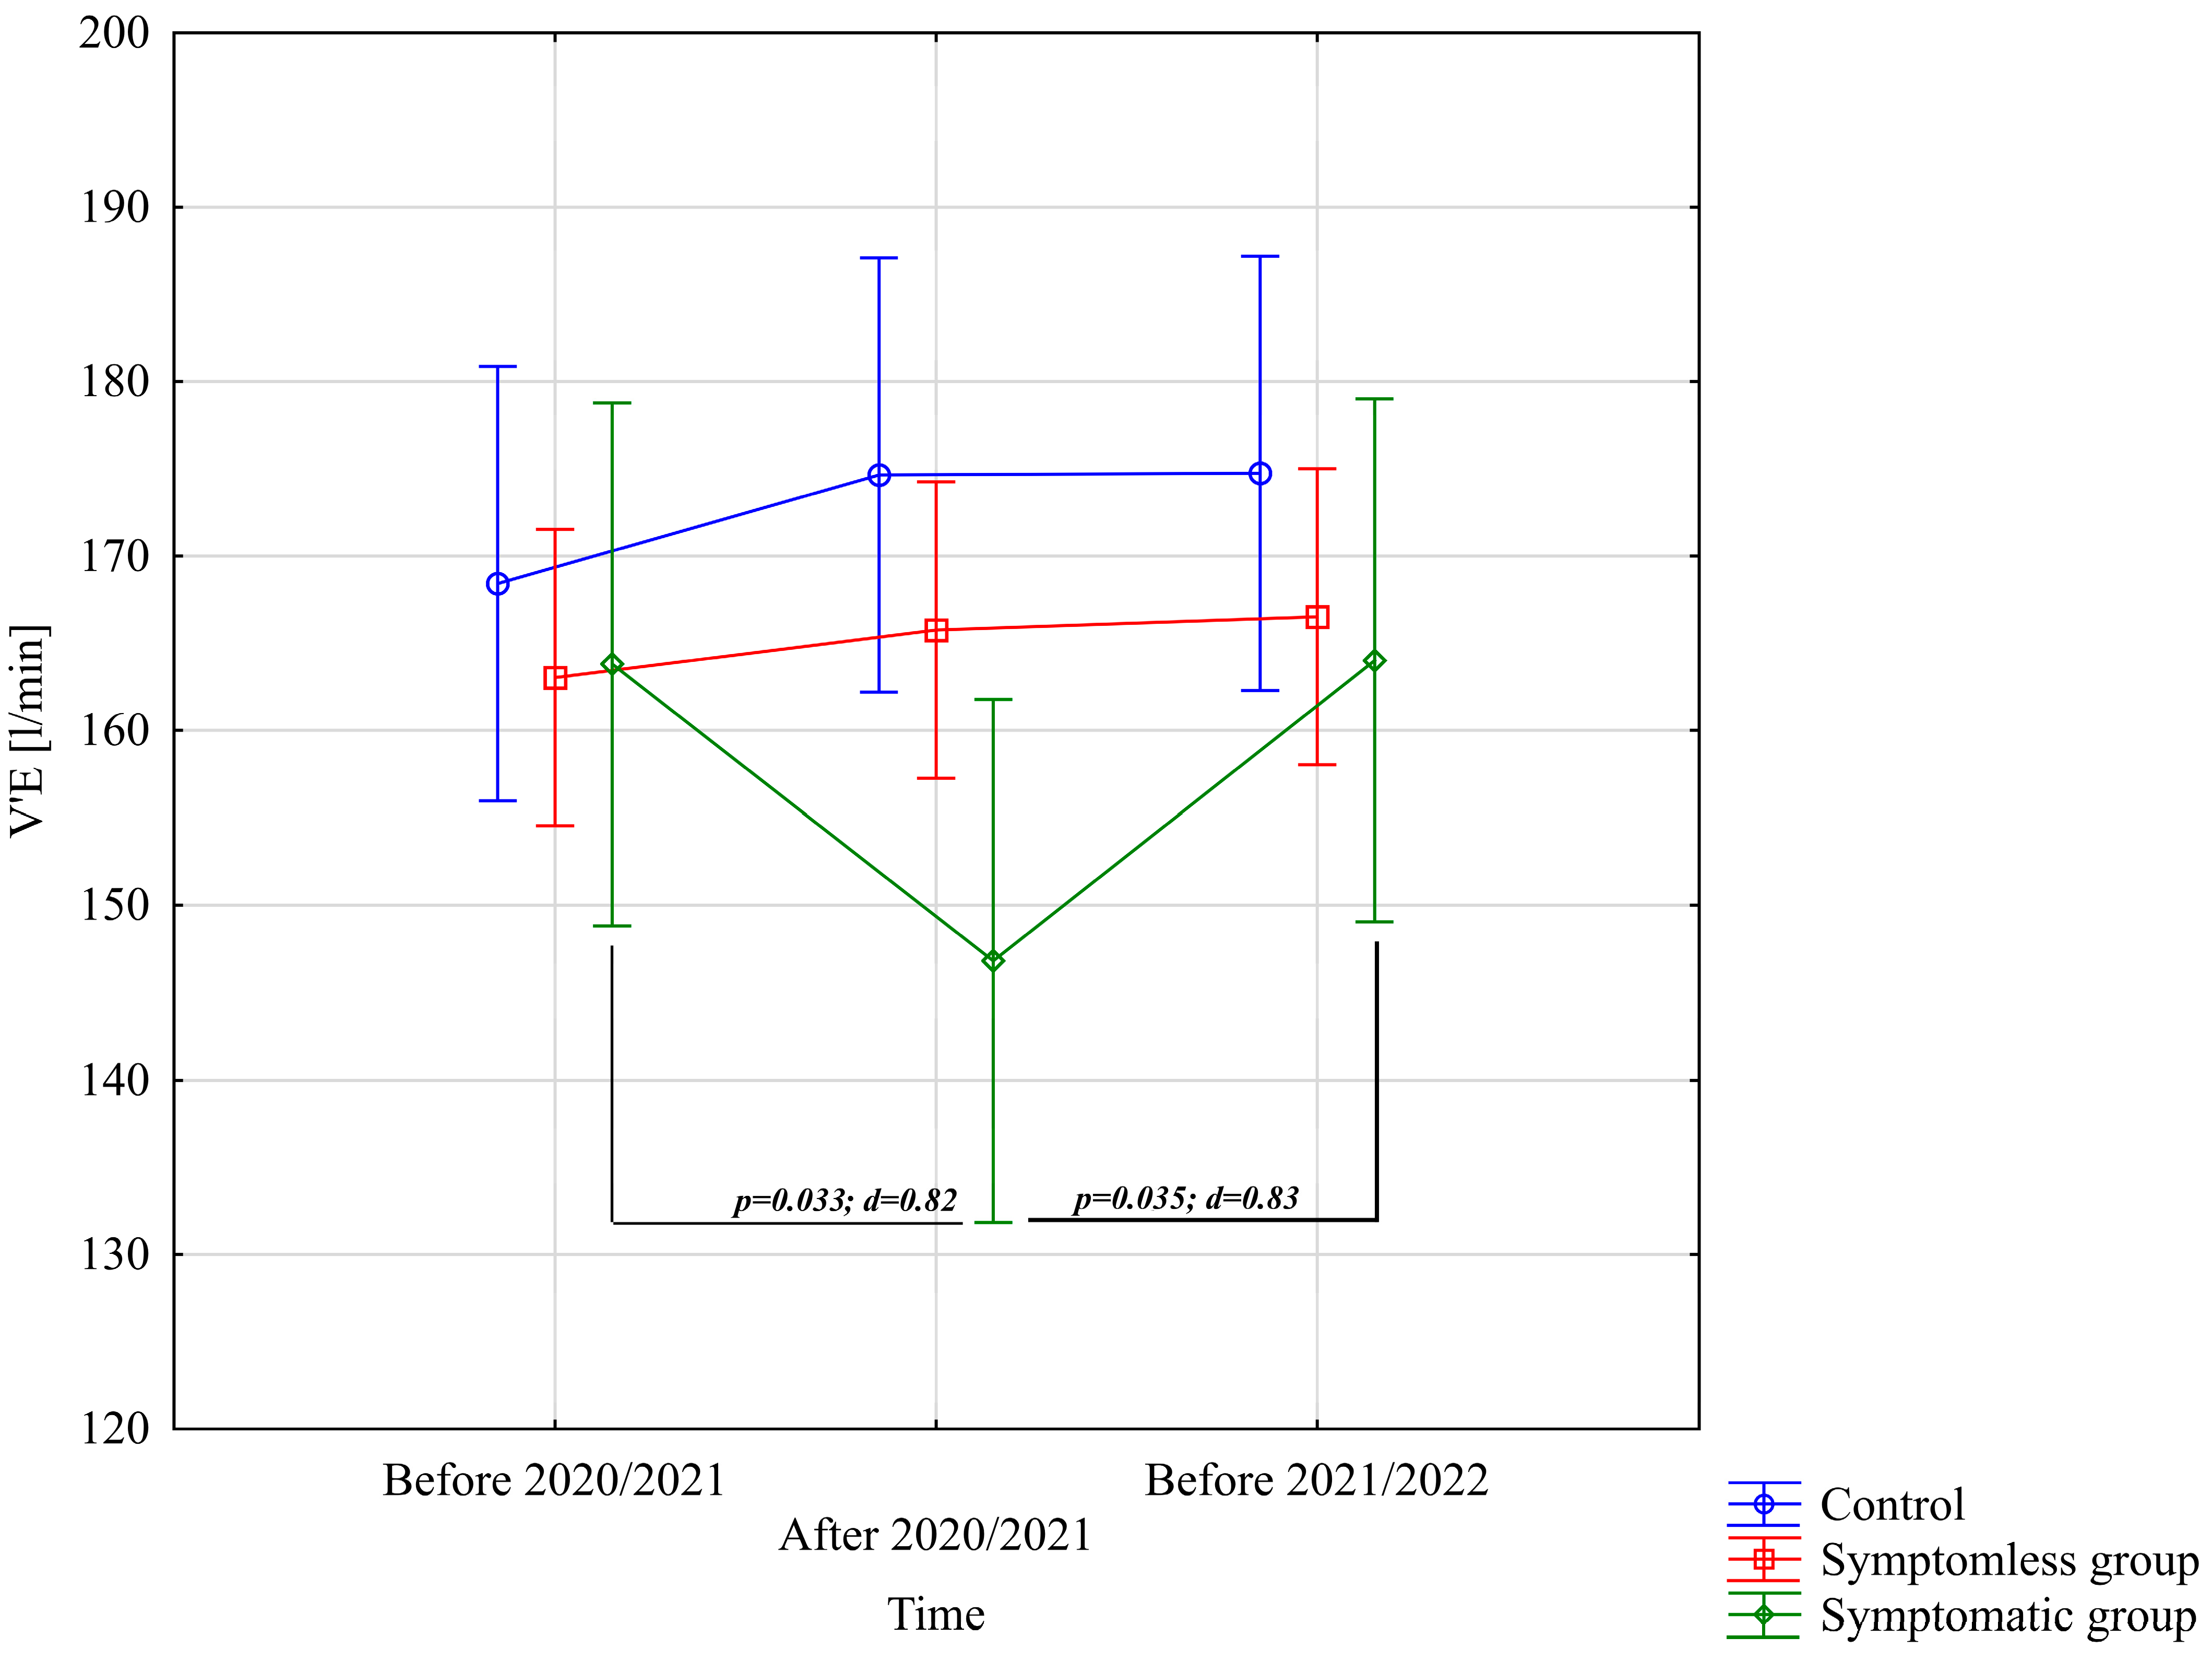
| V’E [L/min] | BPP 2020/2021 | 163.03 ± 25.23 (153.25; 172.82) | 168.41 ± 17.53 (157.82; 179.00) | 163.81 ± 21.86 (147.00; 180.61) | Group: F = 0.59; p = 0.55; ηp2 = 0.025 Study time: F = 2.83; p = 0.064; ηp2 = 0.057 Group × study time: F = 5.28; p = 0.00073; ηp2 = 0.18 |
| APP 2020/2021 | 165.74 ± 24.84 (156.11; 175.38) | 174.64 ± 17.33 (164.17; 185.12) | 146.81 ± 19.70 (131.66; 161.95) | ||
| BPP 2021/2022 | 166.52 ± 25.29 (156.71; 176.33) | 174.74 ± 17.33 (164.27; 185.21) | 164.02 ± 21.86 (147.21; 180.82) | ||
| ΔL [mmol/L] | BPP 2020/2021 | 4.34 ± 1.18 (3.88; 4.79) | 4.26 ± 0.99 (3.66; 4.86) | 3.95 ± 0.54 (3.53; 4.36) | Group: F = 2.67; p = 0.079; ηp2 = 0.010 Study time: F = 4.72; p = 0.011; ηp2 = 0.091 Group × study time: F = 6.15; p = 0.0002; ηp2 = 0.21 |
| APP 2020/2021 | 4.22 ± 1.26 (3.73; 4.71) | 4.52 ± 0.95 (3.95; 5.10) | 2.60 ± 0.44 (2.26; 2.93) | ||
| BPP 2021/2022 | 4.22 ± 1.12 (3.79; 4.66) | 3.77 ± 1.19 (3.05; 4.49) | 4.14 ± 0.62 (3.67; 4.62) | ||
Disclaimer/Publisher’s Note: The statements, opinions and data contained in all publications are solely those of the individual author(s) and contributor(s) and not of MDPI and/or the editor(s). MDPI and/or the editor(s) disclaim responsibility for any injury to people or property resulting from any ideas, methods, instructions or products referred to in the content. |
© 2025 by the authors. Licensee MDPI, Basel, Switzerland. This article is an open access article distributed under the terms and conditions of the Creative Commons Attribution (CC BY) license (https://creativecommons.org/licenses/by/4.0/).
Share and Cite
Roczniok, R.; Terbalyan, A.; Pietraszewski, P.; Mikrut, G.; Zielonka, H.; Stastny, P.; Swinarew, A.; Manilewska, D.; Ornowski, K.; Jabłoński, T.; et al. Impact of SARS-CoV-2 on Aerobic and Anaerobic Capacity in Professional Ice Hockey Players. J. Clin. Med. 2025, 14, 3478. https://doi.org/10.3390/jcm14103478
Roczniok R, Terbalyan A, Pietraszewski P, Mikrut G, Zielonka H, Stastny P, Swinarew A, Manilewska D, Ornowski K, Jabłoński T, et al. Impact of SARS-CoV-2 on Aerobic and Anaerobic Capacity in Professional Ice Hockey Players. Journal of Clinical Medicine. 2025; 14(10):3478. https://doi.org/10.3390/jcm14103478
Chicago/Turabian StyleRoczniok, Robert, Artur Terbalyan, Przemysław Pietraszewski, Grzegorz Mikrut, Hanna Zielonka, Petr Stastny, Andrzej Swinarew, Daria Manilewska, Kajetan Ornowski, Tomasz Jabłoński, and et al. 2025. "Impact of SARS-CoV-2 on Aerobic and Anaerobic Capacity in Professional Ice Hockey Players" Journal of Clinical Medicine 14, no. 10: 3478. https://doi.org/10.3390/jcm14103478
APA StyleRoczniok, R., Terbalyan, A., Pietraszewski, P., Mikrut, G., Zielonka, H., Stastny, P., Swinarew, A., Manilewska, D., Ornowski, K., Jabłoński, T., & Lipińska, P. (2025). Impact of SARS-CoV-2 on Aerobic and Anaerobic Capacity in Professional Ice Hockey Players. Journal of Clinical Medicine, 14(10), 3478. https://doi.org/10.3390/jcm14103478