

Association Between Visceral Adiposity and the Prediction of Hepatic Steatosis and Fibrosis in Patients with Metabolic Dysfunction-Associated Steatotic Liver Disease (MASLD)
 ,
, 
Abstract
:1. Introduction
2. Materials and Methods
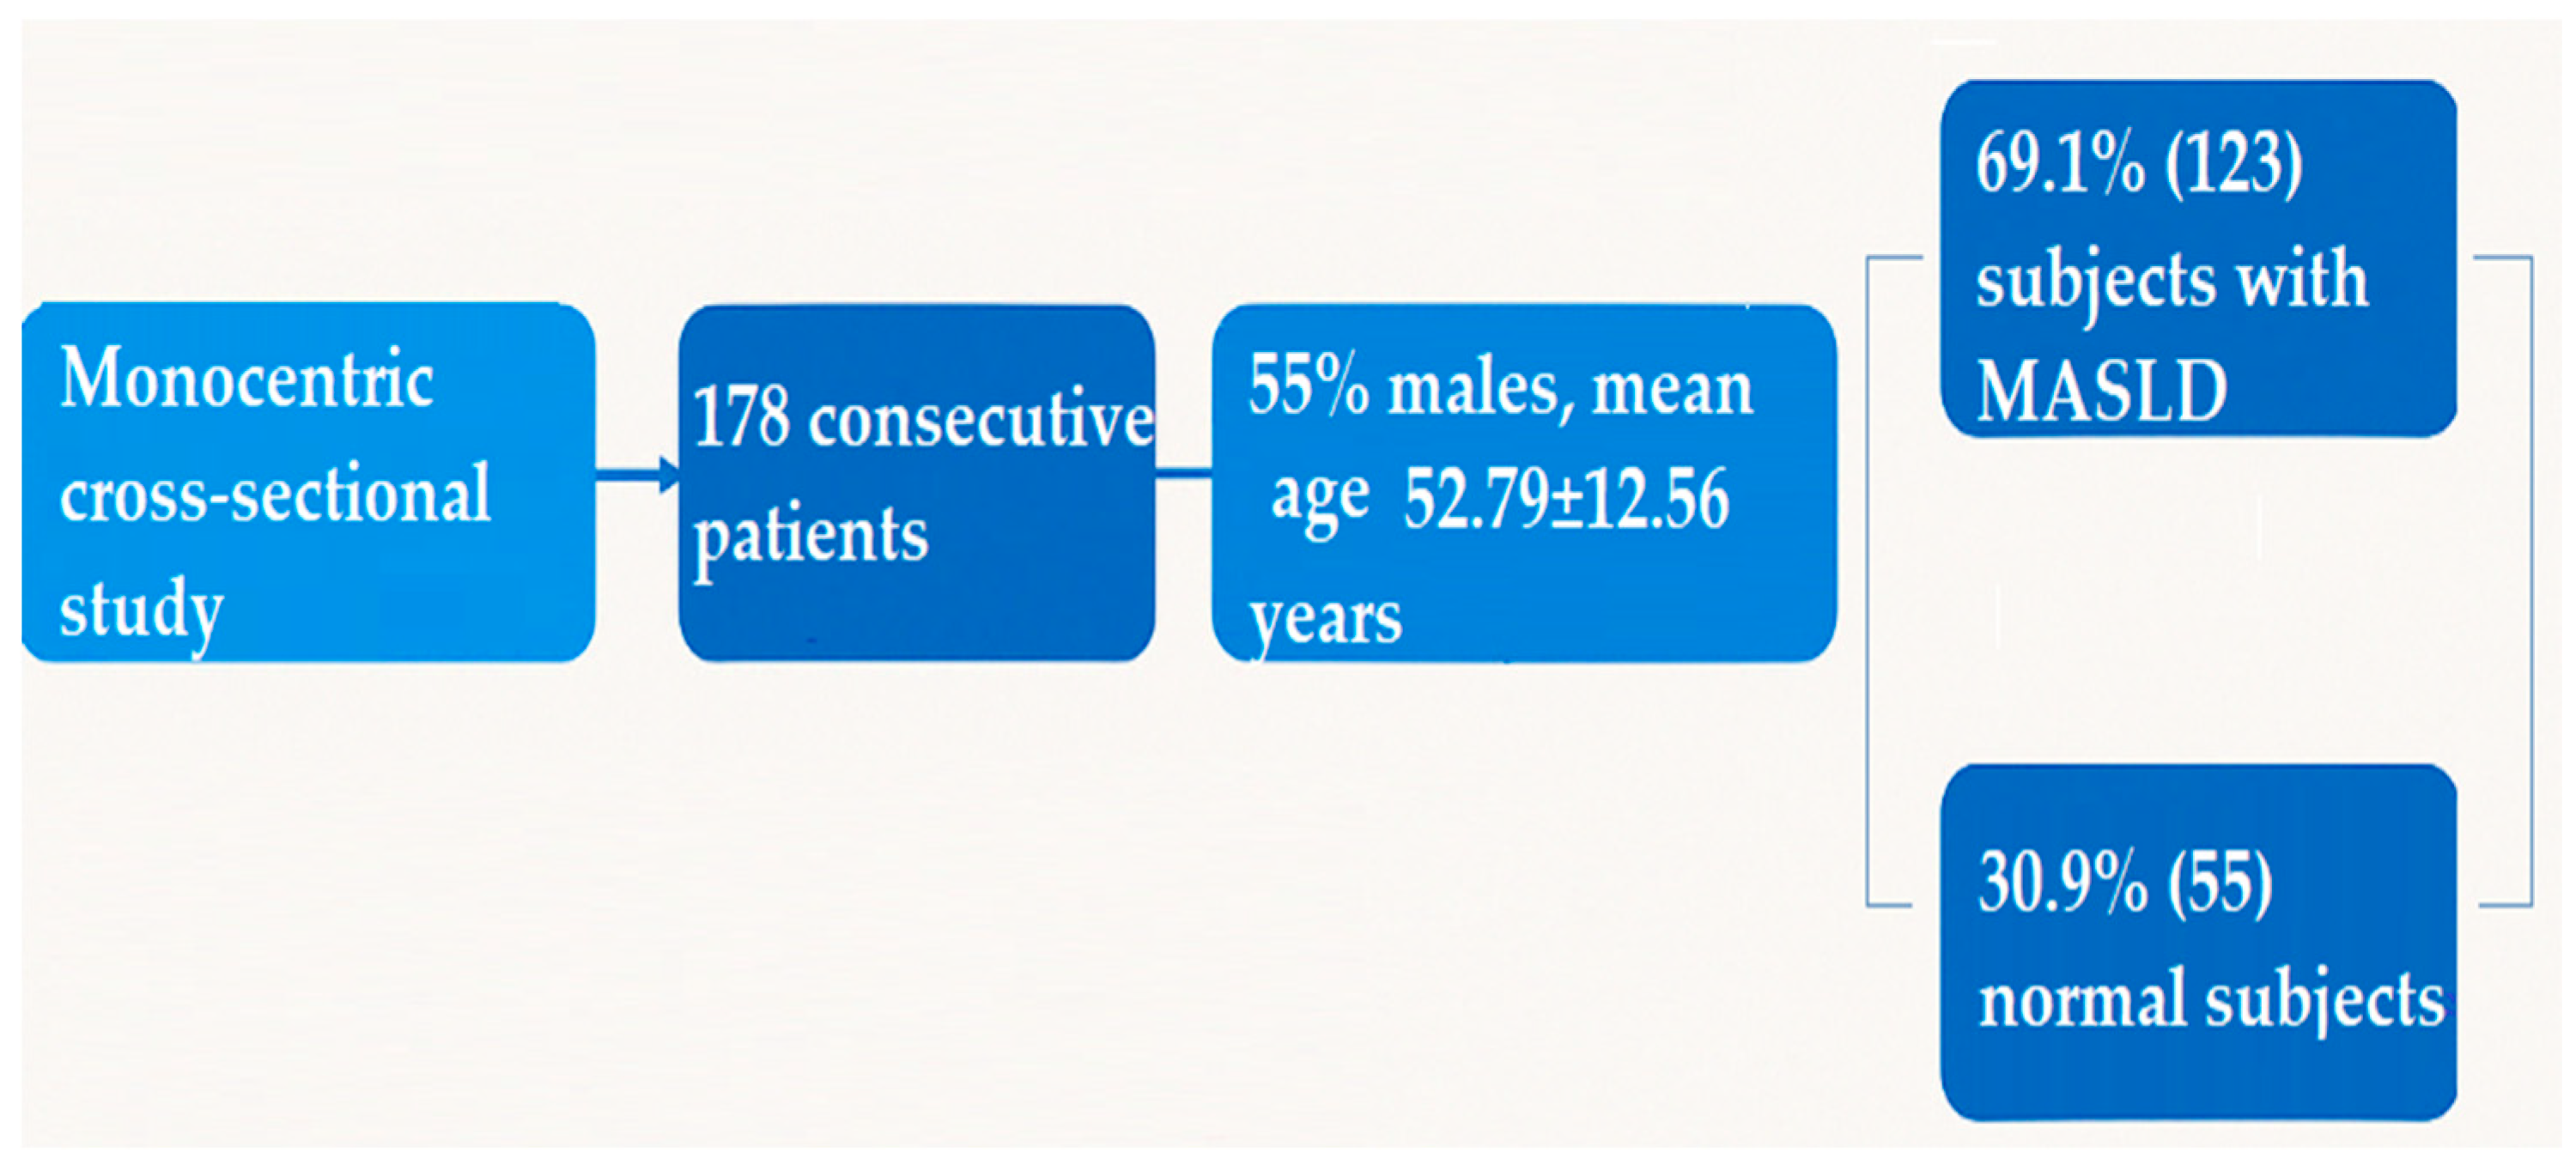
2.1. Study Population
- Body mass index (BMI) ≥ 25 kg/m2;
- Type 2 diabetes mellitus;
- At least two of the following metabolic risk factors:
- Waist circumference ≥ 102 cm in men or ≥88 cm in women;
- Blood pressure ≥ 130/85 mmHg or current antihypertensive treatment;
- Triglycerides ≥ 150 mg/dL or specific treatment for hypertriglyceridemia;
- HDL-cholesterol < 40 mg/dL in men or <50 mg/dL in women;
- Fasting plasma glucose between 100 and 125 mg/dL or HbA1c ≥ 5.7%.
- Absence of hepatic steatosis, confirmed both by abdominal ultrasound and CAP < 248 dB/m;
- BMI < 25 kg/m2;
- No diagnosis of type 2 diabetes mellitus;
- No more than one metabolic risk factor from the list detailed above.
2.2. Clinical and Laboratory Examinations
2.3. Vibration-Controlled Transient Elastography and Controlled Attenuation Parameter
2.4. Statistical Analysis
3. Results
4. Discussion
5. Conclusions
Author Contributions
Funding
Institutional Review Board Statement
Informed Consent Statement
Data Availability Statement
Conflicts of Interest
References
- Eslam, M.; Sarin, S.K.; Wong, V.W.-S.; Fan, J.-G.; Kawaguchi, T.; Ahn, S.H.; Zheng, M.-H.; Shiha, G.; Yilmaz, Y.; Gani, R.; et al. The Asian Pacific Association for the Study of the Liver clinical practice guidelines for the diagnosis and management of metabolic associated fatty liver disease. Hepatol. Int. 2020, 14, 889–919. [Google Scholar] [CrossRef] [PubMed]
- Huh, Y.; Cho, Y.J.; Nam, G.E. Recent epidemiology and risk factors of nonalcoholic fatty liver disease. J. Obes. Metab. Syndr. 2022, 31, 17–27. [Google Scholar] [CrossRef] [PubMed]
- Le, M.H.; Yeo, Y.H.; Li, X.; Li, J.; Zou, B.; Wu, Y.; Ye, Q.; Huang, D.Q.; Zhao, C.; Zhang, J.; et al. 2019 Global NAFLD prevalence: A systematic review and meta-analysis. Clin. Gastroenterol. Hepatol. 2022, 20, 2809–2817. [Google Scholar] [CrossRef]
- Patel, K.; Asrani, S.K.; Fiel, M.I.; Levine, D.; Leung, D.H.; Duarte-Rojo, A.; Dranoff, J.A.; Nayfeh, T.; Hasan, B.; Taddei, T.H.; et al. Accuracy of blood-based biomarkers for staging liver fibrosis in chronic liver disease: A systematic review supporting the AASLD Practice Guideline. Hepatology 2025, 81, 358–379. [Google Scholar] [CrossRef] [PubMed]
- Tomah, S.; Salah, T.; Al-Badri, M.; Dhaver, S.; Gardner, H.; Tasabehji, M.W.; Hamdy, O. Multidisciplinary intensive lifestyle intervention improves markers of nonalcoholic fatty liver disease (NAFLD) in patients with type 1 diabetes and obesity: A retrospective matched-cohort study. Clin. Diabetes Endocrinol. 2023, 9, 3. [Google Scholar] [CrossRef] [PubMed] [PubMed Central]
- Dietrich, P.; Hellerbrand, C. Non-alcoholic fatty liver disease, obesity and the metabolic syndrome. Best. Pract. Res. Clin. Gastroenterol. 2014, 28, 637–653. [Google Scholar] [CrossRef] [PubMed]
- Suwała, S.; Junik, R. Assessment of the Liver Steatosis and Fibrosis Risk in Metabolic Syndrome and Its Individual Components, Considering the Varying Definitions Used in Clinical Practice Throughout Time: A Retrospective Cross-Sectional Study. Biomedicines 2024, 12, 1739. [Google Scholar] [CrossRef] [PubMed] [PubMed Central]
- Huang, Q.; Tan, X.; Wu, Q.; Zhao, H.; Chen, H.; Yu, X.; Wang, J.; Huang, X.; Huang, Y.; Wei, J.; et al. Lipid accumulation product is a valid predictor of hepatic steatosis and nonalcoholic fatty liver disease. Biomark. Med. 2024, 18, 123–135. [Google Scholar] [CrossRef] [PubMed]
- Li, H.; Zhang, Y.; Luo, H.; Lin, R. The lipid accumulation product is a powerful tool to diagnose metabolic dysfunction-associated fatty liver disease in the United States adults. Front. Endocrinol. 2022, 13, 977625. [Google Scholar] [CrossRef] [PubMed] [PubMed Central]
- Xue, Y.; Xu, J.; Li, M.; Gao, Y. Potential screening indicators for early diagnosis of NAFLD/MAFLD and liver fibrosis: Triglyceride glucose index-related parameters. Front. Endocrinol. 2022, 13, 951689. [Google Scholar] [CrossRef] [PubMed] [PubMed Central]
- Wang, J.; Yan, S.; Cui, Y.; Chen, F.; Piao, M.; Cui, W. The Diagnostic and Prognostic Value of the Triglyceride-Glucose Index in Metabolic Dysfunction-Associated Fatty Liver Disease (MAFLD): A Systematic Review and Meta-Analysis. Nutrients 2022, 14, 4969. [Google Scholar] [CrossRef] [PubMed] [PubMed Central]
- Boicean, A.; Ichim, C.; Sasu, S.-M.; Todor, S.B. Key Insights into Gut Alterations in Metabolic Syndrome. J. Clin. Med. 2025, 14, 2678. [Google Scholar] [CrossRef] [PubMed] [PubMed Central]
- Ha, S.; Wong, V.W.-S.; Zhang, X.; Yu, J. Interplay between gut microbiome, host genetic and epigenetic modifications in MASLD and MASLD-related hepatocellular carcinoma. Gut 2024, 74, 141–152. [Google Scholar] [CrossRef] [PubMed] [PubMed Central]
- Long, Q.; Luo, F.; Li, B.; Li, Z.; Guo, Z.; Chen, Z.; Wu, W.; Hu, M. Gut microbiota and metabolic biomarkers in metabolic dysfunction-associated steatotic liver disease. Hepatol. Commun. 2024, 8, e0310. [Google Scholar] [CrossRef] [PubMed] [PubMed Central]
- Simon, T.G.; Corey, K.E.; Cannon, C.P.; Blazing, M.; Park, J.-G.; O’Donoghue, M.L.; Chung, R.T.; Giugliano, R.P. The nonalcoholic fatty liver disease (NAFLD) fibrosis score, cardiovascular risk stratification and a strategy for secondary prevention with ezetimibe. Int. J. Cardiol. 2018, 270, 245–252. [Google Scholar] [CrossRef] [PubMed] [PubMed Central]
- Li, Y.; Chen, Y.; Zhao, Y. The diagnostic value of the FIB-4 index for staging hepatitis B-related fibrosis: A meta-analysis. PLoS ONE 2014, 9, e105728. [Google Scholar] [CrossRef] [PubMed] [PubMed Central]
- Tudoran, C.; Bende, R.; Bende, F.; Giurgi-Oncu, C.; Enache, A.; Dumache, R.; Tudoran, M. Connections Between Diabetes Mellitus and Metabolic Syndrome and the Outcome of Cardiac Dysfunctions Diagnosed During the Recovery from COVID-19 in Patients Without a Previous History of Cardiovascular Diseases. Biology 2023, 12, 370. [Google Scholar] [CrossRef] [PubMed] [PubMed Central]
- Castéra, L.; Foucher, J.; Bernard, P.-H.; Carvalho, F.; Allaix, D.; Merrouche, W.; Couzigou, P.; de Lédinghen, V. Pitfalls of liver stiffness measurement: A 5-year prospective study of 13,369 examinations. Hepatology 2010, 51, 828–835. [Google Scholar] [CrossRef]
- Bedossa, P.; Carrat, F. Liver biopsy: The best, not the gold standard. J. Hepatol. 2009, 50, 1–3. [Google Scholar] [CrossRef]
- Ferraioli, G.; Wong, V.W.S.; Castera, L.; Berzigotti, A.; Sporea, I.; Dietrich, C.F.; Choi, B.I.; Wilson, S.R.; Kudo, M.; Barr, R.G. Liver Ultrasound Elastography: An Update to the World Federation for Ultrasound in Medicine and Biology Guidelines and Recommendations. Ultrasound Med. Biol. 2018, 44, 2419–2440. [Google Scholar]
- Eddowes, P.J.; Sasso, M.; Allison, M.; Tsochatzis, E.; Anstee, Q.M.; Sheridan, D.; Guha, I.N.; Cobbold, J.F.; Deeks, J.J.; Paradis, V.; et al. Accuracy of FibroScan Controlled Attenuation Parameter and Liver Stiffness Measurement in Assessing Steatosis and Fibrosis in Patients with Nonalcoholic Fatty Liver Disease. Gastroenterology 2019, 156, 1717–1730. [Google Scholar] [CrossRef] [PubMed]
- Petroff, D.; Blank, V.; Newsome, P.N.; Shalimar; Voican, C.S.; Thiele, M.; de Lédinghen, V.; Baumeler, S.; Chan, W.K.; Perlemuter, G.; et al. Assessment of hepatic steatosis by controlled attenuation parameter using the M and XL probes: An individual patient data meta-analysis. Lancet Gastroenterol. Hepatol. 2021, 6, 185–198. [Google Scholar] [CrossRef] [PubMed]
- Min, Y.; Wei, X.; Wei, Z.; Song, G.; Zhao, X.; Lei, Y. Prognostic effect of triglyceride glucose-related parameters on all-cause and cardiovascular mortality in the United States adults with metabolic dysfunction-associated steatotic liver disease. Cardiovasc. Diabetol. 2024, 23, 188. [Google Scholar] [CrossRef] [PubMed] [PubMed Central]
- Chen, Q.; Hu, P.; Hou, X.; Sun, Y.; Jiao, M.; Peng, L.; Dai, Z.; Yin, X.; Liu, R.; Li, Y.; et al. Association between triglyceride-glucose related indices and mortality among individuals with non-alcoholic fatty liver disease or metabolic dysfunction-associated steatotic liver disease. Cardiovasc. Diabetol. 2024, 23, 232. [Google Scholar] [CrossRef] [PubMed] [PubMed Central]
- Simental-Mendía, L.E.; Simental-Mendía, E.; Rodríguez-Hernández, H.; Rodríguez-Morán, M.; Guerrero-Romero, F. The product of triglycerides and glucose as biomarker for screening simple steatosis and NASH in asymptomatic women. Ann. Hepatol. 2016, 15, 715–720. [Google Scholar]
- Fan, Z.; Yang, C.; Zhao, X.; Zhang, J. Association of cardiometabolic markers with hepatic steatosis and liver fibrosis in population without obesity and diabetes. Sci. Rep. 2025, 15, 15695. [Google Scholar] [CrossRef] [PubMed] [PubMed Central]
- Priego-Parra, B.A.; Reyes-Diaz, S.A.; Ordaz-Alvarez, H.R.; Bernal-Reyes, R.; Icaza-Chávez, M.E.; Martínez-Vázquez, S.E.; Amieva-Balmori, M.; Vivanco-Cid, H.; Velasco, J.A.V.-R.; Gracia-Sancho, J.; et al. Diagnostic performance of sixteen biomarkers for MASLD: A study in a Mexican cohort. Clin. Res. Hepatol. Gastroenterol. 2024, 48, 102400. [Google Scholar] [CrossRef] [PubMed]
- Cen, C.; Wang, W.; Yu, S.; Tang, X.; Liu, J.; Liu, Y.; Zhou, L.; Yu, J.; Zheng, S. Development and validation of a clinical and laboratory-based nomogram to predict nonalcoholic fatty liver disease. Hepatol. Int. 2020, 14, 808–816. [Google Scholar] [CrossRef]
- Fu, C.P.; Ali, H.; Rachakonda, V.P.; Oczypok, E.A.; DeLany, J.P.; Kershaw, E.E. The ZJU index is a powerful surrogate marker for NAFLD in severely obese North American women. PLoS ONE 2019, 14, e0224942. [Google Scholar] [CrossRef]
- Li, L.; You, W.; Ren, W. The ZJU index is a powerful index for identifying NAFLD in the general Chinese population. Acta Diabetol. 2017, 54, 905–911. [Google Scholar] [CrossRef]
- Sheng, G.; Lu, S.; Xie, Q.; Peng, N.; Kuang, M.; Zou, Y. The usefulness of obesity and lipid-related indices to predict the presence of Non-alcoholic fatty liver disease. Lipids Health Dis. 2021, 20, 134. [Google Scholar] [CrossRef] [PubMed]
- Keskinler, M.V.; Mutlu, H.H.; Sirin, A.; Senates, B.E.; Colak, Y.; Tuncer, I.; Oguz, A. Visceral Adiposity Index as a Practical Tool in Patients with Biopsy-Proven Nonalcoholic Fatty Liver Disease/Nonalcoholic Steatohepatitis. Metab. Syndr. Relat. Disord. 2021, 19, 26–31. [Google Scholar] [CrossRef] [PubMed]
- Kim, D.; Chung, G.E.; Kwak, M.S.; Seo, H.B.; Kang, J.H.; Kim, W.; Kim, Y.J.; Yoon, J.H.; Lee, H.S.; Kim, C.Y. Body Fat Distribution and Risk of Incident and Regressed Nonalcoholic Fatty Liver Disease. Clin. Gastroenterol. Hepatol. 2016, 14, 132–138.e4. [Google Scholar] [CrossRef]
- Ismaiel, A.; Jaaouani, A.; Leucuta, D.C.; Popa, S.L.; Dumitrascu, D.L. The Visceral Adiposity Index in Non-Alcoholic Fatty Liver Disease and Liver Fibrosis-Systematic Review and Meta-Analysis. Biomedicines 2021, 9, 1890. [Google Scholar] [CrossRef] [PubMed] [PubMed Central]
- Petta, S.; Amato, M.C.; Di Marco, V.; Cammà, C.; Pizzolanti, G.; Barcellona, M.R.; Cabibi, D.; Galluzzo, A.; Sinagra, D.; Giordano, C.; et al. Visceral adiposity index is associated with significant fibrosis in patients with non-alcoholic fatty liver disease. Aliment. Pharmacol. Ther. 2012, 35, 238–247. [Google Scholar] [CrossRef] [PubMed]
- Ercin, C.N.; Dogru, T.; Genc, H.; Celebi, G.; Aslan, F.; Gurel, H.; Kara, M.; Sertoglu, E.; Tapan, S.; Bagci, S.; et al. Insulin resistance but not visceral adiposity index is associated with liver fibrosis in nondiabetic subjects with nonalcoholic fatty liver disease. Hepatol. Int. 2015, 9, S369. [Google Scholar] [CrossRef]
- Fedchuk, L.; Nascimbeni, F.; Pais, R.; Charlotte, F.; Housset, C.; Ratziu, V. Performance and limitations of steatosis biomarkers in patients with nonalcoholic fatty liver disease. Aliment. Pharmacol. Ther. 2014, 40, 1209–1222. [Google Scholar] [CrossRef]
- Ebrahimi, M.; Seyedi, S.A.; Nabipoorashrafi, S.A.; Rabizadeh, S.; Sarzaeim, M.; Yadegar, A.; Mohammadi, F.; Bahri, R.A.; Pakravan, P.; Shafiekhani, P.; et al. Lipid accumulation product (LAP) index for the diagnosis of nonalcoholic fatty liver disease (NAFLD): A systematic review and meta-analysis. Lipids Health Dis. 2023, 22, 41. [Google Scholar] [CrossRef] [PubMed] [PubMed Central]
- Hu, S.; Wang, Z.; Zhu, K.; Shi, H.; Qin, F.; Zhang, T.; Tian, S.; Ji, Y.; Zhang, J.; Qin, J.; et al. USP29 alleviates the progression of MASLD by stabilizing ACSL5 through K48 deubiquitination. Clin. Mol. Hepatol. 2025, 31, 147–165. [Google Scholar] [CrossRef] [PubMed] [PubMed Central]
- Popa, M.L.; Ichim, C.; Anderco, P.; Todor, S.B.; Pop-Lodromanean, D. MicroRNAs in the Diagnosis of Digestive Diseases: A Comprehensive Review. J. Clin. Med. 2025, 14, 2054. [Google Scholar] [CrossRef] [PubMed] [PubMed Central]
- Pugliese, N.; Bertazzoni, A.; Hassan, C.; Schattenberg, J.M.; Aghemo, A. Revolutionizing MASLD: How Artificial Intelligence Is Shaping the Future of Liver Care. Cancers 2025, 17, 722. [Google Scholar] [CrossRef] [PubMed] [PubMed Central]

| Parameter | Methodology |
|---|---|
| Complete Blood Count (CBC) | Automated hematology analyzer |
| Fasting Blood Glucose | Enzymatic hexokinase method |
| Total Cholesterol | Enzymatic colorimetric method |
| HDL-Cholesterol | Direct enzymatic method |
| LDL-Cholesterol | Calculated using the Friedewald formula (if TG < 400 mg/dL) or direct measurement |
| Triglycerides | Enzymatic colorimetric method |
| Gamma-Glutamyl Transferase (γ-GT) | Enzymatic method |
| Serum Albumin | Bromocresol green dye-binding method |
| AST, ALT | IFCC (International Federation of Clinical Chemistry) standardized enzymatic methods |
| Parameter | n = 178 |
|---|---|
| Age | 52.79 ± 12.56 |
| Gender | |
| Males | 98 (55.1%) |
| Females | 80 (44.9%) |
| BMI (kg/m2) | 31.4 ± 5.3 |
| Abdominal circumference (AC) (cm) | 109.1 ± 11.4 |
| Laboratory findings | |
| RBCs (g/dL) | 11.1 ± 3.76 |
| WBCs (×10⁹/L) | 8.21 ± 2.49 |
| Platelet count (×10⁹/L) | 225 ± 38.7 |
| Serum albumin levels (mg/dL) | 3.3 ± 1.23 |
| AST (UI/L) | 42.3 ± 23.7 |
| ALT (UI/L) | 53.1 ± 39.6 |
| Cholesterol (mg/dL) | 203.2 ± 46.6 |
| HDLc (mg/dL) | 44.3 ± 10.6 |
| LDLc (mg/dL) | 149 ± 32.8 |
| Triglyceride (mg/dL) | 198.2 ± 148.9 |
| FBG (mg/dL) | 114.5 [110–120] |
| Liver steatosis distribution by CAP | |
| CAP mean values (dB/m) | 322.5 ± 39.6 |
| S0 | 55 (31%) |
| S1 | 9 (5%) |
| S2 | 38 (21.3%) |
| S3 | 76 (42.7%) |
| Liver fibrosis distribution by TE | |
| F0–F1 | 81 (45.5%) |
| F2 | 48 (27%) |
| F3 | 31 (17.4%) |
| F4 | 18 (10.1%) |
| Visceral adiposity non-invasive biomarkers | |
| TyG index | 4.93 [4.82–5.31] |
| VAI | 3.67 [2.51–4.63] |
| LAP | 74.02 [61.34–86.29] |
| Parameter | S0–S1 (n = 64) | S2–S3 (n = 114) | p Value | F0–F2 (n = 129) | F3–F4 (n = 49) | p Value |
|---|---|---|---|---|---|---|
| Gender distribution | ||||||
| Male | 57.8% (37) | 53.5% (61) | 0.6981 | 53.5% (69) | 59.2% (29) | 0.6071 |
| Female | 42.2% (27) | 46.5% (53) | 0.6981 | 46.5% (60) | 40.8% (20) | 0.6071 |
| Mean age | 53.49 ± 9.98 | 52.44 ± 12.2 | 0.5581 | 54.22 ± 10.11 | 51.3 ± 11.6 | 0.1001 |
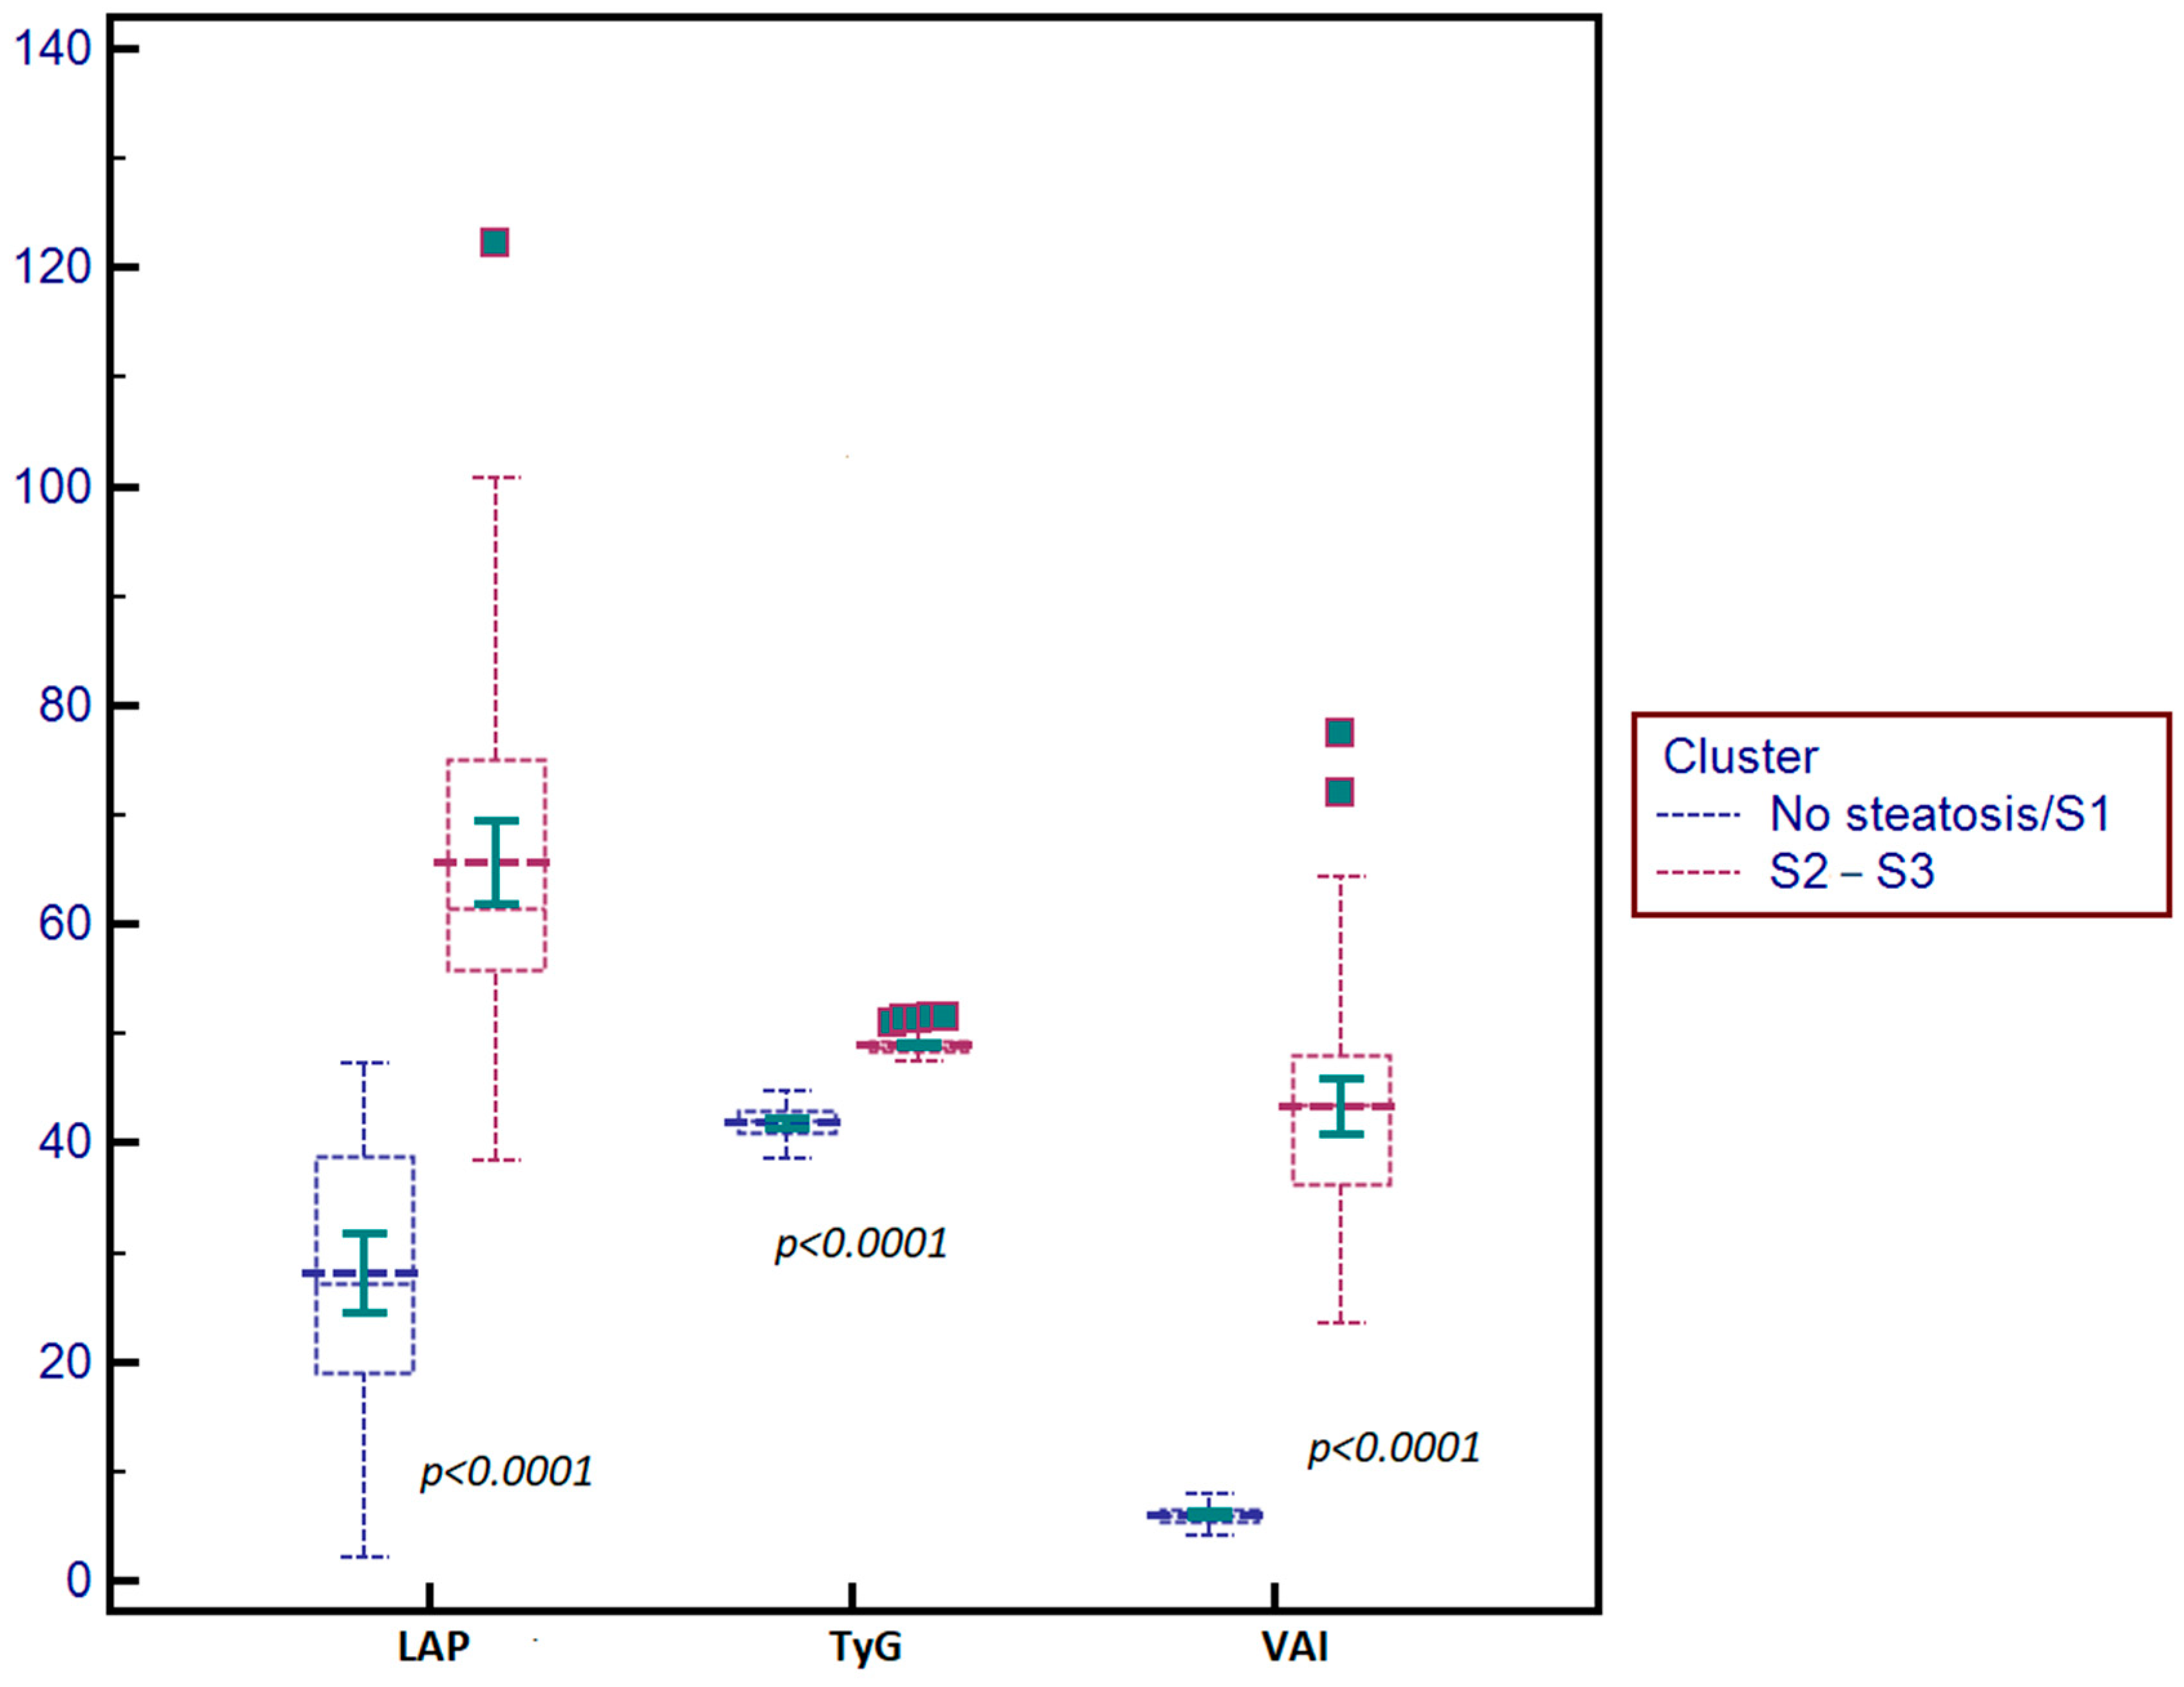
| Parameter | S0–S1 | S2–S3 | p Value |
|---|---|---|---|
| TyG index | 4.20 ± 0.32 | 4.87 ± 0.43 | p < 0.0001 |
| VAI | 1.09 ± 0.22 | 4.35 ± 0.56 | p < 0.0001 |
| LAP | 25.40 ± 6.32 | 61.41 ±12.13 | p < 0.0001 |
| Parameter | Liver Steatosis | Liver Fibrosis |
|---|---|---|
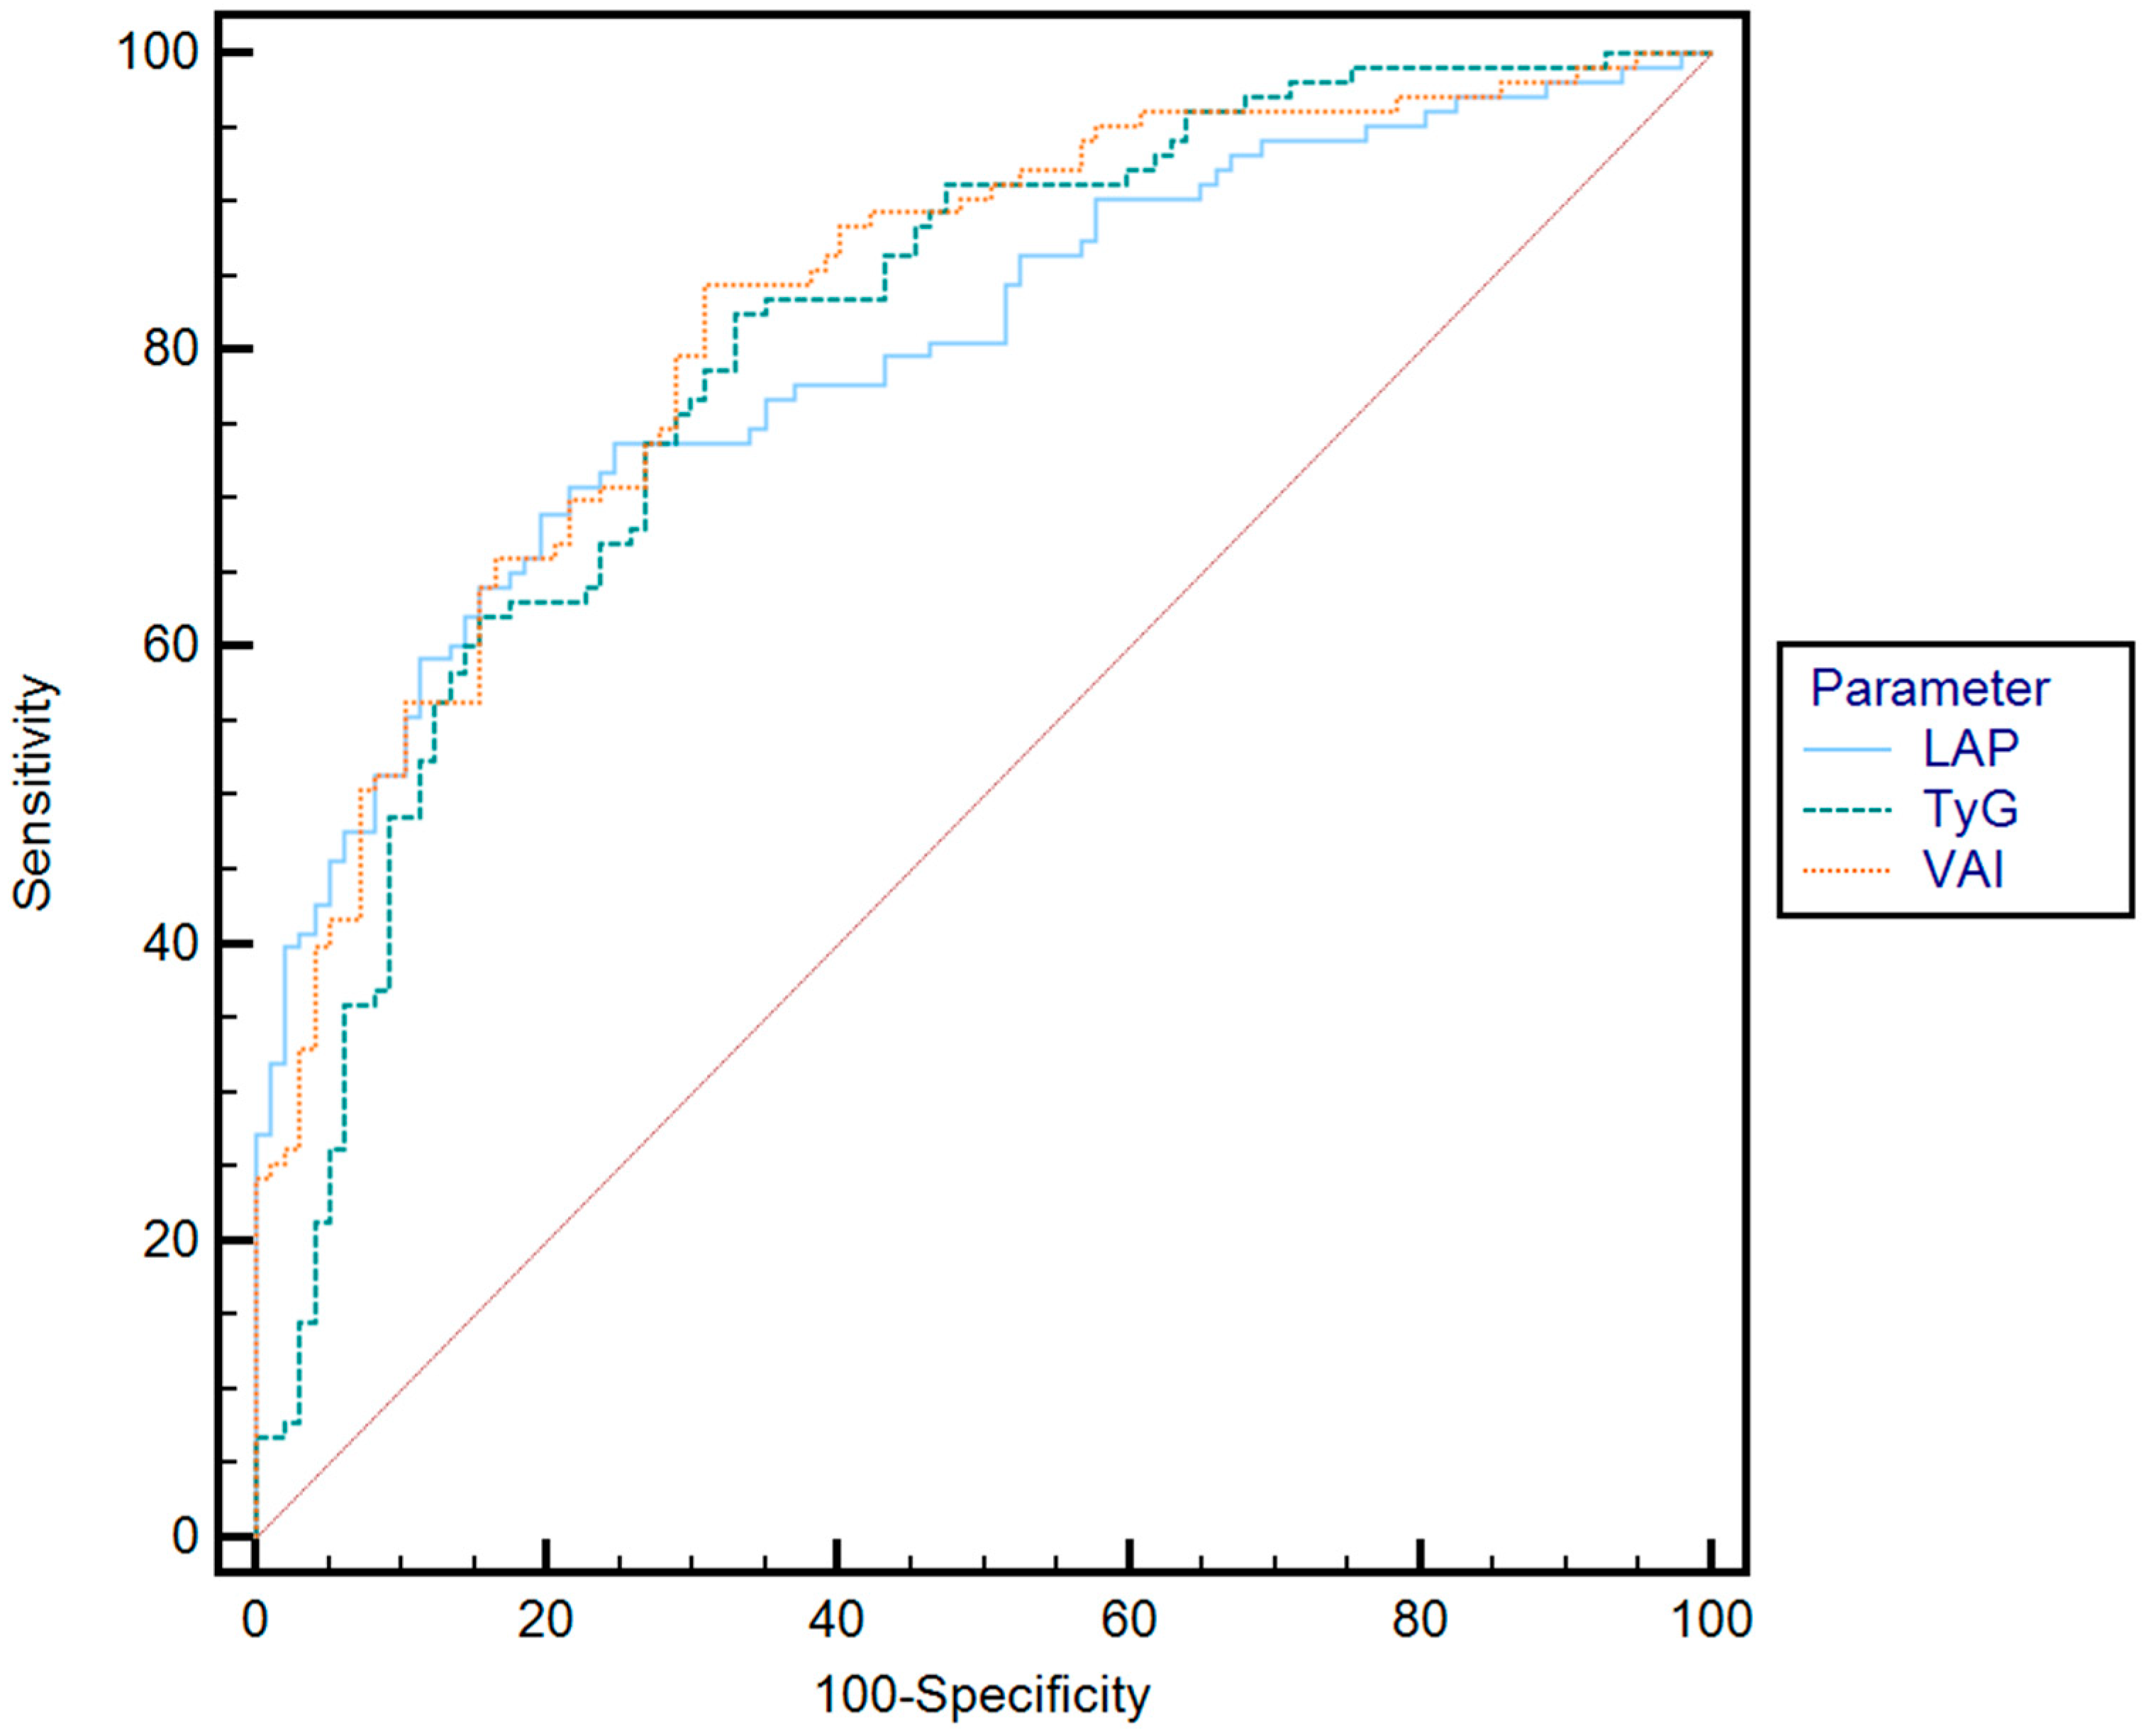
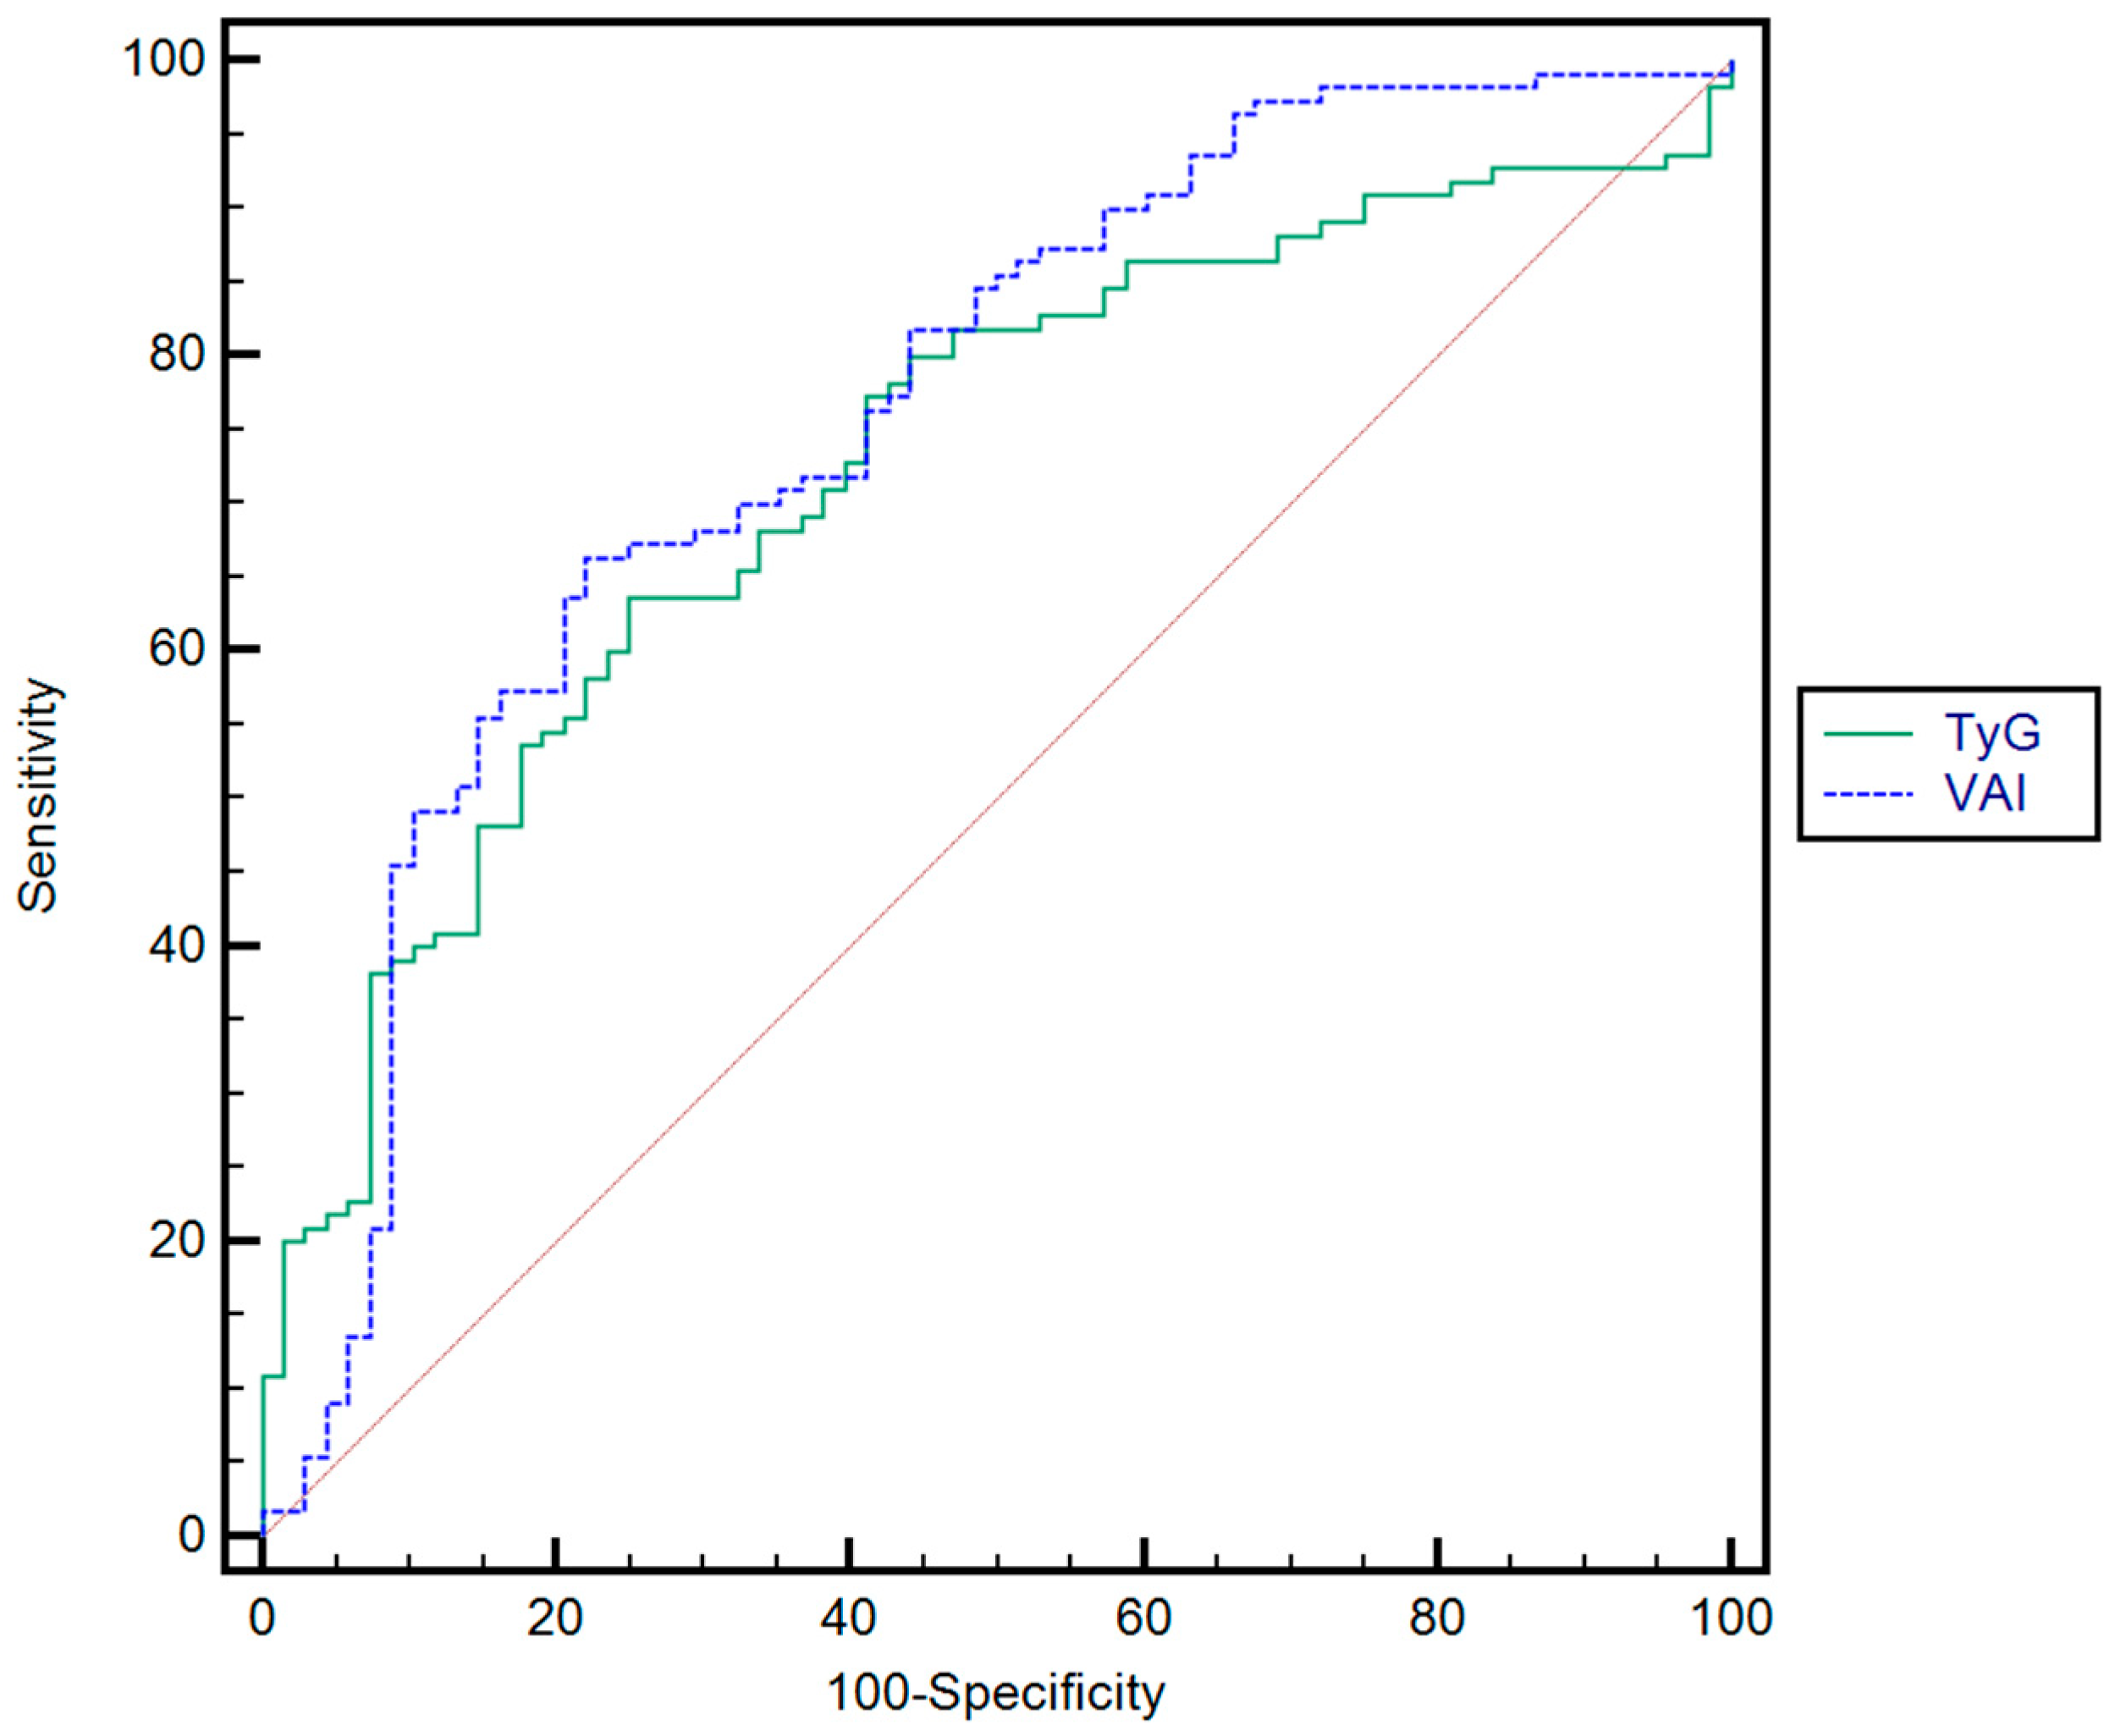
| TyG index | r = 0.66, p < 0.0001 95% CI [0.491–0.742] | r = 0.53, p < 0.0001 95% CI [0.411–0.623] |
| VAI | r = 0.76, p < 0.0001 95% CI [0.641–0.822] | r = 0.63, p < 0.0001 95% CI [0.511–0.702] |
| LAP | r = 0.61, p < 0.0001 95% CI [0.481–0.683] | r = 0.51, p < 0.0001 95% CI [0.381–0.542] |
| Predictor | Regression Parameters | ||||
|---|---|---|---|---|---|
| β | SE | p | OR | 95% CI | |
| Multivariate regression analysis of liver steatosis | |||||
| AC (cm) | β = 1.006 | ±0.083 | p = 0.0381 | OR = 2.734 | [2.331–3.207] |
| BMI (kg/m2) | β = 1.062 | ±0.091 | p = 0.0414 | OR = 2.892 | [2.457–3.402] |
| TyG | β = 2.136 | ±0.58 | p = 0.0033 | OR = 8.467 | [2.730–26.3] |
| VAI | β = 2.044 | ±0.91 | p < 0.0001 | OR = 7.721 | [1.297–45.95] |
| LAP | β = 1.022 | ±0.095 | p = 0.0341 | OR = 2.778 | [2.303–3.351] |
| Multivariate regression analysis of liver fibrosis | |||||
| TyG | β = 1.936 | ±0.88 | p = 0.0112 | OR = 6.927 | [1.226–39.15] |
| VAI | β = 2.009 | ±0.91 | p = 0.002 | OR = 7.456 | [1.260–44.12] |
| Parameter | Cut-Off | AUC | Se (%) | Sp (%) | PPV (%) | NPV (%) | p | |
|---|---|---|---|---|---|---|---|---|
| Optimal cut-off value * | TyG | 4.80 | 0.72 | 82.8 | 62.3 | 61.5 | 84.1 | p < 0.001 |
| VAI | 4.76 | 0.76 | 81.3 | 61.3 | 63.8 | 82.2 | p < 0.001 | |
| Rule-in ** | TyG | 5.61 | 0.72 | 49 | 74 | 72.9 | 63 | p < 0.001 |
| VAI | 6.21 | 0.76 | 53.9 | 79 | 2.6 | 72.6 | p < 0.001 | |
| Rule-out *** | TyG | 2.65 | 0.72 | 80.3 | 41.6 | 52.7 | 83.6 | p < 0.001 |
| VAI | 1.67 | 0.76 | 81.2 | 50 | 56.5 | 87.7 | p < 0.001 |
| Grey zone | |||
| Rule out F3–F4 NFS ≤ −1.455 and FIB-4 ≤ 1.3 | −1.455 ≤ NFS > 0.676 1.3 ≤ FIB-4 > 2.67 | Rule in F3–F4 NFS > 0.676 and FIB-4 > 2.67 | |
| Absence of F3–F4 | Unclassified subjects | Presence of F3–F4 | |
| Classification by NFS and FIB-4 rule-in and rule-out cut-off values | 51/114 (44.7%) | 42/114 (36.8%) | 21/114 (18.4%) |
| Classification by TE rule-in and rule-out cut-off values | 44/51 (86.3%) correctly classified | 17/21(81%) correctly classified | |
| Classification by TyG and VAI rule-in and rule-out cut-off values | 12/42 (28.5%) additionally classified, with 75% (9/12) of them correctly classified |
Disclaimer/Publisher’s Note: The statements, opinions and data contained in all publications are solely those of the individual author(s) and contributor(s) and not of MDPI and/or the editor(s). MDPI and/or the editor(s) disclaim responsibility for any injury to people or property resulting from any ideas, methods, instructions or products referred to in the content. |
© 2025 by the authors. Licensee MDPI, Basel, Switzerland. This article is an open access article distributed under the terms and conditions of the Creative Commons Attribution (CC BY) license (https://creativecommons.org/licenses/by/4.0/).
Share and Cite
Bende, R.; Heredea, D.; Rațiu, I.; Sporea, I.; Dănilă, M.; Șirli, R.; Popescu, A.; Bende, F. Association Between Visceral Adiposity and the Prediction of Hepatic Steatosis and Fibrosis in Patients with Metabolic Dysfunction-Associated Steatotic Liver Disease (MASLD). J. Clin. Med. 2025, 14, 3405. https://doi.org/10.3390/jcm14103405
Bende R, Heredea D, Rațiu I, Sporea I, Dănilă M, Șirli R, Popescu A, Bende F. Association Between Visceral Adiposity and the Prediction of Hepatic Steatosis and Fibrosis in Patients with Metabolic Dysfunction-Associated Steatotic Liver Disease (MASLD). Journal of Clinical Medicine. 2025; 14(10):3405. https://doi.org/10.3390/jcm14103405
Chicago/Turabian StyleBende, Renata, Darius Heredea, Iulia Rațiu, Ioan Sporea, Mirela Dănilă, Roxana Șirli, Alina Popescu, and Felix Bende. 2025. "Association Between Visceral Adiposity and the Prediction of Hepatic Steatosis and Fibrosis in Patients with Metabolic Dysfunction-Associated Steatotic Liver Disease (MASLD)" Journal of Clinical Medicine 14, no. 10: 3405. https://doi.org/10.3390/jcm14103405
APA StyleBende, R., Heredea, D., Rațiu, I., Sporea, I., Dănilă, M., Șirli, R., Popescu, A., & Bende, F. (2025). Association Between Visceral Adiposity and the Prediction of Hepatic Steatosis and Fibrosis in Patients with Metabolic Dysfunction-Associated Steatotic Liver Disease (MASLD). Journal of Clinical Medicine, 14(10), 3405. https://doi.org/10.3390/jcm14103405