
Association of Tumor Necrosis Factor-Alpha, Interleukin-1β, Interleukin-8, and Interferon-γ with Obstructive Sleep Apnea in Both Children and Adults: A Meta-Analysis of 102 Articles


Abstract
1. Introduction
2. Materials and Methods
2.1. Literature Search
2.2. Study Selection
2.3. Data Extraction
2.4. Statistical Analysis and Data Synthesis
3. Results
3.1. Search Strategy
3.2. Characteristics of Articles
3.3. Pooled Analysis in Adults
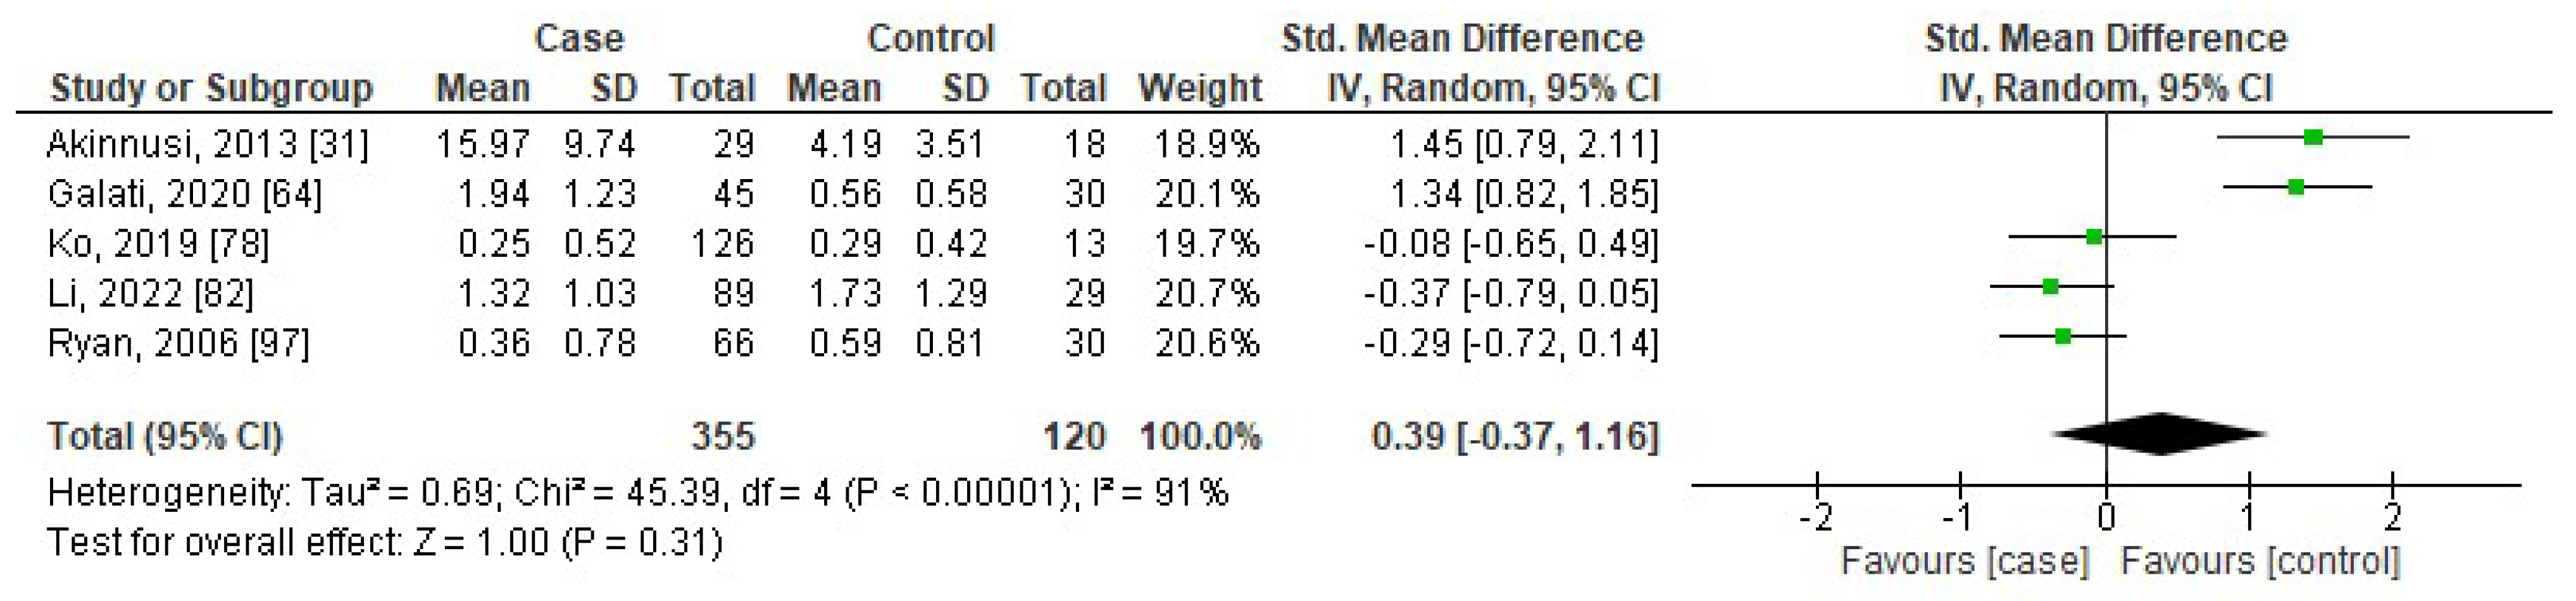
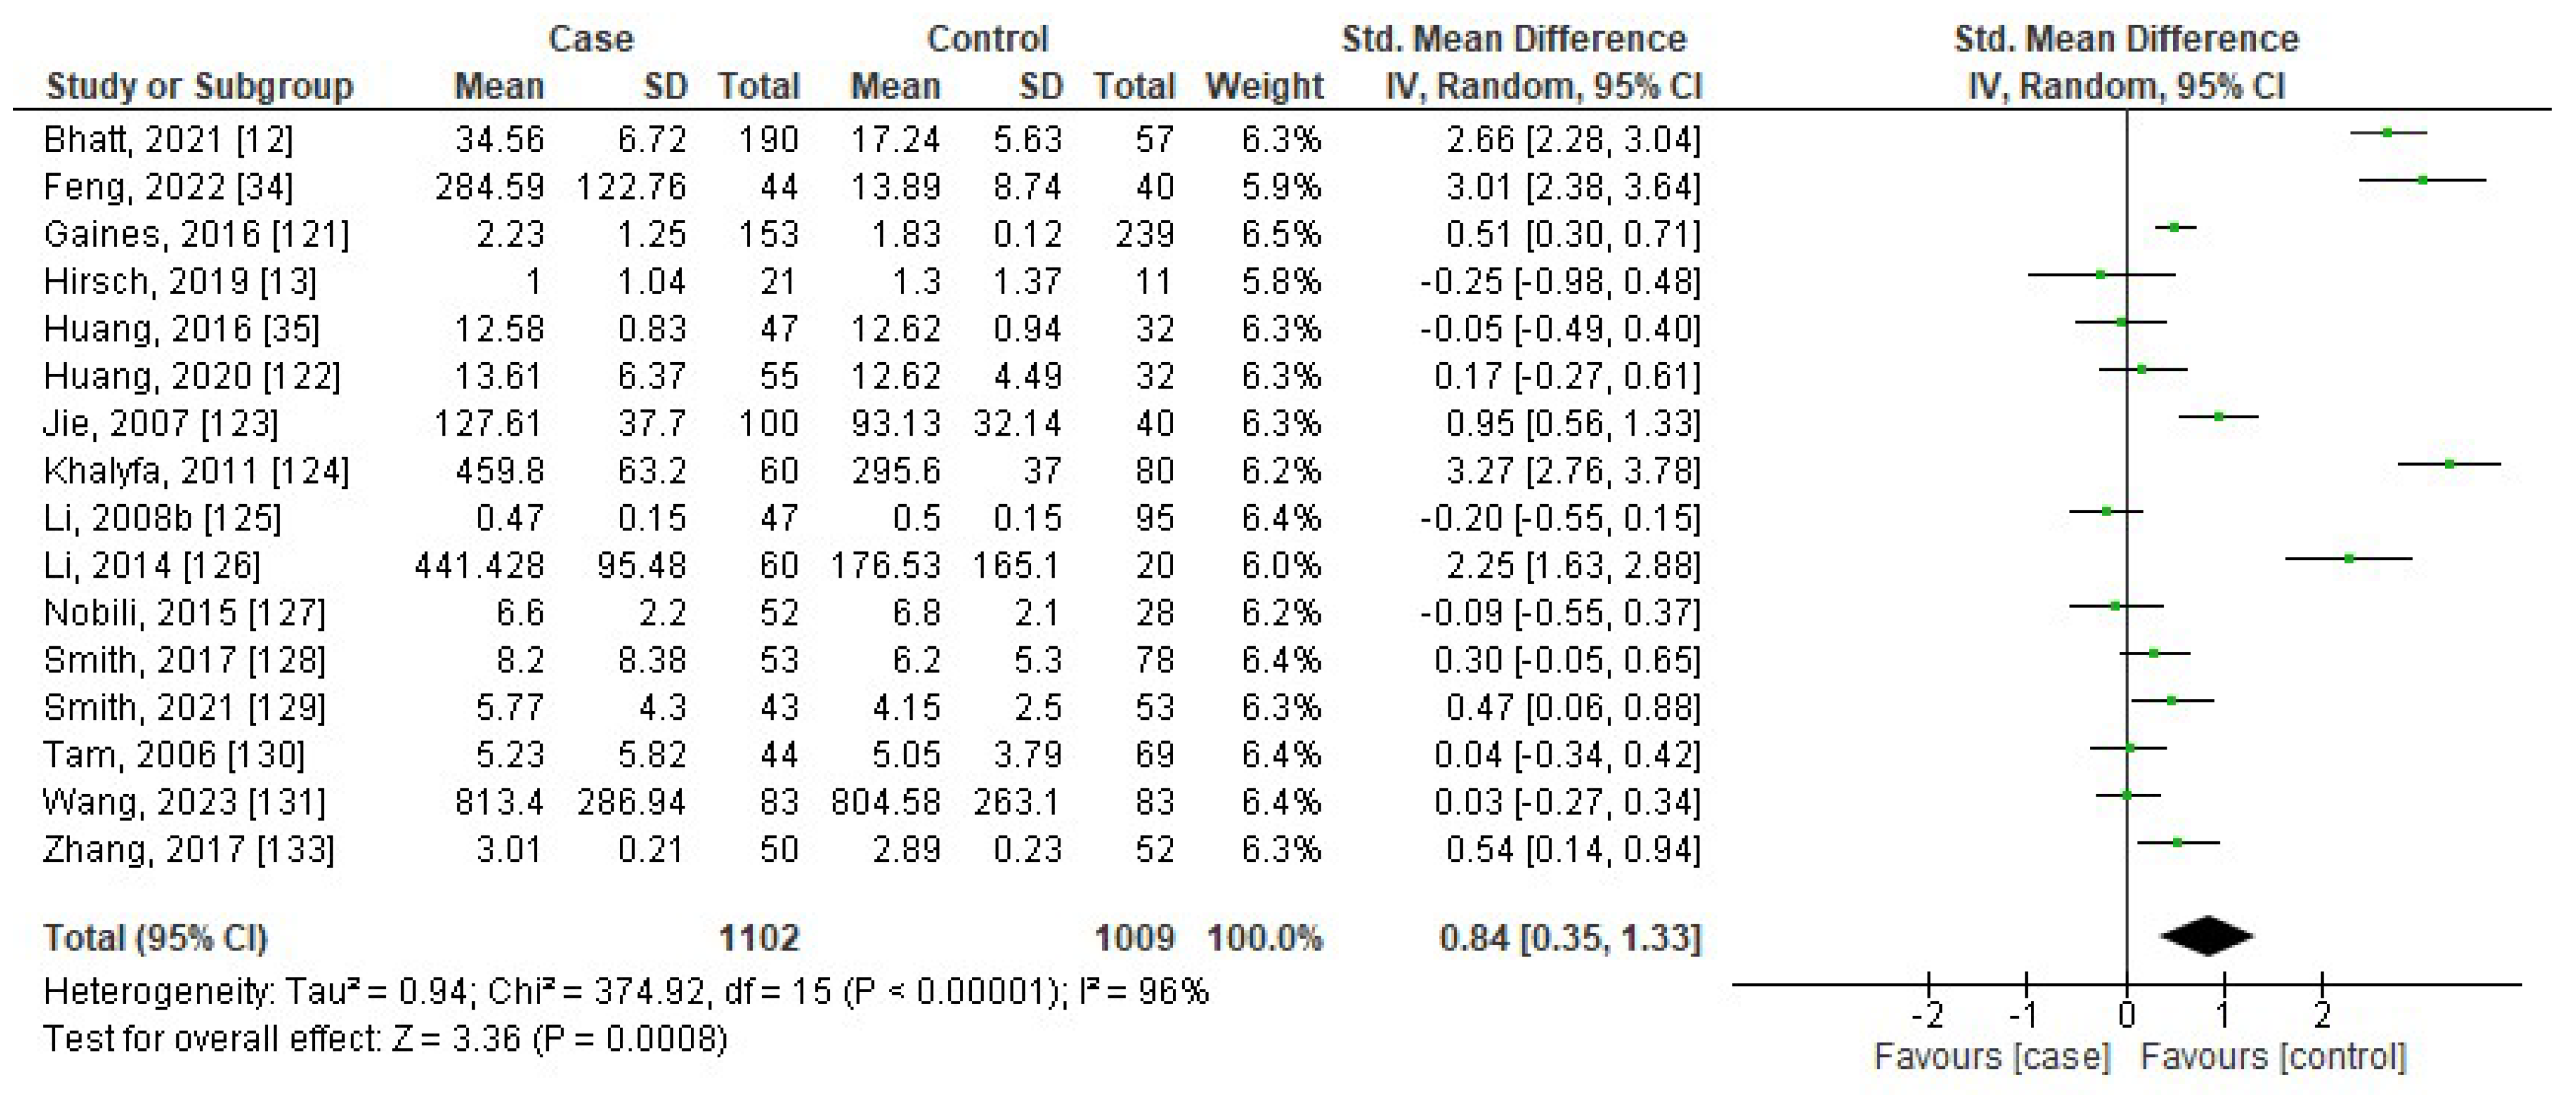
3.4. Pooled Analysis in Children
3.5. Subgroup Analysis
3.6. Subgroup Analysis
3.7. Publication Bias
3.8. Sensitivity Analysis
3.9. TSA
4. Discussion
4.1. Strengths
4.2. Limitations
5. Conclusions
Supplementary Materials
Author Contributions
Funding
Institutional Review Board Statement
Informed Consent Statement
Data Availability Statement
Conflicts of Interest
References
- Senaratna, C.V.; Perret, J.L.; Lodge, C.J.; Lowe, A.J.; Campbell, B.E.; Matheson, M.C.; Hamilton, G.S.; Dharmage, S.C. Prevalence of obstructive sleep apnea in the general population: A systematic review. Sleep Med. Rev. 2017, 34, 70–81. [Google Scholar] [CrossRef]
- Heinzer, R.; Vat, S.; Marques-Vidal, P.; Marti-Soler, H.; Andries, D.; Tobback, N.; Mooser, V.; Preisig, M.; Malhotra, A.; Waeber, G. Prevalence of sleep-disordered breathing in the general population: The HypnoLaus study. Lancet Respir. Med. 2015, 3, 310–318. [Google Scholar] [CrossRef] [PubMed]
- Benjafield, A.V.; Ayas, N.T.; Eastwood, P.R.; Heinzer, R.; Ip, M.S.; Morrell, M.J.; Nunez, C.M.; Patel, S.R.; Penzel, T.; Pépin, J.-L. Estimation of the global prevalence and burden of obstructive sleep apnoea: A literature-based analysis. Lancet Respir. Med. 2019, 7, 687–698. [Google Scholar] [CrossRef] [PubMed]
- Kapur, V.K.; Auckley, D.H.; Chowdhuri, S.; Kuhlmann, D.C.; Mehra, R.; Ramar, K.; Harrod, C.G. Clinical practice guideline for diagnostic testing for adult obstructive sleep apnea: An American Academy of Sleep Medicine clinical practice guideline. J. Clin. Sleep Med. 2017, 13, 479–504. [Google Scholar] [CrossRef] [PubMed]
- Semelka, M.; Wilson, J.; Floyd, R. Diagnosis and treatment of obstructive sleep apnea in adults. Am. Fam. Physician 2016, 94, 355–360. [Google Scholar] [PubMed]
- Young, T.; Palta, M.; Dempsey, J.; Peppard, P.E.; Nieto, F.J.; Hla, K.M. Burden of sleep apnea: Rationale, design, and major findings of the Wisconsin Sleep Cohort study. WMJ Off. Publ. State Med. Soc. Wis. 2009, 108, 246. [Google Scholar]
- Peppard, P.E.; Young, T.; Barnet, J.H.; Palta, M.; Hagen, E.W.; Hla, K.M. Increased prevalence of sleep-disordered breathing in adults. Am. J. Epidemiol. 2013, 177, 1006–1014. [Google Scholar] [CrossRef] [PubMed]
- Gamsiz-Isik, H.; Kiyan, E.; Bingol, Z.; Baser, U.; Ademoglu, E.; Yalcin, F. Does obstructive sleep apnea increase the risk for periodontal disease? A case-control study. J. Periodontol. 2017, 88, 443–449. [Google Scholar] [CrossRef] [PubMed]
- Dempsey, J.A.; Veasey, S.C.; Morgan, B.J.; O’Donnell, C.P. Pathophysiology of sleep apnea. Physiol. Rev. 2010, 90, 47–112. [Google Scholar] [CrossRef]
- Bixler, E.O.; Vgontzas, A.N.; Lin, H.-M.; Liao, D.; Calhoun, S.; Vela-Bueno, A.; Fedok, F.; Vlasic, V.; Graff, G. Sleep disordered breathing in children in a general population sample: Prevalence and risk factors. Sleep 2009, 32, 731–736. [Google Scholar] [CrossRef]
- Kang, M.; Mo, F.; Witmans, M.; Santiago, V.; Tablizo, M.A. Trends in diagnosing obstructive sleep apnea in pediatrics. Children 2022, 9, 306. [Google Scholar] [CrossRef]
- Bhatt, S.P.; Guleria, R.; Kabra, S.K. Metabolic alterations and systemic inflammation in overweight/obese children with obstructive sleep apnea. PLoS ONE 2021, 16, e0252353. [Google Scholar] [CrossRef]
- Hirsch, D.; Evans, C.A.; Wong, M.; Machaalani, R.; Waters, K.A. Biochemical markers of cardiac dysfunction in children with obstructive sleep apnoea (OSA). Sleep Breath. 2019, 23, 95–101. [Google Scholar] [CrossRef] [PubMed]
- Boyd, J.H.; Petrof, B.J.; Hamid, Q.; Fraser, R.; Kimoff, R.J. Upper airway muscle inflammation and denervation changes in obstructive sleep apnea. Am. J. Respir. Crit. Care Med. 2004, 170, 541–546. [Google Scholar] [CrossRef] [PubMed]
- Paulsen, F.P.; Steven, P.; Tsokos, M.; Jungmann, K.; Müller, A.; Verse, T.; Pirsig, W. Upper airway epithelial structural changes in obstructive sleep-disordered breathing. Am. J. Respir. Crit. Care Med. 2002, 166, 501–509. [Google Scholar] [CrossRef] [PubMed]
- Vicente, E.; Marin, J.M.; Carrizo, S.J.; Osuna, C.S.; González, R.; Marin-Oto, M.; Forner, M.; Vicente, P.; Cubero, P.; Gil, A.V. Upper airway and systemic inflammation in obstructive sleep apnoea. Eur. Respir. J. 2016, 48, 1108–1117. [Google Scholar] [CrossRef] [PubMed]
- Imani, M.M.; Sadeghi, M.; Farokhzadeh, F.; Khazaie, H.; Brand, S.; Dürsteler, K.M.; Brühl, A.; Sadeghi-Bahmani, D. Evaluation of Blood Levels of C-Reactive Protein Marker in Obstructive Sleep Apnea: A Systematic Review, Meta-Analysis and Meta-Regression. Life 2021, 11, 362. [Google Scholar] [CrossRef] [PubMed]
- Imani, M.M.; Sadeghi, M.; Gholamipour, M.A.; Brühl, A.B.; Sadeghi-Bahmani, D.; Brand, S. Evaluation of Blood Intercellular Adhesion Molecule-1 (ICAM-1) Level in Obstructive Sleep Apnea: A Systematic Review and Meta-Analysis. Medicina 2022, 58, 1499. [Google Scholar] [CrossRef] [PubMed]
- Imani, M.M.; Sadeghi, M.; Khazaie, H.; Emami, M.; Bahmani, D.S.; Brand, S. Evaluation of serum and plasma interleukin-6 levels in obstructive sleep apnea syndrome: A meta-analysis and meta-regression. Front. Immunol. 2020, 11, 1343. [Google Scholar] [CrossRef] [PubMed]
- Imani, M.M.; Sadeghi, M.; Khazaie, H.; Emami, M.; Bahmani, D.S.; Brand, S. Serum and plasma tumor necrosis factor alpha levels in individuals with obstructive sleep apnea syndrome: A meta-analysis and meta-regression. Life 2020, 10, 87. [Google Scholar] [CrossRef]
- Doğan, F.Ü.; Yosunkaya, Ş.; Okur, H.K.; Can, Ü. Relationships between obstructive sleep apnea syndrome, continuous positive airway pressure treatment, and inflammatory cytokines. Sleep Disord. 2014, 2014, 518920. [Google Scholar]
- Kapsimalis, F.; Richardson, G.; Opp, M.R.; Kryger, M. Cytokines and normal sleep. Curr. Opin. Pulm. Med. 2005, 11, 481–484. [Google Scholar] [CrossRef]
- Testelmans, D.; Tamisier, R.; Barone-Rochette, G.; Baguet, J.-P.; Roux-Lombard, P.; Pépin, J.-L.; Lévy, P. Profile of circulating cytokines: Impact of OSA, obesity and acute cardiovascular events. Cytokine 2013, 62, 210–216. [Google Scholar] [CrossRef]
- Li, Q.; Zheng, X. Tumor necrosis factor alpha is a promising circulating biomarker for the development of obstructive sleep apnea syndrome: A meta-analysis. Oncotarget 2017, 8, 27616. [Google Scholar] [CrossRef] [PubMed]
- Yi, M.; Zhao, W.; Tan, Y.; Fei, Q.; Liu, K.; Chen, Z.; Zhang, Y. The causal relationships between obstructive sleep apnea and elevated CRP and TNF-α protein levels. Ann. Med. 2022, 54, 1578–1589. [Google Scholar] [CrossRef] [PubMed]
- Cao, Y.; Song, Y.; Ning, P.; Zhang, L.; Wu, S.; Quan, J.; Li, Q. Association between tumor necrosis factor alpha and obstructive sleep apnea in adults: A meta-analysis update. BMC Pulm. Med. 2020, 20, 215. [Google Scholar] [CrossRef] [PubMed]
- Zeng, Q.-C.; Sun, Q.; Zhang, M.; Tang, Y.; Long, H.-C. Relation between IL-8 level and obstructive sleep apnea syndrome. Open Med. 2021, 16, 683–691. [Google Scholar] [CrossRef]
- Janmohammadi, P.; Raeisi, T.; Zarei, M.; Nejad, M.M.; Karimi, R.; Mirali, Z.; Zafary, R.; Alizadeh, S. Adipocytokines in obstructive sleep apnea: A systematic review and meta-analysis. Respir. Med. 2023, 208, 107122. [Google Scholar] [CrossRef] [PubMed]
- Nadeem, R.; Molnar, J.; Madbouly, E.M.; Nida, M.; Aggarwal, S.; Sajid, H.; Naseem, J.; Loomba, R. Serum inflammatory markers in obstructive sleep apnea: A meta-analysis. J. Clin. Sleep Med. 2013, 9, 1003–1012. [Google Scholar] [CrossRef] [PubMed]
- Li, X.; Hu, R.; Ren, X.; He, J. Interleukin-8 concentrations in obstructive sleep apnea syndrome: A systematic review and meta-analysis. Bioengineered 2021, 12, 10650–10665. [Google Scholar] [CrossRef] [PubMed]
- Akinnusi, M.; Jaoude, P.; Kufel, T.; El-Solh, A.A. Toll-like receptor activity in patients with obstructive sleep apnea. Sleep Breath. 2013, 17, 1009–1016. [Google Scholar] [CrossRef] [PubMed]
- Bhushan, B.; Guleria, R.; Misra, A.; Luthra, K.; Vikram, N.K. TNF-alpha gene polymorphism and TNF-alpha levels in obese Asian Indians with obstructive sleep apnea. Respir. Med. 2009, 103, 386–392. [Google Scholar] [CrossRef] [PubMed]
- Ciftci, T.U.; Kokturk, O.; Bukan, N.; Bilgihan, A. The relationship between serum cytokine levels with obesity and obstructive sleep apnea syndrome. Cytokine 2004, 28, 87–91. [Google Scholar] [CrossRef] [PubMed]
- Feng, Y.; Ma, L.; Chen, X.; Zhang, Y.; Cao, Z.; Yuan, Y.; Xie, Y.; Liu, H.; Shi, Y.; Ren, X. Relationship between serum brain-derived neurotrophic factor and cognitive impairment in children with sleep-disordered breathing. Front. Pediatr. 2022, 10, 1027894. [Google Scholar] [CrossRef]
- Huang, Y.S.; Guilleminault, C.; Hwang, F.M.; Cheng, C.; Lin, C.H.; Li, H.Y.; Lee, L.A. Inflammatory cytokines in pediatric obstructive sleep apnea. Medicine 2016, 95, e4944. [Google Scholar] [CrossRef]
- Epstein, L.J.; Kristo, D.; Strollo, P.J., Jr.; Friedman, N.; Malhotra, A.; Patil, S.P.; Ramar, K.; Rogers, R.; Schwab, R.J.; Weaver, E.M.; et al. Clinical guideline for the evaluation, management and long-term care of obstructive sleep apnea in adults. J. Clin. Sleep Med. 2009, 5, 263–276. [Google Scholar]
- Farber, J.M. Clinical practice guideline: Diagnosis and management of childhood obstructive sleep apnea syndrome. Pediatrics 2002, 110, 1255–1257. [Google Scholar] [CrossRef]
- Stang, A. Critical evaluation of the Newcastle-Ottawa scale for the assessment of the quality of nonrandomized studies in meta-analyses. Eur. J. Epidemiol. 2010, 25, 603–605. [Google Scholar] [CrossRef] [PubMed]
- DerSimonian, R.; Laird, N. Meta-analysis in clinical trials revisited. Contemp. Clin. Trials 2015, 45, 139–145. [Google Scholar] [CrossRef]
- Mantel, N.; Haenszel, W. Statistical aspects of the analysis of data from retrospective studies of disease. J. Natl. Cancer Inst. 1959, 22, 719–748. [Google Scholar] [PubMed]
- Wetterslev, J.; Jakobsen, J.C.; Gluud, C. Trial sequential analysis in systematic reviews with meta-analysis. BMC Med. Res. Methodol. 2017, 17, 39. [Google Scholar] [CrossRef]
- Abdel-Fadeil, M.R.; Abedelhaffez, A.S.; Makhlouf, H.A.; Al Qirshi, G.A. Obstructive sleep apnea: Influence of hypertension on adiponectin, inflammatory markers and dyslipidemia. Pathophysiology 2017, 24, 305–315. [Google Scholar] [CrossRef] [PubMed]
- Abulikemu, Y.; Abulajang, T.; Ailigen, A.; Tang, L. Analysis of propensity score matching between inflammatory factor levels and gene polymorphisms and susceptibility to obstructive sleep apnea. Lin Chuang Er Bi Yan Hou Tou Jing Wai Ke Za Zhi = J. Clin. Otorhinolaryngol. Head Neck Surg. 2021, 35, 728–732. [Google Scholar]
- Ahsant, S.; Rahmani Fard, S.; Riahi, T.; Taheri Tinjani, R.; Shamlou Mahmoudi, F.; Alimohamadi, Y.; Kooranifar, S.; Hosseinipour, A.; Minaeian, S. Evaluation the Possible Role of Interleukin-6 and Tumor Necrosis Factor-Alpha in Pathogenesis of Obstructive Sleep Apnea in Obese Patients: A Case-Control Study. Galen Med. J. 2022, 11, e2431. [Google Scholar] [CrossRef] [PubMed]
- Alzoghaibi, M.A.; Bahammam, A.S. Lipid peroxides, superoxide dismutase and circulating IL-8 and GCP-2 in patients with severe obstructive sleep apnea: A pilot study. Sleep Breath. 2005, 9, 119–126. [Google Scholar] [CrossRef] [PubMed]
- Archontogeorgis, K.; Nena, E.; Tsigalou, C.; Voulgaris, A.; Xanthoudaki, M.; Froudarakis, M.; Steiropoulos, P. Cystatin C levels in middle-aged patients with obstructive sleep apnea syndrome. Pulm. Med. 2016, 2016, 8081723. [Google Scholar] [CrossRef] [PubMed]
- Arias, M.; García-Río, F.; Alonso-Fernández, A.; Hernanz, A.; Hidalgo, R.; Martínez-Mateo, V.; Bartolomé, S.; Rodríguez-Padial, L. CPAP decreases plasma levels of soluble tumour necrosis factor-α receptor 1 in obstructive sleep apnoea. Eur. Respir. J. 2008, 32, 1009–1015. [Google Scholar] [CrossRef] [PubMed]
- Bhatt, S.P.; Guleria, R.; Vikram, N.K.; Gupta, A.K. Non-alcoholic fatty liver disease is an independent risk factor for inflammation in obstructive sleep apnea syndrome in obese Asian Indians. Sleep Breath. 2019, 23, 171–178. [Google Scholar] [CrossRef]
- Bilal, N.; Kurutas, E.B.; Orhan, I.; Bilal, B.; Doganer, A. Evaluation of preoperative and postoperative serum interleukin-6, interleukin-8, tumor necrosis factor α and raftlin levels in patients with obstructive sleep apnea. Sleep Breath. 2021, 25, 819–826. [Google Scholar] [CrossRef]
- Bozic, J.; Borovac, J.A.; Galic, T.; Kurir, T.T.; Supe-Domic, D.; Dogas, Z. Adropin and inflammation biomarker levels in male patients with obstructive sleep apnea: A link with glucose metabolism and sleep parameters. J. Clin. Sleep Med. 2018, 14, 1109–1118. [Google Scholar] [CrossRef]
- Carneiro, G.; Togeiro, S.M.; Ribeiro-Filho, F.F.; Truksinas, E.; Ribeiro, A.B.; Zanella, M.T.; Tufik, S. Continuous positive airway pressure therapy improves hypoadiponectinemia in severe obese men with obstructive sleep apnea without changes in insulin resistance. Metab. Syndr. Relat. Disord. 2009, 7, 537–542. [Google Scholar] [CrossRef] [PubMed]
- Carpagnano, G.E.; Spanevello, A.; Sabato, R.; Depalo, A.; Palladino, G.P.; Bergantino, L.; Barbaro, M.P.F. Systemic and airway inflammation in sleep apnea and obesity: The role of ICAM-1 and IL-8. Transl. Res. 2010, 155, 35–43. [Google Scholar] [CrossRef] [PubMed]
- Celikhisar, H.; Ilkhan, G.D. Alterations in serum adropin, adiponectin, and proinflammatory cytokine levels in OSAS. Can. Respir. J. 2020, 2020, 2571283. [Google Scholar] [CrossRef] [PubMed]
- Chen, B.; Liu, Y.N.; Ji, L.; Liu, P.L.; He, J.; Gan, Y.Y.; Ji, G.J.; Zhu, S.Y.; Zhang, W.H. Elevated levels of interleukin-35 and interleukin-37 in adult patients with obstructive sleep apnea. J. Clin. Lab. Anal. 2021, 35, e23790. [Google Scholar] [CrossRef]
- Chen, B.; Zhang, W.; Chen, Y.; Hu, C.; Bian, H.; He, J.; Ji, L.; Zhu, S. Association of obstructive sleep apnea hypopnea syndrome with carotid atherosclerosis and the efficacy of continuous positive airway pressure treatment. Zhonghua Yi Xue Za Zhi 2015, 95, 2791–2795. [Google Scholar]
- Chen, P.C.; Guo, C.H.; Tseng, C.J.; Wang, K.C.; Liu, P.J. Blood trace minerals concentrations and oxidative stress in patients with obstructive sleep apnea. J. Nutr. Health Aging 2013, 17, 639–644. [Google Scholar] [CrossRef]
- Ciccone, M.M.; Scicchitano, P.; Zito, A.; Cortese, F.; Boninfante, B.; Falcone, V.A.; Quaranta, V.N.; Ventura, V.A.; Zucano, A.; Di Serio, F. Correlation between inflammatory markers of atherosclerosis and carotid intima-media thickness in obstructive sleep apnea. Molecules 2014, 19, 1651–1662. [Google Scholar] [CrossRef]
- Constantinidis, J.; Ereliadis, S.; Angouridakis, N.; Konstantinidis, I.; Vital, V.; Angouridaki, C. Cytokine changes after surgical treatment of obstructive sleep apnoea syndrome. Eur. Arch. Oto-Rhino-Laryngol. 2008, 265, 1275–1279. [Google Scholar] [CrossRef]
- De Santis, S.; Cambi, J.; Tatti, P.; Bellussi, L.; Passali, D. Changes in ghrelin, leptin and pro-inflammatory cytokines after therapy in Obstructive Sleep Apnea Syndrome (OSAS) patients. Otolaryngol. Pol. 2015, 69, 1–8. [Google Scholar] [CrossRef]
- Devouassoux, G.; Lévy, P.; Rossini, E.; Pin, I.; Fior-Gozlan, M.; Henry, M.; Seigneurin, D.; Pépin, J.-L. Sleep apnea is associated with bronchial inflammation and continuous positive airway pressure–induced airway hyperresponsiveness. J. Allergy Clin. Immunol. 2007, 119, 597–603. [Google Scholar] [CrossRef]
- Doufas, A.G.; Tian, L.; Padrez, K.A.; Suwanprathes, P.; Cardell, J.A.; Maecker, H.T.; Panousis, P. Experimental pain and opioid analgesia in volunteers at high risk for obstructive sleep apnea. PLoS ONE 2013, 8, e54807. [Google Scholar] [CrossRef] [PubMed]
- Fiedorczuk, P.; Olszewska, E.; Polecka, A.; Walasek, M.; Mroczko, B.; Kulczyńska-Przybik, A. Investigating the Role of Serum and Plasma IL-6, IL-8, IL-10, TNF-alpha, CRP, and S100B Concentrations in Obstructive Sleep Apnea Diagnosis. Int. J. Mol. Sci. 2023, 24, 13875. [Google Scholar] [CrossRef]
- Fornadi, K.; Lindner, A.; Czira, M.E.; Szentkiralyi, A.; Lazar, A.S.; Zoller, R.; Turanyi, C.Z.; Veber, O.; Novak, M.; Mucsi, I. Lack of association between objectively assessed sleep disorders and inflammatory markers among kidney transplant recipients. Int. Urol. Nephrol. 2012, 44, 607–617. [Google Scholar] [CrossRef] [PubMed]
- Galati, D.; Zanotta, S.; Canora, A.; Polistina, G.E.; Nicoletta, C.; Ghinassi, G.; Ciasullo, E.; Bocchino, M. Severe depletion of peripheral blood dendritic cell subsets in obstructive sleep apnea patients: A new link with cancer? Cytokine 2020, 125, 154831. [Google Scholar] [CrossRef]
- Bao, H.R.; Yu, Q.; Liu, X.J.; Wang, X.Y. Changes of serum interleukin-8 and monocyte chemoattractant protein-1 levels in patients with obstructive sleep apnea hypopnea syndrome. Chin. J. Clin. Rehabil. 2005, 9, 71–73. [Google Scholar]
- Hargens, T.A.; Guill, S.G.; Kaleth, A.S.; Nickols-Richardson, S.M.; Miller, L.E.; Zedalis, D.; Gregg, J.M.; Gwazdauskas, F.; Herbert, W.G. Insulin resistance and adipose-derived hormones in young men with untreated obstructive sleep apnea. Sleep Breath. 2013, 17, 403–409. [Google Scholar] [CrossRef]
- Heizati, M.; Li, N.; Shao, L.; Yao, X.; Wang, Y.; Hong, J.; Zhou, L.; Zhang, D.; Chang, G.; Abulikemu, S. Does increased serum d-lactate mean subclinical hyperpermeability of intestinal barrier in middle-aged nonobese males with OSA? Medicine 2017, 96, e9144. [Google Scholar] [CrossRef]
- Hirotsu, C.; Albuquerque, R.G.; Nogueira, H.; Hachul, H.; Bittencourt, L.; Tufik, S.; Andersen, M.L. The relationship between sleep apnea, metabolic dysfunction and inflammation: The gender influence. Brain Behav. Immun. 2017, 59, 211–218. [Google Scholar] [CrossRef]
- Hui, P.; Jia, S.; Ma, W.; Zhao, L.; Wang, J.; Wei, X.; Zhou, L.; Dai, M.; Zhang, W.; Xie, Y. The clinical significance and changes of serum tumor necrosis factor and plasma endothelium in patients with OSAHS associated Type 2 diabetes mellites. Lin Chuang Er Bi Yan Hou Tou Jing Wai Ke Za Zhi 2016, 30, 217–219, 225. [Google Scholar] [PubMed]
- Huiguo, L.; Jin, L.; Shengdao, X.; Guanxin, S.; Zhenxiang, Z.; Yongjian, X. The change of interleukin-6 and tumor necrosis factor in patients with obstructive sleep apnea syndrome. J. Tongji Med. Univ. 2000, 20, 200–202. [Google Scholar] [CrossRef] [PubMed]
- Imagawa, S.; Yamaguchi, Y.; Ogawa, K.; Obara, N.; Suzuki, N.; Yamamoto, M.; Nagasawa, T. Interleukin-6 and tumor necrosis factor-alpha in patients with obstructive sleep apnea-hypopnea syndrome. Respiration 2004, 71, 24–29. [Google Scholar] [CrossRef]
- Ji, L.; Liu, Y.; Liu, P.; Ji, G.; He, J.; Gan, Y.; Zhu, S.; Chen, B.; Zhang, W. Serum periostin and TNF-α levels in patients with obstructive sleep apnea-hypopnea syndrome. Sleep Breath. 2021, 25, 331–337. [Google Scholar] [CrossRef]
- Ji, P.; Kou, Q.; Zhang, J. Study on relationship between carotid intima-media thickness and inflammatory factors in obstructive sleep apnea. Nat. Sci. Sleep 2022, 14, 2179–2187. [Google Scholar] [CrossRef]
- Jiang, Y.Q.; Xue, J.S.; Xu, J.; Zhou, Z.X.; Ji, Y.L. Efficacy of continuous positive airway pressure treatment in treating obstructive sleep apnea hypopnea syndrome associated with carotid arteriosclerosis. Exp. Ther. Med. 2017, 14, 6176–6182. [Google Scholar] [CrossRef]
- Jin, F.; Liu, J.; Zhang, X.; Cai, W.; Zhang, Y.; Zhang, W.; Yang, J.; Lu, G.; Zhang, X. Effect of continuous positive airway pressure therapy on inflammatory cytokines and atherosclerosis in patients with obstructive sleep apnea syndrome. Mol. Med. Rep. 2017, 16, 6334–6339. [Google Scholar] [CrossRef]
- Kanbay, A.; Kokturk, O.; Ciftci, T.U.; Tavil, Y.; Bukan, N. Comparison of serum adiponectin and tumor necrosis factor-alpha levels between patients with and without obstructive sleep apnea syndrome. Respiration 2008, 76, 324–330. [Google Scholar] [CrossRef]
- Kim, J.; Lee, C.H.; Park, C.S.; Kim, B.G.; Kim, S.W.; Cho, J.H. Plasma levels of MCP-1 and adiponectin in obstructive sleep apnea syndrome. Arch. Otolaryngol. Neck Surg. 2010, 136, 896–899. [Google Scholar] [CrossRef][Green Version]
- Ko, C.Y.; Hu, A.K.; Chou, D.; Huang, L.M.; Su, H.Z.; Yan, F.R.; Zhang, X.B.; Zhang, H.P.; Zeng, Y.M. Analysis of oral microbiota in patients with obstructive sleep apnea-associated hypertension. Hypertens. Res. 2019, 42, 1692–1700. [Google Scholar] [CrossRef] [PubMed]
- Kobayashi, K.; Nishimura, Y.; Shimada, T.; Yoshimura, S.; Funada, Y.; Satouchi, M.; Yokoyama, M. Effect of continuous positive airway pressure on soluble CD40 ligand in patients with obstructive sleep apnea syndrome. Chest 2006, 129, 632–637. [Google Scholar] [CrossRef] [PubMed]
- Kong, Y.; Li, Z.; Tang, T.; Wu, H.; Liu, J.; Gu, L.; Zhao, T.; Huang, Q. The level of lipopolysaccharide-binding protein is elevated in adult patients with obstructive sleep apnea. BMC Pulm. Med. 2018, 18, 90. [Google Scholar] [CrossRef] [PubMed]
- Leon-Cabrera, S.; Arana-Lechuga, Y.; Esqueda-León, E.; Terán-Pérez, G.; Gonzalez-Chavez, A.; Escobedo, G.; Moctezuma, J.V. Reduced systemic levels of IL-10 are associated with the severity of obstructive sleep apnea and insulin resistance in morbidly obese humans. Mediat. Inflamm. 2015, 2015, 493409. [Google Scholar] [CrossRef]
- Li, X.; Liu, X.; Meng, Q.; Wu, X.; Bing, X.; Guo, N.; Zhao, X.; Hou, X.; Wang, B.; Xia, M. Circadian clock disruptions link oxidative stress and systemic inflammation to metabolic syndrome in obstructive sleep apnea patients. Front. Physiol. 2022, 13, 932596. [Google Scholar] [CrossRef]
- Li, Y.; Chongsuvivatwong, V.; Geater, A.; Liu, A. Are biomarker levels a good follow-up tool for evaluating obstructive sleep apnea syndrome treatments? Respiration 2008, 76, 317–323. [Google Scholar] [CrossRef]
- Li, Y.; Chongsuvivatwong, V.; Geater, A.; Liu, A. Exhaled breath condensate cytokine level as a diagnostic tool for obstructive sleep apnea syndrome. Sleep Med. 2009, 10, 95–103. [Google Scholar] [CrossRef]
- Lin, C.C.; Liaw, S.F.; Chiu, C.H.; Chen, W.J.; Lin, M.W.; Chang, F.T. Effects of nasal CPAP on exhaled SIRT1 and tumor necrosis factor-α in patients with obstructive sleep apnea. Respir. Physiol. Neurobiol. 2016, 228, 39–46. [Google Scholar] [CrossRef]
- Lu, D.; Xu, S.; Dai, P.; Wu, L.; Zhang, H.; Zhou, B. Gut microbiota in hypertensive patients with versus without obstructive sleep apnea. J. Clin. Hypertens. 2022, 24, 1598–1605. [Google Scholar] [CrossRef] [PubMed]
- Matos, G.; Hirotsu, C.; Alvarenga, T.A.; Cintra, F.; Bittencourt, L.; Tufik, S.; Andersen, M.L. The association between TNF-α and erectile dysfunction complaints. Andrology 2013, 1, 872–878. [Google Scholar] [CrossRef] [PubMed]
- Medeiros, C.; De Bruin, V.; Andrade, G.; Coutinho, W.; de Castro-Silva, C.; De Bruin, P. Obstructive sleep apnea and biomarkers of inflammation in ischemic stroke. Acta Neurol. Scand. 2012, 126, 17–22. [Google Scholar] [CrossRef]
- Ming, H.; Tian, A.; Liu, B.; Hu, Y.; Liu, C.; Chen, R.; Cheng, L. Inflammatory cytokines tumor necrosis factor-α, interleukin-8 and sleep monitoring in patients with obstructive sleep apnea syndrome. Exp. Ther. Med. 2019, 17, 1766–1770. [Google Scholar] [CrossRef] [PubMed]
- Minoguchi, K.; Tazaki, T.; Yokoe, T.; Minoguchi, H.; Watanabe, Y.; Yamamoto, M.; Adachi, M. Elevated production of tumor necrosis factor-alpha by monocytes in patients with obstructive sleep apnea syndrome. Chest 2004, 126, 1473–1479. [Google Scholar] [CrossRef] [PubMed]
- Nizam, N.; Basoglu, O.K.; Tasbakan, M.S.; Lappin, D.F.; Buduneli, N. Is there an association between obstructive sleep apnea syndrome and periodontal inflammation? Clin. Oral Investig. 2016, 20, 659–668. [Google Scholar] [CrossRef]
- Niżankowska-Jędrzejczyk, A.; Almeida, F.R.; Lowe, A.A.; Kania, A.; Nastałek, P.; Mejza, F.; Foley, J.H.; Niżankowska-Mogilnicka, E.; Undas, A. Modulation of inflammatory and hemostatic markers in obstructive sleep apnea patients treated with mandibular advancement splints: A parallel, controlled trial. J. Clin. Sleep Med. 2014, 10, 255–262. [Google Scholar] [CrossRef]
- Ohga, E.; Tomita, T.; Wada, H.; Yamamoto, H.; Nagase, T.; Ouchi, Y. Effects of obstructive sleep apnea on circulating ICAM-1, IL-8, and MCP-1. J. Appl. Physiol. 2003, 94, 179–184. [Google Scholar] [CrossRef]
- Olszewska, E.; Pietrewicz, T.M.; Świderska, M.; Jamiołkowski, J.; Chabowski, A. A Case-Control Study on the Changes in High-Sensitivity C-Reactive Protein and Tumor Necrosis Factor-Alpha Levels with Surgical Treatment of OSAS. Int. J. Mol. Sci. 2022, 23, 14116. [Google Scholar] [CrossRef] [PubMed]
- Qian, X.; Yin, T.; Li, T.; Kang, C.; Guo, R.; Sun, B.; Liu, C. High levels of inflammation and insulin resistance in obstructive sleep apnea patients with hypertension. Inflammation 2012, 35, 1507–1511. [Google Scholar] [CrossRef]
- Ryan, S.; Taylor, C.T.; McNicholas, W.T. Selective activation of inflammatory pathways by intermittent hypoxia in obstructive sleep apnea syndrome. Circulation 2005, 112, 2660–2667. [Google Scholar] [CrossRef] [PubMed]
- Ryan, S.; Taylor, C.T.; McNicholas, W.T. Predictors of elevated nuclear factor-kappaB-dependent genes in obstructive sleep apnea syndrome. Am. J. Respir. Crit. Care Med. 2006, 174, 824–830. [Google Scholar] [CrossRef]
- Sahlman, J.; Miettinen, K.; Peuhkurinen, K.; Seppä, J.; Peltonen, M.; Herder, C.; Punnonen, K.; Vanninen, E.; Gylling, H.; Partinen, M. The activation of the inflammatory cytokines in overweight patients with mild obstructive sleep apnoea. J. Sleep Res. 2010, 19, 341–348. [Google Scholar] [CrossRef] [PubMed]
- Said, E.A.; Al-Abri, M.A.; Al-Saidi, I.; Al-Balushi, M.S.; Al-Busaidi, J.Z.; Al-Reesi, I.; Koh, C.Y.; Hasson, S.S.; Idris, M.A.; Al-Jabri, A.A. Altered blood cytokines, CD4 T cells, NK and neutrophils in patients with obstructive sleep apnea. Immunol. Lett. 2017, 190, 272–278. [Google Scholar] [CrossRef]
- Santamaria-Martos, F.; Benítez, I.; Girón, C.; Barbé, F.; Martínez-García, M.A.; Hernández, L.; Montserrat, J.M.; Nagore, E.; Martorell, A.; Campos-Rodriguez, F.; et al. Biomarkers of carcinogenesis and tumour growth in patients with cutaneous melanoma and obstructive sleep apnoea. Eur. Respir. J. 2018, 51, 1701885. [Google Scholar] [CrossRef]
- Sarac, F.; Basoglu, O.K.; Gunduz, C.; Bayrak, H.; Biray Avci, C.; Akcicek, F. Association of osteopontin and tumor necrosis factor-α levels with insulin resistance in obese patients with obstructive sleep apnea syndrome. J. Endocrinol. Investig. 2011, 34, 528–533. [Google Scholar] [CrossRef]
- Ulasli, S.S.; Sarıaydın, M.; Gunay, E.; Halici, B.; Celik, S.; Koyuncu, T.; Ulu, S.; Unlu, M. Effects of nondipping pattern on systemic inflammation in obstructive sleep apnea. Sleep Breath. 2015, 19, 1185–1190. [Google Scholar] [CrossRef]
- Serednytskyy, O.; Alonso-Fernández, A.; Ribot, C.; Herranz, A.; Álvarez, A.; Sánchez, A.; Rodríguez, P.; Gil, A.V.; Pía, C.; Cubero, J.P. Systemic inflammation and sympathetic activation in gestational diabetes mellitus with obstructive sleep apnea. BMC Pulm. Med. 2022, 22, 94. [Google Scholar] [CrossRef]
- Sun, L.; Chen, R.; Wang, J.; Zhang, Y.; Li, J.; Peng, W.; Liu, C. Association between inflammation and cognitive function and effects of continuous positive airway pressure treatment in obstructive sleep apnea hypopnea syndrome. Zhonghua Yi Xue Za Zhi 2014, 94, 3483–3487. [Google Scholar]
- Tamaki, S.; Yamauchi, M.; Fukuoka, A.; Makinodan, K.; Koyama, N.; Tomoda, K.; Yoshikawa, M.; Kimura, H. Production of inflammatory mediators by monocytes in patients with obstructive sleep apnea syndrome. Intern. Med. 2009, 48, 1255–1262. [Google Scholar] [CrossRef]
- Tang, T.; Huang, Q.; Liu, J.; Zhou, X.; Du, J.; Wu, H.; Li, Z. Oxidative stress does not contribute to the release of proinflammatory cytokines through activating the Nod-like receptor protein 3 inflammasome in patients with obstructive sleep apnoea. Sleep Breath. 2019, 23, 535–542. [Google Scholar] [CrossRef] [PubMed]
- Tazaki, T.; Minoguchi, K.; Yokoe, T.; Samson, K.T.; Minoguchi, H.; Tanaka, A.; Watanabe, Y.; Adachi, M. Increased levels and activity of matrix metalloproteinase-9 in obstructive sleep apnea syndrome. Am. J. Respir. Crit. Care Med. 2004, 170, 1354–1359. [Google Scholar] [CrossRef]
- Thorn, C.E.; Knight, B.; Pastel, E.; McCulloch, L.; Patel, B.; Shore, A.; Kos, K. Adipose tissue is influenced by hypoxia of obstructive sleep apnea syndrome independent of obesity. Diabetes Metab. 2017, 43, 240–247. [Google Scholar] [CrossRef] [PubMed]
- Thunström, E.; Glantz, H.; Fu, M.; Yucel-Lindberg, T.; Petzold, M.; Lindberg, K.; Peker, Y. Increased inflammatory activity in nonobese patients with coronary artery disease and obstructive sleep apnea. Sleep 2015, 38, 463–471. [Google Scholar] [CrossRef] [PubMed]
- Tomiyama, H.; Okazaki, R.; Inoue, D.; Ochiai, H.; Shiina, K.; Takata, Y.; Hashimoto, H.; Yamashina, A. Link between obstructive sleep apnea and increased bone resorption in men. Osteoporos. Int. 2008, 19, 1185–1192. [Google Scholar] [CrossRef] [PubMed]
- Tosun, F.; Babayiğit, C.; Dikmen, N.; Doğan, S.; Dirican, E. The effect of continuous positive airway pressure treatment on inflammatory parameters and periostin levels in patients with obstructive sleep apnea syndrome. Sleep Breath. 2023, 27, 275–282. [Google Scholar] [CrossRef]
- Vgontzas, A.N.; Papanicolaou, D.A.; Bixler, E.O.; Hopper, K.; Lotsikas, A.; Lin, H.M.; Kales, A.; Chrousos, G.P. Sleep apnea and daytime sleepiness and fatigue: Relation to visceral obesity, insulin resistance, and hypercytokinemia. J. Clin. Endocrinol. Metab. 2000, 85, 1151–1158. [Google Scholar] [CrossRef]
- Vgontzas, A.N.; Papanicolaou, D.A.; Bixler, E.O.; Kales, A.; Tyson, K.; Chrousos, G.P. Elevation of plasma cytokines in disorders of excessive daytime sleepiness: Role of sleep disturbance and obesity. J. Clin. Endocrinol. Metab. 1997, 82, 1313–1316. [Google Scholar] [CrossRef]
- Wali, S.O.; Manzar, M.D.; Abdelaziz, M.M.; Alshomrani, R.; Alhejaili, F.; Al-Mughales, J.; Alamoudi, W.; Gozal, D. Putative associations between inflammatory biomarkers, obesity, and obstructive sleep apnea. Ann. Thorac. Med. 2021, 16, 329–336. [Google Scholar] [CrossRef] [PubMed]
- Wang, J.; Li, X.; Hou, W.J.; Dong, L.X.; Cao, J. Endothelial function and T-lymphocyte subsets in patients with overlap syndrome of chronic obstructive pulmonary disease and obstructive sleep apnea. Chin. Med. J. 2019, 132, 1654–1659. [Google Scholar] [CrossRef] [PubMed]
- Xie, J.Y.; Liu, W.X.; Ji, L.; Chen, Z.; Gao, J.M.; Chen, W.; Chen, G.F.; Zhu, Q. Relationship between inflammatory factors and arrhythmia and heart rate variability in OSAS patients. Eur. Rev. Med. Pharmacol. Sci. 2020, 24, 2037–2053. [Google Scholar] [CrossRef] [PubMed]
- Yadav, R.; France, M.; Aghamohammadzadeh, R.; Liu, Y.; Hama, S.; Kwok, S.; Schofield, J.; Turkington, P.; Syed, A.A.; Malik, R. Impairment of high-density lipoprotein resistance to lipid peroxidation and adipose tissue inflammation in obesity complicated by obstructive sleep apnea. J. Clin. Endocrinol. Metab. 2014, 99, 3390–3398. [Google Scholar] [CrossRef] [PubMed]
- Yang, D.; Liu, Z.; Luo, Q. Plasma ghrelin and pro-inflammatory markers in patients with obstructive sleep apnea and stable coronary heart disease. Med. Sci. Monit. 2013, 19, 251–256. [Google Scholar] [CrossRef][Green Version]
- Yang, Y.; Somani, S. Impact of obstructive sleep apnea on the expression of inflammatory mediators in diabetic macular edema. Eur. J. Ophthalmol. 2023, 33, 415–420. [Google Scholar] [CrossRef] [PubMed]
- Zong, D.; Liu, X.; Shen, C.; Liu, T.; Ouyang, R. Involvement of Galectin-3 in neurocognitive impairment in obstructive sleep apnea via regulating inflammation and oxidative stress through NLRP3. Sleep Med. 2023, 101, 1–10. [Google Scholar] [CrossRef] [PubMed]
- Gaines, J.; Vgontzas, A.N.; Fernandez-Mendoza, J.; Calhoun, S.L.; He, F.; Liao, D.; Sawyer, M.D.; Bixler, E.O. Inflammation mediates the association between visceral adiposity and obstructive sleep apnea in adolescents. Am. J. Physiol. Endocrinol. Metab. 2016, 311, E851–E858. [Google Scholar] [CrossRef]
- Huang, Y.S.; Chin, W.C.; Guilleminault, C.; Chu, K.C.; Lin, C.H.; Li, H.Y. Inflammatory Factors: Nonobese Pediatric Obstructive Sleep Apnea and Adenotonsillectomy. J. Clin. Med. 2020, 9, 1028. [Google Scholar] [CrossRef]
- Jie, C.; Jun, Y.; Wen-wei, Y.; Hao, W. Analysis of Serum IL-6 and TNF-α Levels in Children with Obstructive Sleep Apnea Syndrome. Chin. J. Evid.-Based Med. 2007, 7, 547–549. [Google Scholar]
- Khalyfa, A.; Serpero, L.D.; Kheirandish-Gozal, L.; Capdevila, O.S.; Gozal, D. TNF-α gene polymorphisms and excessive daytime sleepiness in pediatric obstructive sleep apnea. J. Pediatr. 2011, 158, 77–82. [Google Scholar] [CrossRef] [PubMed]
- Li, A.M.; Lam, H.S.; Chan, M.; So, H.K.; Ng, S.K.; Chan, I.; Lam, C.; Wing, Y.K. Inflammatory cytokines and childhood obstructive sleep apnoea. Ann. Acad. Med. Singap. 2008, 37, 649–654. [Google Scholar] [CrossRef] [PubMed]
- Li, J.; Li, C.; Chai, L.; Gong, W. Relationship between plasma vascular endothelial growth factor and tumor necrosis factor-alpha and obstructive sleep apnea hypopnea syndrome in children. Zhonghua Er Bi Yan Hou Tou Jing Wai Ke Za Zhi 2014, 49, 44–48. [Google Scholar]
- Nobili, V.; Alisi, A.; Cutrera, R.; Carpino, G.; De Stefanis, C.; D’Oria, V.; De Vito, R.; Cucchiara, S.; Gaudio, E.; Musso, G. Altered gut–liver axis and hepatic adiponectin expression in OSAS: Novel mediators of liver injury in paediatric non-alcoholic fatty liver. Thorax 2015, 70, 769–781. [Google Scholar] [CrossRef] [PubMed]
- Smith, D.F.; Hossain, M.M.; Hura, A.; Huang, G.; McConnell, K.; Ishman, S.L.; Amin, R.S. Inflammatory Milieu and Cardiovascular Homeostasis in Children with Obstructive Sleep Apnea. Sleep 2017, 40, zsx022. [Google Scholar] [CrossRef]
- Smith, D.F.; Schuler, C.L.; Hossain, M.M.; Huang, G.; McConnell, K.; Urbina, E.M.; Amin, R.S. Early Atherosclerotic inflammatory pathways in children with obstructive sleep apnea. J. Pediatr. 2021, 239, 168–174. [Google Scholar] [CrossRef] [PubMed]
- Tam, C.S.; Wong, M.; McBain, R.; Bailey, S.; Waters, K.A. Inflammatory measures in children with obstructive sleep apnoea. J. Paediatr. Child Health 2006, 42, 277–282. [Google Scholar] [CrossRef]
- Wang, Y.; Chen, Y.; Lin, W.; Huang, M.; Xu, Y.; Chen, G. Inflammatory markers in children with obstructive sleep apnea syndrome. Front. Pediatr. 2023, 11, 1134678. [Google Scholar] [CrossRef] [PubMed]
- Ye, J.; Liu, H.; Li, P.; Chen, Z.G.; Zhang, G.H.; Yang, Q.T.; Li, Y. CD4+T-lymphocyte subsets in nonobese children with obstructive sleep apnea syndrome. Pediatr. Res. 2015, 78, 165–173. [Google Scholar] [CrossRef] [PubMed]
- Zhang, Z.; Wang, C. Immune status of children with obstructive sleep apnea/hypopnea syndrome. Pak. J. Med. Sci. 2017, 33, 195–199. [Google Scholar] [CrossRef] [PubMed]
- De Lima, F.F.F.; Mazzotti, D.R.; Tufik, S.; Bittencourt, L. The role inflammatory response genes in obstructive sleep apnea syndrome: A review. Sleep Breath. 2016, 20, 331–338. [Google Scholar] [CrossRef]
- Unnikrishnan, D.; Jun, J.; Polotsky, V. Inflammation in sleep apnea: An update. Rev. Endocr. Metab. Disord. 2015, 16, 25–34. [Google Scholar] [CrossRef]
- Quercioli, A.; Mach, F.; Montecucco, F. Inflammation accelerates atherosclerotic processes in obstructive sleep apnea syndrome (OSAS). Sleep Breath. 2010, 14, 261–269. [Google Scholar] [CrossRef] [PubMed]
- Aihara, K.; Oga, T.; Chihara, Y.; Harada, Y.; Tanizawa, K.; Handa, T.; Hitomi, T.; Uno, K.; Mishima, M.; Chin, K. Analysis of systemic and airway inflammation in obstructive sleep apnea. Sleep Breath. 2013, 17, 597–604. [Google Scholar] [CrossRef]
- Kleisiaris, C.F.; Kritsotakis, E.I.; Daniil, Z.; Tzanakis, N.; Papaioannou, A.; Gourgoulianis, K.I. The prevalence of obstructive sleep apnea-hypopnea syndrome-related symptoms and their relation to airflow limitation in an elderly population receiving home care. Int. J. Chronic Obstr. Pulm. Dis. 2014, 9, 1111–1117. [Google Scholar] [CrossRef][Green Version]
- Cavaillon, J.-M. Pro-versus anti-inflammatory cytokines: Myth or reality. Cell. Mol. Biol. 2001, 47, 695–702. [Google Scholar]
- Gottlieb, D.J.; Punjabi, N.M. Diagnosis and management of obstructive sleep apnea: A review. JAMA 2020, 323, 1389–1400. [Google Scholar] [CrossRef]
- Reale, M.; Velluto, L.; Di Nicola, M.; D’Angelo, C.; Costantini, E.; Marchioni, M.; Cerroni, G.; Guarnieri, B. Cholinergic markers and cytokines in OSA patients. Int. J. Mol. Sci. 2020, 21, 3264. [Google Scholar] [CrossRef] [PubMed]
- Liu, X.; Ma, Y.; Ouyang, R.; Zeng, Z.; Zhan, Z.; Lu, H.; Cui, Y.; Dai, Z.; Luo, L.; He, C. The relationship between inflammation and neurocognitive dysfunction in obstructive sleep apnea syndrome. J. Neuroinflamm. 2020, 17, 229. [Google Scholar] [CrossRef] [PubMed]


| First Author, Publication Year | Country | Ethnicity | Case/Control No. | Variable | Case | Control | Sample | Quality Score | ||||
|---|---|---|---|---|---|---|---|---|---|---|---|---|
| AHI, Events/h | Age, Years | BMI, kg/m2 | AHI, Events/h | Age, Years | BMI, kg/m2 | |||||||
| Abdel-Fadeil, 2017 [42] | Egypt | Arab | 22/22 | TNF-α | 32.17 ± 4.39 | 49.92 ± 2.10 | 36.00 ± 1.10 | 3.72 ± 0.36 | 47.55 ± 2.35 | 36.62 ± 1.14 | Serum | 7 |
| Abulikemu, 2021 [43] | China | Caucasian | 67/67 | TNF-α, IL-8 | 27.34 ± 4.87 | 47.51 ± 9.64 | 24.13 ± 2.97 | 4.31 ± 1.05 | 45.93 ± 10.01 | 23.94 ± 2.85 | Serum | 8 |
| Ahsant, 2022 [44] | Iran | Asian | 46/42 | TNF-α | 36.75 ± 22.19 | 59.38 ± 9.37 | 36.05 ± 6.75 | 0.00 ± 0.00 | 52.79 ± 5.76 | 33.00 ± 4.64 | Serum | 8 |
| Akinnusi, 2013 [31] | USA | Mixed | 29/18 | TNF-α, IL-8, IFN-γ | 32.2 ± 13.1 | 54.5 ± 8.9 | 31.1 ± 5.7 | 1.9 ± 1.6 | 52.33 ± 9.3 | 29.5 ± 5.1 | Serum | 8 |
| Alzoghaibi, 2005 [45] | Saudi Arabia | Arab | 25/17 | IL-8 | 73.5 ± 6.9 | 49.5 ± 2.2 | 36.3 ± 1.5 | <5 | 30.7 ± 1.5 | 23.4 ± 0.7 | Serum | 7 |
| Archontogeorgis, 2016 [46] | Greece | Caucasian | 64/20 | IL-8 | ≥5 | 51.78 ± 11.55 | 36.34 ± 13.18 | <5 | 51.40 ± 16.24 | 33.73 ± 5.67 | Serum | 8 |
| Arias, 2008 [47] | Spain | Caucasian | 30/15 | TNF-α | 43.8 ± 27.0 | 52.0 ± 13.0 | 30.5 ± 4.0 | 3.7 ± 3.3 | 48.0 ± 10.0 | 28.7 ± 4.7 | Plasma | 8 |
| Bao, 2005 [65] | China | Asian | 35/25 | TNF-α | ≥5 | 50 ± 10 | 29.24 ± 3.24 | 3.67 ± 0.53 | 42.56 ± 16.93 | 22.90 ± 2.58 | Serum | 7 |
| Bhatt, 2019 [48] | India | Asian | 47/25 | TNF-α | 13.5 ± 6.4 | 44.2 ± 9.1 | 32.5 ± 6.9 | 2.3 ± 1.1 | 28.5 ± 8.6 | 41 ± 8.5 | Serum | 7 |
| Bhushan, 2009 [32] | India | Asian | 104/103 | TNF-α | 47.90 ± 24.60 | 46.18 ± 10.70 | 31.48 ± 4.26 | 2.80 ± 1.70 | 40.00 ± 10.00 | 30.94 ± 4.27 | Plasma | 8 |
| Bilal, 2021 [49] | Turkey | Caucasian | 30/30 | TNF-α, IL-8 | 24.65 ± 5.74 | 26.2 ± 1.34 | 30.41 ± 6.15 | 2.62 ± 1.34 | 42.53 ± 9.81 | 29.09 ± 4.52 | Serum | 8 |
| Bozic, 2018 [50] | Croatia | Caucasian | 50/25 | TNF-α | 35.0 ± 11.0 | 53.0 ± 11.9 | 28.9 ± 2.7 | <5 | 52.5 ± 10.2 | 27.8 ± 2.2 | Plasma | 8 |
| Carneiro, 2009 [51] | Brazil | Mixed | 16/13 | TNF-α | 65.7 ± 9.9 | 40.1 ± 2.8 | 46.9 ± 2.0 | 3.2 ± 0.5 | 38.8 ± 3.3 | 42.8 ± 1.3 | Plasma | 7 |
| Carpagnano, 2010 [52] | Italy | Caucasian | 12/8 | TNF-α, IL-1β | 48.8 ± 23.1 | 47.3 ± 13.2 | 42.6 ± 6.8 | 3.2 ± 0.9 | 42 ± 4 | 24.6 ± 2.6 | Plasma | 7 |
| Celikhisar, 2020 [53] | Turkey | Caucasian | 84/82 | TNF-α, IL-1β | 27.4 ± 18.6 | 50.9 ± 5.7 | 32.4 ± 6 | 1.8 ± 1.4 | 49.3 ± 5.8 | 30.6 ± 5.6 | Serum | 8 |
| Chen, 2013 [56] | China | Asian | 44/20 | TNF-α | 14.56 ± 2.85 | 27.12 ± 3.53 | 24.56 ± 2.85 | 3.30 ± 0.90 | 42.00 ± 11.00 | 26.00 ± 3.30 | Plasma | 7 |
| Chen, 2015 [55] | China | Asian | 93/28 | TNF-α | 27.00 ± 4.06 | 42.28 ± 8.55 | 28.84 ± 3.82 | 2.60 ± 1.20 | 43.70 ± 9.80 | 26.40 ± 2.50 | Plasma | 8 |
| Chen, 2021 [54] | China | Asian | 67/30 | IL-1β | 37.53 ± 9.51 | 43.72 ± 10.75 | 31.33 ± 6.05 | 3.06 ± 1.35 | 44.77 ± 10.67 | 26.15 ± 3.55 | Serum | 8 |
| Ciccone, 2014 [57] | Italy | Caucasian | 80/40 | TNF-α | 33.9 ± 21.0 | 52.8 ± 10.6 | 28.6 ± 3.0 | 2.1 ± 1.1 | 52.3 ± 10.5 | 28.2 ± 2.7 | Plasma | 8 |
| Ciftci, 2004 [33] | Turkey | Caucasian | 43/22 | TNF-α | 33.20 ± 5.00 | 49.60 ± 9.10 | 31.90 ± 4.10 | 1.50 ± 0.96 | 47.20 ± 10.30 | 31.00 ± 3.10 | Serum | 8 |
| Constantinidis, 2008 [58] | Greece | Caucasian | 24/27 | TNF-α, IL-1β | 23.3 ± 3.6 | 45.1 ± 8.2 | ≥25 | 3.5 ± 0.4 | 45.1 ± 8.2 | ≥25 | Serum | 8 |
| De Santis, 2015 [59] | Italy | Caucasian | 26/24 | TNF-α | 26.1 ± 12.1 | 41.8 ± 7.4 | 33.0 ± 5.2 | 1.6 ± 0.9 | 43.7 ± 8.2 | 30.8 ± 4.3 | Serum | 8 |
| Devouassoux, 2007 [60] | France | Caucasian | 57/13 | IL-8 | 41 ± 14.3 | 54 ± 11 | 28.7 ± 5.4 | <5 | 45 ± 7 | 28.2 ± 3.7 | Plasma | 7 |
| Doufas, 2013 [61] | USA | Mixed | 33/15 | TNF-α, IL-1β | 18.07 ± 14.66 | 34.56 ± 8.41 | 26.11 ± 3.13 | 2.41 ± 1.41 | 32.55 ± 9.47 | 24.69 ± 3.45 | Serum | 8 |
| Fiedorczuk, 2023 [62] | Poland | Caucasian | 52/28 | TNF-α, IL-8 | 28.87 ± 3.55 | 43.68 ± 12.10 | 28.87 ± 3.56 | 2.36 ± 1.69 | 40.12 ± 12.68 | 26.69 ± 2.92 | Serum & Plasma | 8 |
| Fornadi, 2012 [63] | Hungary | Caucasian | 25/75 | TNF-α | ≥5 | 54 ± 12 | 29 ± 5 | <5 | 50 ± 13 | 26 ± 5 | Serum | 8 |
| Galati, 2020 [64] | Italy | Caucasian | 45/30 | TNF-α, IFN-γ | ≥5 | 53.9 ± 11.6 | 28 ± 2.2 | <5 | 55.0 ± 5.8 | 26.3 ± 1.8 | Serum | 9 |
| Gamsiz-Isik, 2017 [8] | Turkey | Caucasian | 83/80 | TNF-α, IL-1β | ≥5 | 46.87 ± 8.21 | 31.53 ± 3.44 | <5 | 37.53 ± 24.38 | 44.23 ± 9.83 | Serum | 7 |
| Hargens, 2013 [66] | USA | Mixed | 12/18 | TNF-α | 25.4 ± 5.4 | 22.8 ± 0.8 | 32.4 ± 1.0 | 2.1 ± 0.3 | 21.9 ± 0.6 | 29.3 ± 0.5 | Serum | 8 |
| Heizati, 2017 [67] | China | Asian | 28/54 | TNF-α, IL-1β | 38.03 ± 42.72 | 44.00 ± 8.26 | 26.09 ± 1.75 | 6.75 ± 10.82 | 44.94 ± 8.33 | 25.30 ± 1.79 | Serum | 9 |
| Hirotsu, 2017 [68] | Brazil | Mixed | 339/682 | TNF-α | 19.3 ± 9.44 | 50.8 ± 13.2 | 29.6 ± 5.8 | 2.5 ± 10.4 | 38.2 ± 12.7 | 25.4 ± 3.8 | Serum | 7 |
| Hui, 2016 [69] | China | Asian | 80/32 | TNF-α | 55.3 ± 18.7 | 46.3 ± 5.9 | NA | <5 | 41.2 ± 3.7 | NA | Serum | 7 |
| Huiguo, 2000 [70] | China | Asian | 20/16 | TNF-α | 44.0 ± 21.0 | 47.4 ± 13.6 | 27.6 ± 3.3 | 4.29 ± 2.16 | 47.6 ± 14.7 | 23.1 ± 3 | Plasma | 8 |
| Imagawa, 2004 [71] | Japan | Asian | 110/45 | TNF-α | ≥5 | NA | 27.7 ± 4.4 | <5 | NA | 22.9 ± 2.9 | Serum | 7 |
| Ji, 2021 [72] | China | Asian | 67/21 | TNF-α | 38.42 ± 11.60 | 44.15 ± 14.69 | 32.87 ± 8.47 | 2.69 ± 0.35 | 42.97 ± 10.26 | 31.57 ± 8.85 | Serum | 8 |
| Ji, 2022 [73] | China | Asian | 79/21 | TNF-α | 29.46 ± 6.67 | 58.55 ± 10.46 | 25.30 ± 3.26 | 2.53 ± 1.38 | 56.10 ± 12.40 | 24.50 ± 3.10 | Serum | 8 |
| Jiang, 2017 [74] | China | Asian | 120/40 | TNF-α | 46.60 ± 4.56 | 24.82 ± 10.70 | 28.50 ± 5.13 | 2.13 ± 1.26 | 46.50 ± 12.30 | 27.50 ± 6.20 | Plasma | 7 |
| Jin, 2017 [75] | China | Asian | 100/50 | TNF-α | 38.01 ± 8.04 | 55.28 ± 7.13 | 26.75 ± 3.50 | 3.62 ± 1.54 | 56.13 ± 6.21 | 25.19 ± 2.45 | Plasma | 8 |
| Kanbay, 2008 [76] | Turkey | Caucasian | 106/32 | TNF-α | 40.14 ± 14.30 | 51.39 ± 10.37 | 31.06 ± 5.87 | 1.96 ± 1.08 | 44.79 ± 13.35 | 28.25 ± 5.49 | Serum | 8 |
| Kim, 2010 [77] | Korea | Asian | 37/22 | TNF-α, IL-8 | 43.39 ± 18.08 | 41.03 ± 11.75 | 17.66 ± 3.68 | 1.25 ± 1.25 | 26.00 ± 6.91 | 23.88 ± 2.30 | Serum | 7 |
| Ko, 2019 [78] | China | Asian | 126/13 | TNF-α, IFN-γ | 36.09 ± 16.58 | 45.80 ± 13.02 | 27.42 ± 3.93 | 1.83 ± 1.34 | 35.92 ± 7.69 | 24.1 ± 2.33 | Serum | 7 |
| Kobayashi, 2006 [79] | Japan | Asian | 35/16 | TNF-α | 52.26 ± 14.76 | 51.40 ± 13.10 | 27.90 ± 3.60 | <5 | 41.00 ± 13.10 | 27.40 ± 3.70 | Serum | 8 |
| Kong, 2018 [80] | China | Asian | 50/40 | TNF-α, IL-1β | 37.34 ± 19.02 | 54.34 ± 14.38 | 26.86 ± 3.12 | 3.31 ± 1.09 | 50.42 ± 8.35 | 22.2 ± 3.5 | Serum | 8 |
| Leon-Cabrera, 2015 [81] | Mexico | Mixed | 29/10 | TNF-α | 51.4 ± 25.7 | 37.2 ± 11.4 | 45.2 ± 8.4 | 7.5 ± 3.3 | 43.4 ± 11.5 | 23.6 ± 2.1 | Serum | 7 |
| Li, 2008a [83] | China | Asian | 28/22 | TNF-α | 33.4 ± 28.6 | 45.1 ± 10.2 | 27.7 ± 4.5 | 2.9 ± 1.3 | 43 ± 9 | 23.3 ± 2.0 | Serum | 8 |
| Li, 2009 [84] | China | Asian | 68/22 | TNF-α | 38.91 ± 3.08 | 45.29 ± 10.91 | 27.75 ± 4.56 | 2.09 ± 1.30 | 43 ± 93 | 23.3 ± 2.00 | Serum | 8 |
| Li, 2022 [82] | China | Asian | 89/29 | TNF-α, IL-8 IL-1β | 18.86 ± 17.23 | 45.87 ± 5.17 | 29.05 ± 4.89 | 2.28 ± 0.85 | 45.38 ± 5.39 | 30.30 ± 5.30 | Plasma | 9 |
| Lin, 2016 [85] | Taiwan | Asian | 35/20 | TNF-α | 59.3 ± 23.2 | 46.0 ± 7.0 | 29.2 ± 1.9 | 3.6 ± 0.8 | 59.3 ± 23.2 | 43.0 ± 8.0 | Serum | 8 |
| Lu, 2022 [86] | China | Asian | 37/15 | TNF-α, IL-1β | 27.26 ± 9.46 | 51.73 ± 11.09 | 24.67 ± 3.09 | 1.95 ± 1.35 | 51.73 ± 11.09 | 24.67 ± 3.09 | Serum | 9 |
| Matos, 2013 [87] | Brazil | Mixed | 155/208 | TNF-α | ≥5 | 51.2 | 29.7 | <5 | 40.7 | 24.5 | Plasma | 8 |
| Medeiros, 2012 [88] | Brazil | Mixed | 50/15 | TNF-α, IL-1β | >5 | 64.29 ± 7.73 | 28.62 ± 4.01 | <5 | 62.50 ± 8.40 | 25.81 ± 4.04 | Serum | 8 |
| Ming, 2019 [89] | China | Asian | 684/192 | TNF-α, IL-8 | 31.15 ± 9.12 | 51.34 ± 5.16 | ≤30 | 4.34 ± 2.01 | 52.18 ± 4.51 | ≤30 | Serum | 7 |
| Minoguchi, 2004 [90] | Japan | Asian | 24/12 | TNF-α | 34.1 ± 14.7 | 50.1 ± 11.7 | 29.1 ± 2.2 | 2.3 ± 1.9 | 48.1 ± 10.5 | 25.3 ± 1.2 | Serum | 7 |
| Nizam, 2016 [91] | Turkey | Caucasian | 39/13 | TNF-α | 45.6 ± 20.7 | 47.3 ± 10.4 | 33.2 ± 56.4 | 2.6 ± 1.8 | 43.2 ± 9.1 | 31.7 ± 4.5 | Serum | 8 |
| Niżankowska-Jędrzejczyk, 2014 [92] | Poland | Caucasian | 22/16 | IL-1β | 23.62 ± 12.32 | 52.50 ± 8.33 | 30.15 ± 2.77 | 1.90 ± 2.78 | 54.50 ± 8.33 | 28.02 ± 3.36 | Plasma | 9 |
| Ohga, 2003 [93] | Japan | Asian | 20/10 | IL-8 | 38.5 ± 3.1 | 47.8 ± 2.2 | 29.4 ± 1.4 | 3.1 ± 0.4 | 48.9 ± 2.9 | 28.4 ± 2.9 | Serum | 9 |
| Olszewska, 2022 [94] | Poland | Caucasian | 25/18 | TNF-α | 34.9 ± 17.3 | 50.2 ± 11.3 | 34.1 ± 3.7 | 1.5 ± 0.8 | 33.0 ± 14.0 | NA | Serum | 7 |
| Qian, 2012 [95] | China | Asian | 70/40 | TNF-α | ≥5 | 45.8 ± 8.2 | 28.9 ± 2.3 | <5 | 46.3 ± 8.1 | 24.1 ± 2.3 | Serum | 8 |
| Ryan, 2005 [96] | Ireland | Caucasian | 19/17 | TNF-α | 49.6 ± 25.2 | 39.5 ± 2.0 | 32.3 ± 16.1 | 1.03 ± 0.5 | 39.5 ± 19.5 | 31.1 ± 15.5 | Serum | 8 |
| Ryan, 2006 [97] | Ireland | Caucasian | 66/30 | TNF-α, IL-8, IFN-γ | 35.0 ± 13.9 | 42.5 ± 8.5 | 32.5 ± 4.8 | 1.2 ± 1.0 | 41.0 ± 8.0 | 30.7 ± 3.1 | Serum | 8 |
| Sahlman, 2010 [98] | Finland | Caucasian | 84/40 | TNF-α, IL-1β | 9.6 ± 2.9 | 50.4 ± 9.3 | 32.5 ± 3.3 | 1.9 ± 1.4 | 45.6 ± 11.5 | 31.5 ± 3.5 | Plasma | 8 |
| Said, 2017 [99] | Oman | Caucasian | 22/21 | TNF-α, IL-8 | ≥ 30 | 40.4 ± 8.6 | NA | <5 | 33.9 ± 6.7 | NA | Plasma | 7 |
| Santamaria-Martos, 2018 [100] | Spain | Caucasian | 228/132 | IL-8 | 19.48 ± 44.52 | 61.40 ± 14.16 | 28.39 ± 4.12 | 1.89 ± 1.74 | 44.35 ± 11.24 | 24.59 ± 3.22 | Serum | 7 |
| Sarac, 2011 [101] | Turkey | Caucasian | 62/26 | TNF-α | 29.5 ± 1.9 | 50.0 ± 19.7 | 33.7 ± 4.2 | <5 | 49.7 ± 11.1 | 34.3 ± 5.4 | Plasma | 7 |
| Sarinc Ulasli, 2015 [102] | Turkey | Caucasian | 28/20 | TNF-α | 30.58 ± 18.39 | 51.70 ± 10.20 | 32.40 ± 5.60 | 2.24 ± 0.99 | 45.30 ± 14.00 | 30.40 ± 8.00 | Serum | 8 |
| Serednytskyy, 2022 [103] | Spain | Caucasian | 17/34 | TNF-α, IL-8, L-1β | 8.94 ± 5.90 | 37.60 ± 4.04 | 28.80 ± 6.06 | 0.54 ± 0.54 | 35.36 ± 5.42 | 26.04 ± 4.57 | Serum | 8 |
| Sun, 2014 [104] | China | Asian | 121/18 | TNF-α | 40.8 ± 10.9 | 43.3 ± 11.6 | 27.1 ± 3.1 | 2.1 ± 1.8 | 43.9 ± 13.4 | 25.7 ± 3.8 | Serum | 8 |
| Tamaki, 2009 [105] | Japan | Asian | 33/13 | TNF-α | 39.35 ± 12.05 | 53.30 ± 49.60 | 39.35 ± 4.25 | 3.80 ± 1.80 | 35.50 ± 9.70 | 23.60 ± 2.60 | Serum | 7 |
| Tang, 2019 [106] | China | Asian | 120/127 | TNF-α, IL-1β | 39.00 ± 18.38 | 48.88 ± 9.76 | 26.86 ± 3.12 | 3.31 ± 1.09 | 47.37 ± 9.12 | 22.50 ± 3.30 | Serum | 8 |
| Tazaki, 2004 [107] | Japan | Asian | 48/18 | TNF- α | 36.05 ± 1.75 | 50.60 ± 4.80 | 28.90 ± 1.60 | 3.70 ± 0.40 | 48.20 ± 3.00 | 27.80 ± 0.80 | Serum | 8 |
| Thorn, 2017 [108] | UK | Caucasian | 16/14 | TNF-α | 30.0 ± 18.0 | 59.0 ± 13.0 | 32.7 ± 4.0 | 0.0 ± 0.0 | 58.0 ± 7.0 | 30.6 ± 2.7 | Serum | 8 |
| Thunström, 2015 [109] | Sweden | Caucasian | 234/95 | TNF-α, IL-8 | 28.9 ± 13.7 | 65.3 ± 7.1 | 26.8 ± 2.1 | 3.1 ± 1.3 | 61.4 ± 9.5 | 25.2 ± 2.5 | Serum | 9 |
| Tomiyama, 2008 [110] | Japan | Asian | 50/15 | TNF-α, IL-1β | 42.7 ± 27.9 | 51.4 ± 13.0 | 26.9 ± 4.2 | <5 | 53.0 ± 10.0 | 24.3 ± 2.5 | Plasma | 8 |
| Tosun, 2023 [111] | Turkey | Caucasian | 67/25 | TNF-α | 39.06 ± 15.55 | 49.24 ± 10.12 | 32.47 ± 4.80 | 2.70 ± 1.40 | 40.40 ± 13.00 | 28.40 ± 4.60 | Serum | 7 |
| Unuvar Dogan, 2014 [21] | Turkey | Caucasian | 33/24 | TNF-α | 47.2 ± 23.2 | 45.3 ± 8.5 | 31.0 ± 1.7 | 3.6 ± 1.8 | 40.5 ± 9.5 | 30.7 ± 1.5 | Serum | 8 |
| Vgontzas, 1997 [113] | USA | Mixed | 12/10 | TNF-α, IL-1β | 63.7 ± 10.3 | 40.9 ± 2.2 | 40.5 ± 3.2 | 0.0 ± 0.0 | 24.1 ± 0.8 | 24.6 ± 0.7 | Plasma | 6 |
| Vgontzas, 2000 [112] | USA | Mixed | 14/23 | TNF-α | 48.7 ± 5.6 | 46.6 ± 3.0 | 38.4 ± 1.6 | 0.88 ± 0.4 | 43.6 ± 2.5 | 30.7 ± 1.6 | Plasma | 8 |
| Vicente, 2016 [16] | Spain | Caucasian | 89/26 | TNF-α, IL-8 | 28.00 ± 23.70 | 45.33 ± 14.81 | 30.03 ± 5.04 | 1.90 ± 2.70 | 45.00 ± 11.11 | 28.70 ± 4.37 | Plasma | 8 |
| Wali, 2021 [114] | Saudi Arabia | Arab | 40/24 | TNF-α | 36.74 ± 23.60 | 47.50 ± 13.18 | 37.50 ± 11.40 | 2.90 ± 2.00 | 31.70 ± 11.70 | 30.00 ± 8.60 | Serum | 7 |
| Wang, 2019 [115] | China | Asian | 25/20 | TNF-α | 27.90 ± 5.95 | 62.10 ± 4.40 | 30.15 ± 2.50 | 1.80 ± 0.54 | 63.60 ± 5.70 | 24.40 ± 3.23 | Serum | 8 |
| Xie, 2020 [116] | China | Asian | 107/34 | TNF-α, IL-1β | 40.49 ± 12.69 | 48.22 ± 17.25 | 27.85 ± 3.07 | 2.23 ± 1.49 | 34.74 ± 14.02 | 23.80 ± 4.00 | Serum | 7 |
| Yadav, 2014 [117] | UK | Caucasian | 20/21 | TNF-α | 27.26 ± 25.60 | 49.00 ± 10.00 | 52.00 ± 6.00 | 4.98 ± 2.47 | 45.00 ± 9.00 | 50.00 ± 8.00 | Serum | 8 |
| Yang, 2013 [118] | China | Asian | 25/25 | TNF-α | 24.00 ± 17.00 | 54.00 ± 7.00 | 27.39 ± 2.91 | 3.00 ± 1.00 | 53.00 ± 7.00 | 26.22 ± 1.90 | Plasma | 8 |
| Yang, 2023 [119] | Canada | Mixed | 17/15 | IL-8 | 43.0 ± 29.0 | 62.0 ± 9.3 | 30.0 ± 4.5 | 7.2 ± 4.5 | 60.0 ± 7.8 | 25.0 ± 2.7 | Serum | 8 |
| Zong, 2023 [120] | China | Asian | 47/18 | IL-8, IL-1β | 33.09 ± 12.07 | 50.32 ± 12.45 | 27.41 ± 3.43 | 1.90 ± 1.20 | 52.90 ± 16.90 | 25.70 ± 3.08 | Serum | 9 |
| First Author, Publication Year | Country | Ethnicity | Case/Control No. | Variable | Case | Control | Sample | Quality Score | ||||
|---|---|---|---|---|---|---|---|---|---|---|---|---|
| AHI, Events/h | Age, Years | BMI, kg/m2 | AHI, Events/h | Age, Years | BMI, kg/m2 | |||||||
| Bhatt, 2021 [12] | India | Asian | 190/57 | TNF-α, IL-8 | ≥1 | 10.70 ± 3.00 | 27.1 ± 6.53 | <1 | 11.80 ± 2.60 | 27.4 ± 4.88 | Serum | 9 |
| Feng, 2022 [34] | China | Asian | 44/40 | TNF-α, IL-1β | 11.59 ± 9.01 | 6.66 ± 1.96 | 16.70 ± 2.85 | 0.63 ± 0.46 | 6.90 ± 1.83 | 16.22 ± 2.39 | Serum | 9 |
| Gaines, 2016 [121] | USA | Mixed | 153/239 | TNF-α | 13.78 ± 4.73 | 17.70 ± 2.20 | NA | 0.89 ± 4.77 | 16.40 ± 2.10 | NA | Plasma | 7 |
| Hirsch, 2019 [13] | Australia | Mixed | 21/11, 23/17, 23/17, 21/20 | TNF-α, IL-8, IL-1β, IFN-γ | ≥1 | 10.0 ± 1.7 | NA | <1 | 10.7 ± 1.2 | NA | Serum | 7 |
| Huang, 2016 [35] | Taiwan | Asian | 47/32 | TNF-α, IL-1β | 9.13 ± 1.67 | 7.84 ± 0.56 | 16.95 ± 0.47 | 0.41 ± 0.07 | 7.02 ± 0.65 | 6.55 ± 0.58 | Plasma | 7 |
| Huang, 2020 [122] | Taiwan | Asian | 55/32 | TNF-α, IL-1β | 15.71 ± 22.60 | 7.67 ± 2.64 | 16.83 ± 4.03 | 0.46 ± 0.28 | 7.02 ± 0.65 | 17.44 ± 3.08 | Plasma | 9 |
| Jie, 2007 [123] | China | Asian | 100/40 | TNF-α | ≥1 | 4.67 | NA | <1 | NA | NA | Serum | 6 |
| Khalyfa, 2011 [124] | USA | Mixed | 60/80 | TNF-α | 8.9 ± 2.7 | 7.2 ± 0.2 | NA | 0.5 ± 0.2 | 7.2 ± 0.3 | NA | Plasma | 8 |
| Li, 2008b [125] | China | Asian | 47/95 | TNF-α, IL-8 | 14.1 ± 8.0 | 11.1 ± 1.3 | NA | 0.7 ± 0.6 | 10.7 ± 1.3 | NA | Serum | 7 |
| Li, 2014 [126] | China | Asian | 60/20 | TNF-α | ≥1 | 5.51 ± 2.01 | 11.98 ± 2.18 | <1 | 5.66 ± 2.39 | 15.78 ± 1.97 | Plasma | 8 |
| Nobili, 2015 [127] | Italy | Caucasian | 52/28 | TNF-α | 4.99 ± 3.07 | 11.30 ± 2.10 | 28.30 ± 4.90 | 0.58 ± 0.30 | 11.70 ± 1.90 | 26.4 ± 5.9 | Serum | 9 |
| Smith, 2017 [128] | USA | Mixed | 53/78 | TNF-α, IL-8 | 11.29 ± 8.00 | 9.21 ± 2.63 | 22.43 ± 10.39 | 0.40 ± 0.30 | 9.70 ± 2.50 | 19.4 ± 4.4 | Plasma | 7 |
| Smith, 2021 [129] | USA | Mixed | 43/53 | TNF-α, IL-8 | 10.3 ± 9.1 | 9.0 ± 2.6 | 20.4 ± 5.3 | 0.8 ± 1.4 | 10.0 ± 2.3 | 20.1 ± 4.8 | Serum | 8 |
| Tam, 2006 [130] | Australia | Mixed | 44/69 | TNF-α, IL-8, IL-1β, IFN-γ | 5.3 ± 6.5 | 7.3 ± 3.7 | 19.4 ± 5.5 | 0.0 ± 0.0 | 7.6 ± 4.0 | 17.9 ± 3.9 | Serum | 9 |
| Wang, 2023 [131] | China | Asian | 83/83 | TNF-α, IL-8 | 7.9 ± 8.4 | 7.0 ± 2.7 | 17.1 ± 3.3 | 0.0 ± 0.0 | 6.8 ± 3.5 | 16.9 ± 3.4 | Serum | 9 |
| Ye, 2015 [132] | China | Asian | 25/19 | IFN-γ | 34.76 ± 15.28 | 6.45 ± 2.84 | NA | 0.38 ± 0.20 | 6.63 ± 2.71 | NA | Serum | 7 |
| Zhang, 2017 [133] | China | Asian | 50/52 | TNF-α, IFN-γ | ≥1 | 6.6 | NA | <1 | 6.4 | NA | Serum | 7 |
| Biomarker | Subgroup | Variable, N | SMD | 95%CI | p -Value | I2 | |
|---|---|---|---|---|---|---|---|
| TNF-α (adult) | Ethnicity | Asian (35) | 1.95 | 1.32 | 2.58 | <0.00001 | 98% |
| Caucasian (31) | 0.82 | 0.53 | 1.10 | <0.00001 | 91% | ||
| Arab (2) | 19.68 | −18.36 | 57.71 | 0.31 | 99% | ||
| Mixed (10) | 1.08 | 0.55 | 1.61 | <0.0001 | 93% | ||
| Blood sample | Serum (55) | 1.20 | 0.88 | 1.53 | <0.00001 | 96% | |
| Plasma (23) | 2.00 | 1.25 | 2.74 | <0.00001 | 98% | ||
| Sample size | ≥100 (24) | 1.41 | 0.81 | 2.01 | <0.00001 | 99% | |
| <100 (54) | 1.37 | 1.06 | 1.68 | <0.00001 | 92% | ||
| Mean BMI, kg/m2 | ≥30 (20) | 0.86 | 0.30 | 1.41 | 0.002 | 96% | |
| <30 (35) | 1.33 | 0.95 | 1.71 | <0.00001 | 96% | ||
| Mean age, years | ≥50 (13) | 1.88 | 0.83 | 2.93 | 0.00005 | 99% | |
| <50 (44) | 1.43 | 1.00 | 1.86 | <0.00001 | 96% | ||
| Mean AHI in cases, event/h | ≥30 (44) | 1.88 | 1.33 | 2.42 | <0.00001 | 98% | |
| <30 (23) | 1.23 | 0.8 | 1.64 | <0.00001 | 5% | ||
| IL-8 (adult) | Ethnicity | Asian (5) | 1.33 | 0.14 | 2.5 | 0.03 | 97% |
| Caucasian (12) | 0.60 | 0.20 | 0.99 | 0.003 | 89% | ||
| Mixed (2) | 0.03 | −0.42 | 0.48 | 0.88 | 21% | ||
| Blood sample | Serum (15) | 0.99 | 0.45 | 1.54 | 0.0004 | 96% | |
| Plasma (5) | 0.45 | −0.21 | 1.11 | 0.18 | 88% | ||
| Sample size | ≥100 (5) | 0.88 | −0.12 | 1.88 | 0.08 | 98% | |
| <100 (15) | 0.82 | 0.36 | 1.28 | 0.0004 | 89% | ||
| Mean BMI, kg/m2 | ≥30 (2) | 0.11 | −0.22 | 0.44 | 0.51 | 29% | |
| <30 (10) | 0.97 | 0.45 | 1.49 | 0.0003 | 91% | ||
| Mean age, years | ≥50 (6) | 0.60 | −0.35 | 1.56 | 0.22 | 98% | |
| <50 (12) | 0.93 | 0.38 | 1.49 | 0.001 | 92% | ||
| Mean AHI in cases, event/h | ≥30 (10) | 1.23 | 0.44 | 2.02 | 0.002 | 96% | |
| <30 (9) | 0.60 | 0.15 | 1.04 | 0.008 | 90% | ||
| IL-1β (adult) | Ethnicity | Asian (9) | 0.61 | 0.17 | 1.04 | 0.006 | 88% |
| Caucasian (6) | 1.22 | −0.09 | 2.53 | 0.07 | 97% | ||
| Mixed (3) | −0.28 | −1.43 | 0.86 | 0.63 | 78% | ||
| Blood sample | Serum (12) | 1.00 | 0.39 | 1.61 | 0.001 | 95% | |
| Plasma (7) | 0.11 | −0.39 | 0.60 | 0.67 | 79% | ||
| Sample size | ≥100 (6) | 0.90 | −0.05 | 1.86 | 0.06 | 98% | |
| <100 (13) | 0.57 | 0.10 | 1.04 | 0.02 | 87% | ||
| Mean BMI, kg/m2 | ≥30 (2) | 1.88 | −2.82 | 6.58 | 0.43 | 99% | |
| <30 (9) | 0.50 | 0.22 | 0.78 | 0.0004 | 66% | ||
| Mean age, years | ≥50 (5) | 0.41 | −0.19 | 1.01 | 0.18 | 82% | |
| <50 (10) | 0.55 | 0.10 | 1.01 | 0.02 | 89% | ||
| Mean AHI in cases, event/h | ≥30 (9) | 0.73 | 0.23 | 1.23 | 0.005 | 89% | |
| <30 (6) | 0.79 | −0.59 | 2.17 | 0.26 | 97% | ||
| TNF-α (children) | Ethnicity | Asian (9) | 1.03 | 0.27 | 1.78 | 0.008 | 97% |
| Caucasian (1) | −0.09 | −0.55 | 0.37 | 0.70 | - | ||
| Mixed (6) | 0.72 | −0.04 | 1.48 | 0.06 | 96% | ||
| Blood sample | Serum (10) | 0.71 | 0.06 | 1.36 | 0.03 | 96% | |
| Plasma (6) | 1.06 | 0.21 | 1.91 | 0.01 | 97% | ||
| Sample size | ≥100 (9) | 0.89 | 0.23 | 1.54 | 0.008 | 97% | |
| <100 (7) | 0.78 | −0.04 | 1.60 | 0.06 | 94% | ||
| Mean age, years | ≥9 (7) | 0.50 | −0.19 | 1.19 | 0.16 | 96% | |
| <9 (8) | 1.14 | 0.27 | 2.01 | 0.010 | 97% | ||
| Mean AHI in cases, event/h | ≥10 (7) | 0.56 | 0.04 | 1.08 | 0.03 | 93% | |
| <10 (5) | 0.63 | −0.44 | 1.70 | 0.25 | 97% | ||
| Biomarker | Variable | Coefficient | Standard Error | 95% Lower | 95% Upper | Z-Value | 2-Sided p-Value |
|---|---|---|---|---|---|---|---|
| TNF-α (adult) | Publication year | 0.0007 | 0.0006 | −0.0005 | 0.0019 | 1.11 | 0.2685 |
| Sample size | −0.0028 | 0.0035 | −0.0097 | 0.0041 | −0.80 | 0.4237 | |
| Mean BMI in cases, kg/m2 | −0.0058 | 0.0381 | −0.0805 | 0.0690 | −0.15 | 0.8796 | |
| Mean age in cases, year | −0.0237 | 0.0217 | −0.0663 | 0.0189 | −1.09 | 0.2752 | |
| Mean AHI in cases, events/h | 0.0280 | 0.0170 | −0.0053 | 0.0614 | 1.65 | 0.0995 | |
| Mean BMI in controls, kg/m2 | −0.0081 | 0.0342 | −0.0750 | 0.0589 | −0.24 | 0.8131 | |
| Mean age in controls, year | 0.0242 | 0.0129 | −0.0010 | 0.0495 | 1.88 | 0.0598 | |
| IL-8 (adult) | Publication year | 0.0009 | 0.0017 | −0.0023 | 0.0041 | 0.55 | 0.5810 |
| Sample size | −0.0073 | 0.0039 | −0.0151 | 0.0004 | −1.86 | 0.0623 | |
| Mean BMI in cases, kg/m2 | 0.0666 | 0.0685 | −0.0676 | 0.2008 | 0.97 | 0.3306 | |
| Mean age in cases, year | −0.0535 | 0.0331 | −0.1183 | 0.0114 | −1.62 | 0.1059 | |
| Mean AHI in cases, events/h | 0.0737 | 0.0238 | 0.0270 | 0.1204 | 3.09 | 0.0020 | |
| Mean BMI in controls, kg/m2 | −0.2613 | 0.1304 | −0.5169 | −0.0056 | −2.00 | 0.0452 | |
| Mean age in controls, year | 0.1160 | 0.0441 | 0.0296 | 0.2024 | 2.63 | 0.0085 | |
| IL-1β (adult) | Publication year | −0.0018 | 0.0026 | −0.0069 | 0.0033 | −0.69 | 0.4891 |
| Sample size | 0.0083 | 0.0071 | −0.0057 | 0.0223 | 1.17 | 0.2437 | |
| Mean BMI in cases, kg/m2 | 0.1050 | 0.1128 | −0.1161 | 0.3262 | 0.93 | 0.3519 | |
| Mean age in cases, year | −0.0633 | 0.1114 | −0.2815 | 0.1550 | −0.57 | 0.5701 | |
| Mean AHI in cases, events/h | 0.0087 | 0.0462 | −0.0818 | 0.0991 | 0.19 | 0.8512 | |
| Mean BMI in controls, kg/m2 | −0.0143 | 0.1951 | −0.3967 | 0.3680 | −0.07 | 0.9415 | |
| Mean age in controls, year | 0.0786 | 0.0731 | −0.0647 | 0.2220 | 1.08 | 0.2822 | |
| TNF-α (children) | Publication year | 0.0006 | 0.0005 | −0.0004 | 0.0017 | 1.25 | 0.2104 |
| Sample size | −0.0080 | 0.0095 | −0.0267 | 0.0107 | −0.84 | 0.4015 | |
| Mean BMI in cases, kg/m2 | 0.0196 | 0.0128 | −0.0056 | 0.0448 | 1.53 | 0.1267 | |
| Mean age in cases, year | 0.0462 | 0.0309 | −0.0142 | 0.1067 | 1.50 | 0.1340 | |
| Mean AHI in cases, events/h | 0.0524 | 0.0244 | 0.0047 | 0.1002 | 2.15 | 0.0314 | |
| Mean BMI in controls, kg/m2 | 0.0229 | 0.0140 | −0.0045 | 0.0503 | 1.64 | 0.1011 | |
| Mean age in controls, year | 0.0466 | 0.0302 | −0.0125 | 0.1057 | 1.54 | 0.1224 | |
| IL-8 (children) | Publication year | 0.0003 | 0.0001 | 0.0002 | 0.0004 | 4.90 | <0.0001 |
| Sample size | 0.0046 | 0.0010 | 0.0028 | 0.0065 | 4.80 | <0.0001 | |
| Mean BMI in cases, kg/m2 | 0.0263 | 0.0054 | 0.0157 | 0.0368 | 4.89 | <0.0001 | |
| Mean age in cases, year | 0.0645 | 0.0131 | 0.0388 | 0.0902 | 4.91 | <0.0001 | |
| Mean AHI in cases, events/h | 0.0574 | 0.0119 | 0.0340 | 0.0808 | 4.80 | <0.0001 | |
| Mean BMI in controls, kg/m2 | 0.0289 | 0.0059 | 0.0174 | 0.0404 | 4.92 | <0.0001 | |
| Mean age in controls, year | 0.0605 | 0.0123 | 0.0364 | 0.0845 | 4.92 | <0.0001 |
| Biomarker | Egger’s Test, p-Value | Begg’s Test, p-Value |
|---|---|---|
| TNF-α (adult) | <0.0001 | <0.0001 |
| IL-8 (adult) | 0.3924 | 0.3304 |
| IL-1β (adult) | 0.7117 | 0.9698 |
| IFN-γ (adult) | 0.1884 | 0.1416 |
| TNF-α (children) | 0.2183 | 0.2799 |
| IL-8 (children) | 0.0507 | 0.1764 |
| IL-1β (children) | 0.4726 | 0.3272 |
Disclaimer/Publisher’s Note: The statements, opinions and data contained in all publications are solely those of the individual author(s) and contributor(s) and not of MDPI and/or the editor(s). MDPI and/or the editor(s) disclaim responsibility for any injury to people or property resulting from any ideas, methods, instructions or products referred to in the content. |
© 2024 by the authors. Licensee MDPI, Basel, Switzerland. This article is an open access article distributed under the terms and conditions of the Creative Commons Attribution (CC BY) license (https://creativecommons.org/licenses/by/4.0/).
Share and Cite
Golshah, A.; Sadeghi, E.; Sadeghi, M. Association of Tumor Necrosis Factor-Alpha, Interleukin-1β, Interleukin-8, and Interferon-γ with Obstructive Sleep Apnea in Both Children and Adults: A Meta-Analysis of 102 Articles. J. Clin. Med. 2024, 13, 1484. https://doi.org/10.3390/jcm13051484
Golshah A, Sadeghi E, Sadeghi M. Association of Tumor Necrosis Factor-Alpha, Interleukin-1β, Interleukin-8, and Interferon-γ with Obstructive Sleep Apnea in Both Children and Adults: A Meta-Analysis of 102 Articles. Journal of Clinical Medicine. 2024; 13(5):1484. https://doi.org/10.3390/jcm13051484
Chicago/Turabian StyleGolshah, Amin, Edris Sadeghi, and Masoud Sadeghi. 2024. "Association of Tumor Necrosis Factor-Alpha, Interleukin-1β, Interleukin-8, and Interferon-γ with Obstructive Sleep Apnea in Both Children and Adults: A Meta-Analysis of 102 Articles" Journal of Clinical Medicine 13, no. 5: 1484. https://doi.org/10.3390/jcm13051484
APA StyleGolshah, A., Sadeghi, E., & Sadeghi, M. (2024). Association of Tumor Necrosis Factor-Alpha, Interleukin-1β, Interleukin-8, and Interferon-γ with Obstructive Sleep Apnea in Both Children and Adults: A Meta-Analysis of 102 Articles. Journal of Clinical Medicine, 13(5), 1484. https://doi.org/10.3390/jcm13051484