
A Longitudinal Study on the Effect of Exercise Habits on Locomotive Syndrome and Quality of Life during the Coronavirus Disease 2019 Pandemic
 , ,
, , 
Abstract
1. Introduction
2. Materials and Methods
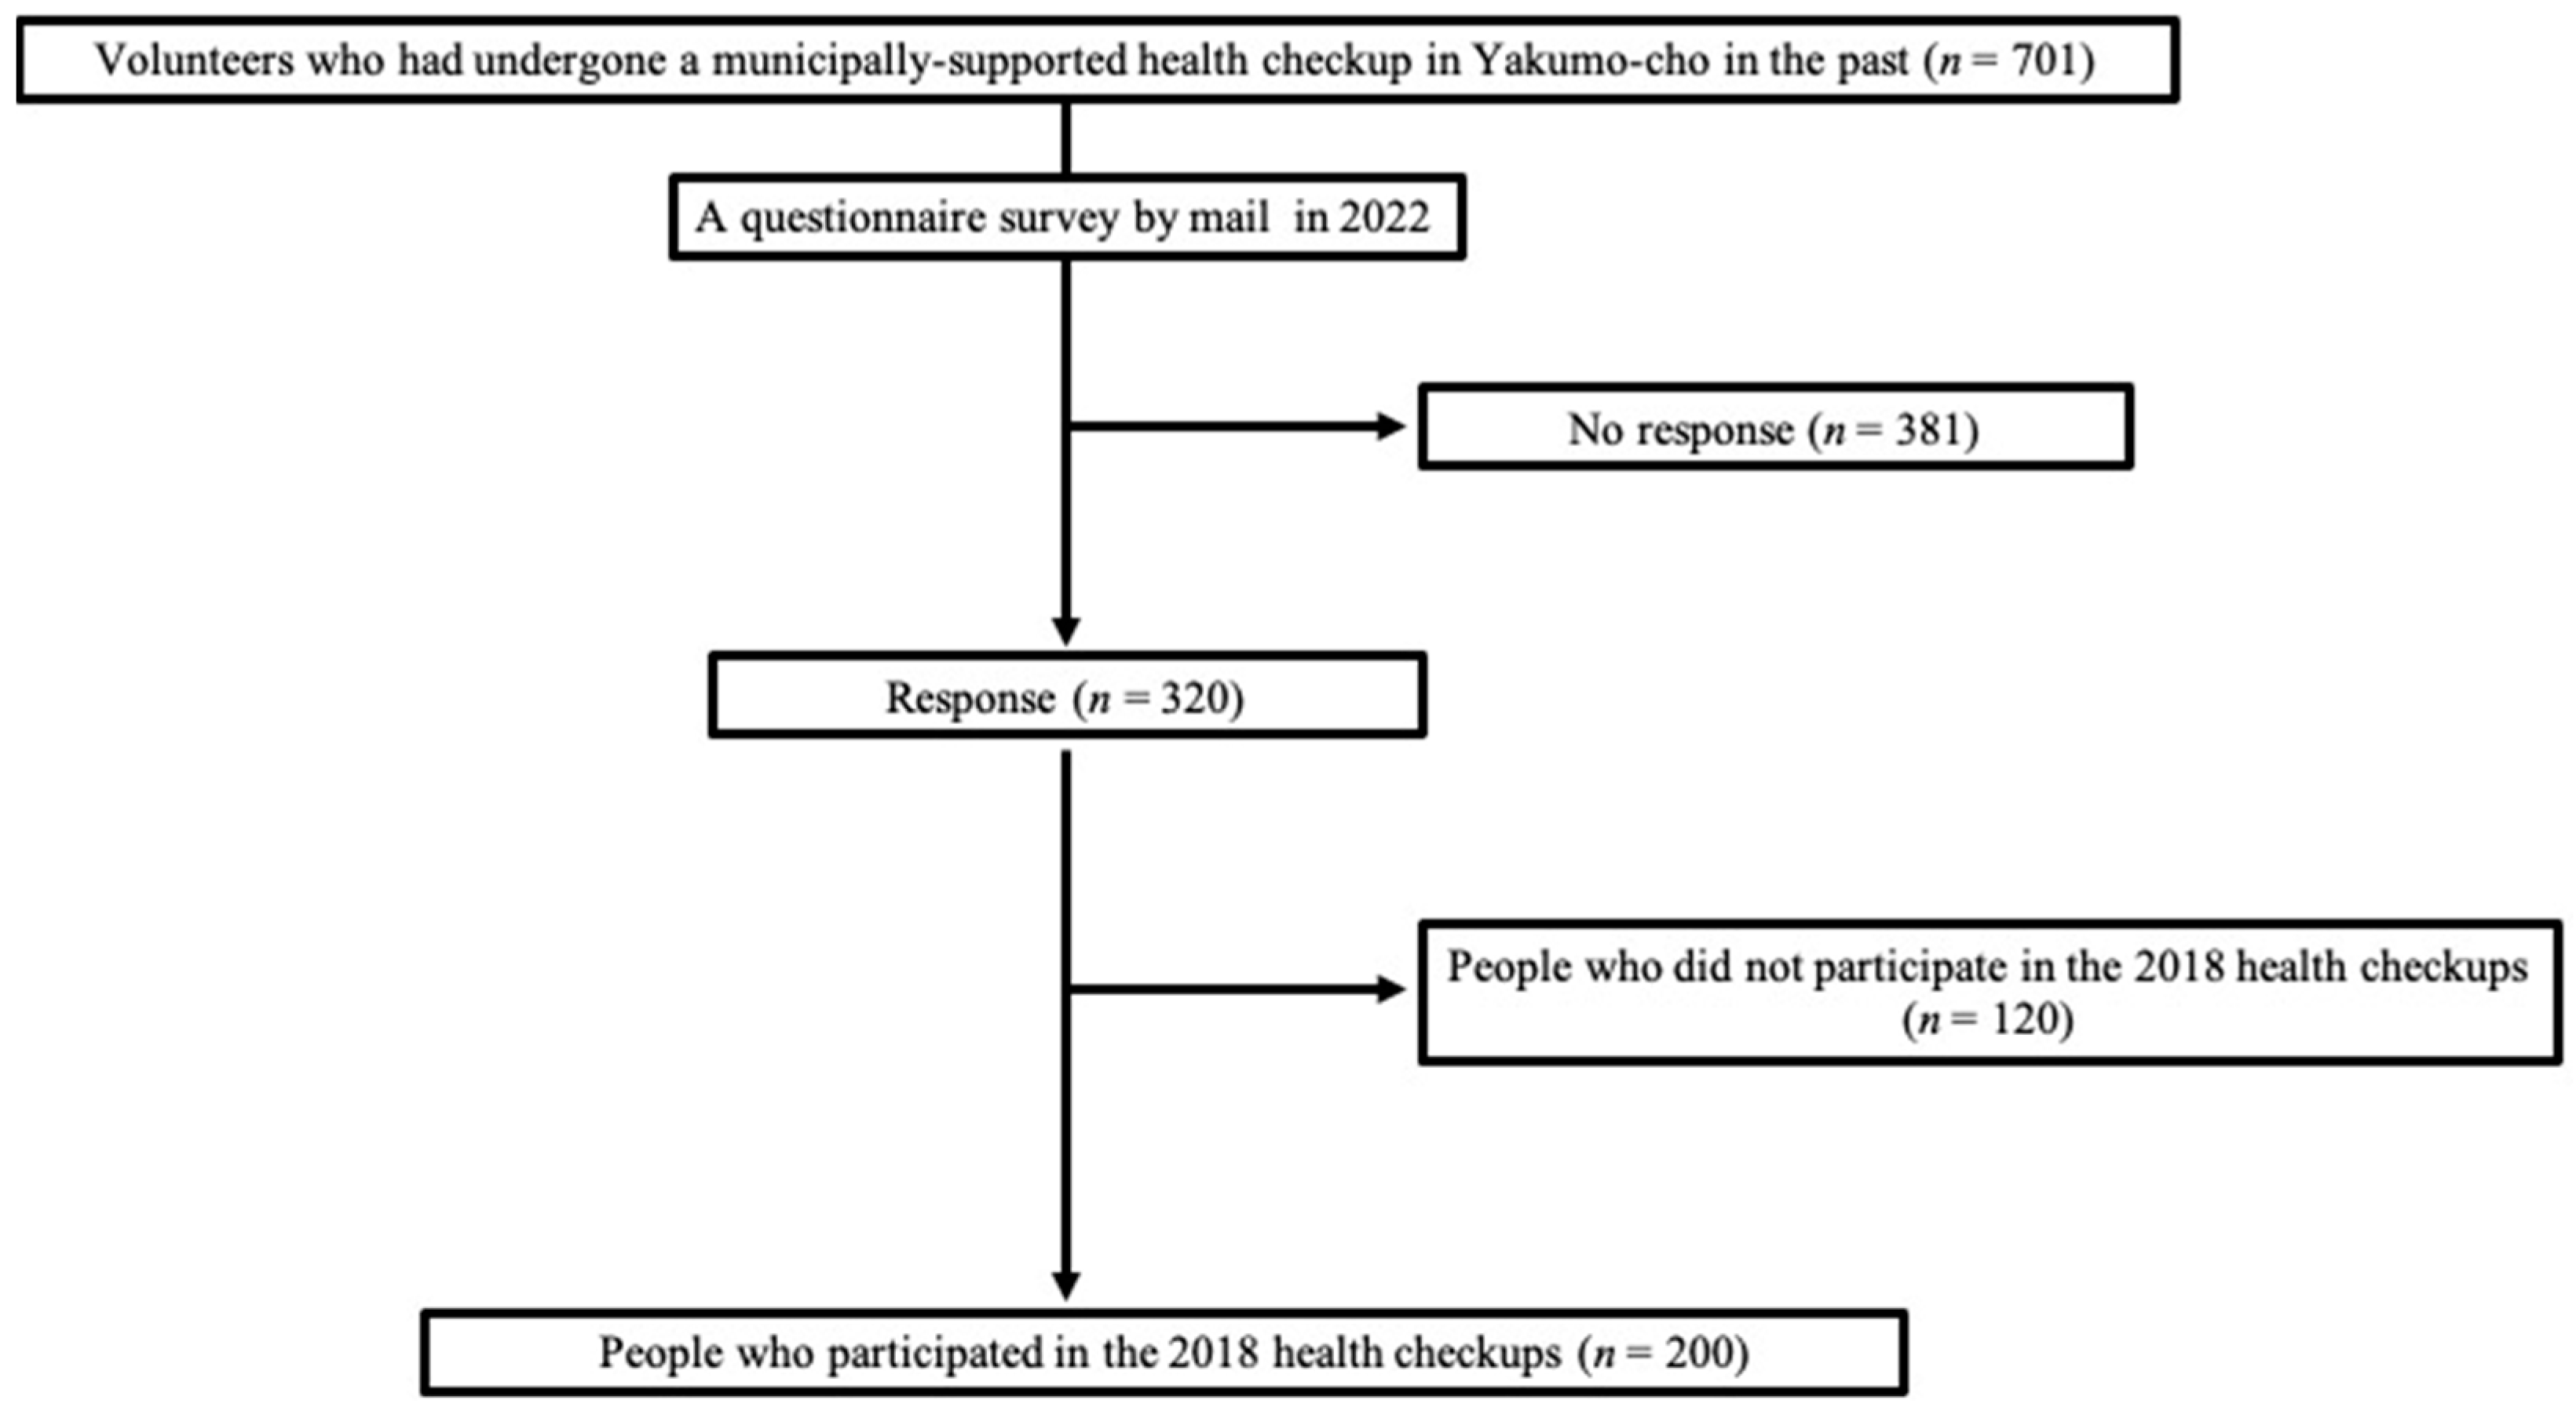
2.1. Study Participants
2.2. The 2018 Health Checkup
Bioelectrical Impedance Analysis (BIA)
2.3. Motor Function Examination
2.3.1. Back Muscle Strength
2.3.2. Grip Strength
2.3.3. Gait Speed
2.4. Questionnaire Survey Conducted in 2018 and 2022
2.4.1. Exercise Habits
2.4.2. LS Stage Tests
- LS0: A 25-question GLFS score < 7.
- LS1: A 25-question GLFS score ≥ 7.
- LS2: A 25-question GLFS score ≥ 16.
2.4.3. QOL
SF-36 QOL Questionnaire [14,15]
The EuroQoL 5-Dimension 5-Level (EQ-5D-5L) [17]
2.5. Statistical Analysis
3. Results
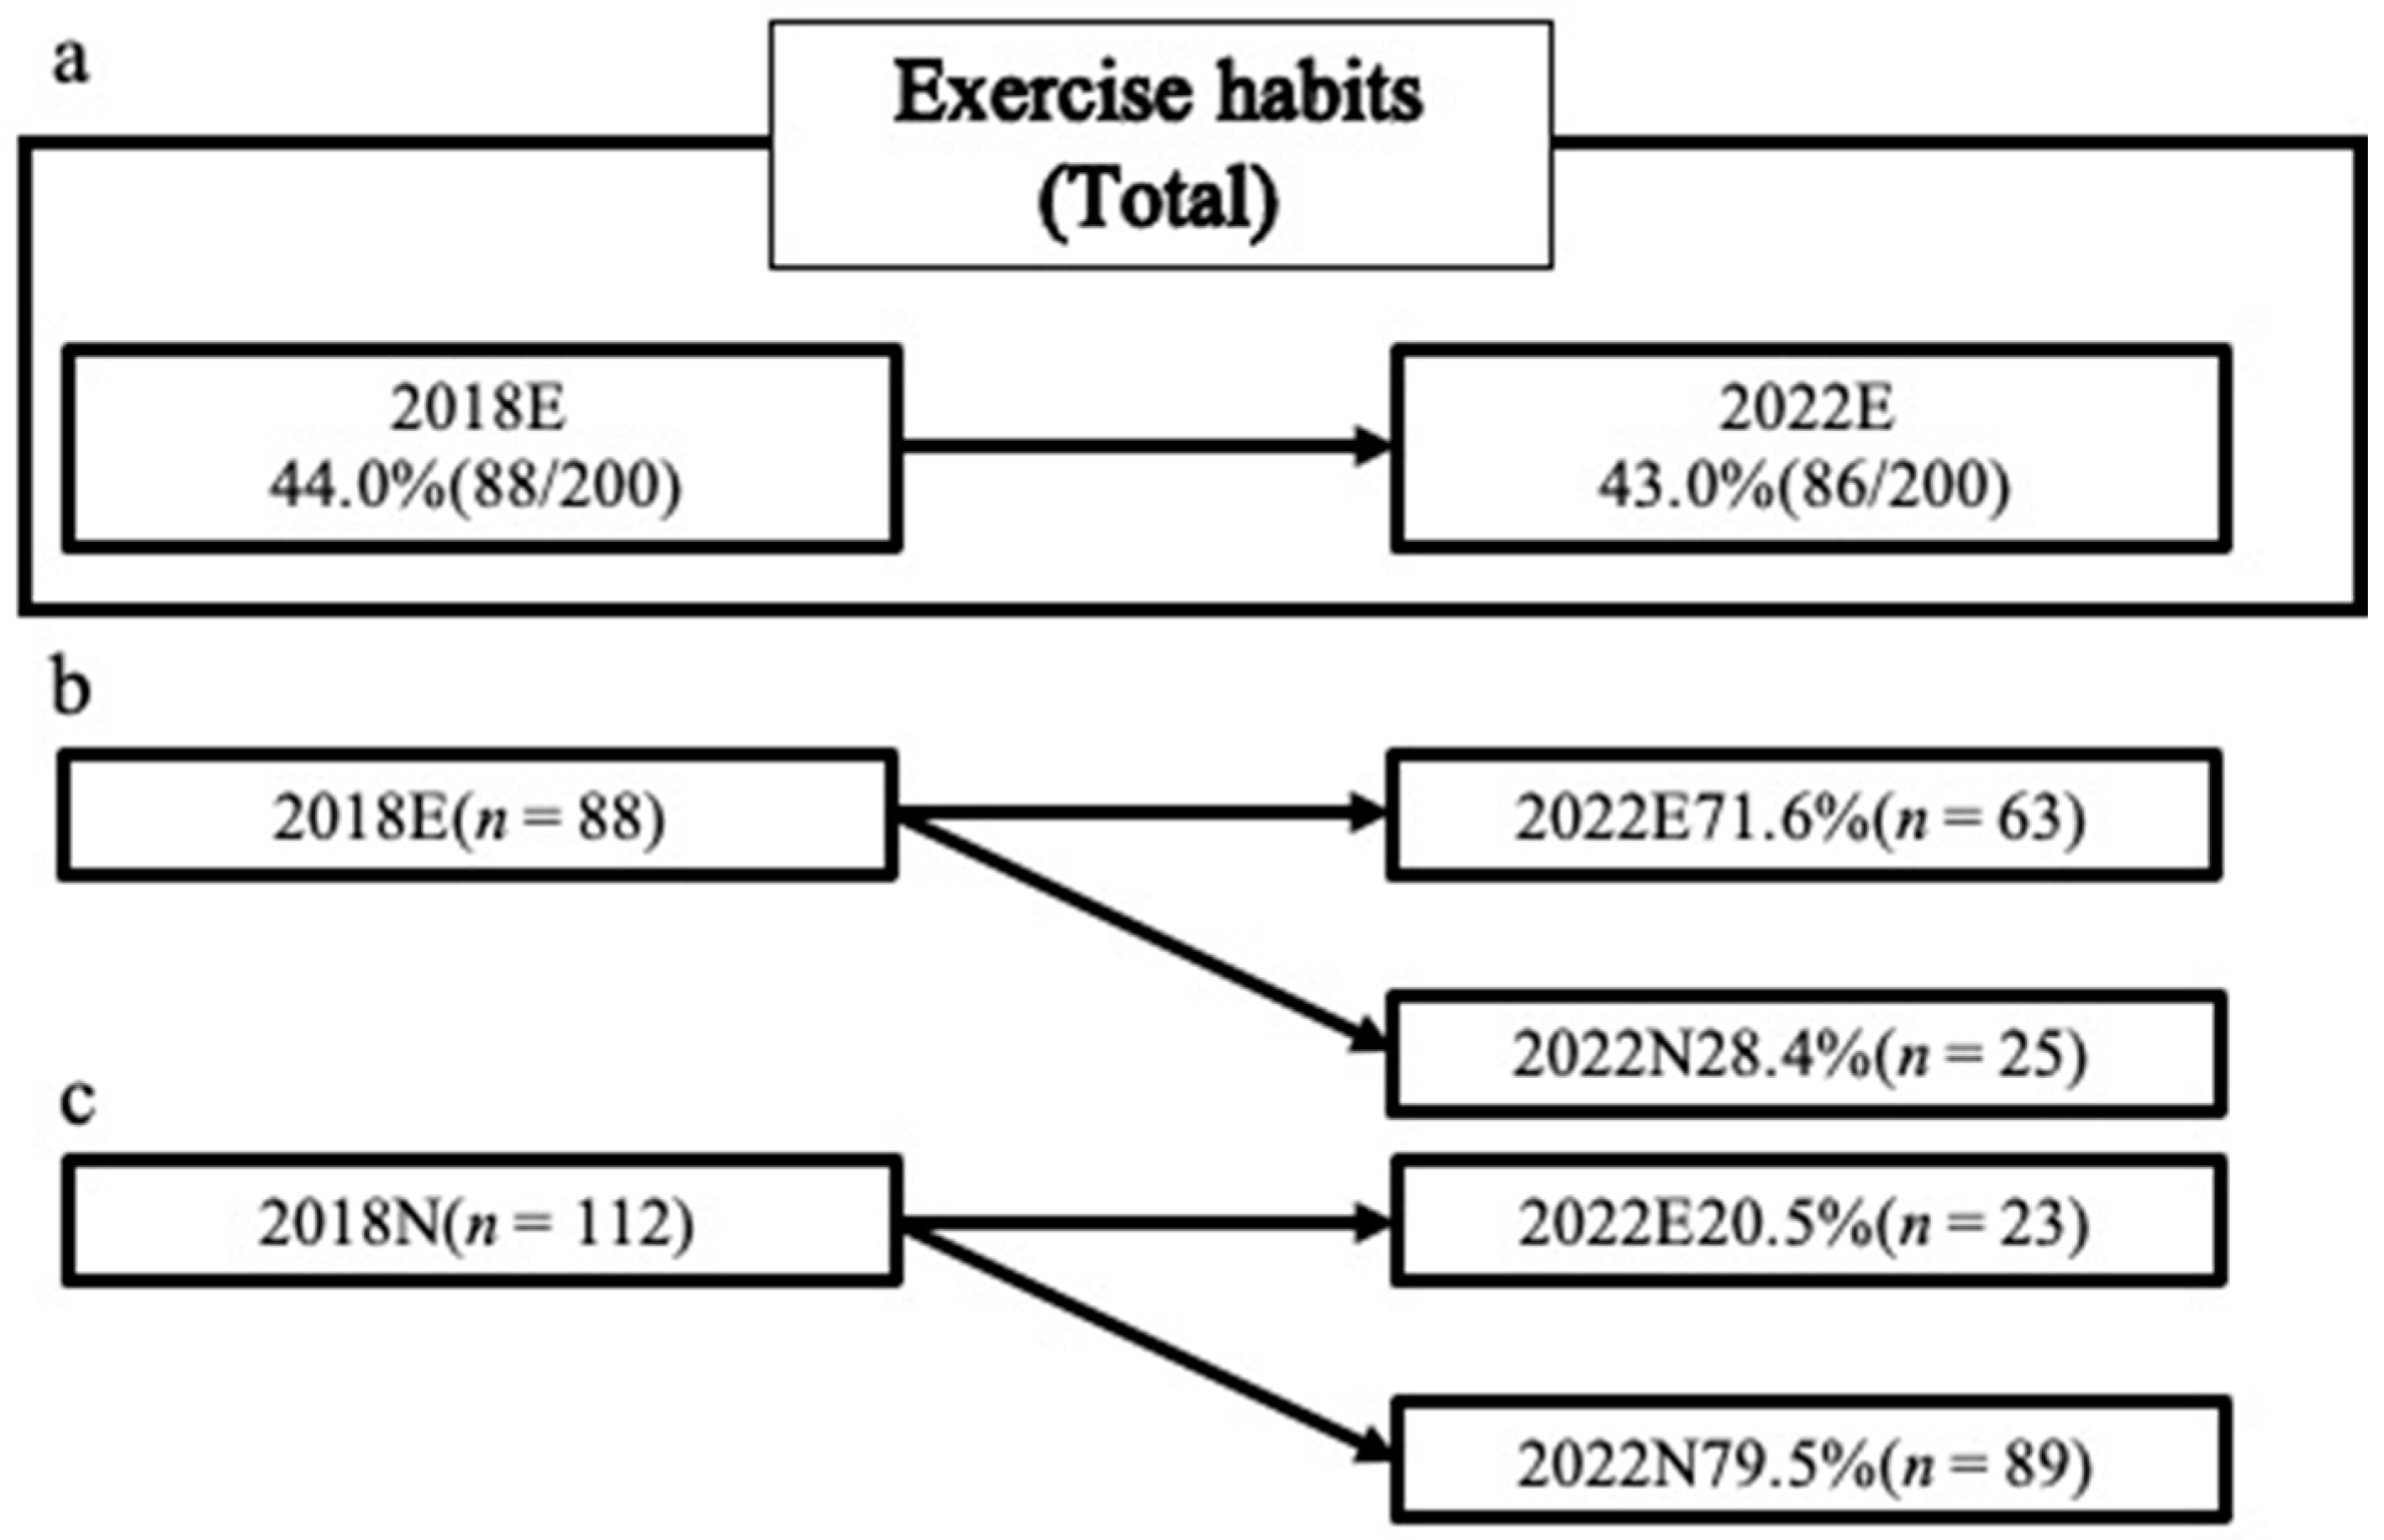
3.1. Exercise Habit
3.2. LS and Exercise Habit
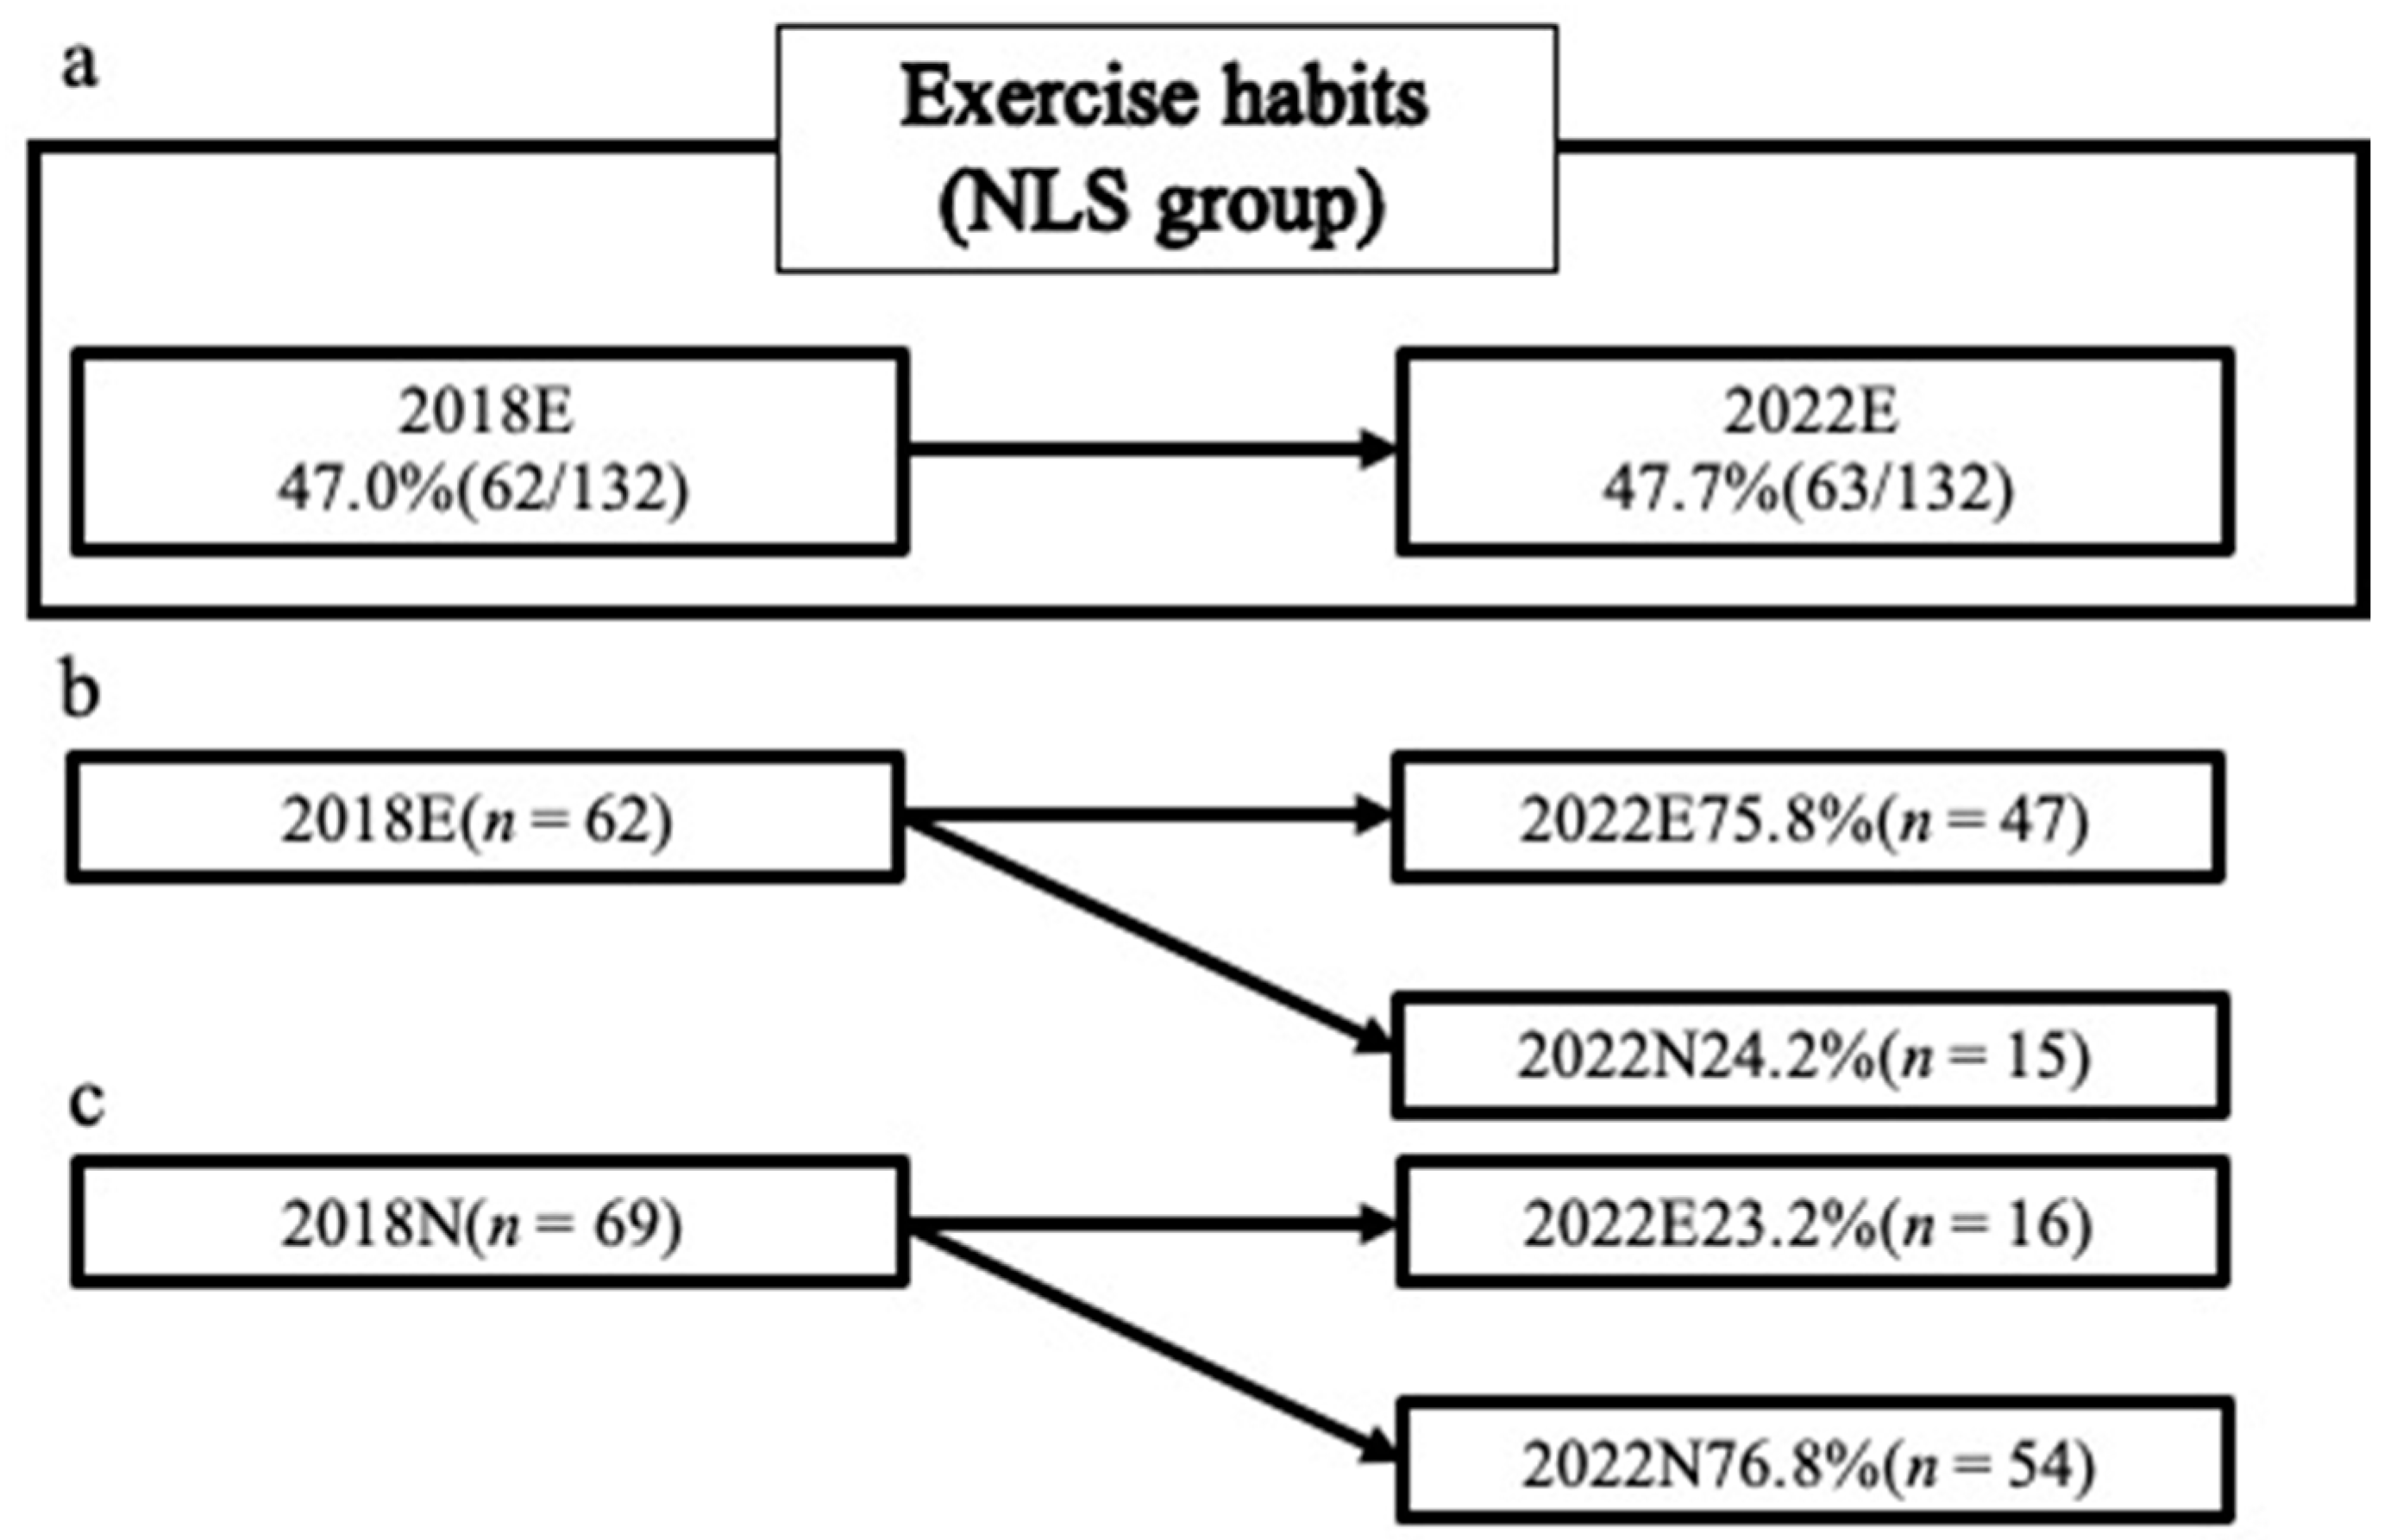
3.3. Participants without LS in 2018 (NLS)
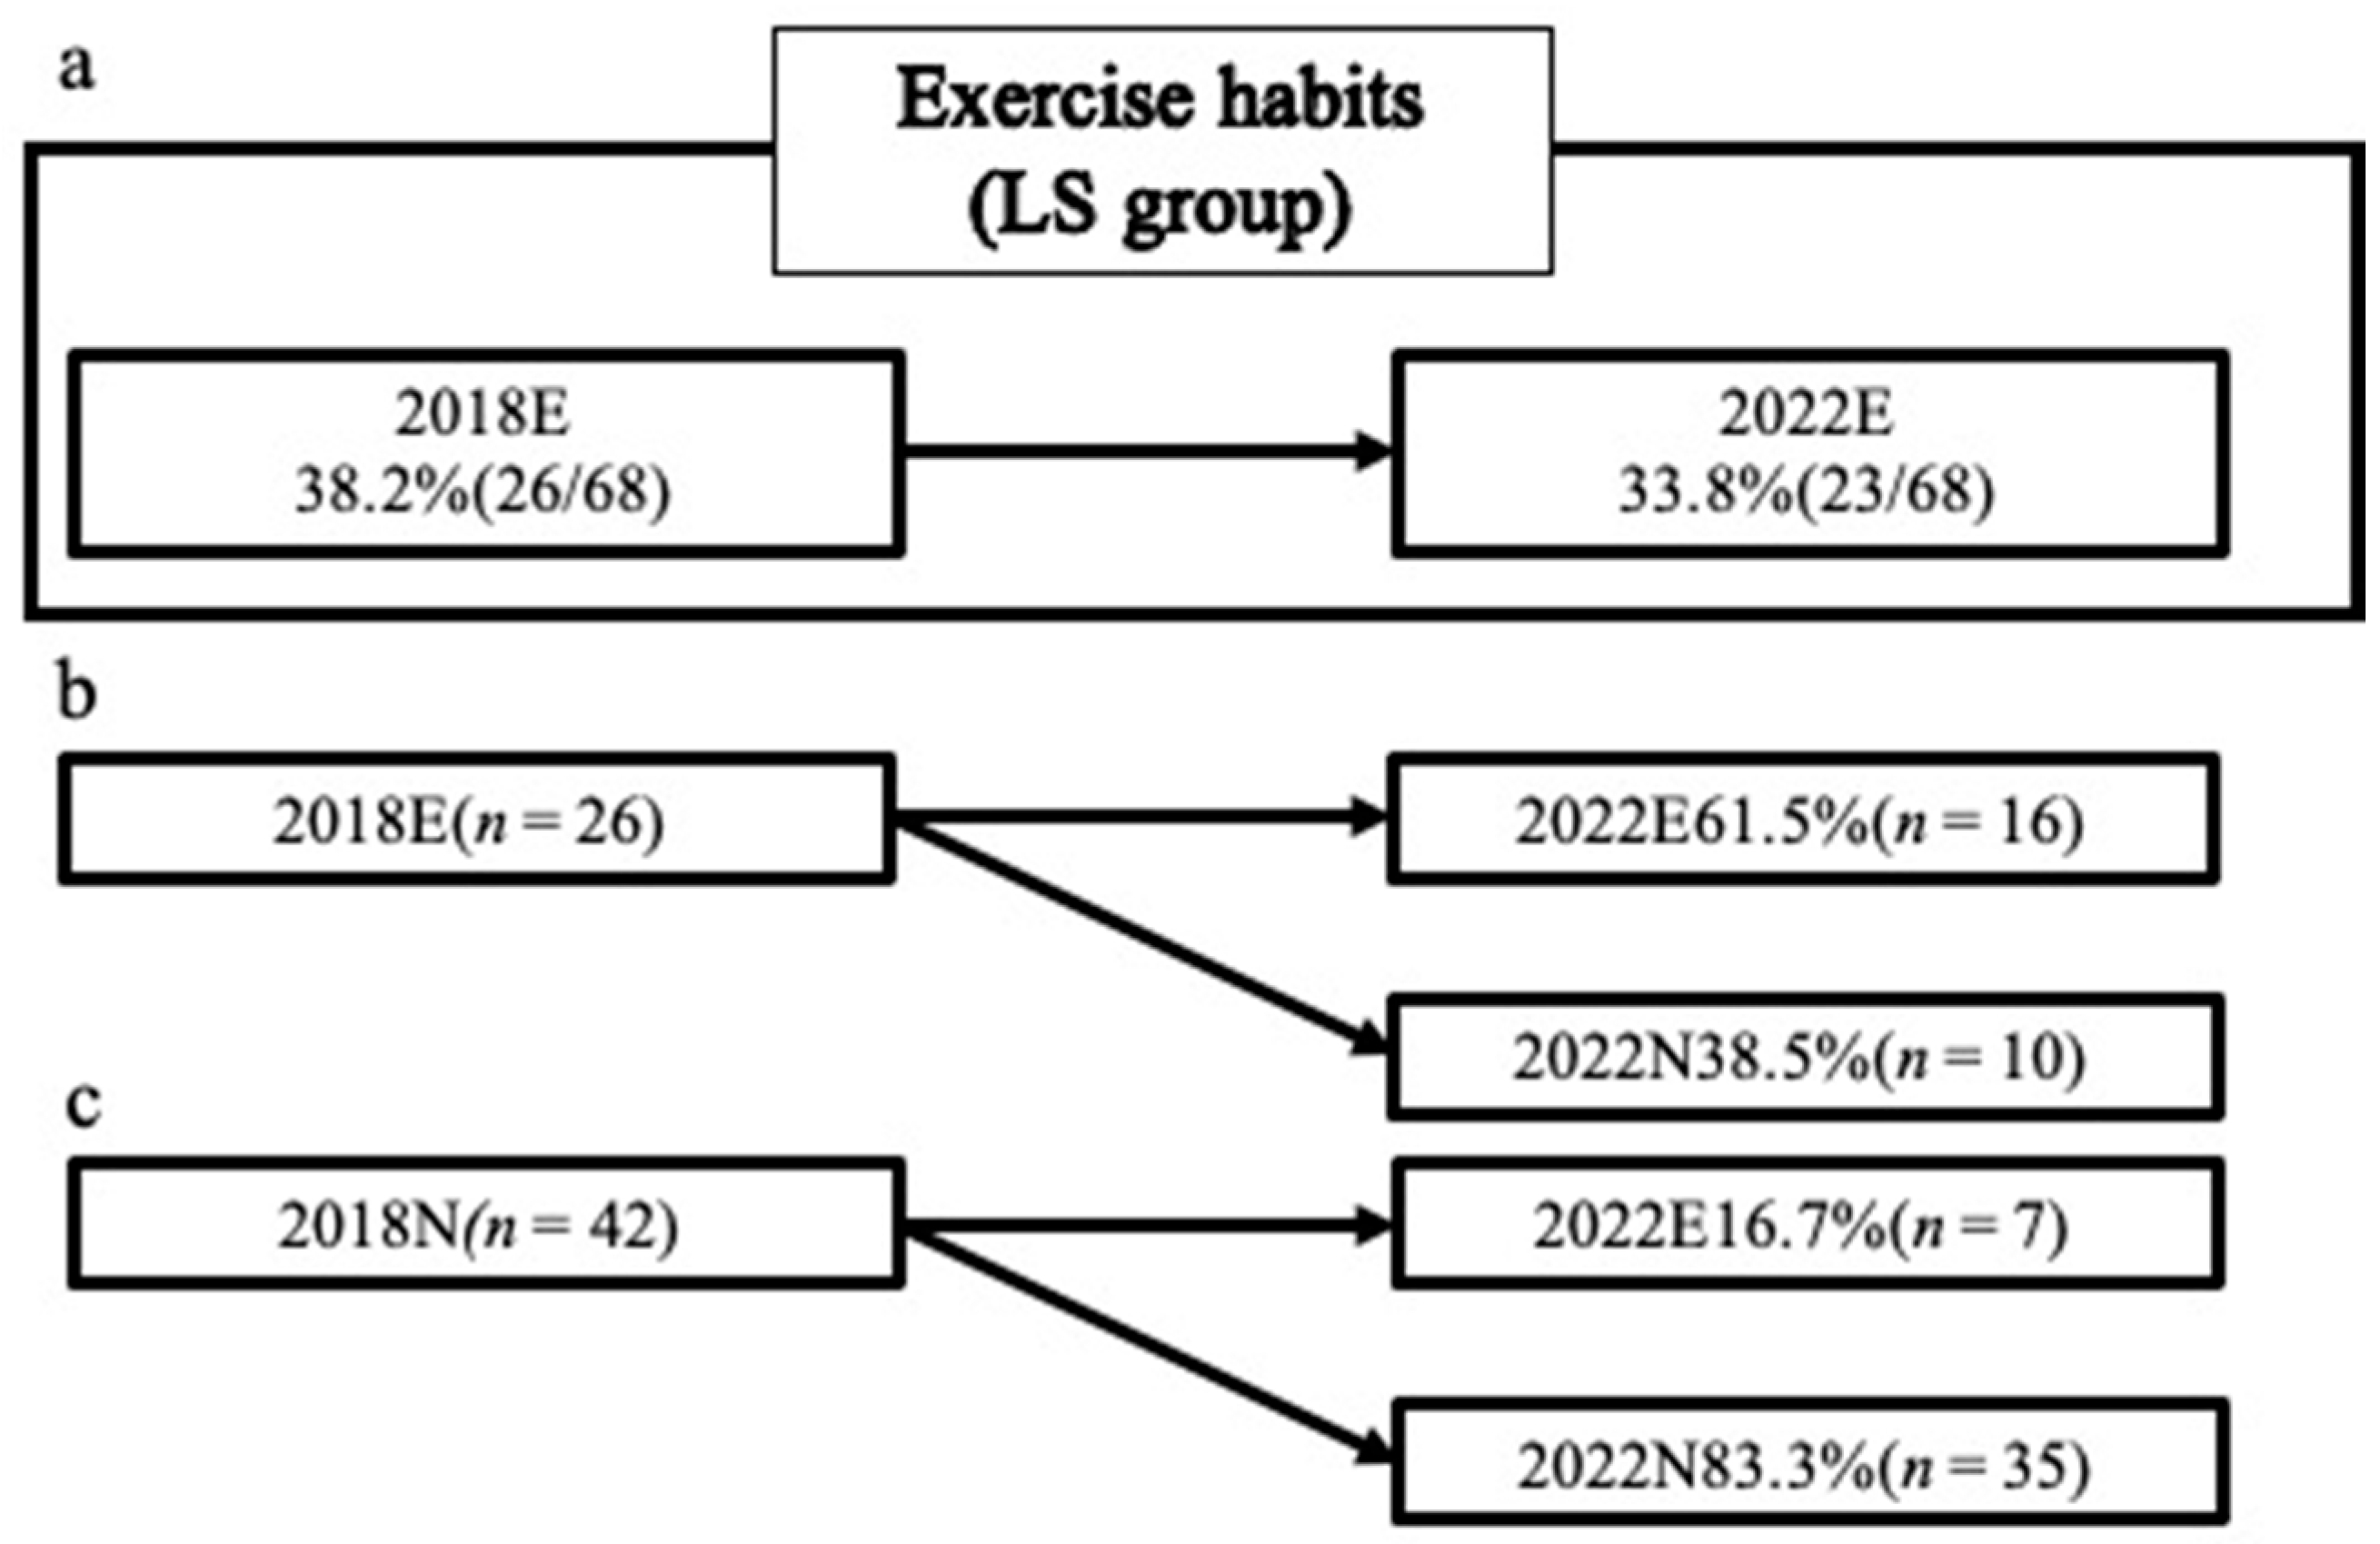
3.4. Participants with LS in 2018 (LS)
3.5. Comparison between Groups with and without Exercise Habits
3.6. Participants in the 2018N Group
3.7. Participants in the 2018E Group
4. Discussion
5. Conclusions
Supplementary Materials
Author Contributions
Funding
Institutional Review Board Statement
Informed Consent Statement
Data Availability Statement
Acknowledgments
Conflicts of Interest
References
- Bavel, J.J.V.; Baicker, K.; Boggio, P.S.; Capraro, V.; Cichocka, A.; Cikara, M.; Crockett, M.J.; Crum, A.J.; Douglas, K.M.; Druckman, J.N.; et al. Using Social and Behavioural Science to Support COVID-19 Pandemic Response. Nat. Hum. Behav. 2020, 4, 460–471. [Google Scholar] [CrossRef]
- Ammar, A.; Brach, M.; Trabelsi, K.; Chtourou, H.; Boukhris, O.; Masmoudi, L.; Bouaziz, B.; Bentlage, E.; How, D.; Ahmed, M.; et al. Effects of COVID-19 Home Confinement on Eating Behaviour and Physical Activity: Results of the ECLB-COVID19 International Online Survey. Nutrients 2020, 12, 1583. [Google Scholar] [CrossRef] [PubMed]
- Warburton, D.E.; Nicol, C.W.; Bredin, S.S. Health Benefits of Physical Activity: The Evidence. CMAJ 2006, 174, 801–809. [Google Scholar] [CrossRef]
- Nakamura, K. A “Super-Aged” Society and the “Locomotive Syndrome”. J. Orthop. Sci. 2008, 13, 1–2. [Google Scholar] [CrossRef]
- Yi, H.-S.; Lee, S. Overcoming Osteoporosis and Beyond: Locomotive Syndrome or Dysmobility Syndrome. Osteoporos. Sarcopenia 2018, 4, 77–78. [Google Scholar] [CrossRef]
- Tavares, D.R.; Santos, F.C. Locomotive Syndrome in the Elderly: Translation, Cultural Adaptation, and Brazilian Validation of the Tool 25-Question Geriatric Locomotive Function Scale. Rev. Bras. Reumatol. Engl. Ed. 2017, 57, 56–63. [Google Scholar] [CrossRef] [PubMed]
- Yoshimura, N.; Muraki, S.; Oka, H.; Mabuchi, A.; En-Yo, Y.; Yoshida, M.; Saika, A.; Yoshida, H.; Suzuki, T.; Yamamoto, S.; et al. Prevalence of Knee Osteoarthritis, Lumbar Spondylosis, and Osteoporosis in Japanese Men and Women: The Research on Osteoarthritis/Osteoporosis against Disability Study. J. Bone Miner. Metab. 2009, 27, 620–628. [Google Scholar] [CrossRef]
- Pieh, C.; Budimir, S.; Probst, T. The Effect of Age, Gender, Income, Work, and Physical Activity on Mental Health during Coronavirus Disease (COVID-19) Lockdown in Austria. J. Psychosom. Res. 2020, 136, 110186. [Google Scholar] [CrossRef] [PubMed]
- Awick, E.A.; Wójcicki, T.R.; Olson, E.A.; Fanning, J.; Chung, H.D.; Zuniga, K.; Mackenzie, M.; Kramer, A.F.; McAuley, E. Differential Exercise Effects on Quality of Life and Health-Related Quality of Life in Older Adults: A randomized Controlled Trial. Qual. Life Res. 2015, 24, 455–462. [Google Scholar] [CrossRef] [PubMed]
- Giné-Garriga, M.; Roqué-Fíguls, M.; Coll-Planas, L.; Sitjà-Rabert, M.; Salvà, A. Physical Exercise Interventions for Improving Performance-Based Measures of Physical Function in Community-Dwelling, Frail Older Adults: A Systematic Review and Meta-Analysis. Arch. Phys. Med. Rehabil. 2014, 95, 753–769.e3. [Google Scholar] [CrossRef]
- Imagama, S.; Hasegawa, Y.; Matsuyama, Y.; Sakai, Y.; Ito, Z.; Hamajima, N.; Ishiguro, N. Influence of Sagittal Balance and Physical Ability Associated with Exercise on Quality of Life in Middle-Aged and Elderly People. Arch. Osteoporos. 2011, 6, 13–20. [Google Scholar] [CrossRef]
- Ito, S.; Nakashima, H.; Ando, K.; Machino, M.; Seki, T.; Ishizuka, S.; Takegami, Y.; Wakai, K.; Hasegawa, Y.; Imagama, S. Nutritional Influences on Locomotive Syndrome. J. Clin. Med. 2022, 11, 610. [Google Scholar] [CrossRef] [PubMed]
- Kobayashi, K.; Ando, K.; Nakashima, H.; Machino, M.; Kanbara, S.; Ito, S.; Inoue, T.; Yamaguchi, H.; Koshimizu, H.; Segi, N.; et al. Relationship of Frequency of Participation in a Physical Checkup and Physical Fitness in Middle-Aged and Elderly People: The Yakumo Study. Nagoya J. Med. Sci. 2021, 83, 841–850. [Google Scholar] [PubMed]
- Fukuhara, S.; Bito, S.; Green, J.; Hsiao, A.; Kurokawa, K. Translation, Adaptation, and Validation of the SF-36 Health Survey for Use in Japan. J. Clin. Epidemiol. 1998, 51, 1037–1044. [Google Scholar] [CrossRef] [PubMed]
- Ware, J.E., Jr.; Sherbourne, C.D. The MOS 36-Item Short-Form Health Survey (SF-36). I. Conceptual Framework and Item Selection. Med. Care 1992, 30, 473–483. [Google Scholar] [CrossRef] [PubMed]
- Suzukamo, Y.; Fukuhara, S.; Green, J.; Kosinski, M.; Gandek, B.; Ware, J.E. Validation Testing of a Three-Component Model of Short Form-36 Scores. J. Clin. Epidemiol. 2011, 64, 301–308. [Google Scholar] [CrossRef] [PubMed]
- Herdman, M.; Gudex, C.; Lloyd, A.; Janssen, M.; Kind, P.; Parkin, D.; Bonsel, G.; Badia, X. Development and Preliminary Testing of the New Five-Level Version of EQ-5D (EQ-5D-5L). Qual. Life Res. 2011, 20, 1727–1736. [Google Scholar] [CrossRef] [PubMed]
- Pedersen, B.K.; Saltin, B. Exercise as medicine—Evidence for Prescribing Exercise as Therapy in 26 Different Chronic Diseases. Scand. J. Med. Sci. Sports 2015, 25 (Suppl. S3), 1–72. [Google Scholar] [CrossRef] [PubMed]
- Cheval, B.; Sivaramakrishnan, H.; Maltagliati, S.; Fessler, L.; Forestier, C.; Sarrazin, P.; Orsholits, D.; Chalabaev, A.; Sander, D.; Ntoumanis, N.; et al. Relationships between Changes in Self-Reported Physical Activity, Sedentary Behaviour and Health during the Coronavirus (COVID-19) Pandemic in France and Switzerland. J. Sports Sci. 2021, 39, 699–704. [Google Scholar] [CrossRef]
- Anderson, E.; Shivakumar, G. Effects of Exercise and Physical Activity on Anxiety. Front. Psychiatry 2013, 4, 27. [Google Scholar] [CrossRef]
- Witkowski, K.; Superson, M.; Piepiora, P. Body Composition and Motor Potential of Judo Athletes in Selected Weight Categories. Arch. Budo 2021, 17, 161–175. [Google Scholar]
- Nakamura, K. The Concept and Treatment of Locomotive Syndrome: Its Acceptance and Spread in Japan. J. Orthop. Sci. 2011, 16, 489–491. [Google Scholar] [CrossRef]
- Nishimura, A.; Ito, N.; Asanuma, K.; Akeda, K.; Ogura, T.; Sudo, A. Do Exercise Habits during Middle Age Affect Locomotive Syndrome in Old Age? Mod. Rheumatol. 2018, 28, 334–338. [Google Scholar] [CrossRef] [PubMed]
- Cohen-Mansfield, J.; Marx, M.; Guralnik, J. Motivators and Barriers to Exercise in an Older Community-Dwelling Population. J. Aging Phys. Act. 2003, 11, 242–253. [Google Scholar] [CrossRef]
- White, R.L.; Babic, M.J.; Parker, P.D.; Lubans, D.R.; Astell-Burt, T.; Lonsdale, C. Domain-Specific Physical Activity and Mental Health: A Meta-analysis. Am. J. Prev. Med. 2017, 52, 653–666. [Google Scholar] [CrossRef] [PubMed]
- Murphy, M.H.; Carlin, A.; Woods, C.; Nevill, A.; MacDonncha, C.; Ferguson, K.; Murphy, N. Active Students Are Healthier and Happier Than Their Inactive Peers: The Results of a Large Representative Cross-Sectional Study of University Students in Ireland. J. Phys. Act. Health 2018, 15, 737–746. [Google Scholar] [CrossRef]


| 2018 | Total (n = 200) | NLS (n = 132) | LS (n = 68) | p | Effect Size |
|---|---|---|---|---|---|
| Men/women | 95/105 | 66/66 | 29/39 | 0.371 | −0.070 |
| Age (y) | 66.5 ± 9.1 | 65.8 ± 9.1 | 68 ± 9.0 | 0.100 | −0.246 |
| Height (cm) | 158.2 ± 8.2 | 158.3 ± 8.1 | 157.9 ± 8.6 | 0.744 | 0.050 |
| Weight (kg) | 59 ± 10.7 | 58.2 ± 10.8 | 60.5 ± 10.5 | 0.163 | −0.210 |
| BMI (kg/m2) | 23.5 ± 3.2 | 23.1 ± 3.1 | 24.2 ± 3.3 | 0.023 | −0.343 |
| BFP (%) | 27.8 ± 6.5 | 27.3 ± 6.1 | 28.8 ± 7.2 | 0.128 | −0.232 |
| SMI (kg/m2) | 7.31 ± 1.13 | 7.23 ± 1.16 | 7.46 ± 1.07 | 0.334 | −0.210 |
| Right grip strength | 30.2 ± 9.7 | 30.8 ± 10.0 | 29 ± 9.0 | 0.220 | 0.185 |
| Left grip strength | 29.1 ± 9.7 | 29.9 ± 10.2 | 27.6 ± 8.6 | 0.106 | 0.244 |
| Back muscle strength (kg) | 80.3 ± 34.2 | 79.9 ± 32.8 | 81 ± 37.3 | 0.872 | −0.031 |
| Gait speed (m/s) | 2.2 ± 0.3 | 2.2 ± 0.3 | 2.1 ± 0.3 | 0.024 | 0.441 |
| PF | 88.5 ± 17.0 | 93.4 ± 14.0 | 79 ± 18.3 | <0.001 | −0.493 |
| RP | 87.3 ± 21.8 | 93.8 ± 14.4 | 74.7 ± 27.6 | <0.001 | −0.436 |
| BP | 71.2 ± 23.5 | 80.3 ± 19.1 | 53.5 ± 20.9 | <0.001 | 1.356 |
| GH | 66.7 ± 19.7 | 72.5 ± 17.2 | 55.4 ± 19.4 | <0.001 | 0.951 |
| VT | 60.9 ± 19.5 | 66.3 ± 16.9 | 50.3 ± 20.1 | <0.001 | 0.883 |
| SF | 86.1 ± 20.7 | 90 ± 17.6 | 78.7 ± 24.2 | <0.001 | −0.257 |
| RE | 88 ± 22.6 | 93.9 ± 14.5 | 76.5 ± 30.1 | <0.001 | −0.335 |
| MH | 75.5 ± 18.2 | 79.4 ± 16.7 | 68.1 ± 18.8 | <0.001 | 0.647 |
| PCS | 49.2 ± 9.3 | 52.8 ± 6.6 | 42.1 ± 9.8 | <0.001 | 1.381 |
| MCS | 51.5 ± 9.6 | 53.6 ± 8.8 | 47.6 ± 9.8 | <0.001 | 0.654 |
| RCS | 49.9 ± 11.3 | 51.2 ± 7.6 | 47.6 ± 16.0 | 0.036 | −0.019 |
| EQ-5D-5L | 0.89 ± 0.13 | 0.93 ± 0.07 | 0.8 ± 0.16 | <0.001 | −0.537 |
| GLFS-25 | 6.9 ± 9.3 | 2.5 ± 2.0 | 15.4 ± 11.8 | <0.001 | 0.822 |
| NLS (n = 132) | 2022N (n = 69) | 2022E (n = 63) | p | Effect Size | |
|---|---|---|---|---|---|
| 2018 | |||||
| Men/women | 66/66 | 30/39 | 36/27 | 0.163 | 0.137 |
| Age (y) | 65.8 ± 9.1 | 64.6 ± 9.4 | 67 ± 8.6 | 0.133 | −0.265 |
| Height (cm) | 158.3 ± 8.1 | 157.1 ± 8.1 | 159.7 ± 8.0 | 0.069 | −0.32 |
| Weight (kg) | 58.2 ± 10.8 | 56.5 ± 10.1 | 60.1 ± 11.3 | 0.052 | −0.342 |
| BMI (kg/m2) | 23.1 ± 3.1 | 22.8 ± 3.1 | 23.4 ± 3.1 | 0.241 | −0.205 |
| BFP (%) | 27.3 ± 6.1 | 27.7 ± 6.6 | 26.9 ± 5.6 | 0.437 | 0.136 |
| SMI (kg/m2) | 7.23 ± 1.16 | 7.31 ± 1.16 | 7.14 ± 1.16 | 0.554 | 0.149 |
| Right Grip strength | 30.8 ± 10.0 | 29.7 ± 10.5 | 31.9 ± 9.5 | 0.215 | −0.218 |
| Left Grip strength | 29.9 ± 10.2 | 28.9 ± 10.4 | 31.1 ± 9.9 | 0.230 | −0.21 |
| Back muscle strength (kg) | 79.9 ± 32.8 | 76.3 ± 30.6 | 83.6 ± 34.9 | 0.328 | −0.22 |
| Gait speed (m/s) | 2.2 ± 0.3 | 2.2 ± 0.4 | 2.2 ± 0.3 | 0.552 | −0.133 |
| 2022 | |||||
| PF | 90.1 ± 13.4 | 88.5 ± 16.5 | 92 ± 8.4 | 0.134 | 0.087 |
| RP | 90 ± 16.9 | 88.1 ± 19.5 | 92 ± 13.4 | 0.189 | −0.231 |
| BP | 75.2 ± 19.8 | 73.1 ± 19.7 | 77.5 ± 19.8 | 0.205 | −0.223 |
| GH | 71.6 ± 18.8 | 70.3 ± 20.0 | 73.1 ± 17.3 | 0.410 | −0.145 |
| VT | 67.4 ± 18.4 | 64.2 ± 20.2 | 70.9 ± 15.6 | 0.039 | −0.366 |
| SF | 84.5 ± 24.8 | 80.5 ± 27.2 | 88.9 ± 21.3 | 0.053 | −0.341 |
| RE | 91.6 ± 16.0 | 87.9 ± 19.4 | 95.7 ± 9.7 | 0.005 | −0.036 |
| MH | 79.6 ± 16.1 | 77.1 ± 16.7 | 82.4 ± 15.1 | 0.062 | −0.329 |
| PCS | 51 ± 8.7 | 50.9 ± 9.6 | 51.1 ± 7.6 | 0.891 | −0.024 |
| MCS | 54.1 ± 9.1 | 53 ± 9.5 | 55.2 ± 8.6 | 0.166 | −0.245 |
| RCS | 48.9 ± 10.9 | 47.1 ± 12.6 | 50.9 ± 8.2 | 0.051 | 0.005 |
| EQ-5D-5L | 0.95 ± 0.07 | 0.94 ± 0.07 | 0.95 ± 0.06 | 0.412 | −0.144 |
| GLFS-25 | 6.4 ± 4.7 | 6.9 ± 4.7 | 5.9 ± 4.6 | 0.237 | 0.207 |
| 2022LS (NLS/LS) | 72/60 | 34/35 | 38/25 | 0.224 | −0.111 |
| LS (n = 68) | 2022N (n = 45) | 2022E (n = 23) | p | Effect Size | |
|---|---|---|---|---|---|
| 2018 | |||||
| Men/women | 29/39 | 17/28 | 12/11 | 0.305 | 0.138 |
| Age (y) | 68 ± 9.0 | 66.6 ± 9.0 | 70.7 ± 8.4 | 0.070 | −0.469 |
| Height (cm) | 157.9 ± 8.6 | 157.4 ± 8.8 | 158.9 ± 8.2 | 0.511 | −0.17 |
| Weight (kg) | 60.5 ± 10.5 | 60.9 ± 11.2 | 59.7 ± 9.1 | 0.657 | 0.115 |
| BMI (kg/m2) | 24.2 ± 3.3 | 24.5 ± 3.5 | 23.6 ± 2.8 | 0.296 | 0.271 |
| BFP (%) | 28.8 ± 7.2 | 30.3 ± 7.1 | 26.1 ± 6.7 | 0.026 | 0.593 |
| SMI (kg/m2) | 7.46 ± 1.07 | 7.52 ± 1.19 | 7.34 ± 0.78 | 0.665 | 0.167 |
| Right Grip strength | 29 ± 9.0 | 28.2 ± 9.0 | 30.4 ± 9.2 | 0.348 | −0.243 |
| Left Grip strength | 27.6 ± 8.6 | 26.6 ± 8.5 | 29.5 ± 8.6 | 0.196 | −0.336 |
| Back muscle strength (kg) | 81 ± 37.3 | 79.8 ± 40.4 | 83.3 ± 31.6 | 0.785 | −0.09 |
| Gait speed (m/s) | 2.1 ± 0.3 | 2.1 ± 0.3 | 1.9 ± 0.2 | 0.057 | 0.65 |
| 2022 | |||||
| PF | 71.8 ± 20.8 | 69 ± 19.7 | 77.2 ± 22.1 | 0.124 | −0.399 |
| RP | 74.4 ± 25.3 | 71.7 ± 24.0 | 79.6 ± 27.3 | 0.222 | −0.316 |
| BP | 53.3 ± 17.5 | 49.7 ± 15.7 | 60.4 ± 19.0 | 0.016 | −0.634 |
| GH | 55.7 ± 22.3 | 54.2 ± 23.4 | 58.5 ± 20.2 | 0.450 | −0.195 |
| VT | 53.6 ± 20.4 | 50.3 ± 21.2 | 60.1 ± 17.3 | 0.060 | −0.49 |
| SF | 73 ± 26.8 | 71.7 ± 28.5 | 75.5 ± 23.4 | 0.576 | −0.144 |
| RE | 76.3 ± 26.6 | 74.1 ± 26.8 | 80.8 ± 26.2 | 0.327 | −0.253 |
| MH | 68.2 ± 20.1 | 66 ± 20.3 | 72.5 ± 19.3 | 0.206 | −0.327 |
| PCS | 38.8 ± 13.5 | 37 ± 13.3 | 42.1 ± 13.5 | 0.145 | −0.38 |
| MCS | 49.6 ± 10.8 | 48.7 ± 10.2 | 51.2 ± 11.9 | 0.370 | −0.232 |
| RCS | 45.7 ± 15.5 | 45.1 ± 16.0 | 46.7 ± 14.9 | 0.704 | −0.098 |
| EQ-5D-5L | 0.82 ± 0.17 | 0.8 ± 0.18 | 0.86 ± 0.13 | 0.168 | −0.358 |
| GLFS-25 | 19 ± 15.0 | 20.8 ± 17.1 | 15.6 ± 9.2 | 0.180 | 0.347 |
| 2022LS (N/L) | 8/68 | 4/41 | 4/19 | 0.429 | −0.125 |
Disclaimer/Publisher’s Note: The statements, opinions and data contained in all publications are solely those of the individual author(s) and contributor(s) and not of MDPI and/or the editor(s). MDPI and/or the editor(s) disclaim responsibility for any injury to people or property resulting from any ideas, methods, instructions or products referred to in the content. |
© 2024 by the authors. Licensee MDPI, Basel, Switzerland. This article is an open access article distributed under the terms and conditions of the Creative Commons Attribution (CC BY) license (https://creativecommons.org/licenses/by/4.0/).
Share and Cite
Ito, S.; Nakashima, H.; Segi, N.; Ouchida, J.; Oishi, R.; Yamauchi, I.; Ishizuka, S.; Takegami, Y.; Seki, T.; Hasegawa, Y.; et al. A Longitudinal Study on the Effect of Exercise Habits on Locomotive Syndrome and Quality of Life during the Coronavirus Disease 2019 Pandemic. J. Clin. Med. 2024, 13, 1385. https://doi.org/10.3390/jcm13051385
Ito S, Nakashima H, Segi N, Ouchida J, Oishi R, Yamauchi I, Ishizuka S, Takegami Y, Seki T, Hasegawa Y, et al. A Longitudinal Study on the Effect of Exercise Habits on Locomotive Syndrome and Quality of Life during the Coronavirus Disease 2019 Pandemic. Journal of Clinical Medicine. 2024; 13(5):1385. https://doi.org/10.3390/jcm13051385
Chicago/Turabian StyleIto, Sadayuki, Hiroaki Nakashima, Naoki Segi, Jun Ouchida, Ryotaro Oishi, Ippei Yamauchi, Shinya Ishizuka, Yasuhiko Takegami, Taisuke Seki, Yukiharu Hasegawa, and et al. 2024. "A Longitudinal Study on the Effect of Exercise Habits on Locomotive Syndrome and Quality of Life during the Coronavirus Disease 2019 Pandemic" Journal of Clinical Medicine 13, no. 5: 1385. https://doi.org/10.3390/jcm13051385
APA StyleIto, S., Nakashima, H., Segi, N., Ouchida, J., Oishi, R., Yamauchi, I., Ishizuka, S., Takegami, Y., Seki, T., Hasegawa, Y., & Imagama, S. (2024). A Longitudinal Study on the Effect of Exercise Habits on Locomotive Syndrome and Quality of Life during the Coronavirus Disease 2019 Pandemic. Journal of Clinical Medicine, 13(5), 1385. https://doi.org/10.3390/jcm13051385