

Development of a Model for Predicting Mortality Among Patients Hospitalized with COVID-19 During Their Stay in a Clinical Centre

 , , , ,
Abstract
1. Introduction
2. Materials and Methods
2.1. Study Design and Participants
2.2. Data Collection
2.3. Statistical Analysis
2.3.1. Model Performance Evaluation
- (a)
- Concordance Index (C-index): Evaluated to determine the overall discriminative ability of the model, with values ≥0.7 considered acceptable [14].
- (b)
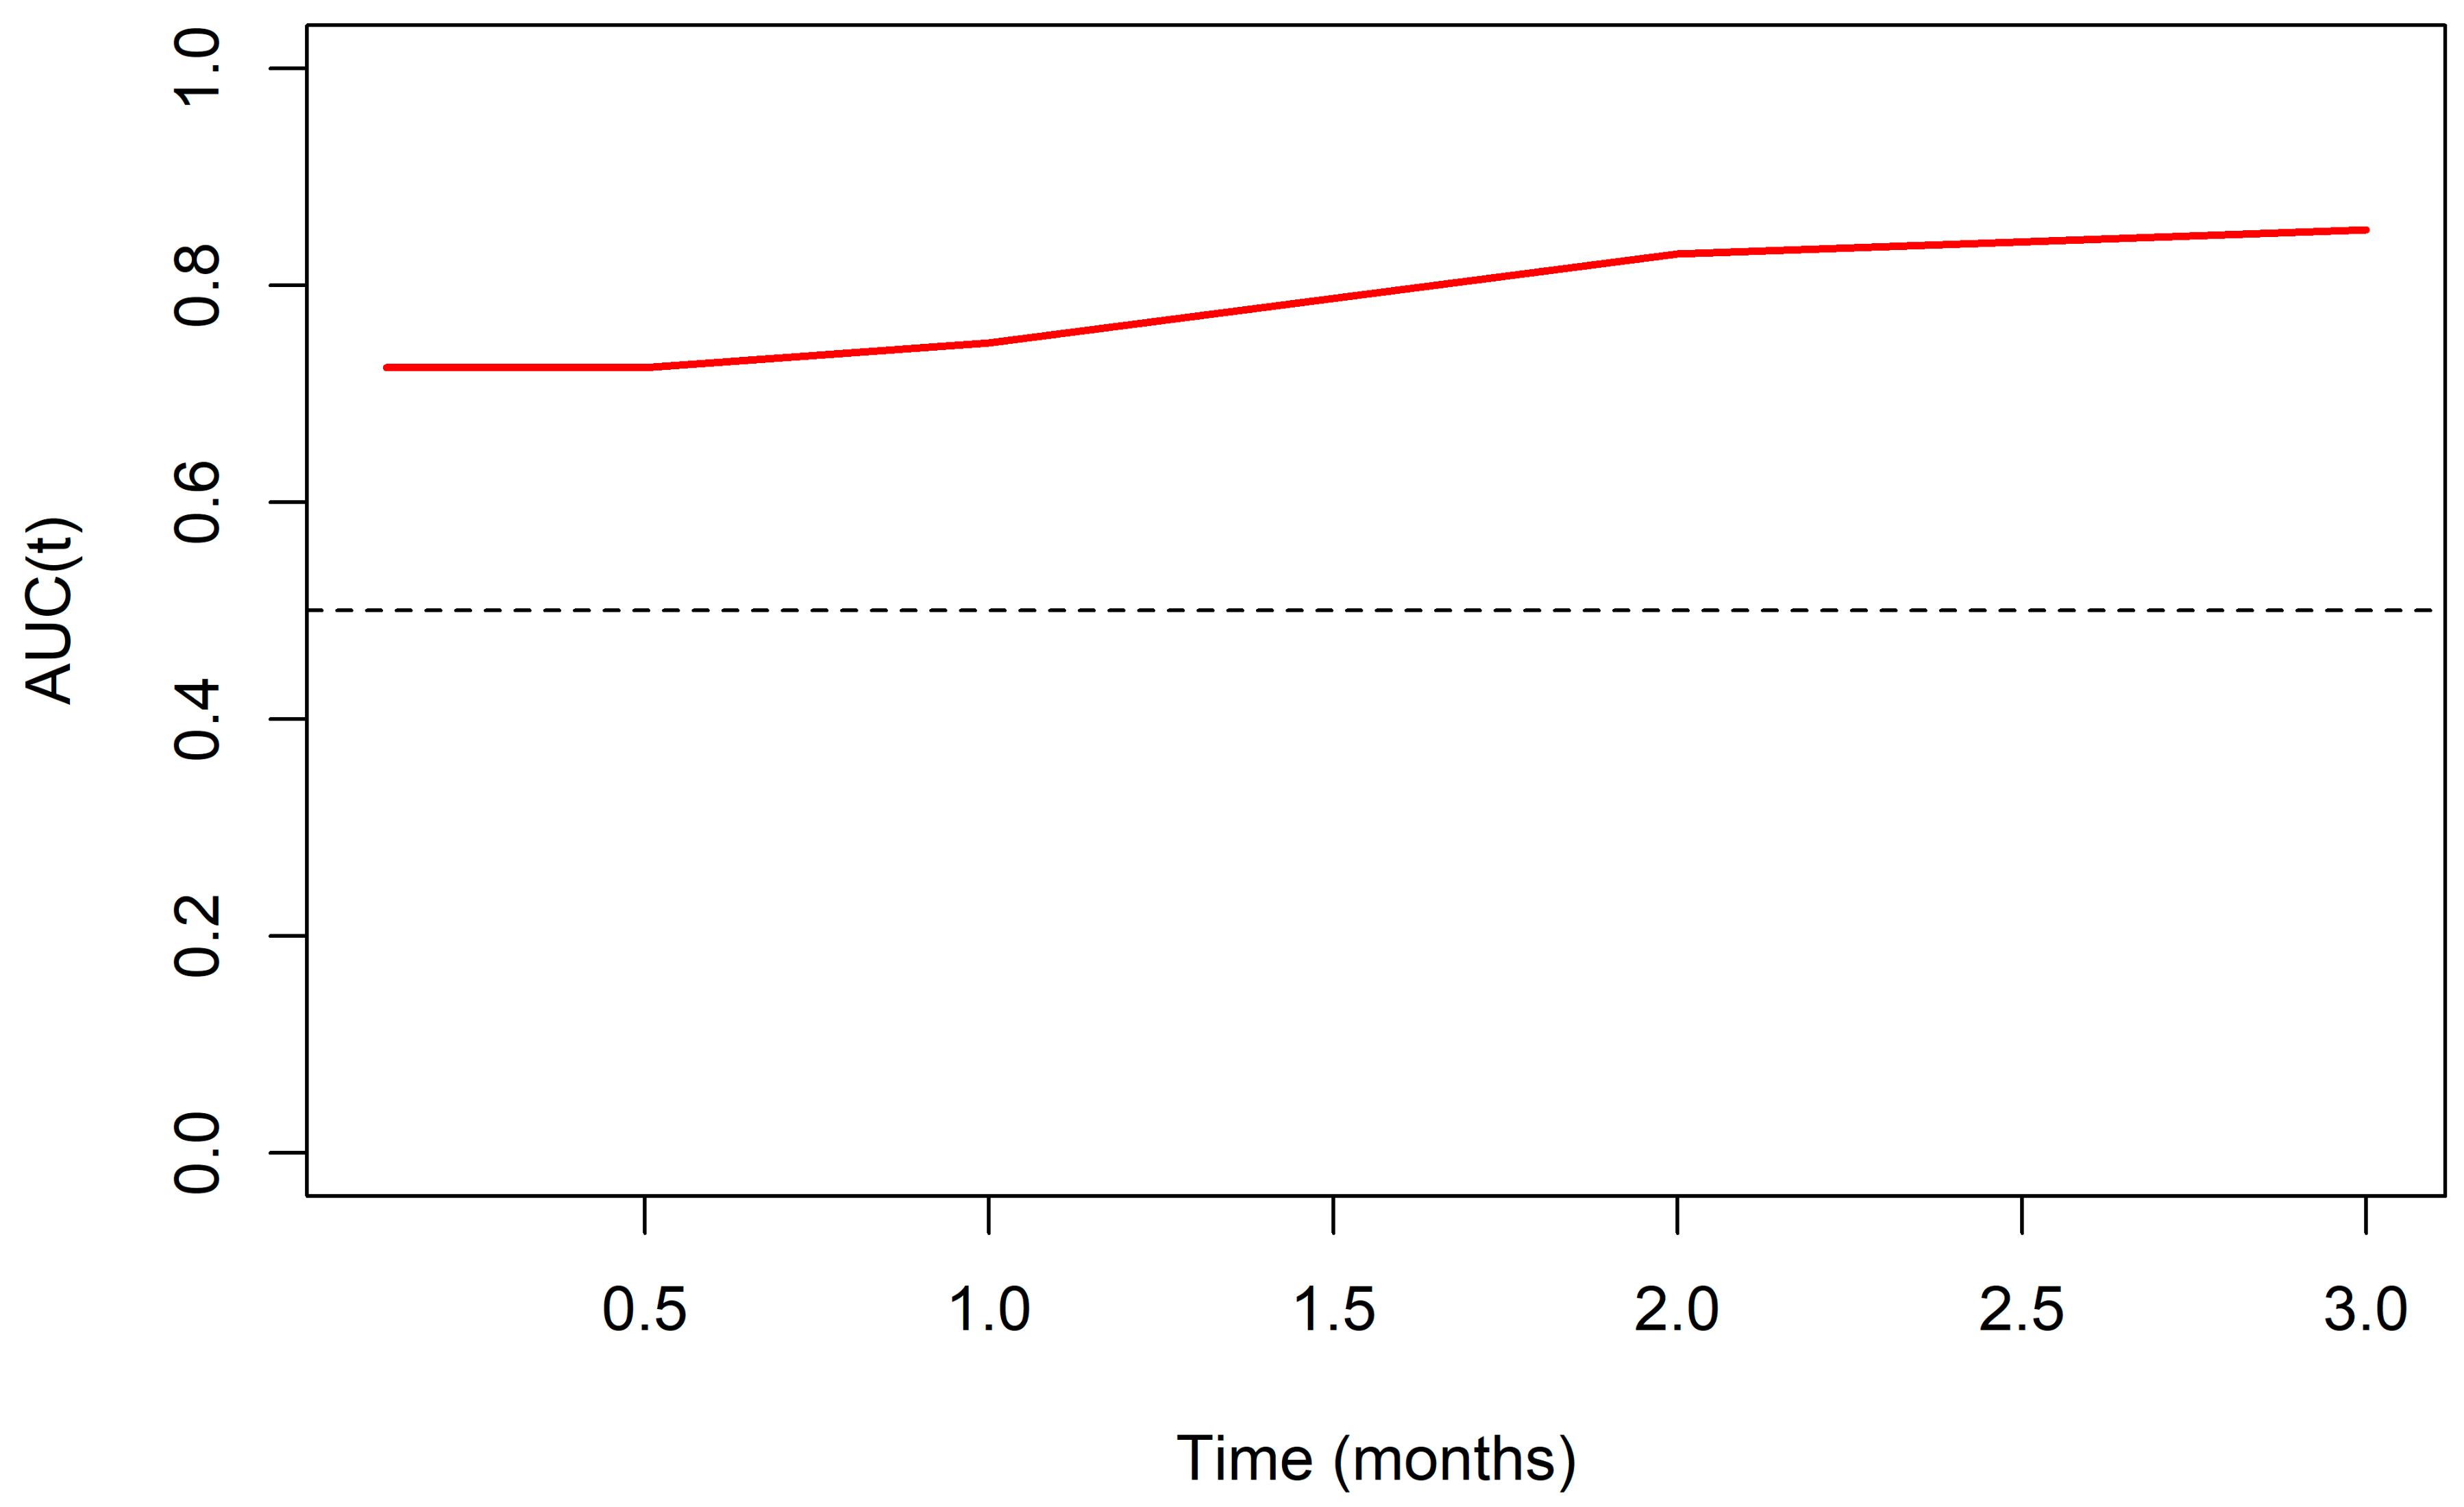
- Time-Dependent C-Statistic: Assessed the model’s discriminative performance at specific time points (0.125, 0.5, 1, 2, and 3 months) using the method proposed by Uno et al. 2011 [15], accounting for censored data over time.
- (c)
- D-index: Calculated to measure the model’s ability to separate patients who experience the event from those who do not, with values >0.1 indicating acceptable discrimination and >0.3 indicating strong discrimination [16].
- (d)
- Integrated Brier Score (IBS): Evaluated the calibration and overall accuracy of survival predictions over time, where lower values signify better predictive performance. The IBS was compared against a reference model to contextualize the predictive accuracy [17].
- (e)
- Time-Dependent ROC Curve (timeROC): Utilized to observe the predictive quality as a function of follow-up time, complemented by sensitivity (Sn), specificity (Sp), and the area under the curve (AUC) for the specified cut-off points [18].
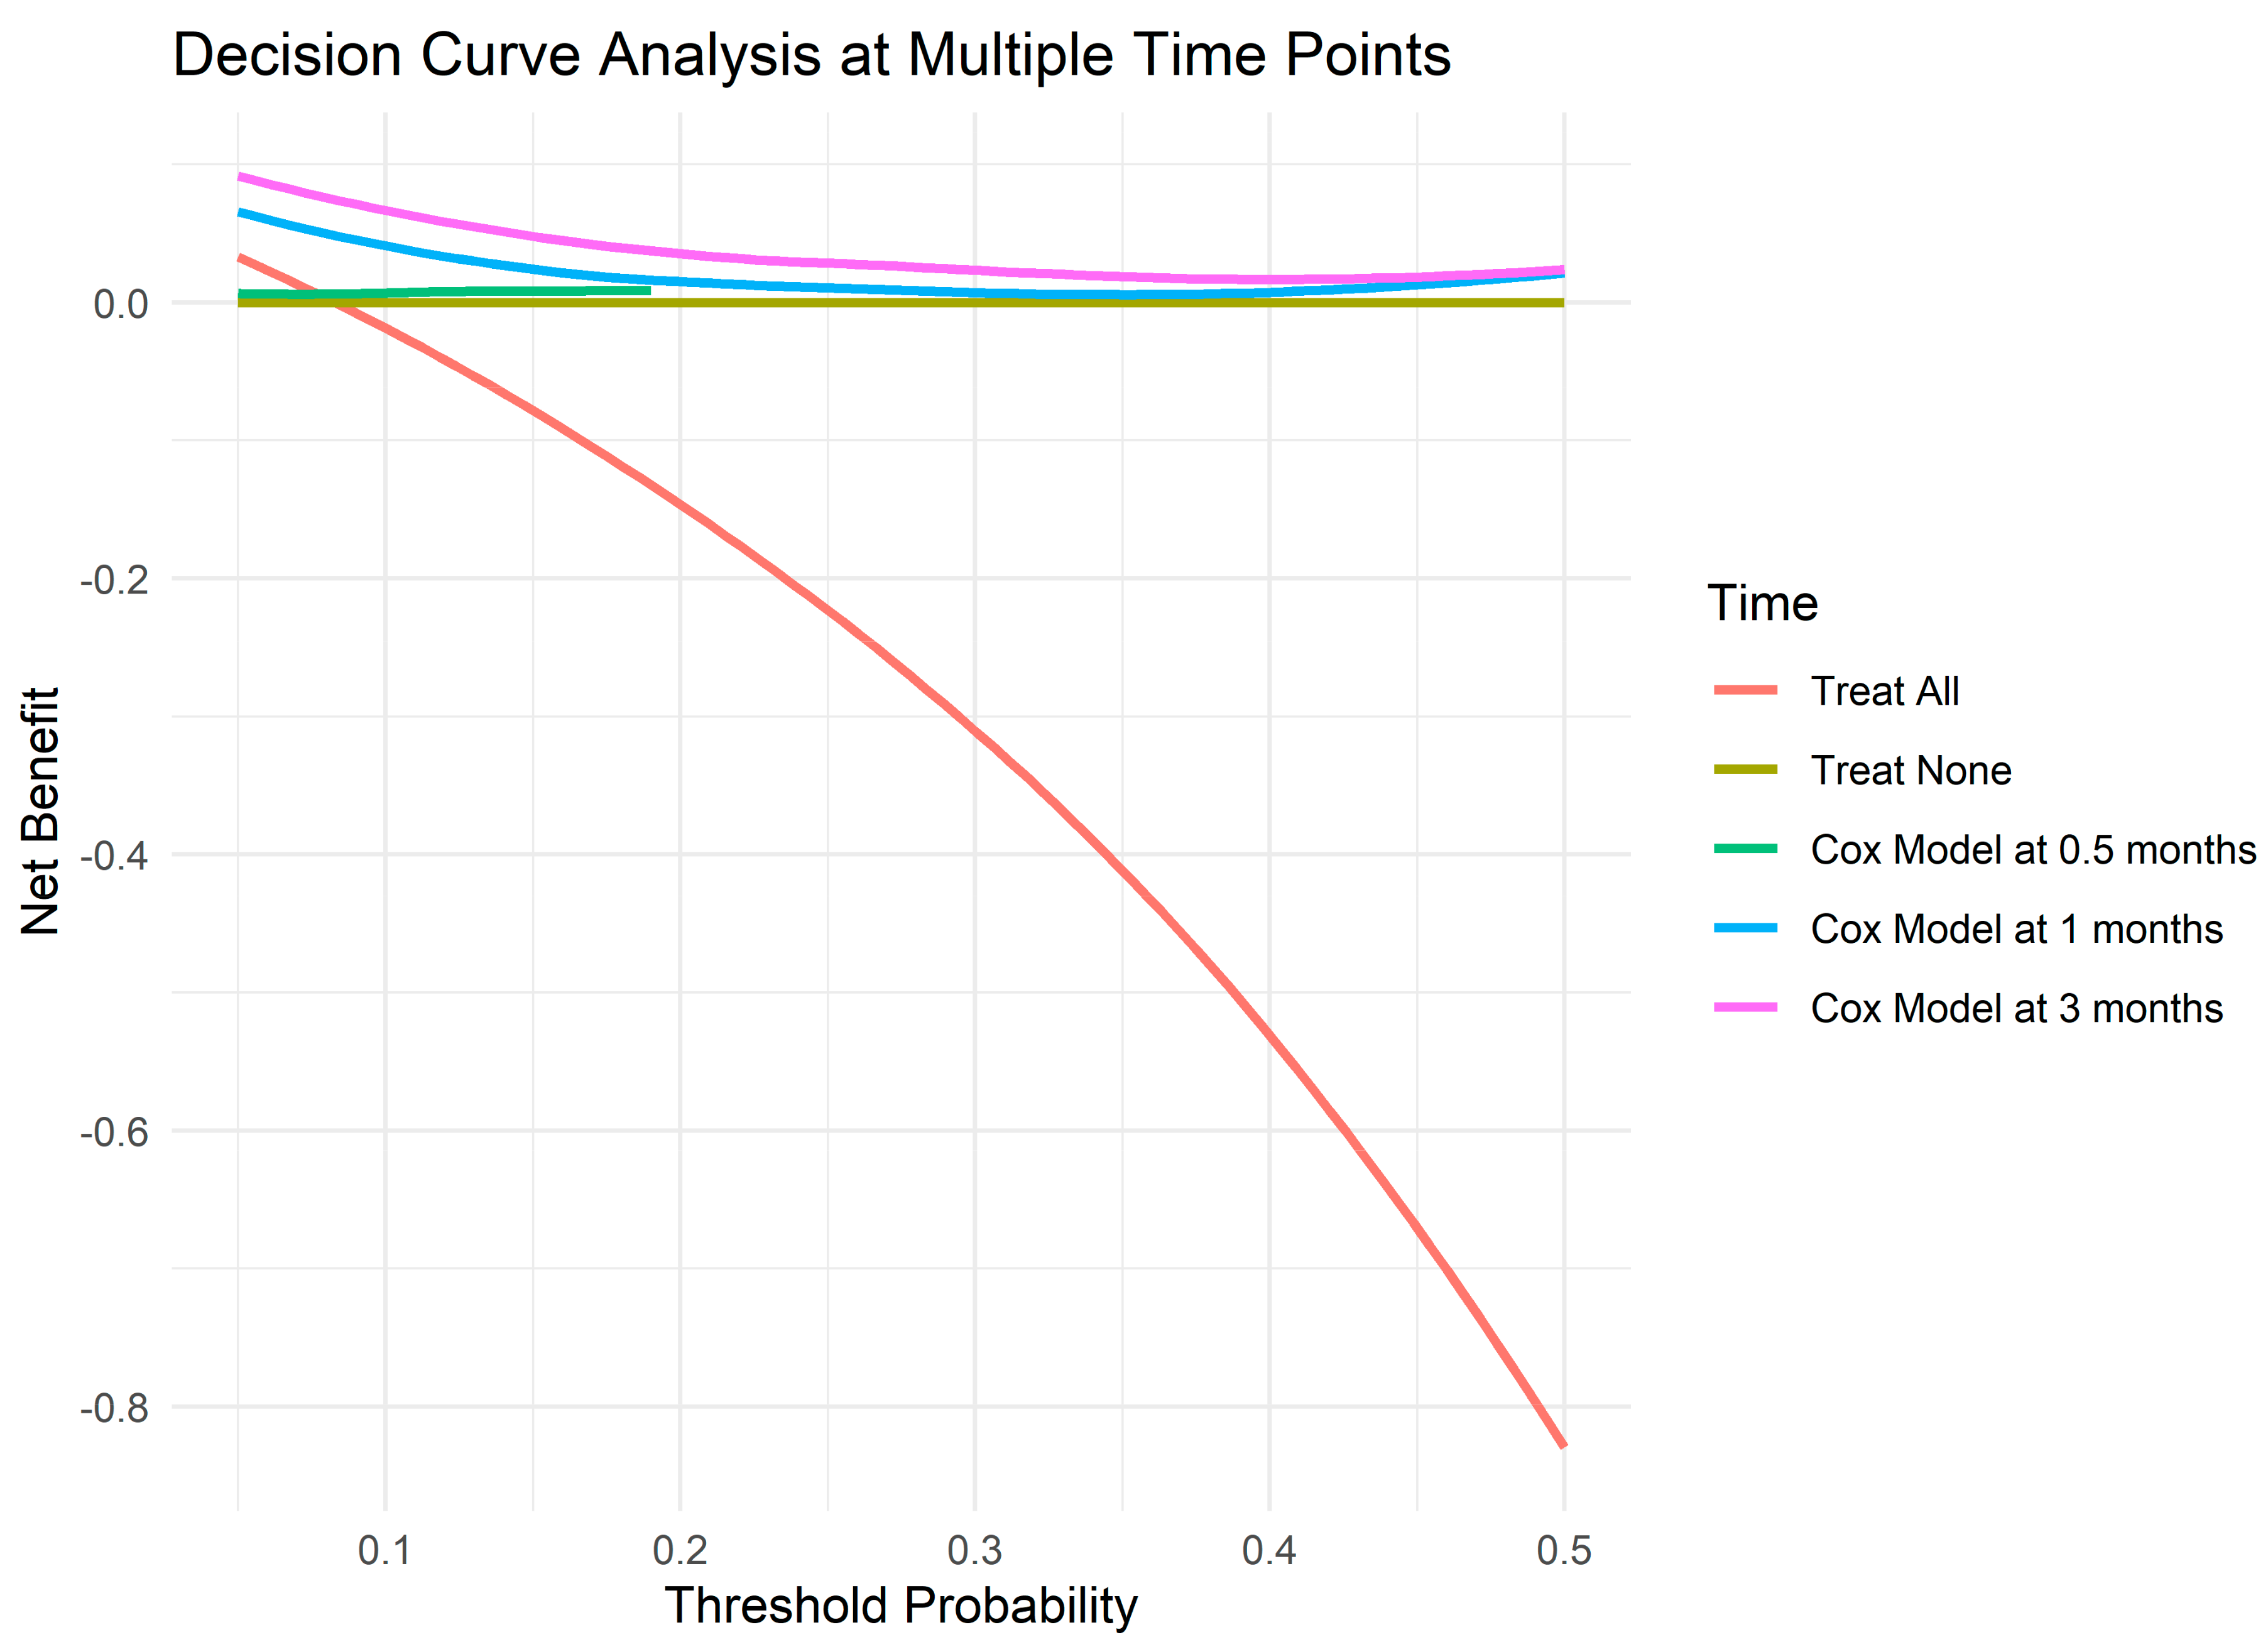
2.3.2. Decision Curve Analysis and Net Benefit
3. Result
3.1. Best Model Performance
3.2. Decision Curve Analysis and Net Benefit
4. Discussion
5. Conclusions
Author Contributions
Funding
Institutional Review Board Statement
Informed Consent Statement
Data Availability Statement
Conflicts of Interest
References
- Pan American Health Organization/World Health Organization. COVID-19 PAHO/WHO Response; Report No.: 81; PAHO/WHO: Washington DC, USA, 2022. [Google Scholar]
- Data Analytics & Delivery for Impact (DDI). World Health Statistics 2024: Monitoring Health for the SDGs, Sustainable Development Goals; World Health Organization: Geneva, Switzerland, 2024. [Google Scholar]
- Dessie, Z.G.; Zewotir, T. Mortality-related risk factors of COVID-19: A systematic review and meta-analysis of 42 studies and 423,117 patients. BMC Infect. Dis. 2021, 21, 855. [Google Scholar] [CrossRef]
- Gong, W.; Parkkila, S.; Wu, X.; Aspatwar, A. SARS-CoV-2 variants and COVID-19 vaccines: Current challenges and future strategies. Int. Rev. Immunol. 2023, 42, 393–414. [Google Scholar] [CrossRef]
- Liang, W.; Liang, H.; Ou, L.; Chen, B.; Chen, A.; Li, C.; Li, Y.; Guan, W.; Sang, L.; Lu, J.; et al. Development and Validation of a Clinical Risk Score to Predict the Occurrence of Critical Illness in Hospitalized Patients with COVID-19. JAMA Intern. Med. 2020, 180, 1081–1089. [Google Scholar] [CrossRef]
- Ji, D.; Zhang, D.; Xu, J.; Chen, Z.; Yang, T.; Zhao, P.; Chen, G.; Cheng, G.; Wang, Y.; Bi, J.; et al. Prediction for Progression Risk in Patients with COVID-19 Pneumonia: The CALL Score. Clin. Infect. Dis. 2020, 71, 1393–1399. [Google Scholar] [CrossRef]
- Grifoni, E.; Valoriani, A.; Cei, F.; Vannucchi, V.; Moroni, F.; Pelagatti, L.; Tarquini, R.; Landini, G.; Masotti, L. The CALL Score for Predicting Outcomes in Patients with COVID-19. Clin. Infect. Dis. 2021, 72, 182–183. [Google Scholar] [CrossRef]
- Verdugo, R.A.; Genova, A.D.; Herrera, L.; Moraga, M.; Acuña, M.; Berríos, S.; Llop, E.; Valenzuela, C.Y.; Bustamante, M.L.; Digman, D.; et al. Development of a small panel of SNPs to infer ancestry in Chileans that distinguishes Aymara and Mapuche components. Biol. Res. 2020, 53, 15. [Google Scholar] [CrossRef]
- WHO Working Group on the Clinical Characterisation and Management of COVID-19 Infection. A minimal common outcome measure set for COVID-19 clinical research. Lancet Infect. Dis. 2020, 20, e192–e197. [Google Scholar] [CrossRef]
- van Buuren, S.; Groothuis-Oudshoorn, K. mice: Multivariate Imputation by Chained Equations in R. J. Stat. Softw. 2011, 45, 1–67. [Google Scholar] [CrossRef]
- Li, Y.; Deng, Y.; Ye, L.; Sun, H.; Du, S.; Huang, H.; Zeng, F.; Chen, X.; Deng, G. Clinical Significance of Plasma D-Dimer in COVID-19 Mortality. Front. Med. 2021, 8, 638097. [Google Scholar] [CrossRef]
- Zhao, R.; Su, Z.; Komissarov, A.A.; Liu, S.L.; Yi, G.; Idell, S.; Matthay, M.A.; Ji, H.-L. Associations of D-Dimer on Admission and Clinical Features of COVID-19 Patients: A Systematic Review, Meta-Analysis, and Meta-Regression. Front. Immunol. 2021, 12, 691249. [Google Scholar] [CrossRef]
- Burnham, K.P.; Anderson, D.R. Model Selection and Multimodel Inference: A Practical Information-Theoretic Approach, 2nd ed.; Springer: New York, NY, USA, 2002; p. 488. [Google Scholar]
- Harrell, F.E., Jr.; Califf, R.M.; Pryor, D.B.; Lee, K.L.; Rosati, R.A. Evaluating the yield of medical tests. JAMA 1982, 247, 2543–2546. [Google Scholar] [CrossRef]
- Uno, H.; Cai, T.; Pencina, M.J.; D'Agostino, R.B.; Wei, L.J. On the C-statistics for evaluating overall adequacy of risk prediction procedures with censored survival data. Stat. Med. 2011, 30, 1105–1117. [Google Scholar] [CrossRef]
- Royston, P.; Sauerbrei, W. A new measure of prognostic separation in survival data. Stat. Med. 2004, 23, 723–748. [Google Scholar] [CrossRef]
- Graf, E.; Schmoor, C.; Sauerbrei, W.; Schumacher, M. Assessment and comparison of prognostic classification schemes for survival data. Stat. Med. 1999, 18, 2529–2545. [Google Scholar] [CrossRef]
- Heagerty, P.J.; Zheng, Y. Survival model predictive accuracy and ROC curves. Biometrics 2005, 61, 92–105. [Google Scholar] [CrossRef]
- Efron, B.; Tibshirani, R. Improvements on Cross-Validation: The .632+ Bootstrap Method. J. Am. Stat. Assoc. 1997, 92, 548–560. [Google Scholar]
- Vickers, A.J.; Cronin, A.M.; Elkin, E.B.; Gonen, M. Extensions to decision curve analysis, a novel method for evaluating diagnostic tests, prediction models and molecular markers. BMC Med. Inform. Decis. Mak. 2008, 8, 53. [Google Scholar] [CrossRef]
- Letelier, P.; Delgado, H.; Garrido, F.; Quiñones, F.; San Martín, A.; Hernández, L.; Garcés, P.; Guzmán-Oyarzo, D.; Boguen, R.; Hernandez, A.; et al. Dynamic changes of hematological and hemostatic parameters in COVID-19 hospitalized patients: Potential role as severity biomarkers for the Chilean population. J. Med. Biochem. 2024, 43, 556–564. [Google Scholar] [CrossRef]
- Attaway, A.H.; Scheraga, R.G.; Bhimraj, A.; Biehl, M.; Hatipoğlu, U. Severe COVID-19 pneumonia: Pathogenesis and clinical management. BMJ (Clin. Res. Ed.) 2021, 372, n436. [Google Scholar] [CrossRef]
- Vasilevskaya, A.; Mushtaque, A.; Tsang, M.Y.; Alwazan, B.; Herridge, M.; Cheung, A.M.; Tartaglia, M.C. Sex and age affect acute and persisting COVID-19 illness. Sci. Rep. 2023, 13, 6029. [Google Scholar] [CrossRef]
- Khamis, F.; Al Awaidy, S.; Ba'Omar, M.; Osman, W.; Chhetri, S.; Ambusaid, Z.; Al Fahdi, Z.; Al Lawati, J.; Al Sulaimi, K.; Al Bulushi, S.A.; et al. The Impact of Demographic, Clinical Characteristics and the Various COVID-19 Variant Types on All-Cause Mortality: A Case-Series Retrospective Study. Diseases 2022, 10, 100. [Google Scholar] [CrossRef]
- Villalobos Dintrans, P.; Castillo, C.; de la Fuente, F.; Maddaleno, M. COVID-19 incidence and mortality in the Metropolitan Region, Chile: Time, space, and structural factors. PLoS ONE 2021, 16, e0250707. [Google Scholar] [CrossRef]
- Balboa-Castillo, T.; Ossa, X.; Muñoz, S.; Neira, J.; Padilla, A.; Oñat, M.; Briones, J.; Concha, C. Features of patients admitted for COVID-19 at a regional hospital in the Chilean Araucania Region. Rev. Medica Chile 2021, 149, 1552–1560. [Google Scholar] [CrossRef]
- Lentner, J.; Adams, T.; Knutson, V.; Zeien, S.; Abbas, H.; Moosavi, R.; Manuel, C.; Wallace, T.; Harmon, A.; Waters, R.; et al. C-reactive protein levels associated with COVID-19 outcomes in the United States. J. Osteopath. Med. 2021, 121, 869–873. [Google Scholar] [CrossRef]
- Molins, B.; Figueras-Roca, M.; Valero, O.; Llorenç, V.; Romero-Vázquez, S.; Sibila, O.; Adán, A.; García-Vidal, C.; Soriano, A. C-reactive protein isoforms as prognostic markers of COVID-19 severity. Front. Immunol. 2022, 13, 1105343. [Google Scholar]
- Stringer, D.; Braude, P.; Myint, P.K.; Evans, L.; Collins, J.T.; Verduri, A.; Quinn, T.J.; Vilches-Moraga, A.; Stechman, M.J.; Pearce, L.; et al. The role of C-reactive protein as a prognostic marker in COVID-19. Int. J. Epidemiol. 2021, 50, 420–429. [Google Scholar] [CrossRef]
- Vial, M.R.; Peters, A.; Pérez, I.; Spencer-Sandino, M.; Barbé, M.; Porte, L.; Weitzel, T.; Aylwin, M.; Vial, P.; Araos, R.; et al. COVID-19 in South America: Clinical and epidemiological characteristics among 381 patients during the early phase of the pandemic in Santiago, Chile. BMC Infect. Dis. 2020, 20, 955. [Google Scholar] [CrossRef]
- Balta, S.; Balta, I. COVID-19 and Inflammatory Markers. Curr. Vasc. Pharmacol. 2022, 20, 326–332. [Google Scholar] [CrossRef]
- Smilowitz, N.R.; Kunichoff, D.; Garshick, M.; Shah, B.; Pillinger, M.; Hochman, J.S.; Berger, J.S. C-reactive protein and clinical outcomes in patients with COVID-19. Eur. Heart J. 2021, 42, 2270–2279. [Google Scholar] [CrossRef]
- Ergenç, H.; Ergenç, Z.; Dog An, M.; Usanmaz, M.; Gozdas, H.T. C-reactive protein and neutrophil-lymphocyte ratio as predictors of mortality in coronavirus disease 2019. Rev. Assoc. Medica Bras. 2021, 67, 1498–1502. [Google Scholar] [CrossRef]
- Poudel, A.; Poudel, Y.; Adhikari, A.; Aryal, B.B.; Dangol, D.; Bajracharya, T.; Maharjan, A.; Gautam, R. D-dimer as a biomarker for assessment of COVID-19 prognosis: D-dimer levels on admission and its role in predicting disease outcome in hospitalized patients with COVID-19. PLoS ONE 2021, 16, e0256744. [Google Scholar] [CrossRef] [PubMed]
- Terra, P.O.C.; Donadel, C.D.; Oliveira, L.C.; Menegueti, M.G.; Auxiliadora-Martins, M.; Calado, R.T.; De Santis, G.C. Neutrophil-to-lymphocyte ratio and D-dimer are biomarkers of death risk in severe COVID-19: A retrospective observational study. Health Sci. Rep. 2022, 5, e514. [Google Scholar] [CrossRef] [PubMed]
- Nemec, H.M.; Ferenczy, A.; Christie, B.D., 3rd; Ashley, D.W.; Montgomery, A. Correlation of D-dimer and Outcomes in COVID-19 Patients. Am. Surg. 2022, 88, 2115–2118. [Google Scholar] [CrossRef] [PubMed]
- Kaushal, K.; Kaur, H.; Sarma, P.; Bhattacharyya, A.; Sharma, D.J.; Prajapat, M.; Kothari, A.; Kumar, S.; Rana, S.; Kaur, M.; et al. Serum ferritin as a predictive biomarker in COVID-19. A systematic review, meta-analysis and meta-regression analysis. J. Crit. Care 2022, 67, 172–181. [Google Scholar] [CrossRef]
- Soto, A.; Quiñones-Laveriano, D.M.; Azañero, J.; Chumpitaz, R.; Claros, J.; Salazar, L.; Rosales, O.; Nuñez, L.; Roca, D.; Alcantara, A. Mortality and associated risk factors in patients hospitalized due to COVID-19 in a Peruvian reference hospital. PLoS ONE 2022, 17, e0264789. [Google Scholar] [CrossRef]
- Sanhueza, M.; Barrera, M.; Pedemonte, J.C.; Rojas, L. Validation of the CALL score as a mortality prediction tool in a cohort of hospitalized COVID-19 patients in Chile. Front. Med. 2023, 10, 1164615. [Google Scholar] [CrossRef]
- Ostrowska, M.; Kasprzak, M.; Fabiszak, T.; Gajda, J.; Jaje-Rykowska, N.; Michalski, P.; Moczulska, B.; Nowek, P.; Piasecki, M.; Pilaczyńska-Cemel, M.; et al. The 123 COVID SCORE: A simple and reliable diagnostic tool to predict in-hospital death in COVID-19 patients on hospital admission. PLoS ONE 2024, 19, e0309922. [Google Scholar] [CrossRef]


| Mortality from COVID-19 | |||
|---|---|---|---|
| Variable | Yes, N = 25 | No, N = 176 | p-Value 1 |
| Age, p50. (iqr) | 69 (55, 73) | 61 (52, 70) | 0.110 |
| Sex, n (%) | 0.102 | ||
| Male | 8 (32%) | 87 (49%) | |
| Female | 17 (68%) | 89 (51%) | |
| Origin, n (%) | 0.999 | ||
| Rural | 4 (16%) | 31 (18%) | |
| Urban | 21 (84%) | 145 (82%) | |
| Obesity, n (%) | 0.601 | ||
| Yes | 10 (40%) | 61 (35%) | |
| No | 15 (60%) | 115 (65%) | |
| Cardiovascular disease, n (%) | 0.546 | ||
| Yes | 5 (20%) | 25 (14%) | |
| No | 20 (80%) | 151 (86%) | |
| High blood pressure, n (%) | 0.266 | ||
| Yes | 17 (68%) | 99 (56%) | |
| No | 8 (32%) | 77 (44%) | |
| Type 2 diabetes, n (%) | 0.304 | ||
| Yes | 11 (44%) | 59 (34%) | |
| No | 14 (56%) | 117 (66%) | |
| Admission to Critical Patient Unit, n (%) | 0.017 | ||
| Yes | 19 (76%) | 89 (51%) | |
| No | 6 (24%) | 87 (49%) | |
| Severity, n (%) | 0.001 | ||
| Moderate | 0 (0%) | 103 (59%) | |
| Severe | 25 (0%) | 73 (41%) | |
| Oxygen saturation | 93 (86, 94) | 95 (92, 96) | 0.004 |
| Respiratory rate | 22 (19, 28) | 25 (22, 30) | 0.07 |
| WBC (109/L), p50. (iqr) | 7.3 (5.8, 10.8) | 7.3 (6.0, 9.7) | 0.955 |
| NLR, p50. (iqr) | 6 (2, 13) | 5 (3, 9) | 0.859 |
| PLR, p50. (iqr) | 169 (108, 361) | 201 (135, 316) | 0.741 |
| Neutrophils (109/L), p50. (iqr) | 6.23 (4.20, 9.33) | 5.75 (4.14, 7.78) | 0.857 |
| D-Dimer (μg/mL), p50. (iqr) | 2.11 (1.39, 5.64) | 1.03 (0.66, 1.77) | <0.001 |
| CRP (μg/L) | 81 (100) | 129 (138) | <0.001 |
| Ferritin (ng/L) | 1.000 (1.647) | 1.148 (1.353) | 0.92 |
| Lactate dehydrogenase (UI/L) | 296 (155) | 402.5 (136.5) | 0.048 |
| Model 1 | Model 2 | Model 3 | Model 4 | Model 5 | Model 6 | |||||||||||||
|---|---|---|---|---|---|---|---|---|---|---|---|---|---|---|---|---|---|---|
| Characteristic | HR 1 | 95% CI 1 | p-Value | HR 1 | 95% CI 1 | p-Value | HR 1 | 95% CI 1 | p-Value | HR 1 | 95% CI 1 | p-Value | HR 1 | 95% CI 1 | p-Value | HR 1 | 95% CI 1 | p-Value |
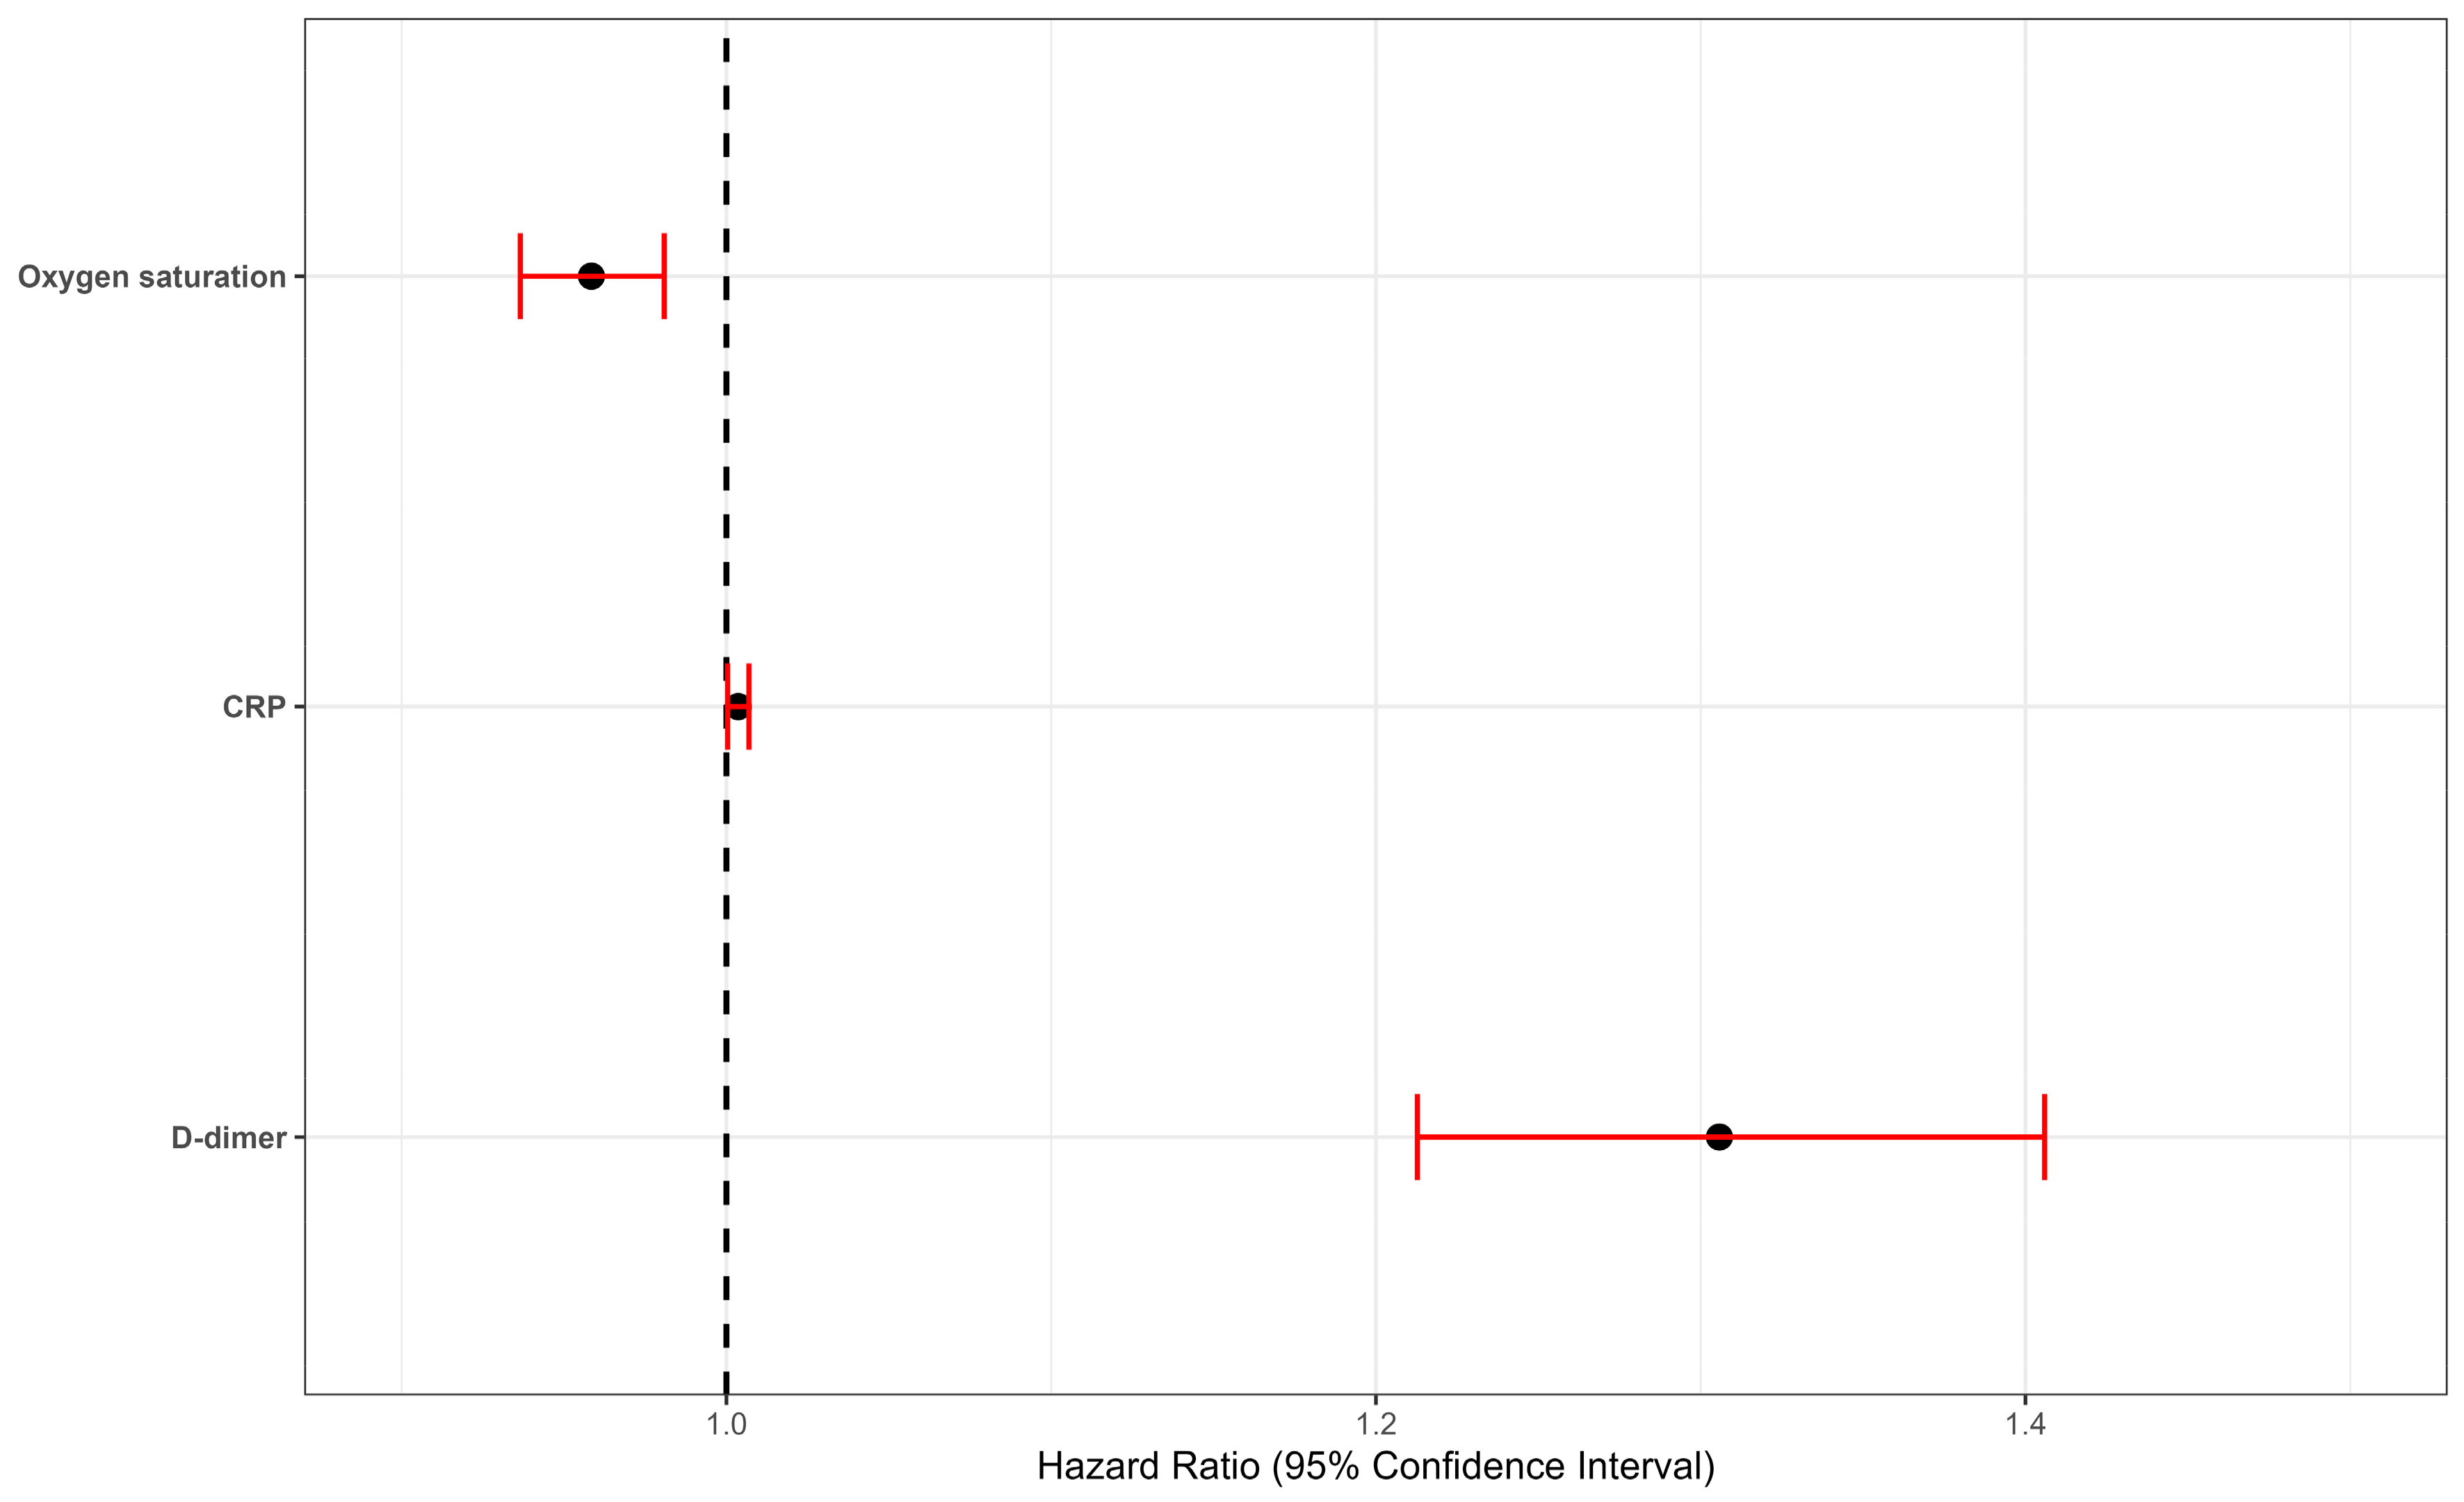
| D-dimer | 1.29 | 1.21, 1.38 | <0.001 | 1.30 | 1.21, 1.40 | <0.001 | 1.31 | 1.21, 1.41 | <0.001 | 1.37 | 1.24, 1.52 | <0.001 | 1.37 | 1.23, 1.53 | <0.001 | 1.36 | 1.23, 1.53 | <0.001 |
| CRP | 1.00 | 1.00, 1.01 | 0.003 | 1.00 | 1.00, 1.01 | 0.003 | 1.01 | 1.00, 1.01 | 0.002 | 1.01 | 1.00, 1.01 | 0.03 | 1.01 | 1.00, 1.01 | 0.03 | |||
| PLR | 1.00 | 1.00, 1.01 | 0.4 | 1.00 | 1.00, 1.00 | 0.4 | 1.00 | 1.00, 1.01 | 0.4 | |||||||||
| NLR | 0.97 | 0.88, 1.08 | 0.6 | 0.97 | 0.87, 1.08 | 0.6 | 1.00 | 0.87, 1.10 | 0.6 | |||||||||
| Ferritin | 1.00 | 1.00, 1.00 | 0.20 | 1.00 | 1.00, 1.00 | 0.2 | 1.00 | 1.00, 1.00 | 0.2 | |||||||||
| Oxigen saturation | 0.96 | 0.94, 0.98 | <0.001 | 0.95 | 0.90, 0.99 | 0.04 | 0.95 | 0.90, 0.99 | 0.04 | 0.95 | 0.91, 0.99 | 0.02 | ||||||
| Respiratory rate | 1.01 | 0.97, 1.07 | 0.64 | 1.01 | 0.96, 1.07 | 0.68 | 1.02 | 0.97, 1.08 | 0.4 | |||||||||
| Age | 1.01 | 0.97, 1.05 | 0.7 | 1.01 | 0.96, 1.06 | 0.8 | ||||||||||||
| Sex | ||||||||||||||||||
| Male | — | — | — | — | ||||||||||||||
| Female | 0.81 | 0.29, 2.24 | 0.7 | 0.65 | 0.23, 1.86 | 0.4 | ||||||||||||
| High Blood Pressure | ||||||||||||||||||
| Yes | 1.10 | 0.25; 3.32 | 0.9 | |||||||||||||||
| No | — | — | ||||||||||||||||
| Diabetes Mellitus type 2 | ||||||||||||||||||
| Yes | 1.70 | 0.24; 1.43 | 0.3 | |||||||||||||||
| No | — | — | ||||||||||||||||
| Stroke | ||||||||||||||||||
| Yes | 3.65 | 0.02; 4.00 | 0.4 | |||||||||||||||
| No | — | — | ||||||||||||||||
| AICc | 236.10 | 232.0 | 229.1 | 231.9 | 235.8 | 239.8 | ||||||||||||
| Concordance Index (standard error) | 0.75 (0.05) | 0.79 (0.05) | 0.83 (0.04) | 0.83 (0.05) | 0.83 (0.05) | 0.83 (0.05) | ||||||||||||
| Time | h0(t) * |
|---|---|
| 0.125 (3–4 days) | 0.02 |
| 0.25 (7–8 days) | 0.03 |
| 0.5 (15 days) | 0.04 |
| 1 month | 0.07 |
| 2 months | 0.09 |
| 3 months | 0.09 |
| Probability Threshold | Time (Months) | Treat All | Treat None | Cox Model |
|---|---|---|---|---|
| 0.05 | 0.125 | −0.0264 | 0 | 0.0065 |
| 0.05 | 0.5 | −0.0264 | 0 | 0.0061 |
| 0.05 | 1 | 0.0537 | 0 | 0.0721 |
| 0.05 | 2 | 0.0755 | 0 | 0.0855 |
| 0.05 | 3 | 0.0755 | 0 | 0.0855 |
| 0.1 | 0.125 | −0.0835 | 0 | 0.0072 |
| 0.1 | 0.5 | −0.0835 | 0 | 0.0072 |
| 0.1 | 1 | −0.0835 | 0 | 0.0412 |
| 0.1 | 2 | −0.0978 | 0 | 0.0334 |
| 0.1 | 3 | −0.0978 | 0 | 0.0334 |
| 0.2 | 0.125 | −0.2189 | 0 | NA |
| 0.2 | 0.5 | −0.2189 | 0 | NA |
| 0.2 | 1 | −0.1237 | 0 | 0.0139 |
| 0.2 | 2 | −0.1237 | 0 | 0.0334 |
| 0.2 | 3 | −0.1237 | 0 | 0.0334 |
| 0.3 | 0.125 | −0.393 | 0 | NA |
| 0.3 | 0.5 | −0.434 | 0 | NA |
| 0.3 | 1 | −0.3028 | 0 | 0.0058 |
| 0.3 | 2 | −0.3028 | 0 | 0.027 |
| 0.3 | 3 | −0.3028 | 0 | 0.027 |
| 0.4 | 0.125 | −0.5728 | 0 | NA |
| 0.4 | 0.5 | −0.5728 | 0 | NA |
| 0.4 | 1 | −0.4302 | 0 | 0.0081 |
| 0.4 | 2 | −0.4302 | 0 | 0.031 |
| 0.4 | 3 | −0.4302 | 0 | 0.031 |
| 0.5 | 0.125 | −0.9502 | 0 | NA |
| 0.5 | 0.5 | −0.9502 | 0 | NA |
| 0.5 | 1 | −0.7979 | 0 | 0.0199 |
| 0.5 | 2 | −0.7979 | 0 | 0.027 |
| 0.5 | 3 | −0.7979 | 0 | 0.027 |
Disclaimer/Publisher’s Note: The statements, opinions and data contained in all publications are solely those of the individual author(s) and contributor(s) and not of MDPI and/or the editor(s). MDPI and/or the editor(s) disclaim responsibility for any injury to people or property resulting from any ideas, methods, instructions or products referred to in the content. |
© 2024 by the authors. Licensee MDPI, Basel, Switzerland. This article is an open access article distributed under the terms and conditions of the Creative Commons Attribution (CC BY) license (https://creativecommons.org/licenses/by/4.0/).
Share and Cite
Guzmán, N.; Letelier, P.; Morales, C.; Alarcón, L.; Delgado, H.; San Martín, A.; Garcés, P.; Barahona, C.; Huenchulao, P.; Morales, F.; et al. Development of a Model for Predicting Mortality Among Patients Hospitalized with COVID-19 During Their Stay in a Clinical Centre. J. Clin. Med. 2024, 13, 7300. https://doi.org/10.3390/jcm13237300
Guzmán N, Letelier P, Morales C, Alarcón L, Delgado H, San Martín A, Garcés P, Barahona C, Huenchulao P, Morales F, et al. Development of a Model for Predicting Mortality Among Patients Hospitalized with COVID-19 During Their Stay in a Clinical Centre. Journal of Clinical Medicine. 2024; 13(23):7300. https://doi.org/10.3390/jcm13237300
Chicago/Turabian StyleGuzmán, Neftalí, Pablo Letelier, Camilo Morales, Luis Alarcón, Hugo Delgado, Andrés San Martín, Paola Garcés, Claudia Barahona, Pedro Huenchulao, Felipe Morales, and et al. 2024. "Development of a Model for Predicting Mortality Among Patients Hospitalized with COVID-19 During Their Stay in a Clinical Centre" Journal of Clinical Medicine 13, no. 23: 7300. https://doi.org/10.3390/jcm13237300
APA StyleGuzmán, N., Letelier, P., Morales, C., Alarcón, L., Delgado, H., San Martín, A., Garcés, P., Barahona, C., Huenchulao, P., Morales, F., Rojas, E., Guzmán-Oyarzo, D., & Boguen, R. (2024). Development of a Model for Predicting Mortality Among Patients Hospitalized with COVID-19 During Their Stay in a Clinical Centre. Journal of Clinical Medicine, 13(23), 7300. https://doi.org/10.3390/jcm13237300