1. Introduction
The first medical guideline (GL) may have been written by Hippocrates [
1]. In the modern age, in 1992, the Institute of Medicine reported a GL to help physicians and patients make decisions in particular disease conditions [
2]. Since then, numerous GLs have been published. Indeed, currently, medical societies publish several GLs to help medical professionals make decisions in specific health conditions. The advice provided by these GLs significantly aids in making clinical decisions regarding the diagnosis and treatment of various diseases [
3,
4].
GLs are based on the Classes of Recommendations (CLASS) and Levels of Evidence (LEVEL). There are no systematic methods to measure the helpfulness or quality of GLs, i.e., how much help they provide [
5,
6]. Over the past decade, several studies have pointed out that only a small percentage (<15%) of the recommendations in clinical practice GLs for the management of cardiovascular diseases are based on Level A evidence [
7,
8,
9,
10,
11], i.e., there is a lack of the highest level of evidence from multiple randomized clinical trials and meta-analyses. Moreover, some of these studies have revealed a consistent time trend or slight improvements in this level of evidence over almost a decade [
7,
9,
10,
11]. There is a need to further develop methods to assess GLs, which can be improved by including implementation advice and translating evidence into recommendations [
12,
13].
Thus, it is important to develop a simple mathematical analysis to objectively assess the help provided by GLs in making informed decisions in various health conditions. We hypothesized that a simple mathematical analysis of ‘Recommendations’ and ‘Evidence’ would suffice. To test this hypothesis, we performed a mathematical analysis of the ‘2020 European Society of Cardiology Guidelines on Sports Cardiology and Exercise in Patients with Cardiovascular Disease Guideline’ (SCE-guideline) [
14].
2. Materials and Methods
In the present study, no patient data were included. The SCE-guideline was analysed based on the frequency of the Classes of Recommendations (CLASS) and the Levels of Evidence (LEVEL) in the SCE-guideline. The recommendations have three classes: I (is recommended or is indicated), IIa,b (should or may be considered), and III (is not recommended). The evidence has three LEVELs: A (multiple randomized clinical trials, meta-analyses), B (single randomized clinical trials, large non-randomized studies), and C (opinion of experts, small studies, retrospective studies, registries).
We examined (1) recommendations in the entire SCE-guideline and the two main parts of the SCE-guideline, which are (2) recommendations in ‘individuals with cardiovascular risk factors and ageing’ (RFA), and (3) in ‘clinical settings’ (CS), in line with the structure of the SCE-guideline. For the number of recommendations in SCE-guideline with the Classes of Recommendations and the Levels of Evidence, see
Supplementary Table S1.
Data Analysis
The mathematical analysis of the SCE-guideline was based on our previous study [
15], which was further extended by introducing the certainty index. Descriptive statistics were used to summarise the frequency of CLASS and LEVEL. Frequency distributions of LEVEL by CLASS were applied to examine the differences between Evidence A, B, and C on CLASS. To define certainty and uncertainty, Classes of Recommendations were collapsed into two categories: (1) uncertainty (‘should or may do’) and (2) certainty (‘to do or not to do’). Subsequently, we calculated LEVEL areas under CLASS using the trapezoid area formula:
, where ‘
a’ and ‘
b’ represent the bases (parallel sides) and ‘
h’ is the height of the trapezoid. Finally, we formulated an index of certainty/uncertainty (ranging from −1 to +1; a value of −1 implies 100% uncertainty, a value of +1 implies 100% certainty, and a value of 0 denotes fifty–fifty certainty and uncertainty (
Figure 1). Data analyses were conducted using Excel 2016 (v16.0) and IBM SPSS Statistics for Windows, Version 25.0 (IBM Corp. Released 2017. Armonk, NY, USA: IBM Corp.).
3. Results
A total of 159 CLASS and LEVEL data points were examined in the SCE-guideline, and the two main parts of the SCE-guideline were ‘individuals with cardiovascular risk factors and older adults’ (RFA) (n = 17) and ‘clinical settings’ (CS) (n = 142).
3.1. Frequency Distribution of CLASS and LEVEL in the SCE-Guideline
3.1.1. Classes of Recommendations (CLASS I, IIa, IIb, III)
The frequency of CLASS I (recommended/indicated) and CLASS III (not recommended) was relatively high in both the SCE-guideline (52.2%) and the CS part (50.7%). The RFA part showed the highest percentage in these Classes of Recommendations (64.7%). This indicated that the percentages for the ‘intermediate’ categories (should do—CLASS IIa; may do—CLASS IIb) were also relatively high (ranging from 35.3% to 49.3%), indicating a slightly low strength of the recommendations (
Table 1).
3.1.2. Levels of Evidence (Evidence A, B, C)
The percentage of Evidence A was below 50% for the RFA part (35.3%), and it was below 10% in the SCE-guideline (7.6%) as well as in the CS part (4.2%). We found that Evidence C was the most frequent (41.2–83.8%), indicating only relatively low quality of the scientific evidence in the SCE-guideline (
Table 1).
3.2. Frequency Distribution of LEVEL by CLASS in the SCE-Guideline
In the SCE-guideline, based on the frequency distribution of LEVEL by CLASS, the percentage of Evidence A was low in each Class of Recommendations. The percentage of Evidence A was only 21.2% in ‘to do’ Class I. The RFA part showed the highest percentage of Evidence A in ‘to do’ Class I (66.7%). In contrast, in the CS part, the percentage of Evidence C was the highest in each class of recommendations (60.5–100%) (
Figure 2).
3.3. Certainty Index in the SCE-Guideline
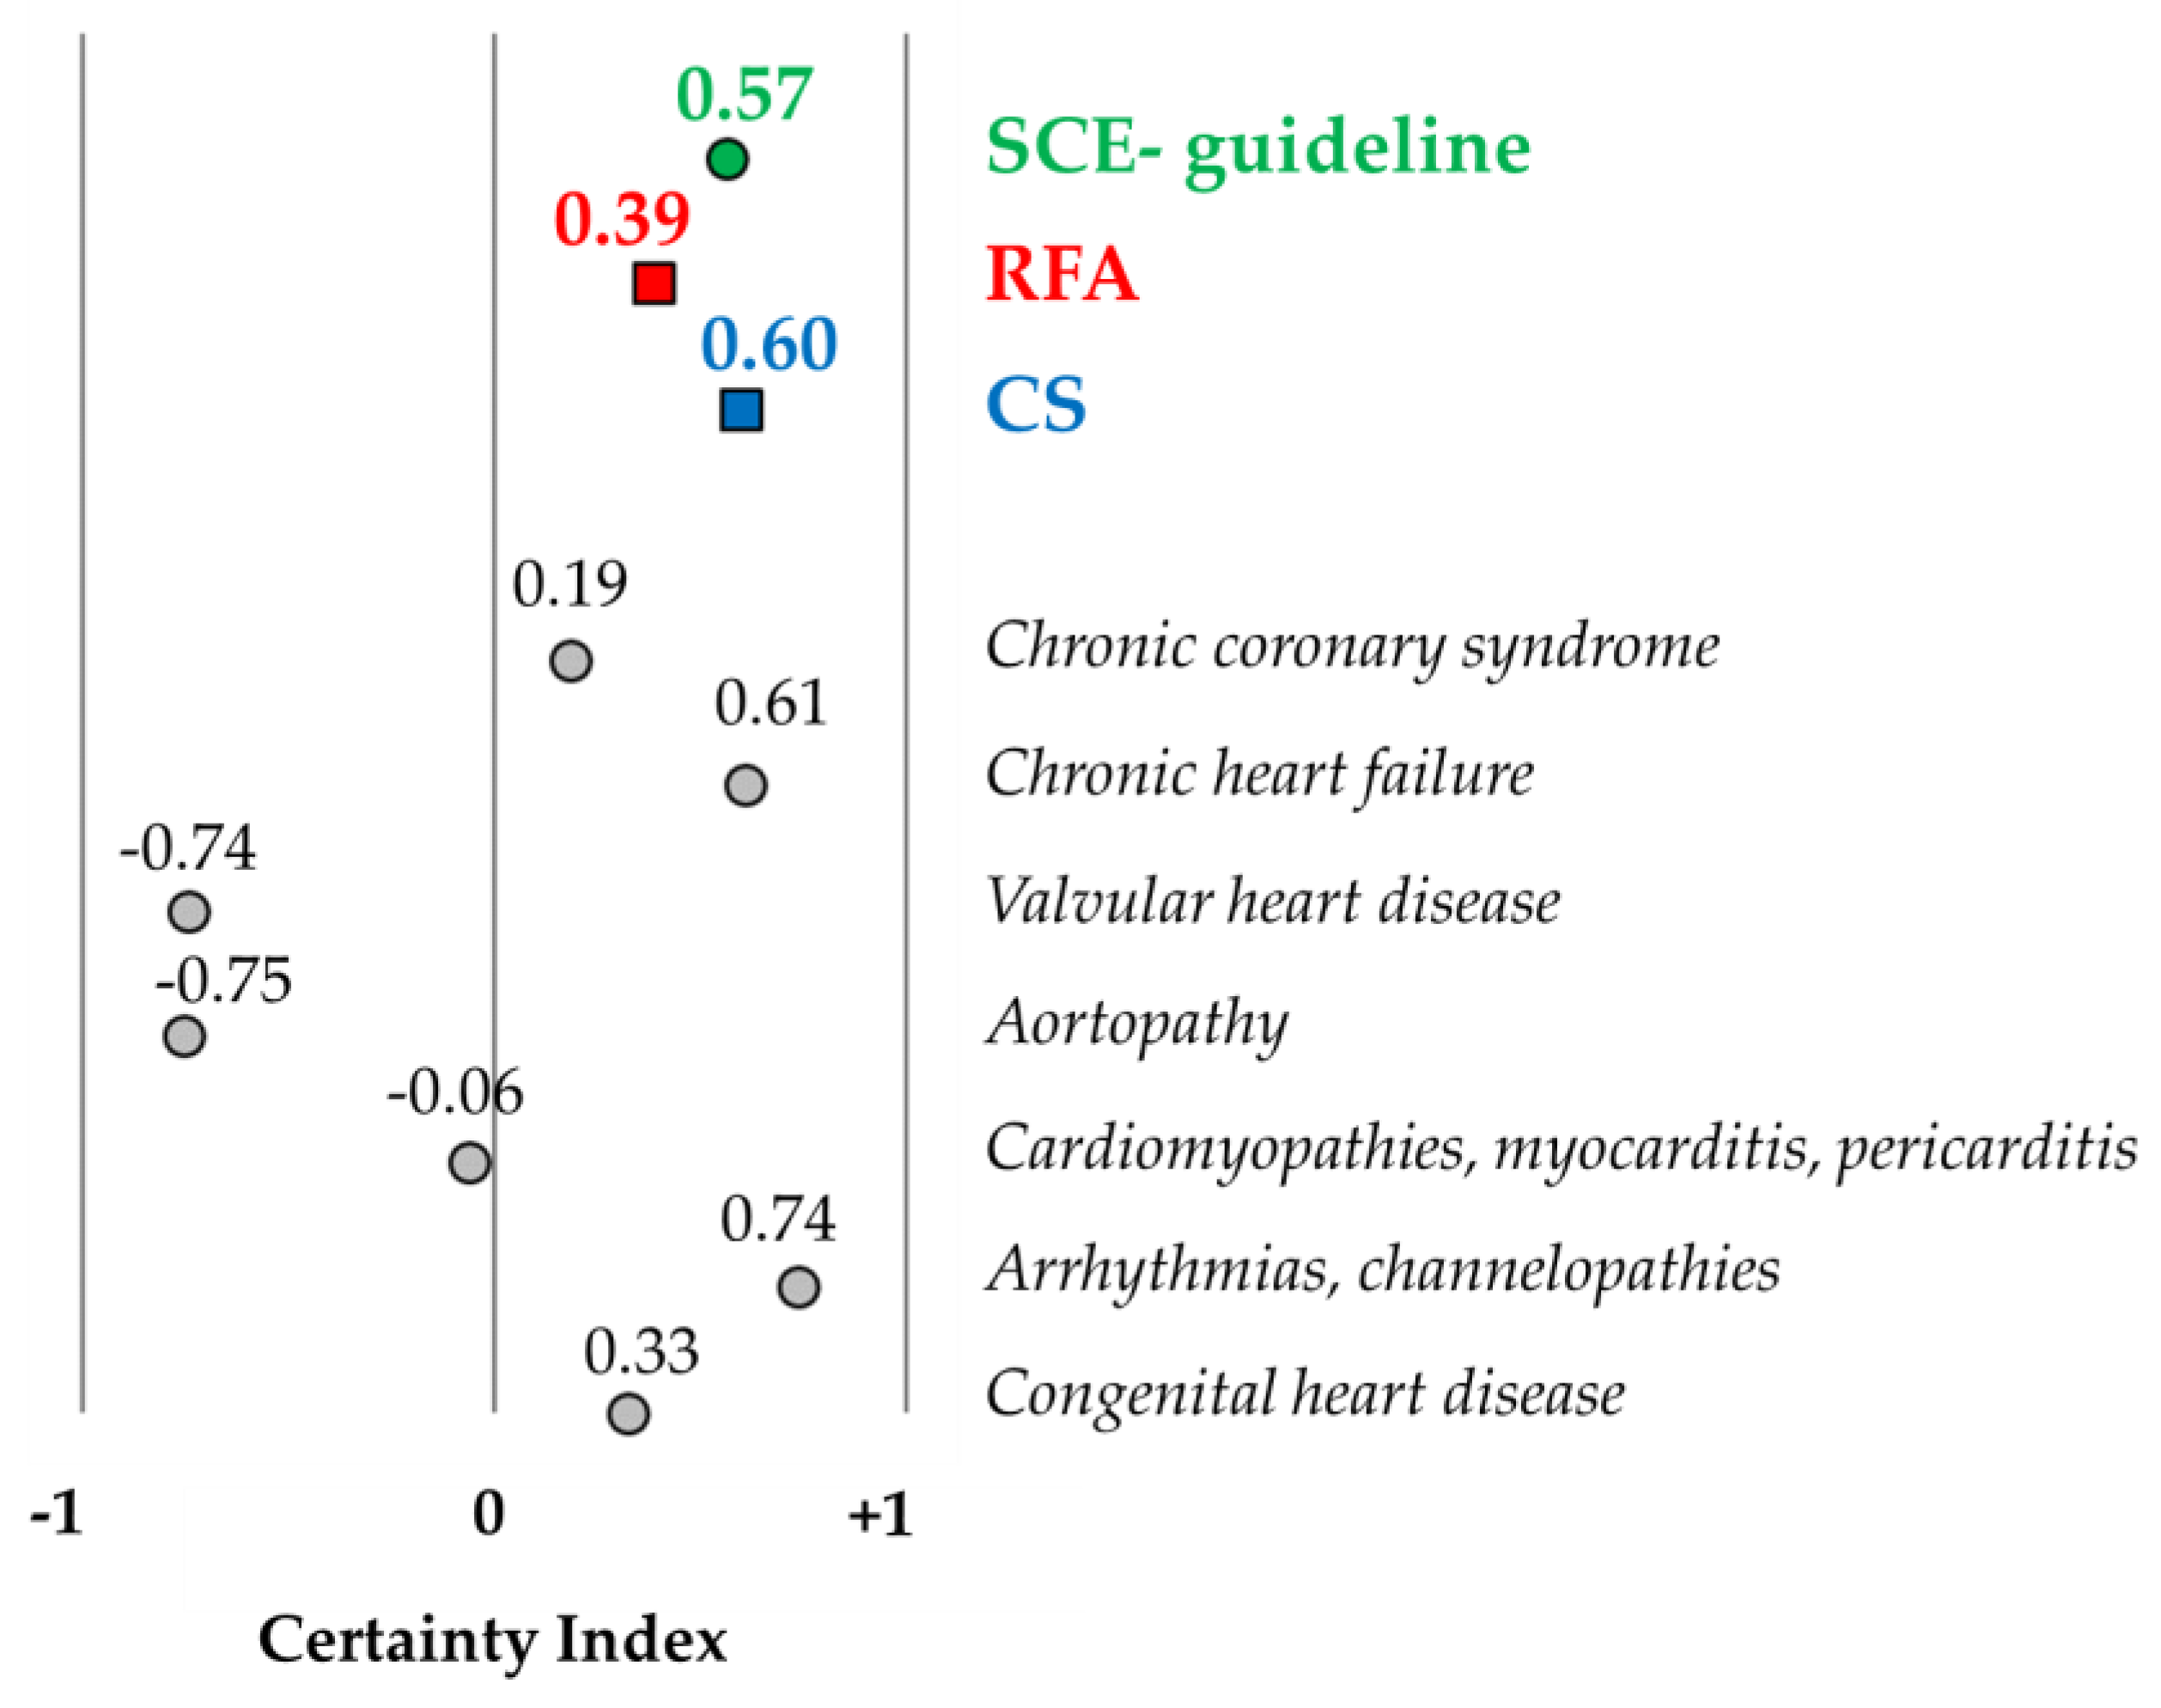
The certainty indexes were 0.57 and 0.60 in the SCE-guideline and CS part, respectively, indicating a relatively high rate of certainty. The value was much lower for the RFA part (CI: 0.39). The certainty index is depicted in
Figure 3 in the SCE-guideline and the two main parts (RFA and CS), as well as for patients with specific cardiovascular diseases, who are included in the RFA part.
4. Discussion
The present study introduced a mathematical analysis to objectively assess the effectiveness (helpfulness) of GLs, which will facilitate the comparison and future developments of GLs. Overall, the analysis revealed that the SCE-guideline provides helpful recommendations regarding exercise/sports activities on CVD, while the supporting evidence, in most cases, is of lower quality.
In the present study, no opinions were given regarding the scientific content of the SCE-guideline. At the same time, the findings presented here can be compared with those revealed by our previous analytic study on several GLs, which showed that various GLs provide different strengths of recommendations and different qualities of evidence [
15]. The higher levels of scientific evidence and/or the clinical significance of lower scientific evidence may be increased by conducting new basic science through experimental and clinical studies based on the revealed gaps in the GLs; hence, helpfulness and quality may be increased in clinical decision making. Thus, the introduced mathematical analysis can also be used to compare the helpfulness and quality of GLs between different subfields within the same medical field or across broader medical areas, such as cardiology, neurology, etc.
The SCE-guideline presented ‘strong’ recommendations, albeit primarily supported by lower-quality evidence. In various disease conditions, both the strength of recommendations and the levels of evidence varied. Previous studies have evaluated GLs by examining the frequencies of Classes of Recommendations and/or Levels of Evidence, either independently or dependently between each other, without providing meaningful explanations for these findings [
7,
8,
9,
10,
11]. Assessing the helpfulness and quality of GLs using certainty/uncertainty (certainty index) may be more practical, as it can identify specific areas within GLs that require improvement and promote future enhancements.
4.1. The Certainty Index
To better elucidate the helpfulness and quality of GLs in terms of certainty and uncertainty rates, we introduced the certainty index (CI), which ranges from −1 to +1. This allows for the comparison of various GLs and the identification of specific areas that require investigation in future studies. It is also recommended to assess the certainty index concerning the type and actions of recommendations [
16]. An important consideration is that it is difficult to include all risk factors (such as obesity, dyslipidaemia, hypertension, diabetes, etc.) and different pathomechanisms within a single GL. Additionally, assigning specific values for the type, intensity, duration, and frequency of exercise as well as various cardiovascular conditions is complex. Achievable, inter-individual differences such as age, gender, or co-morbidities [
17,
18] hinder the grouping of patients into specific categories.
4.2. Bias in GLs Such as Sex, Age, and Other Factors
It is important to recognize that personalized exercise and sports therapy recommendations can be challenging due to various factors. For instance, previous trials have often included a limited number of women, despite recognized sex-related differences in cardiovascular disease mechanisms, presentations, diagnosis, and treatment [
19]. Consequently, the sex-specific response to exercise and therapeutic use of exercise modalities remain incompletely understood [
20,
21,
22]. Moreover, age-related variations in cardiovascular parameters are often based on idealized young male models rather than solid evidence, given the underrepresentation of older patients and a higher number of ‘best case scenarios’ in RCTs [
23]. In addition, in conditions with diagnostic grey areas, such as heart failure [
24] or extreme environmental conditions like high altitude [
25] or temperature changes, assigning personalized exercise regimens is challenging.
In general, it is known that decisions have some bias, as has been revealed by human experimental studies [
26] showing that cognitive bias always occurs in decision making. Therefore, cognitive bias must also be considered in the preparation of GLs, as the authors may have varying levels of scientific expertise and clinical experience, potentially leading to unrecognized conflicts of interest.
4.3. Future Considerations
Due to methodological and ethical constraints, Evidence A cannot always be provided in human studies. Therefore, it may be suggested that the certainty of a GL cannot be or should not be increased by only Evidence A, but lower-quality evidence can be accepted as sufficient in certain cases. Thus, in such cases, it may be advisable to give greater weight to lower-quality evidence, thereby avoiding the limitations of rigid classifications based on dichotomized or categorised systems such as the GRADE framework, AAP, or ESC Guidelines Classifications Scheme in the current guideline [
27,
28,
29].
While various methods have been proposed for grading recommendation strength, developers generally agree that determining the strength of action differs from rating the overall quality of evidence. One can argue that high-quality evidence (such as grade A) does not always warrant strong recommendations. Conversely, recommendations, including strong ones, may be feasible even with lower-quality evidence (such as grades B, C, or X) [
30]. The primary factor modifying this is the benefit–harm assessment, as defined in the preceding section on action statement profiles.
The method for determining the strength of recommendations developed by the American Academy of Paediatrics (AAP) is simple, transparent, and clinically relevant [
27]. Similar to the GRADE approach [
20], it considers the aggregate evidence level and benefit-harm assessment as primary rating determinants. However, GRADE offers only two levels of action strength (‘strong recommendation’ and ‘weak recommendation’), whereas AAP provides three levels (‘strong recommendation’, ‘recommendation’, and ‘option’). Empirical experience in developing GLs suggests that three levels support more flexible decision making and are better accepted by clinicians [
31].
4.4. Limitations of the Study
There are potential limitations in this analytic study. There are inherent ‘potential limitations and harms of guidelines’ [
12], such as the fact that the recommendations may be wrong for a group of or at least one individual patient, and errors which were carried forward into our analysis. Finally, it is important to note that no prior analytic research of this kind on the GLs existed. Therefore, it is likely that the methodology applied in the current study will be refined and improved in future research.
It is of note that a high-quality, evidence-based guideline does not necessarily guarantee that the recommendations will be applied in healthcare practice [
32,
33]. Various factors can act as major barriers to GL adherence, including the complexity of GLs, a high number of ‘should be/may be’ recommendations, and time constraints due to clinical responsibilities [
34,
35,
36]. Recommendations can be either strong or conditional; however, it is important to highlight the meaning of conditional recommendations. The intended meaning is that most patients/physicians would choose the recommended action, but a substantial number of patients/physicians would not [
37]. Implementation science could significantly contribute to the development of clinical practice GLs, particularly in promoting adherence to recommendations lacking high-level evidence [
38].
5. Conclusions
The 2020 ESC SCE-guidelines provides substantial help in decision making through the recommendations (CLASS), while the supporting evidence (LEVEL), in most cases, is of lower quality. This is what the newly introduced certainty index showed. Our analysis provides a tool for ‘quality control’ with the newly introduced certainty index, and by identifying specific areas within a certain GL, it can promote the future improvement of GLs. The newly developed mathematical analysis can be used as a Guideline for Guidelines, facilitating the assessment and comparison of the helpfulness and quality of GLs.
Supplementary Materials
The following supporting information can be downloaded at:
https://www.mdpi.com/article/10.3390/jcm13133783/s1, Table S1: The number of Classes of Recommendations and Levels of Evidence in the ‘2020 European Society of Cardiology Guidelines on Sports Cardiology and Exercise in Patients with Cardiovascular Disease Guideline’ (SCE-guideline), and in the two main parts of the SCE-guideline: ‘in individuals with cardiovascular risk factors and ageing’ (RFA) and ‘in clinical settings’ (CS).
Author Contributions
Conceptualization, A.K. and J.T.; methodology, J.T.; formal analysis, A.K.; writing—original draft preparation, J.T.; writing—review and editing, A.K.; visualization, A.K. and J.T.; supervision, A.K. All authors have read and agreed to the published version of the manuscript.
Funding
This research was funded by the Ministry for Innovation and Technology Hungary, National Research, Development and Innovation Fund, TKP2020-NKA-17 (AK), TKP2021-EGA-37 (AK), TKP2021-EGA-25 (JT), OTKA K 132596 (AK); Hungarian Academy of Sciences Post-Covid 2021-34 (AK and JT), New National Excellence Program of the Ministry for Innovation and Technology from the source of the National Research, Development and Innovation Fund, ÚNKP-23-4-II-SE-30 (JT).
Institutional Review Board Statement
Not applicable.
Informed Consent Statement
Not applicable.
Data Availability Statement
The datasets used during the current study are available from the corresponding author upon reasonable request.
Conflicts of Interest
The authors declare no conflicts of interest. The funders had no role in the design of the study; in the collection, analyses, or interpretation of data; in the writing of the manuscript; or in the decision to publish the results.
References
- Kleisiaris, C.F.; Sfakianakis, C.; Papathanasiou, I.V. Health care practices in ancient Greece: The Hippocratic ideal. J. Med. Ethics Hist. Med. 2014, 7, 6. [Google Scholar] [PubMed]
- Institute of Medicine (US) Committee on Clinical Practice Guidelines. Guidelines for Clinical Practice: From Development to Use; Field, M.J., Lohr, K.N., Eds.; National Academies Press: Washington, DC, USA, 1992. [Google Scholar]
- Gajraj, E.; Osipenko, L. Chapter 12—Clinical Guidelines for Decision-Making. In Pharmacy Education, Practice and Research; Dixon, T., Ed.; Elsevier: New York, NY, USA, 2019; pp. 177–190. [Google Scholar] [CrossRef]
- Yi, T.W.; Donnellan, S.; Levin, A. Evidence-Based Decision Making 4: Clinical Practice Guidelines. In Clinical Epidemiology. Methods in Molecular Biology; Parfrey, P.S., Barrett, B.J., Eds.; Humana: New York, NY, USA, 2021. [Google Scholar] [CrossRef]
- Brouwers, M.C.; Spithoff, K.; Kerkvliet, K.; Alonso-Coello, P.; Burgers, J.; Cluzeau, F.; Férvers, B.; Graham, I.; Grimshaw, J.; Hanna, S.; et al. Development and Validation of a Tool to Assess the Quality of Clinical Practice Guideline Recommendations. JAMA Netw. Open 2020, 3, e205535. [Google Scholar] [CrossRef] [PubMed]
- Moleman, M.; Jerak-Zuiderent, S.; van de Bovenkamp, H.; Bal, R.; Zuiderent-Jerak, T. Evidence-basing for quality improvement; bringing clinical practice guidelines closer to their promise of improving care practices. J. Eval. Clin. Pract. 2022, 28, 1003–1026. [Google Scholar] [CrossRef] [PubMed]
- Tricoci, P.; Allen, J.M.; Kramer, J.M.; Califf, R.M.; Smith, S.C., Jr. Scientific evidence underlying the ACC/AHA clinical practice guidelines. JAMA 2009, 301, 831–841. [Google Scholar] [CrossRef] [PubMed]
- Bevan, G.H.; Kalra, A.; Josephson, R.A.; Al-Kindi, S.G. Level of Scientific Evidence Underlying the Current American College of Cardiology/American Heart Association Clinical Practice Guidelines. Circ. Cardiovasc. Qual. Outcomes 2019, 12, e005293. [Google Scholar] [CrossRef] [PubMed]
- Bonow, R.O.; Braunwald, E. The Evidence Supporting Cardiovascular Guidelines: Is There Evidence of Progress in the Last Decade? JAMA 2019, 321, 1053–1054. [Google Scholar] [CrossRef]
- Caldeira, D.; Marques, A.; Almeida, J.; Rodrigues, T.; Alves, M.; David, C.; Gonçalves, N.; Costa, J.; Ferreira, J.J.; Pinto, F.J. Recommendations and levels of evidence in the guidelines of the European Society of Cardiology: Current scenario and time trends. Eur. Heart J. Cardiovasc. Pharmacother. 2020, 6, 122–124. [Google Scholar] [CrossRef] [PubMed]
- Fanaroff, A.C.; Califf, R.M.; Windecker, S.; Smith, S.C., Jr.; Lopes, R.D. Levels of Evidence Supporting American College of Cardiology/American Heart Association and European Society of Cardiology Guidelines, 2008–2018. JAMA 2019, 321, 1069–1080. [Google Scholar] [CrossRef]
- Woolf, S.H.; Grol, R.; Hutchinson, A.; Eccles, M.; Grimshaw, J. Potential benefits, limitations, and harms of clinical guidelines. BMJ 1999, 318, 527–530. [Google Scholar] [CrossRef]
- Gagliardi, A.R.; Brouwers, M.C. Integrating guideline development and implementation: Analysis of guideline development manual instructions for generating implementation advice. Implement. Sci. 2012, 7, 67. [Google Scholar] [CrossRef]
- Pelliccia, A.; Sharma, S.; Gati, S.; Bäck, M.; Börjesson, M.; Caselli, S.; Collet, J.-P.; Corrado, D.; Drezner, J.A.; Halle, M.; et al. 2020 ESC Guidelines on sports cardiology and exercise in patients with cardiovascular disease. Eur. Heart J. 2021, 42, 17–96, Erratum in Eur. Heart J. 2021, 42, 548–549. [Google Scholar] [CrossRef] [PubMed]
- Koller, A.; Takács, J. Translation of scientific evidence into cardiovascular guidelines. JBI Evid. Implement. 2021, 19, 437–445. [Google Scholar] [CrossRef]
- van Dijk, W.B.; Grobbee, D.E.; de Vries, M.C.; Groenwold, R.H.H.; van der Graaf, R.; Schuit, E. A systematic breakdown of the levels of evidence supporting the European Society of Cardiology guidelines. Eur. J. Prev. Cardiol. 2019, 26, 1944–1952. [Google Scholar] [CrossRef] [PubMed]
- Bouchard, C.; Rankinen, T. Individual differences in response to regular physical activity. Med. Sci. Sports Exerc. 2001, 33, S446–S451. [Google Scholar] [CrossRef] [PubMed]
- Torlasco, C.; D’Silva, A.; Bhuva, A.N.; Faini, A.; Augusto, J.B.; Knott, K.D.; Benedetti, G.; Jones, S.; Zalen, J.V.; Scully, P.; et al. Age matters: Differences in exercise-induced cardiovascular remodelling in young and middle aged healthy sedentary individuals. Eur. J. Prev. Cardiol. 2021, 28, 738–746. [Google Scholar] [CrossRef] [PubMed]
- Xhyheri, B.; Bugiardini, R. Diagnosis and treatment of heart disease: Are women different from men? Prog. Cardiovasc. Dis. 2010, 53, 227–236. [Google Scholar] [CrossRef] [PubMed]
- Bajraktari, G.; Kurtishi, I.; Rexhepaj, N.; Tafarshiku, R.; Ibrahimi, P.; Jashari, F.; Alihajdari, R.; Batalli, A.; Elezi, S.; Henein, M.Y. Gender related predictors of limited exercise capacity in heart failure. Int. J. Cardiol. Heart Vessel 2013, 1, 11–16. [Google Scholar] [CrossRef] [PubMed]
- Witvrouwen, I.; Van Craenenbroeck, E.M.; Abreu, A.; Moholdt, T.; Kränkel, N. Exercise training in women with cardiovascular disease: Differential response and barriers—Review and perspective. Eur. J. Prev. Cardiol. 2019, 19, 2047487319838221. [Google Scholar] [CrossRef] [PubMed]
- Gevaert, A.B.; Adams, V.; Bahls, M.; Bowen, T.S.; Cornelissen, V.; Dörr, M.; Hansen, D.; Kemps, M.H.; Leeson, P.; Van Craenenbroeck, E.M.; et al. Towards a personalised approach in exercise-based cardiovascular rehabilitation: How can translational research help? A ‘call to action’ from the Section on Secondary Prevention and Cardiac Rehabilitation of the European Association of Preventive Cardiology. Eur. J. Prev. Cardiol. 2020, 27, 1369–1385. [Google Scholar] [CrossRef]
- Nguyen, D.; Mika, G.; Ninh, A. Age-based exclusions in clinical trials: A review and new perspectives. Contemp. Clin. Trials 2022, 114, 106683. [Google Scholar] [CrossRef]
- Piepoli, M.F.; Binno, S.; Corrà, U.; Seferovic, P.; Conraads, V.; Jaarsma, T.; Schmid, J.-P.; Filippatos, G.; Ponikowski, P.P.; Committee on Exercise Physiology & Training of the Heart Failure Association of the ESC. ExtraHF survey: The first European survey on implementation of exercise training in heart failure patients. Eur. J. Heart Fail. 2015, 17, 631–638. [Google Scholar] [CrossRef] [PubMed]
- Caravita, S.; Faini, A.; Bilo, G.; Villafuerte, F.C.; Macarlupu, J.L.; Lang, M.; Salvioni, E.; Revera, M.; Giuliano, A.; Gregorini, F.; et al. Blood Pressure Response to Exercise in Hypertensive Subjects Exposed to High Altitude and Treatment Effects. J. Am. Coll. Cardiol. 2015, 66, 2806–2807. [Google Scholar] [CrossRef]
- Croskerry, P. From mindless to mindful practice: Cognitive bias and clinical decision making. N. Eng. J. Med. 2013, 368, 2445–2448. [Google Scholar] [CrossRef] [PubMed]
- AAP Steering Committee on Quality Improvement and Management. Classifying recommendations for clinical practice guidelines. Pediatrics 2004, 114, 874–877. [Google Scholar] [CrossRef] [PubMed]
- Grading or Recommendations, Assessment, Development and Evaluation (GRADE). Available online: https://www.gradeworkinggroup.org (accessed on 16 May 2023).
- Committee for Practice Guidelines (CPG) of the European Society of Cardiology (ESC). Recommendations for Guidelines Production. Available online: https://www.escardio.org/static-file/Escardio/Guidelines/ESC%20Guidelines%20for%20Guidelines%20Update%202010.pdf (accessed on 16 May 2023).
- Guyatt, G.H.; Oxman, A.D.; Vist, G.E.; Kunz, R.; Falck-Ytter, Y.; Alonso-Coello, P.; Schünemann, H.J.; GRADE Working Group. GRADE: An emerging consensus on rating quality of evidence and strength of recommendations. BMJ 2008, 336, 924–926. [Google Scholar] [CrossRef] [PubMed]
- Rosenfeld, R.M.; Shiffman, R.N.; Robertson, P.; Department of Otolaryngology State University of New York Downstate. Clinical Practice Guideline Development Manual, Third Edition: A quality-driven approach for translating evidence into action. Otolaryngol. Head Neck Surg. 2013, 148, S1–S55. [Google Scholar] [CrossRef] [PubMed]
- Pereira, V.C.; Silva, S.N.; Carvalho, V.K.S.; Zanghelini, F.; Barreto, J.O.M. Strategies for the implementation of clinical practice guidelines in public health: An overview of systematic reviews. Health Res. Policy Syst. 2022, 20, 13. [Google Scholar] [CrossRef] [PubMed]
- Powell, B.J.; Waltz, T.J.; Chinman, M.J.; Damschroder, L.J.; Smith, J.L.; Matthieu, M.M.; Proctor, E.K.; Kirchner, J.E. A refined compilation of implementation strategies: Results from the Expert Recommendations for Implementing Change (ERIC) project. Implement. Sci. 2015, 10, 21. [Google Scholar] [CrossRef]
- Qumseya, B.; Goddard, A.; Qumseya, A.; Estores, D.; Draganov, P.V.; Forsmark, C. Barriers to Clinical Practice Guideline Implementation among Physicians: A Physician Survey. Int. J. Gen. Med. 2021, 14, 7591–7598. [Google Scholar] [CrossRef]
- Fasting, A.; Hetlevik, I.; Mjølstad, B.P. Palliative care in general practice; a questionnaire study on the GPs role and guideline implementation in Norway. BMC Fam. Pract. 2021, 22, 64. [Google Scholar] [CrossRef]
- Swaithes, L.; Paskins, Z.; Dziedzic, K.; Finney, A. Factors influencing the implementation of evidence-based guidelines for osteoarthritis in primary care: A systematic review and thematic synthesis. Musculoskelet. Care 2020, 18, 101–110. [Google Scholar] [CrossRef] [PubMed]
- Andrews, J.; Guyatt, G.; Oxman, A.D.; Alderson, P.; Dahm, P.; Falck-Ytter, Y.; Nasser, M.; Meerpohl, J.; Post, P.N.; Kunz, R.; et al. GRADE guidelines: 14. Going from evidence to recommendations: The significance and presentation of recommendations. J. Clin. Epidemiol. 2013, 66, 719–725. [Google Scholar] [CrossRef] [PubMed]
- Sarkies, M.N.; Jones, L.K.; Gidding, S.S.; Watts, G.F. Improving clinical practice guidelines with implementation science. Nat. Rev. Cardiol. 2022, 19, 3–4. [Google Scholar] [CrossRef] [PubMed]
| Disclaimer/Publisher’s Note: The statements, opinions and data contained in all publications are solely those of the individual author(s) and contributor(s) and not of MDPI and/or the editor(s). MDPI and/or the editor(s) disclaim responsibility for any injury to people or property resulting from any ideas, methods, instructions or products referred to in the content. |
© 2024 by the authors. Licensee MDPI, Basel, Switzerland. This article is an open access article distributed under the terms and conditions of the Creative Commons Attribution (CC BY) license (https://creativecommons.org/licenses/by/4.0/).


