Abstract
This study aimed to develop and temporally validate an electronic medical record (EMR)-based insomnia prediction model. In this nested case-control study, we analyzed EMR data from 2011–2018 obtained from a statewide health information exchange. The study sample included 19,843 insomnia cases and 19,843 controls matched by age, sex, and race. Models using different ML techniques were trained to predict insomnia using demographics, diagnosis, and medication order data from two surveillance periods: −1 to −365 days and −180 to −365 days before the first documentation of insomnia. Separate models were also trained with patient data from three time periods (2011–2013, 2011–2015, and 2011–2017). After selecting the best model, predictive performance was evaluated on holdout patients as well as patients from subsequent years to assess the temporal validity of the models. An extreme gradient boosting (XGBoost) model outperformed all other classifiers. XGboost models trained on 2011–2017 data from −1 to −365 and −180 to −365 days before index had AUCs of 0.80 (SD 0.005) and 0.70 (SD 0.006), respectively, on the holdout set. On patients with data from subsequent years, a drop of at most 4% in AUC is observed for all models, even when there is a five-year difference between the collection period of the training and the temporal validation data. The proposed EMR-based prediction models can be used to identify insomnia up to six months before clinical detection. These models may provide an inexpensive, scalable, and longitudinally viable method to screen for individuals at high risk of insomnia.
1. Introduction
Insomnia is a common sleep disorder, with 30 to 40% of American adults experiencing symptoms in a given year [1] and as many as 50% of older adults reporting difficulty with sleep [2]. Insomnia etiologies are numerous and can be linked to biological, psychological, and social factors [3]. The risk of insomnia increases with age and is more common within certain populations, such as those with depression, anxiety, or traumatic brain injury [1]. The consequences of insomnia are significant. Insomnia is associated with diminished quality of life, impaired cognitive, physical, and occupational functioning, and an increased risk of mood disorders [4,5,6,7]. Among the elderly, insomnia has also been linked to falls, dementia, and institutionalization [8,9]. Annual insomnia-related costs are estimated to be 100 billion USD when considering both medical and indirect expenses (e.g., loss of productivity) [5,10].
Several effective insomnia treatments exist. Medications commonly used for insomnia include benzodiazepines, orexin antagonists, sedative-hypnotics, barbiturates, and melatonin agonists, although other classes of medications are sometimes used off-label [11,12]. While effective, pharmacotherapy is typically recommended for short-term use since there is the potential for adverse effects, dependency, and tolerance over time. Cognitive behavioral therapy for insomnia (CBT-I), an adaptation of traditional CBT designed to address sleep difficulties, is typically recommended as the first-line treatment option due to its superior safety profile [13]. However, CBT-I is often less accessible to patients than pharmacotherapy and requires sustained patient engagement for benefits to be realized [14].
Despite its prevalence and the widespread availability of effective therapies, insomnia often remains undetected and untreated; an estimated 70% of patients with insomnia report never discussing sleep with their doctor, and only 5% report scheduling a healthcare visit specifically to discuss their sleep problems [15]. Given the substantial burden of insomnia and the tendency of patients to not seek care, there is a significant opportunity to improve quality of life and reduce costs through better recognition and diagnosis. Identifying patients suffering from insomnia who have not yet received a formal diagnosis from a physician could enable early intervention, potentially reducing disease burden and healthcare utilization.
Several machine learning models have been developed to diagnose and screen for insomnia. These models used primary data from polysomnograms, magnetic resonance imaging, or electroencephalograms and achieved high accuracy [16,17,18,19]. Additionally, one study (Huang 2023) developed machine learning models to identify risk factors for patient-reported insomnia using the National Health and Nutrition Examination Survey (NHANES) data and achieved an AUC of 0.87 with an extreme gradient boosting (XGBoost) framework [20]. However, as these data sources are collected from surveys and expensive, non-routine tests, they are not available at scale for all patients. The widespread availability of electronic medical record (EMR) data offers an opportunity to develop inexpensive, targeted, and scalable processes to identify patients at risk for insomnia using only routine care data collected over a short surveillance period (i.e., 6 months to a year). Despite this potential, very few studies have explored leveraging routine care data from EMR for insomnia prediction; to date, only a single study has been published that developed an EMR-based insomnia prediction model. Kartoun et al. (2018) created an algorithm to identify patients with physician-documented insomnia using structured (i.e., demographics, ICD codes, and prescriptions) and unstructured (medical notes) EMR data [21]. The model achieved an AUC of 0.78 when relying on structured data alone, which increased to 0.83 when augmented with unstructured data from medical notes. The aim of this earlier study was to facilitate the identification of a large insomnia cohort for research purposes. It was limited to two hospitals and only included patients at risk of metabolic syndrome, making it unclear whether the model would generalize to the general adult population. Furthermore, the model was not temporally validated, so its longitudinal viability is unknown. In the present study, we aimed to develop and temporally validate a model that can identify insomnia in the general adult population using multi-institutional EMR data. Our secondary aim was to identify EMR-based predictors of insomnia risk.
2. Materials and Methods
This study was approved by the Indiana University Institutional Review Board (#11732) and adheres to the reporting standards described in the Transparent Reporting of Individual Prognosis or Diagnosis (TRIPOD) guidelines [22].
2.1. Cohort Selection
Study data were obtained from the Indiana Network for Patient Care (INPC). The INPC is one of the largest health information exchanges in the United States and includes EMR data for over 18 million patients across multiple healthcare systems [23]. This was a retrospective nested case-control study where cases were matched to controls by age within one year of the date of birth, sex, and race. Eligible cases were adults (≥18 years) with new insomnia between 1 January 2011 and 31 December 2018, defined as:
- a new insomnia diagnosis code (international classification of diseases, 9th or 10th clinical modification) or
- a new order for any of the following insomnia-specific medications: zolpidem, suvorexant, butabarbital, quazepam, estazolam, flurazepam, triazolam, tasimelteon, eszopiclone, temazepam, ramelteon, secobarbital, zaleplon, chloral hydrate, and melatonin. Antidepressants (e.g., doxepin, trazodone, and mirtazapine) and low-dose antipsychotics (e.g., quetiapine and olanzapine) with hypnotic properties were excluded from the list of medications used to identify insomnia cases because these off-label treatments may not be specific to insomnia.
Patients with insomnia diagnosis codes or medications before 2011 were considered to have prevalent insomnia and were thus ineligible. All patients were required to have at least one encounter with the INPC per year from 2010 to 2018 and have at least one diagnosis and medication record available during that time. Patients missing age, sex, or race information were excluded.
Patients without an insomnia diagnosis or medication were eligible to be selected as controls. Controls were matched to insomnia cases on a 1:1 basis by sex, race, and age within one year of the date of birth. If there was more than one potential control for a given case, a control was selected randomly from the pool of potential matches. In these cases, the index date was defined as the first date of an insomnia diagnosis code or medication. For controls, the index date was defined as the encounter date occurring closest to the matched case’s index date. EMR data from 2010 to 2018 was extracted to ensure that all patients had at least one year of pre-index data. Pre-index demographics, diagnosis, and medication data were processed to develop relevant exposure variables.
2.2. Socio-Demographic Variables
Demographic variables included age at index date, sex, and patient-reported race (categorized as White, Black, Other, and Unknown for analysis purposes). A higher cardinality for race is desirable. Unfortunately, since the data were collected from multiple health care institutions with varying patient race distributions and reporting requirements, there was a trade-off between a higher cardinality for the race variable and the number of patients included in the study. In addition to the above-listed demographic variables, we also considered insurance type, defined as the insurance reported at the visit closest to the index date and categorized as government (Medicare/Medicaid), commercial, self-pay, or other/unknown. The insurance type is a surrogate for the socioeconomic status of the patient, which has been previously reported to influence the risk of insomnia [24].
2.3. Diagnosis Variables
ICD-9-CM/ICD-10-CM diagnosis codes were used to define the 31 disease group variables (binary) that comprise the Elixhauser Comorbidity Index [25,26,27]. Elixhauser mortality scores were also calculated using Van Walravan weights [27]. To represent comorbidity burden, we also derived a new composite variable as the sum of the number of unique (at the 3-digit level) ICD-9-CM/ICD-10-CM codes a patient had during the pre-index period of interest. In total, 33 diagnosis variables were derived.
2.4. Medication Variables
Medication orders were extracted for all patients. Since these orders originated from multiple healthcare institutions, a unified mapping of medication names to a drug taxonomy was unavailable. Instead, each medication was mapped to the Anatomical Therapeutic Chemical (ATC) classification codes [28]. The ATC drug classification system is hierarchical with multiple sub-levels. For this study, the first-level sub-groups of all 14 main ATC groups were included (e.g., A01: stomatological preparations, A02: drugs for acid-related disorders, etc.). For each patient, the number of medication orders associated with a given ATC sub-group was calculated over the surveillance period of interest. This processing led to 98 medication variables.
2.5. Model Development and Evaluation
In total, 135 variables were derived from demographics, diagnosis, and medication order data. One-hot encoding was performed on all categorical variables, and all continuous variables were standardized. Initially, we explored five candidate machine learning models to predict insomnia: logistic regression, support vector machine with the radial basis function kernel, random forest, extreme gradient boosting (XGBoost), and a multilayer neural network. For model selection, data from 2011–2017 (based on patient index date) were randomly split into a training set (80%) and a holdout set (20%) while maintaining 1:1 case/control to avoid class imbalance. Each candidate model was evaluated by calculating the area under the receiver operating characteristic curve (AUC) on the holdout set. XGBoost had the highest AUC out of the five candidates and was therefore selected as the model of choice. A voting ensemble architecture consisting of the top three performing models was also considered but demonstrated no significant (<1%) improvement over the XGBoost model alone.
After deciding on XGBoost, the data were split into three subsets based on patient index date (2011–2013, n = 15,008; 2011–2015, n = 25,372; and 2011–2017, n = 34,850). The purpose of subsetting the data was to create models with different time periods and observe their performance over subsequent time periods. For each of these subsets, we created separate XGBoost models using data derived from the following surveillance periods before the index date: (1) −1 to −365 days before index, and (2) −180 to −365 days before index, thereby allowing for an understanding of how the surveillance period impacts the models’ ability to detect patients at risk for insomnia. Before training, each model’s data were randomly split into a training set (80%) and a holdout set (20%) while again maintaining 1:1 case/control to avoid class imbalance. Hyperparameter tuning was performed using a grid search approach with 5-fold cross-validation. We evaluated the predictive performance of each model on its corresponding holdout set by creating 1000 bootstrapped samples with replacement, calculating the AUC for each sample, and averaging the results. SHapley Additive exPlanation (SHAP) [29] was used to determine which features had the strongest influence on model predictions. Calibration was assessed using calibration curves.
2.6. Temporal Validation
Temporal validation was performed to examine how the models’ performances would change over time. To achieve this, we evaluated each model’s performance on future data, one year at a time, up to 2018. Relatively stable performance over time would indicate that the model is low-maintenance and could potentially be used in production within a healthcare system for several years without requiring retraining. Figure 1 shows the workflow used for model development, internal validation, and temporal validation for the insomnia prediction model trained on patient data from 2011–2017.
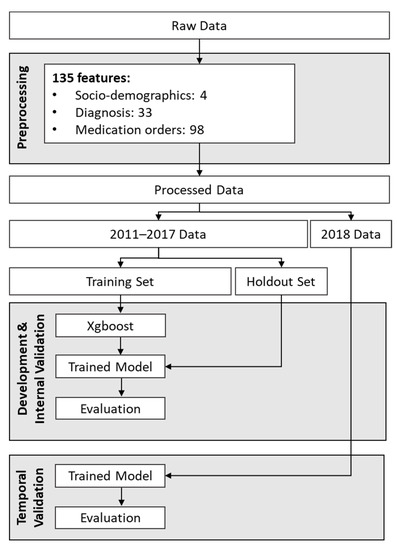
Figure 1.
Workflow for development and temporal validation of the model developed using data from 2011 to 2017.
3. Results
3.1. Study Sample
There were 250,159 adult patients with at least one encounter per year during the study period, 19,834 of whom had a new insomnia ICD-9-CM/ICD-10-CM code or insomnia medication between 2011–2018. Of the identified insomnia cases, 913 were ineligible due to not having any medication or diagnosis data (potentially due to data entry errors), and nine were excluded for missing sex data. The final analysis sample included 39,668 patients (19,834 insomnia cases and 19,834 matched controls, Figure 2). Overall, the cohort was primarily female (70%), white (78%), and publicly insured (44%), with a median age of 59 years (Table 1). The five most common diagnoses in the study sample were hypertension (33%), diabetes (17.1%), hypothyroidism (11%), and chronic pulmonary disease (9%). Compared to controls, insomnia cases had a greater comorbidity burden (Table 2).
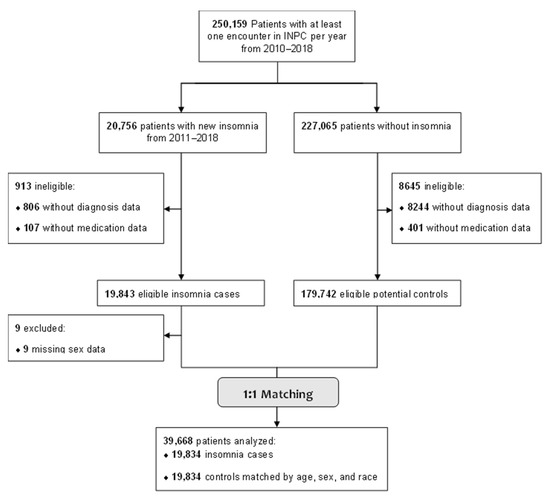
Figure 2.
Flow Diagram for Patient Inclusion in the Insomnia Risk Prediction Model.

Table 1.
Demographic Characteristics for Cases and Controls, Entire Cohort (2011–2018).
Table 2.
Clinical Characteristics for Cases and Controls, Entire Cohort (2011–2018).
For most cases, the first instance of insomnia was defined by an order for an insomnia medication (59.4%) rather than an ICD-9-CM/ICD-10-CM code (40.6%). When considering the entire study period, 9543 (53.3%) cases had an ICD-9-CM/ICD-10-CM documented at some point, and 13,213 (63.5%) cases were prescribed an FDA-approved insomnia medication. Among those who received pharmacotherapy, the most frequently prescribed insomnia-specific medications were zolpidem (61.7%), temazepam (13.5%), triazolam (7.8%), and eszopiclone (7.6%).
3.2. Model Selection
The five candidate classifiers were developed and evaluated using data from 2011–2017 with a surveillance period of −1 to −365 days before the index. The training set consisted of 13,940 cases and 13,940 controls; the holdout set consisted of 3485 cases and 3485 controls. XGBoost produced the highest AUC (0.80) on the holdout set by a narrow margin compared to the neural network and random forest models, which both had AUCs of 0.79. The SVM and logistic regression models performed the worst, with an AUC of 0.74 and 0.68, respectively. A voting ensemble architecture combining the top three models was also evaluated. However, no significant (<1%) improvement was observed over the XGBoost model alone. Therefore, this latter model was retained for further analysis.
3.3. Prediction Models
The holdout set AUCs for models trained on data from 2011–2013 (n = 14,970), 2011–2015 (n = 25,286), and 2011–2017 (n = 34,850) were nearly identical, although models trained on fewer samples tended to have greater variability in performance (Table 3). The models trained on data with a surveillance period of −1 to −365 days before the index had AUCs of approximately 0.80, indicating good predictive performance. Models that used data closer to a patient’s index date performed better than those using data further from the index date; when the surveillance period was limited to −180 to −365 days before the index date, AUCs decreased (range 0.68–0.70, Table 3). The above two surveillance periods correspond to 1-day and 6-month prediction horizons prior to the onset of the disease. For clinical decision support, the earlier the risk prediction, the better. Unfortunately, extending the prediction horizon using a surveillance period of −730 to −365 days prior to the index date (i.e., a one-year prediction horizon) resulted in an inconclusive risk prediction model. We hypothesize that a surveillance period that is closer to the index date is needed for insomnia risk prediction because trigger factors related to medications and comorbid conditions are immediate rather than delayed. This is supported by the most important predictors of the models (Table 4). The number of orders for analgesic medications was the most important predictor for all models with a surveillance period of −1 to −365 days before index. In comparison, insurance was the most important predictor for the models with a surveillance period of −180 to −365 days. The models were well calibrated for both surveillance periods (Figures S1 and S2).
Table 3.
Evaluation and Temporal Validation of XGBoost Insomnia Prediction Models.
Table 4.
Top five Most Important Features in XGBoost models’ predictions by surveillance period.
3.4. Temporal Validation
In general, AUCs were stable over time. For example, the −1 to −365 model trained on the fewest samples (2011–2013) had an AUC of 0.80 when making predictions using holdout patient data within the same period; see Table 3. For patient data one year (2014) and five years (2018) in the future, AUCs of 0.78 and 0.76 are obtained using the same model, respectively. These results indicate a minimal decrease in performance as the patient populations shift over time. Similar results were observed for the 2011–2015 and 2011–2017 models.
4. Discussion
Our results indicate that multivariable prediction models can successfully identify patients at high risk of insomnia using routine EMR data. In our experiments, an XGBoost model trained using a combination of demographics, diagnosis, and medication data captured −1 to −365 days before the index date achieved an average AUC of 0.80 over the holdout dataset and was well calibrated. Furthermore, temporal validation demonstrated that the model’s performance is stable when making predictions up to five years in the future, suggesting that it may require relatively little maintenance once deployed. EMR-based prediction models like those presented in this study have been successfully used to detect prodromal Alzheimer’s disease [30]. To our knowledge, this is the first study to develop and temporally validate an insomnia prediction model using multi-institutional EMR data.
Psychotropic medications (psychoanaleptics and psycholpetics) and analgesic medications were strong predictors of insomnia in the model. The fact that these medication groups correspond to conditions frequently associated with insomnia in the literature, including mood disorders, chronic pain, and gastroesophageal reflux disease, or are known to cause insomnia as a side effect (e.g., stimulants), supports these models being clinically explainable [31,32,33,34]. Insurance type was also a top feature, which may reflect an association between the ability to work and better health; while cases and controls were matched by age, significantly more cases had government insurance (Medicare or Medicaid) than controls (49% vs. 38%, respectively). Elixhauser mortality score was missing from the top five most important features. However, the number of comorbidities appeared frequently. This may suggest that the number of individual conditions matters more than aggregated mortality scores when predicting insomnia. One possible explanation is that individuals with a greater number of comorbidities experience greater psychological distress, which, in conjunction with their underlying illnesses, increases their risk of insomnia.
Our results indicate that the length and proximity of the surveillance period to the index date can significantly impact the accuracy of insomnia risk prediction when using EMR data. All performance metrics increased with surveillance duration and proximity, which was expected given that the −1 to −365 models had access to more recent information than the −180 to −365 models. The fact that the −1 to −365 models performed better suggests that the diagnoses and medications that best predict insomnia occur closer to the index date and may not be consistently captured when considering a distant surveillance period. This lack of documentation was reflected in the lists of important features; for example, four of the five top features in the −1 to −365 models were clinical variables (medication orders and number of comorbidities). In contrast, the model with a surveillance period ranging from −180 to −365 days before the index had top features such as age and insurance type, which are independent of the surveillance period and clinically agnostic.
As previously mentioned, the AUCs of the −1 to −365 models all indicate good discriminative ability. However, it is also important to determine whether the model’s performance is stable over time—that is, whether it will need frequent retraining after being deployed in a healthcare system. Our models’ performance remained stable when making predictions on data up to five years in the future, suggesting they are longitudinally viable.
While several studies have explored insomnia prediction using primary data, published research using EMR data is limited. The model proposed by Kartoun et al. (2018) mentioned earlier achieved an AUC of 0.78 when using structured EMR data, which is similar to the present study [16]. However, compared to the present study, this earlier model did not consider patients taking insomnia-specific medications without a documented diagnosis. Moreover, over 75% of patients in the study had at least ten years of EMR records. This extended surveillance period should be compared to the 6- and 12-month surveillance periods reported in the present study.
In summary, this study shows that a model that depends on a limited set of routinely collected variables and a one-year surveillance period can deliver accurate insomnia risk prediction. This finding is important because, even though insomnia is common, patients are often reluctant to discuss sleep issues with their physicians and may delay seeking help with their insomnia until it becomes severe [15]. The models presented in this study offer an inexpensive and scalable method to screen for individuals at high risk of insomnia who could benefit from additional, targeted assessment by a healthcare professional. Because it uses routine EMR data, the model can be readily integrated into existing EMR systems to support clinical decision-making and early treatment initiatives.
Our study has several strengths. First, the data were sourced from a statewide health information exchange, resulting in a large and diverse study sample. Second, we compared models with different surveillance periods to examine how surveillance length affects predictive performance. We also used both ICD codes and insomnia-specific medications to improve insomnia case identification and avoid potential misclassification. Finally, we temporally validated the models to determine their stability over time, an important practical consideration as a temporally sensitive model would require frequent retraining and updates.
This study also has important limitations. While the INPC receives information from most major healthcare systems in Indiana, encounters at non-INPC facilities may not have been captured. Therefore, INPC may not be representative of independent healthcare centers, so our results may not generalize to those populations. Additionally, routine care EMR data may not include all relevant information for insomnia prognostication. Off-label insomnia medications were not considered because they are indicated for the treatment of depression, pain, psychosis, and other medical conditions and would require a review of treatment causes from medical notes to ascertain their relevance to insomnia. As such, insomnia patients without an insomnia ICD code who were treated with off-label medications would have been missed. That said, off-label insomnia medication and the use of medical notes as an additional source of data are being considered for future work.
Requirements for matching cases and controls enforced in the study design were intended to limit biases related to age, sex, and race. However, biases resulting from other criteria, such as off-label medications, insurance types, and health service providers, were not considered.
Nonetheless, with a surveillance period of 1 year, the proposed model achieved an AUC of 0.8 and was temporally validated over five years. As such, we believe it is suitable as a pre-screening method. The model can be applied frequently to all patients without any additional burden. The medical charts of patients identified as at risk by this method should then be reviewed by a health care provider. In addition, we believe that the present study demonstrates the potential of an algorithmic approach to insomnia prognostication and provides a baseline for future enhancements, including the use of medical notes, deep-learning models, and a larger cohort of patients.
5. Conclusions
Our findings suggest that EMR-based prediction models may provide an inexpensive, scalable, and longitudinally viable method to identify individuals at risk of insomnia. Our models demonstrated clinically useful discriminative performance in the general adult population and remained stable over time. Clinical application of the proposed models as an automated screening tool could facilitate targeted, physician-led assessments and subsequent early intervention, thereby potentially reducing insomnia-related healthcare burden and improving quality of life for patients.
Supplementary Materials
The following supporting information can be downloaded at: https://www.mdpi.com/article/10.3390/jcm12093286/s1, Figure S1: Calibration curve for 2011–2017 XGBoost model on holdout data (−1 to −365 days surveillance period); Figure S2: Calibration curve for 2011–2017 XGBoost model on holdout data (−180 to −365 days surveillance period).
Author Contributions
Conceptualization, E.H., F.C., J.A., W.M., R.K.K., Z.B.M., A.O., P.D., N.C. and M.B.; methodology, E.H., A.O. and Z.B.M.; validation, E.H., Z.B.M. and M.B.; formal analysis, E.H.; investigation, E.H.; resources, Z.B.M., P.D. and M.B.; writing—original draft preparation, E.H.; writing—review and editing, E.H., F.C., J.A., W.M., R.K.K., Z.B.M., A.O., P.D., N.C., C.S. and M.B.; supervision, M.B., P.D., Z.B.M., F.C., J.A., W.M. and R.K.K.; project administration, M.B. and Z.B.M.; funding acquisition, M.B. All authors have read and agreed to the published version of the manuscript.
Funding
This work was funded in part by Merck Sharp & Dohme Corp., a subsidiary of Merck & Co., Inc., Rahway, NJ, USA.
Institutional Review Board Statement
The study was conducted in accordance with the Declaration of Helsinki and approved by the Indiana University Institutional Review Board (#11732). Due to the study’s retrospective design and use of deidentified data, the informed consent requirement was waived.
Data Availability Statement
The data that support the findings of this study are available from the Regenstrief Institute, but restrictions apply to the availability of these data, which were used under a research agreement for the current study and are therefore not publicly available. Data are, however, available from the senior author (M.B.) upon reasonable request and with permission of the Regenstrief Institute.
Acknowledgments
The authors thank Jarod Baker and Ravan Carter of the Regenstrief Institute for their support. The high-performance computing services used in this study are supported in part by Lilly Endowment, Inc., through its support for the Indiana University Pervasive Technology Institute.
Conflicts of Interest
Merck Sharp & Dohme Corp. was involved in the design and conduct of the study, the analysis and interpretation of the data, the preparation, review, and approval of the manuscript, and the decision to submit the manuscript for publication. F.C., J.A., W.M., and R.K. are employed by Merck & Co., Inc. Drs. Ben Miled and Boustani have a financial interest in DigiCare Realized and could benefit from the results of this research. Dr. Boustani serves as the Chief Scientific Officer and co-founder of BlueAgilis and the Chief Health Officer of DigiCare Realized, Inc. He has equity interests in Blue Agilis, Inc.; DigiCare Realized, Inc.; Preferred Population Health Management, LLC; and MyShift, Inc. (previously known as RestUp, LLC). He serves as an advisory board member for Acadia Pharmaceuticals, Eisai, Inc., Biogen, and Genentech. These conflicts have been reviewed by Indiana University and have been appropriately managed to maintain objectivity. The remaining authors declare no competing interests.
References
- Dopheide, J.A. Insomnia overview: Epidemiology, pathophysiology, diagnosis and monitoring, and nonpharmacologic therapy. Am. J. Manag. Care 2020, 26, S76–S84. [Google Scholar] [CrossRef] [PubMed]
- Crowley, K. Sleep and sleep disorders in older adults. Neuropsychol. Rev. 2011, 21, 41–53. [Google Scholar] [CrossRef] [PubMed]
- Patel, D.; Steinberg, J.; Patel, P. Insomnia in the Elderly: A Review. J. Clin. Sleep Med. 2018, 14, 1017–1024. [Google Scholar] [CrossRef]
- Kuppermann, M.; Lubeck, D.P.; Mazonson, P.D.; Patrick, D.L.; Stewart, A.L.; Buesching, D.P.; Fifer, S.K. Sleep problems and their correlates in a working population. J. Gen. Intern. Med. 1995, 10, 25–32. [Google Scholar] [CrossRef] [PubMed]
- Wickwire, E.M.; Shaya, F.T.; Scharf, S.M. Health economics of insomnia treatments: The return on investment for a good night’s sleep. Sleep Med. Rev. 2016, 30, 72–82. [Google Scholar] [CrossRef]
- Fortier-Brochu, É.; Morin, C.M. Cognitive Impairment in Individuals with Insomnia: Clinical Significance and Correlates. Sleep 2014, 37, 1787–1798. [Google Scholar] [CrossRef]
- Baglioni, C.; Battagliese, G.; Feige, B.; Spiegelhalder, K.; Nissen, C.; Voderholzer, U.; Lombardo, C.; Riemann, D. Insomnia as a predictor of depression: A meta-analytic evaluation of longitudinal epidemiological studies. J. Affect. Disord. 2011, 135, 10–19. [Google Scholar] [CrossRef] [PubMed]
- Almondes, K.M.d.; Costa, M.V.; Malloy-Diniz, L.F.; Diniz, B.S. Insomnia and risk of dementia in older adults: Systematic review and meta-analysis. J. Psychiatr. Res. 2016, 77, 109–115. [Google Scholar] [CrossRef]
- Pollak, C.P.; Perlick, D. Sleep Problems and Institutionalization of the Elderly. Top. Geriatr. 1991, 4, 204–210. [Google Scholar] [CrossRef]
- Patty Taddei-Allen, P. Economic Burden and Managed Care Considerations for the Treatment of Insomnia. Suppl. Featur. Publ. 2020, 26, S91–S96. [Google Scholar]
- Buysse, D.J. Insomnia. JAMA 2013, 309, 706–716. [Google Scholar] [CrossRef] [PubMed]
- Sateia, M.J.; Buysse, D.J.; Krystal, A.D.; Neubauer, D.N.; Heald, J.L. Clinical Practice Guideline for the Pharmacologic Treatment of Chronic Insomnia in Adults: An American Academy of Sleep Medicine Clinical Practice Guideline. J. Clin. Sleep Med. 2017, 13, 307–349. [Google Scholar] [CrossRef] [PubMed]
- Mitchell, M.D.; Gehrman, P.; Perlis, M.; Umscheid, C.A. Comparative effectiveness of cognitive behavioral therapy for insomnia: A systematic review. BMC Fam. Pract. 2012, 13, 40. [Google Scholar] [CrossRef]
- Koffel, E.; Bramoweth, A.D.; Ulmer, C.S. Increasing access to and utilization of cognitive behavioral therapy for insomnia (CBT-I): A narrative review. J. Gen. Intern. Med. 2018, 33, 955–962. [Google Scholar] [CrossRef]
- Ancoli-Israel, S.; Roth, T. Characteristics of insomnia in the United States: Results of the 1991 National Sleep Foundation Survey. I. Sleep 1999, 22 (Suppl. S2), S347–S353. [Google Scholar] [PubMed]
- Shahin, M.; Ahmed, B.; Hamida, S.T.; Mulaffer, F.L.; Glos, M.; Penzel, T. Deep Learning and Insomnia: Assisting Clinicians With Their Diagnosis. IEEE J. Biomed. Health Inform. 2017, 21, 1546–1553. [Google Scholar] [CrossRef] [PubMed]
- Li, C.; Mai, Y.; Dong, M.; Yin, Y.; Hua, K.; Fu, S.; Wu, Y.; Jiang, G. Multivariate Pattern Classification of Primary Insomnia Using Three Types of Functional Connectivity Features. Front. Neurol. 2019, 10, 1037. [Google Scholar] [CrossRef] [PubMed]
- Rodriguez-Morilla, B.; Estivill, E.; Estivill-Domènech, C.; Albares, J.; Segarra, F.; Correa, A.; Campos, M.; Rol, M.A.; Madrid, J.A. Application of Machine Learning Methods to Ambulatory Circadian Monitoring (ACM) for Discriminating Sleep and Circadian Disorders. Front. Neurosci. 2019, 13, 1318. [Google Scholar] [CrossRef] [PubMed]
- Sharma, M.; Dhiman, H.S.; Acharya, U.R. Automatic identification of insomnia using optimal antisymmetric biorthogonal wavelet filter bank with ECG signals. Comput. Biol. Med. 2021, 131, 104246. [Google Scholar] [CrossRef]
- Huang, A.A.; Huang, S.Y. Use of machine learning to identify risk factors for insomnia. PLoS ONE 2023, 18, e0282622. [Google Scholar] [CrossRef]
- Kartoun, U.; Aggarwal, R.; Beam, A.L.; Pai, J.K.; Chatterjee, A.K.; Fitzgerald, T.P.; Kohane, I.S.; Shaw, S.Y. Development of an Algorithm to Identify Patients with Physician-Documented Insomnia. Sci. Rep. 2018, 8, 7862. [Google Scholar] [CrossRef] [PubMed]
- Collins, G.S.; Reitsma, J.B.; Altman, D.G.; Moons, K.G.M. Transparent reporting of a multivariable prediction model for individual prognosis or diagnosis (TRIPOD): The TRIPOD Statement. BMC Med. 2015, 13, 1. [Google Scholar] [CrossRef] [PubMed]
- Regenstrief Institute. The Indiana Network for Patient Care. Available online: https://www.regenstrief.org/rds/data/ (accessed on 1 June 2022).
- Grandner, M.A.; Patel, N.P.; Gehrman, P.R.; Xie, D.; Sha, D.; Weaver, T.; Gooneratne, N. Who gets the best sleep? Ethnic and socioeconomic factors related to sleep complaints. Sleep Med. 2010, 11, 470–478. [Google Scholar] [CrossRef] [PubMed]
- Elixhauser, A.; Steiner, C.; Harris, D.R.; Coffey, R.M. Comorbidity measures for use with administrative data. Med. Care 1998, 36, 8–27. [Google Scholar] [CrossRef]
- Quan, H.; Sundararajan, V.; Halfon, P.; Fong, A.; Burnand, B.; Luthi, J.C.; Saunders, L.D.; Beck, C.A.; Feasby, T.E.; Ghali, W.A. Coding algorithms for defining comorbidities in ICD-9-CM and ICD-10 administrative data. Med. Care 2005, 43, 1130–1139. [Google Scholar] [CrossRef]
- van Walraven, C.; Austin, P.C.; Jennings, A.; Quan, H.; Forster, A.J. A modification of the Elixhauser comorbidity measures into a point system for hospital death using administrative data. Med. Care 2009, 47, 626–633. [Google Scholar] [CrossRef]
- World Health Organization. Anatomical Therapeutic Chemical (ATC) Classification. Available online: https://www.who.int/tools/atc-ddd-toolkit/atc-classification (accessed on 1 June 2022).
- Lundberg, S.M.; Lee, S.-I. A unified approach to interpreting model predictions. Adv. Neural Inf. Process. Syst. 2017, 30. [Google Scholar] [CrossRef]
- Boustani, M.; Perkins, A.J.; Khandker, R.K.; Duong, S.; Dexter, P.R.; Lipton, R.; Black, C.M.; Chandrasekaran, V.; Solid, C.A.; Monahan, P. Passive Digital Signature for Early Identification of Alzheimer’s Disease and Related Dementia. J. Am. Geriatr. Soc. 2020, 68, 511–518. [Google Scholar] [CrossRef]
- Taylor, D.J.; Lichstein, K.L.; Durrence, H.H. Insomnia as a health risk factor. Behav. Sleep Med. 2003, 1, 227–247. [Google Scholar] [CrossRef]
- Jansson, C.; Nordenstedt, H.; Wallander, M.A.; Johansson, S.; Johnsen, R.; Hveem, K.; Lagergren, J. A population-based study showing an association between gastroesophageal reflux disease and sleep problems. Clin. Gastroenterol. Hepatol. 2009, 7, 960–965. [Google Scholar] [CrossRef]
- Ohayon, M.M. Relationship between chronic painful physical condition and insomnia. J. Psychiatr. Res. 2005, 39, 151–159. [Google Scholar] [CrossRef] [PubMed]
- Foley, D.; Ancoli-Israel, S.; Britz, P.; Walsh, J. Sleep disturbances and chronic disease in older adults: Results of the 2003 National Sleep Foundation Sleep in America Survey. J. Psychosom. Res. 2004, 56, 497–502. [Google Scholar] [CrossRef] [PubMed]
Disclaimer/Publisher’s Note: The statements, opinions and data contained in all publications are solely those of the individual author(s) and contributor(s) and not of MDPI and/or the editor(s). MDPI and/or the editor(s) disclaim responsibility for any injury to people or property resulting from any ideas, methods, instructions or products referred to in the content. |
© 2023 by the authors. Licensee MDPI, Basel, Switzerland. This article is an open access article distributed under the terms and conditions of the Creative Commons Attribution (CC BY) license (https://creativecommons.org/licenses/by/4.0/).