
Protective Effects of BNT162b2 Vaccination on Aerobic Capacity Following Mild to Moderate SARS-CoV-2 Infection: A Cross-Sectional Study Israel

 , , ,
, , ,
Abstract
:1. Introduction
2. Methods
3. Cardiopulmonary Exercise Test
4. Statistical Analysis
5. Results
6. Discussion
7. Conclusions
Author Contributions
Funding
Institutional Review Board Statement
Informed Consent Statement
Conflicts of Interest
References
- A Clinical Case Definition of Post COVID-19 Condition by a Delphi Consensus, 6 October 2021. Available online: https://www.who.int/publications/i/item/WHO-2019-nCoV-Post_COVID-19_condition-Clinical_case_definition-2021.1 (accessed on 27 December 2021).
- Lopez-Leon, S.; Wegman-Ostrosky, T.; Perelman, C.; Sepulveda, R.; Rebolledo, P.A.; Cuapio, A.; Villapol, S. More than 50 Long-Term Effects of COVID-19: A Systematic Review and Meta-Analysis. Sci. Rep. 2021, 11, 16144. [Google Scholar] [CrossRef] [PubMed]
- Baratto, C.; Caravita, S.; Faini, A.; Perego, G.B.; Senni, M.; Badano, L.P.; Parati, G. Impact of COVID-19 on Exercise Pathophysiology: A Combined Cardiopulmonary and Echocardiographic Exercise Study. J. Appl. Physiol. 2021, 130, 1470–1478. [Google Scholar] [CrossRef] [PubMed]
- Raman, B.; Bluemke, D.A.; Lüscher, T.F.; Neubauer, S. Long COVID: Post-Acute Sequelae of COVID-19 with a Cardiovascular Focus. Eur. Heart J. 2022, 43, 1157–1172. [Google Scholar] [CrossRef] [PubMed]
- Kuodi, P.; Gorelik, Y.; Zayyad, H.; Wertheim, O.; Wiegler, K.B.; Jabal, K.A.; Dror, A.A.; Nazzal, S.; Glikman, D.; Edelstein, M. Association between Vaccination Status and Reported Incidence of Post-Acute COVID-19 Symptoms in Israel: A Cross-Sectional Study of Patients Tested between March 2020 and November 2021. MedRxiv 2022, preprint. [Google Scholar] [CrossRef]
- Taquet, M.; Dercon, Q.; Harrison, P.J. Six-Month Sequelae of Post-Vaccination SARS-CoV-2 Infection: A Retrospective Cohort Study of 10,024 Breakthrough Infections. MedRxiv 2021, preprint. [Google Scholar] [CrossRef] [PubMed]
- Naeije, R.; Caravita, S. Phenotyping Long COVID. Eur. Respir. J. 2021, 58, 2101763. [Google Scholar] [CrossRef] [PubMed]
- Clinical Spectrum|COVID-19 Treatment Guidelines. Available online: https://www.covid19treatmentguidelines.nih.gov/overview/clinical-spectrum/ (accessed on 2 June 2022).
- Albouaini, K.; Egred, M.; Alahmar, A.; Wright, D.J. Cardiopulmonary Exercise Testing and Its Application. Postgrad. Med. J. 2007, 83, 675–682. [Google Scholar] [CrossRef] [PubMed]
- Graham, B.L.; Steenbruggen, I.; Miller, M.R.; Barjaktarevic, I.Z.; Cooper, B.G.; Hall, G.L.; Hallstrand, T.S.; Kaminsky, D.A.; McCarthy, K.; McCormack, M.C.; et al. Standardization of Spirometry 2019 Update. An Official American Thoracic Society and European Respiratory Society Technical Statement. Am. J. Respir. Crit. Care Med. 2019, 200, E70–E88. [Google Scholar] [CrossRef] [PubMed]
- Baba, R.; Nagashima, M.; Goto, M.; Nagano, Y.; Yokota, M.; Tauchi, N.; Nishibata, K. Oxygen Uptake Efficiency Slope: A New Index of Cardiorespiratory Functional Reserve Derived from the Relation between Oxygen Uptake and Minute Ventilation during Incremental Exercise. J. Am. Coll. Cardiol. 1996, 28, 1567–1572. [Google Scholar] [CrossRef]
- Hansen, J.E.; Sue, D.Y.; Wasserman, K. Predicted Values for Clinical Exercise Testing. Am. Rev. Respir. Dis. 1984, 129, S49–S55. [Google Scholar] [CrossRef] [PubMed]
- Jimeno-Almazán, A.; Pallarés, J.G.; Buendía-Romero, Á.; Martínez-Cava, A.; Courel-Ibáñez, J. Chronotropic Incompetence in Non-Hospitalized Patients with Post-COVID-19 Syndrome. J. Clin. Med. 2021, 10, 5434. [Google Scholar] [CrossRef] [PubMed]
- Szekely, Y.; Lichter, Y.; Sadon, S.; Lupu, L.; Taieb, P.; Banai, A.; Sapir, O.; Granot, Y.; Hochstadt, A.; Friedman, S.; et al. Cardiorespiratory Abnormalities in Patients Recovering from Coronavirus Disease 2019. J. Am. Soc. Echocardiogr. 2021, 34, 1273–1284. [Google Scholar] [CrossRef]
- Motiejunaite, J.; Balagny, P.; Arnoult, F.; Mangin, L.; Bancal, C.; d’Ortho, M.-P.; Frija-Masson, J. Hyperventilation: A Possible Explanation for Long-Lasting Exercise Intolerance in Mild COVID-19 Survivors? Front. Physiol. 2021, 11, 1856. [Google Scholar] [CrossRef] [PubMed]
- Frésard, I.; Genecand, L.; Altarelli, M.; Gex, G.; Vremaroiu, P.; Vremaroiu-Coman, A.; Lawi, D.; Bridevaux, P.-O. Dysfunctional Breathing Diagnosed by Cardiopulmonary Exercise Testing in ‘Long COVID’ Patients with Persistent Dyspnoea. BMJ Open Respir. Res. 2022, 9, e001126. [Google Scholar] [CrossRef]
- Arena, R.; Guazzi, M.; Myers, J.; Chase, P.; Bensimhon, D.; Cahalin, L.P.; Peberdy, M.A.; Ashley, E.; West, E.; Forman, D.E. The Relationship between Minute Ventilation and Oxygen Consumption in Heart Failure: Comparing Peak VE/VO2 and the Oxygen Uptake Efficiency Slope. Int. J. Cardiol. 2012, 154, 384. [Google Scholar] [CrossRef] [PubMed]
- Noury, J.B.; Zagnoli, F.; Petit, F.; Marcorelles, P.; Rannou, F. Exercise Efficiency Impairment in Metabolic Myopathies. Sci. Rep. 2020, 10, 8765. [Google Scholar] [CrossRef] [PubMed]
- Madonna, R.; Bolli, R.; De Caterina, R. The Usefulness of the Anaerobic Threshold in the Assessment and Prognostic Evaluation of the Patient with Dyspnea. Rev. Cardiovasc. Med. 2012, 13, 139–149. [Google Scholar] [CrossRef] [PubMed]
- Barizien, N.; Le Guen, M.; Russel, S.; Touche, P.; Huang, F.; Vallée, A. Clinical Characterization of Dysautonomia in Long COVID-19 Patients. Sci. Rep. 2021, 11, 14042. [Google Scholar] [CrossRef]
- Singh, I.; Joseph, P.; Heerdt, P.M.; Cullinan, M.; Lutchmansingh, D.D.; Gulati, M.; Possick, J.D.; Systrom, D.M.; Waxman, A.B. Persistent Exertional Intolerance After COVID-19: Insights from Invasive Cardiopulmonary Exercise Testing. Chest 2021, 161, 54–63. [Google Scholar] [CrossRef] [PubMed]

| Unvaccinated (n = 28) | Vaccinated (n = 22) | |
|---|---|---|
| Male (n, %) | 15 (53%) | 10 (45%) |
| Female (n, %) | 13 (46%) | 12 (55%) |
| Age (years, SE) | 47 ± 12 | 41 ± 9 |
| Height, (cm, SE) | 170 ± 8 | 169 ± 11 |
| Weight, (kg, SE) | 82.5 ± 16 | 76 ± 12 |
| Body Surface Area | 1.8 ± 0.6 | 1.9 ± 0.22 |
| Body mass Index | 28 ± 6 | 26 ± 3.3 |
| Comorbidities | ||
| Diabetes Mellitus (n, %) | 4 (14%) | - |
| Hypertension (n, %) | 4 (14%) | - |
| Smoker (n, %) | 3 (11%) | 4 (18%) |
| PFT (Pulmonary Function Test) | ||
| Forced Vital Capacity (FVC) | 4.5 ± 1.2 | 4.8 ± 1.5 |
| Forced Expiratory Volume (FEV1) | 3.5 ± 0.9 | 3.7 ± 1.1 |
| FEV1/FVC | 79 ± 8 | 79.5 ± 7.2 |
| Unvaccinated | Vaccinated | p Value | ||||
|---|---|---|---|---|---|---|
| Measured | % of Predicted | Measured | % of Predicted | Difference in Measured Values Unvaccinated vs. Vaccinated | Difference in % Predicted Values Unvaccinated vs. Vaccinated | |
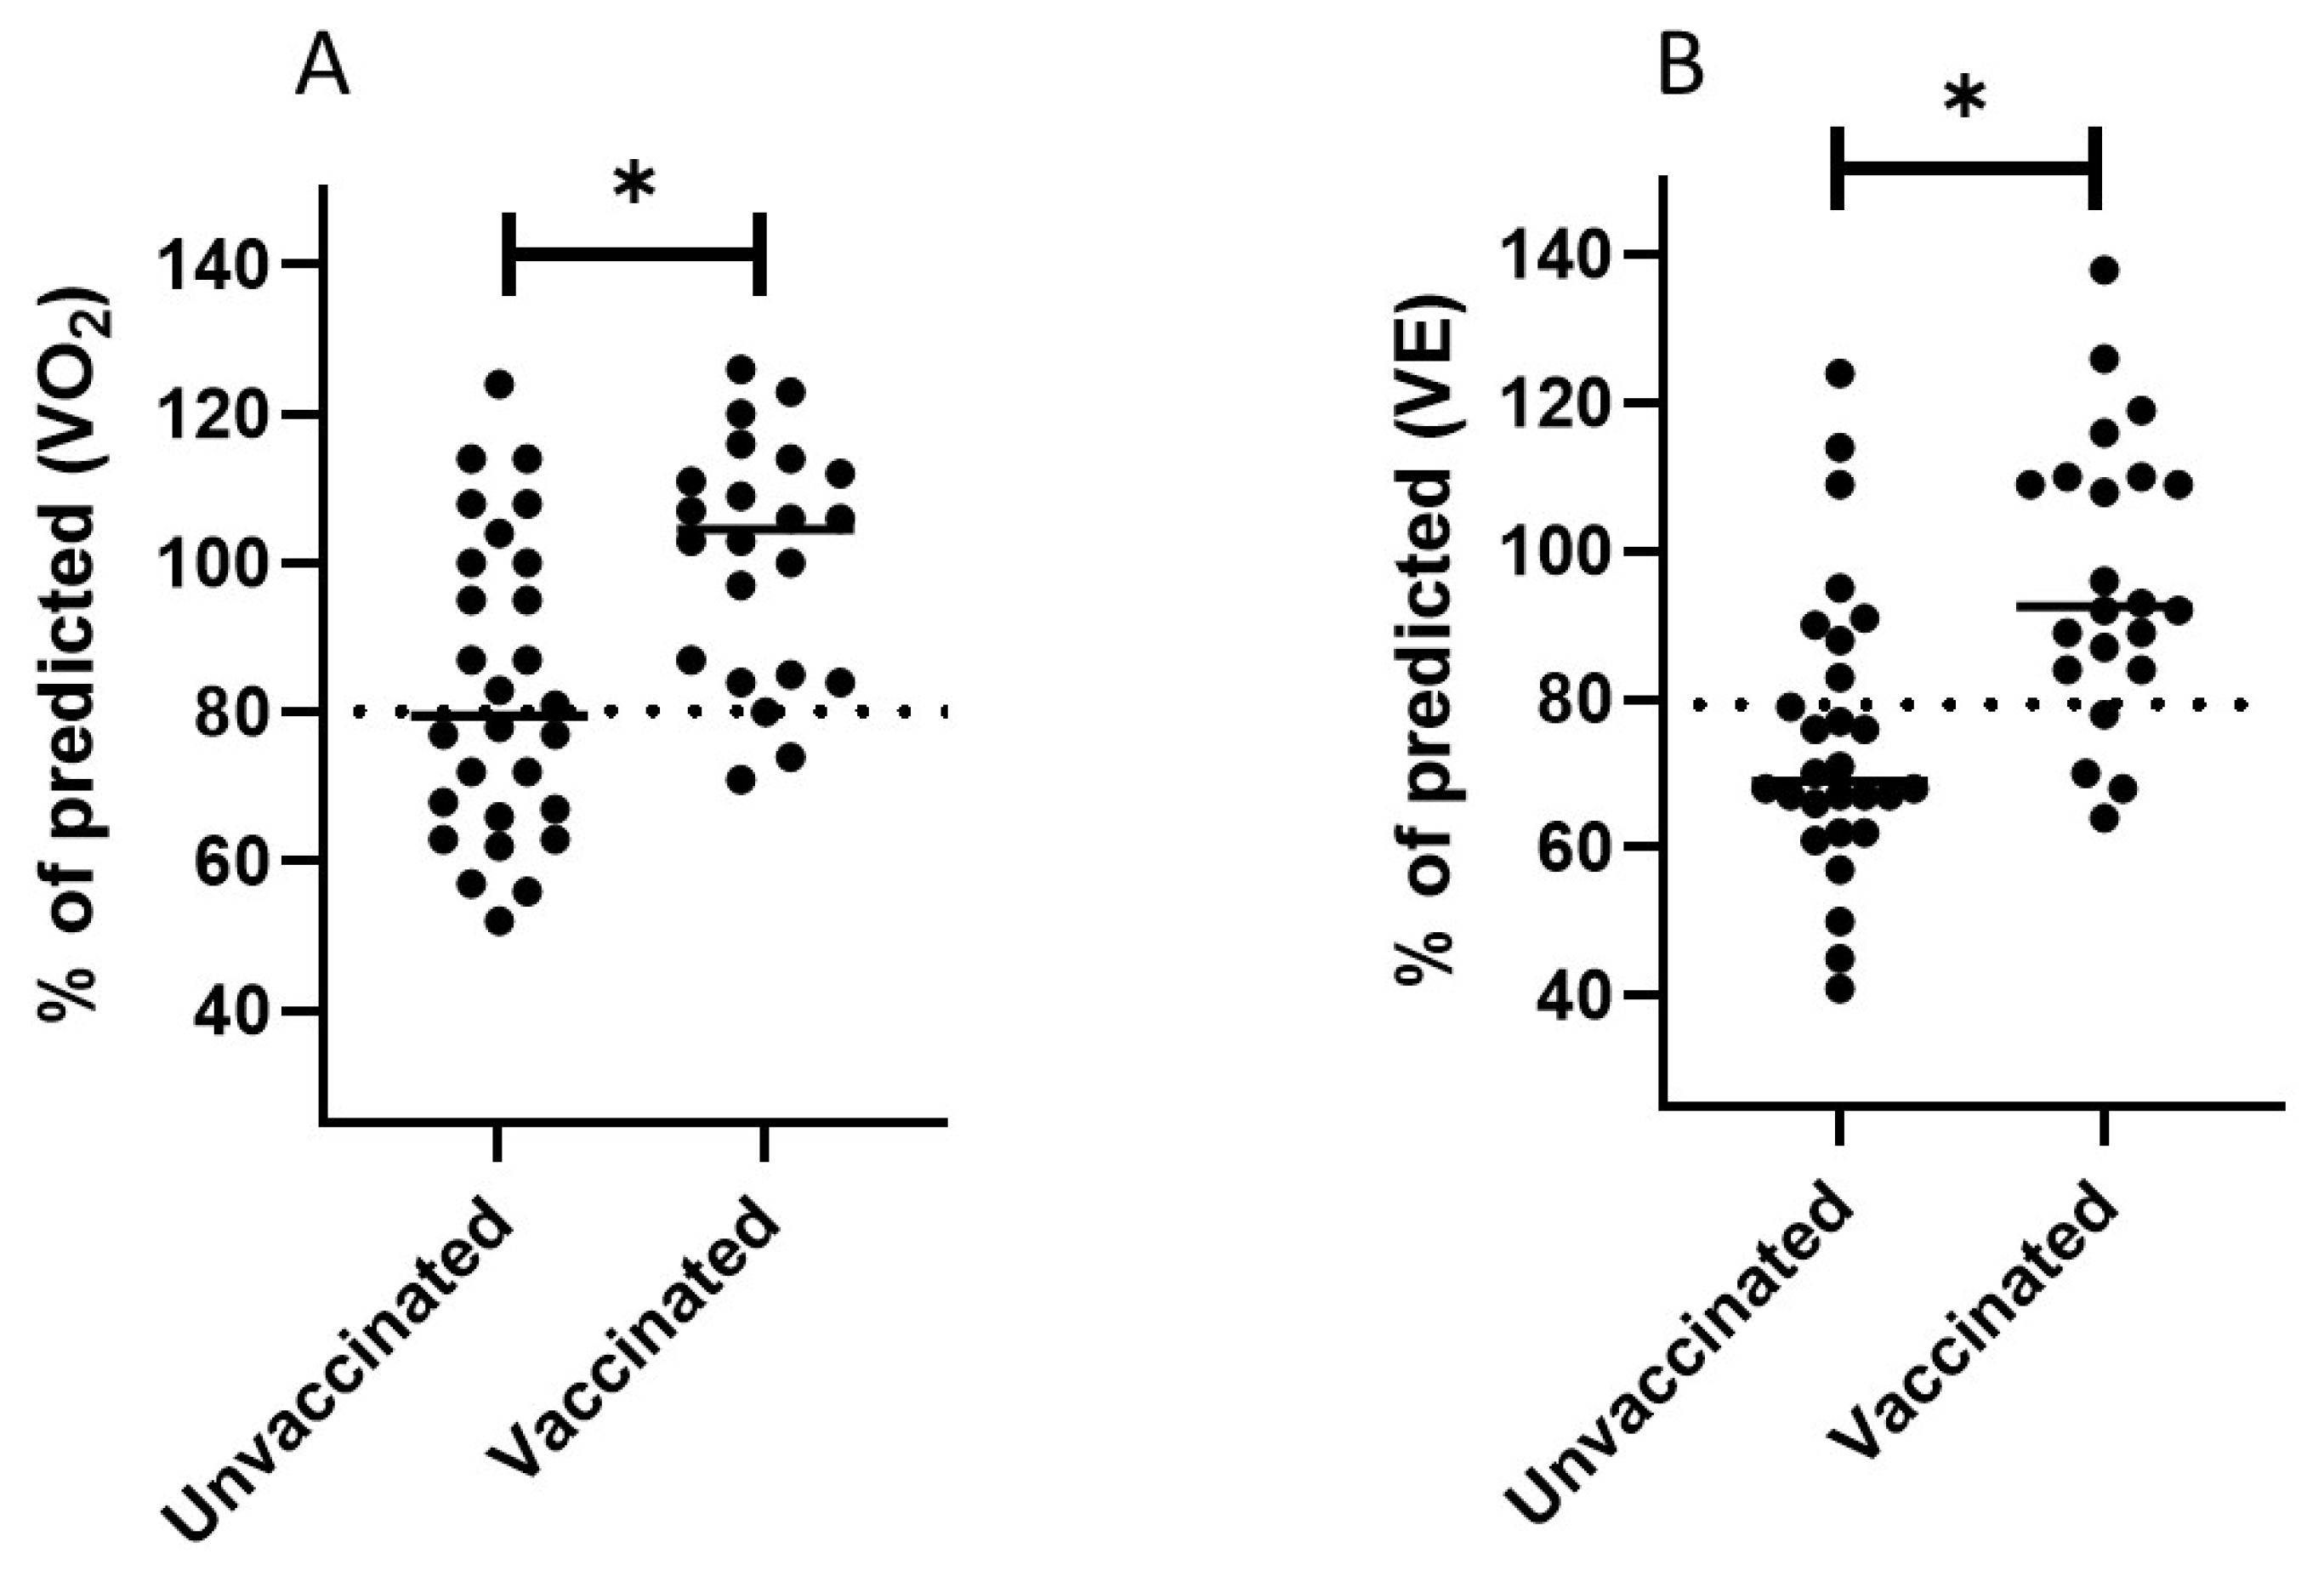
| V’O2 (L/min) | 1.8 ± 0.7 | 83.2 ± 20 | 2.22 ± 0.9 | 100 ± 16 | 0.04 | 0.002 |
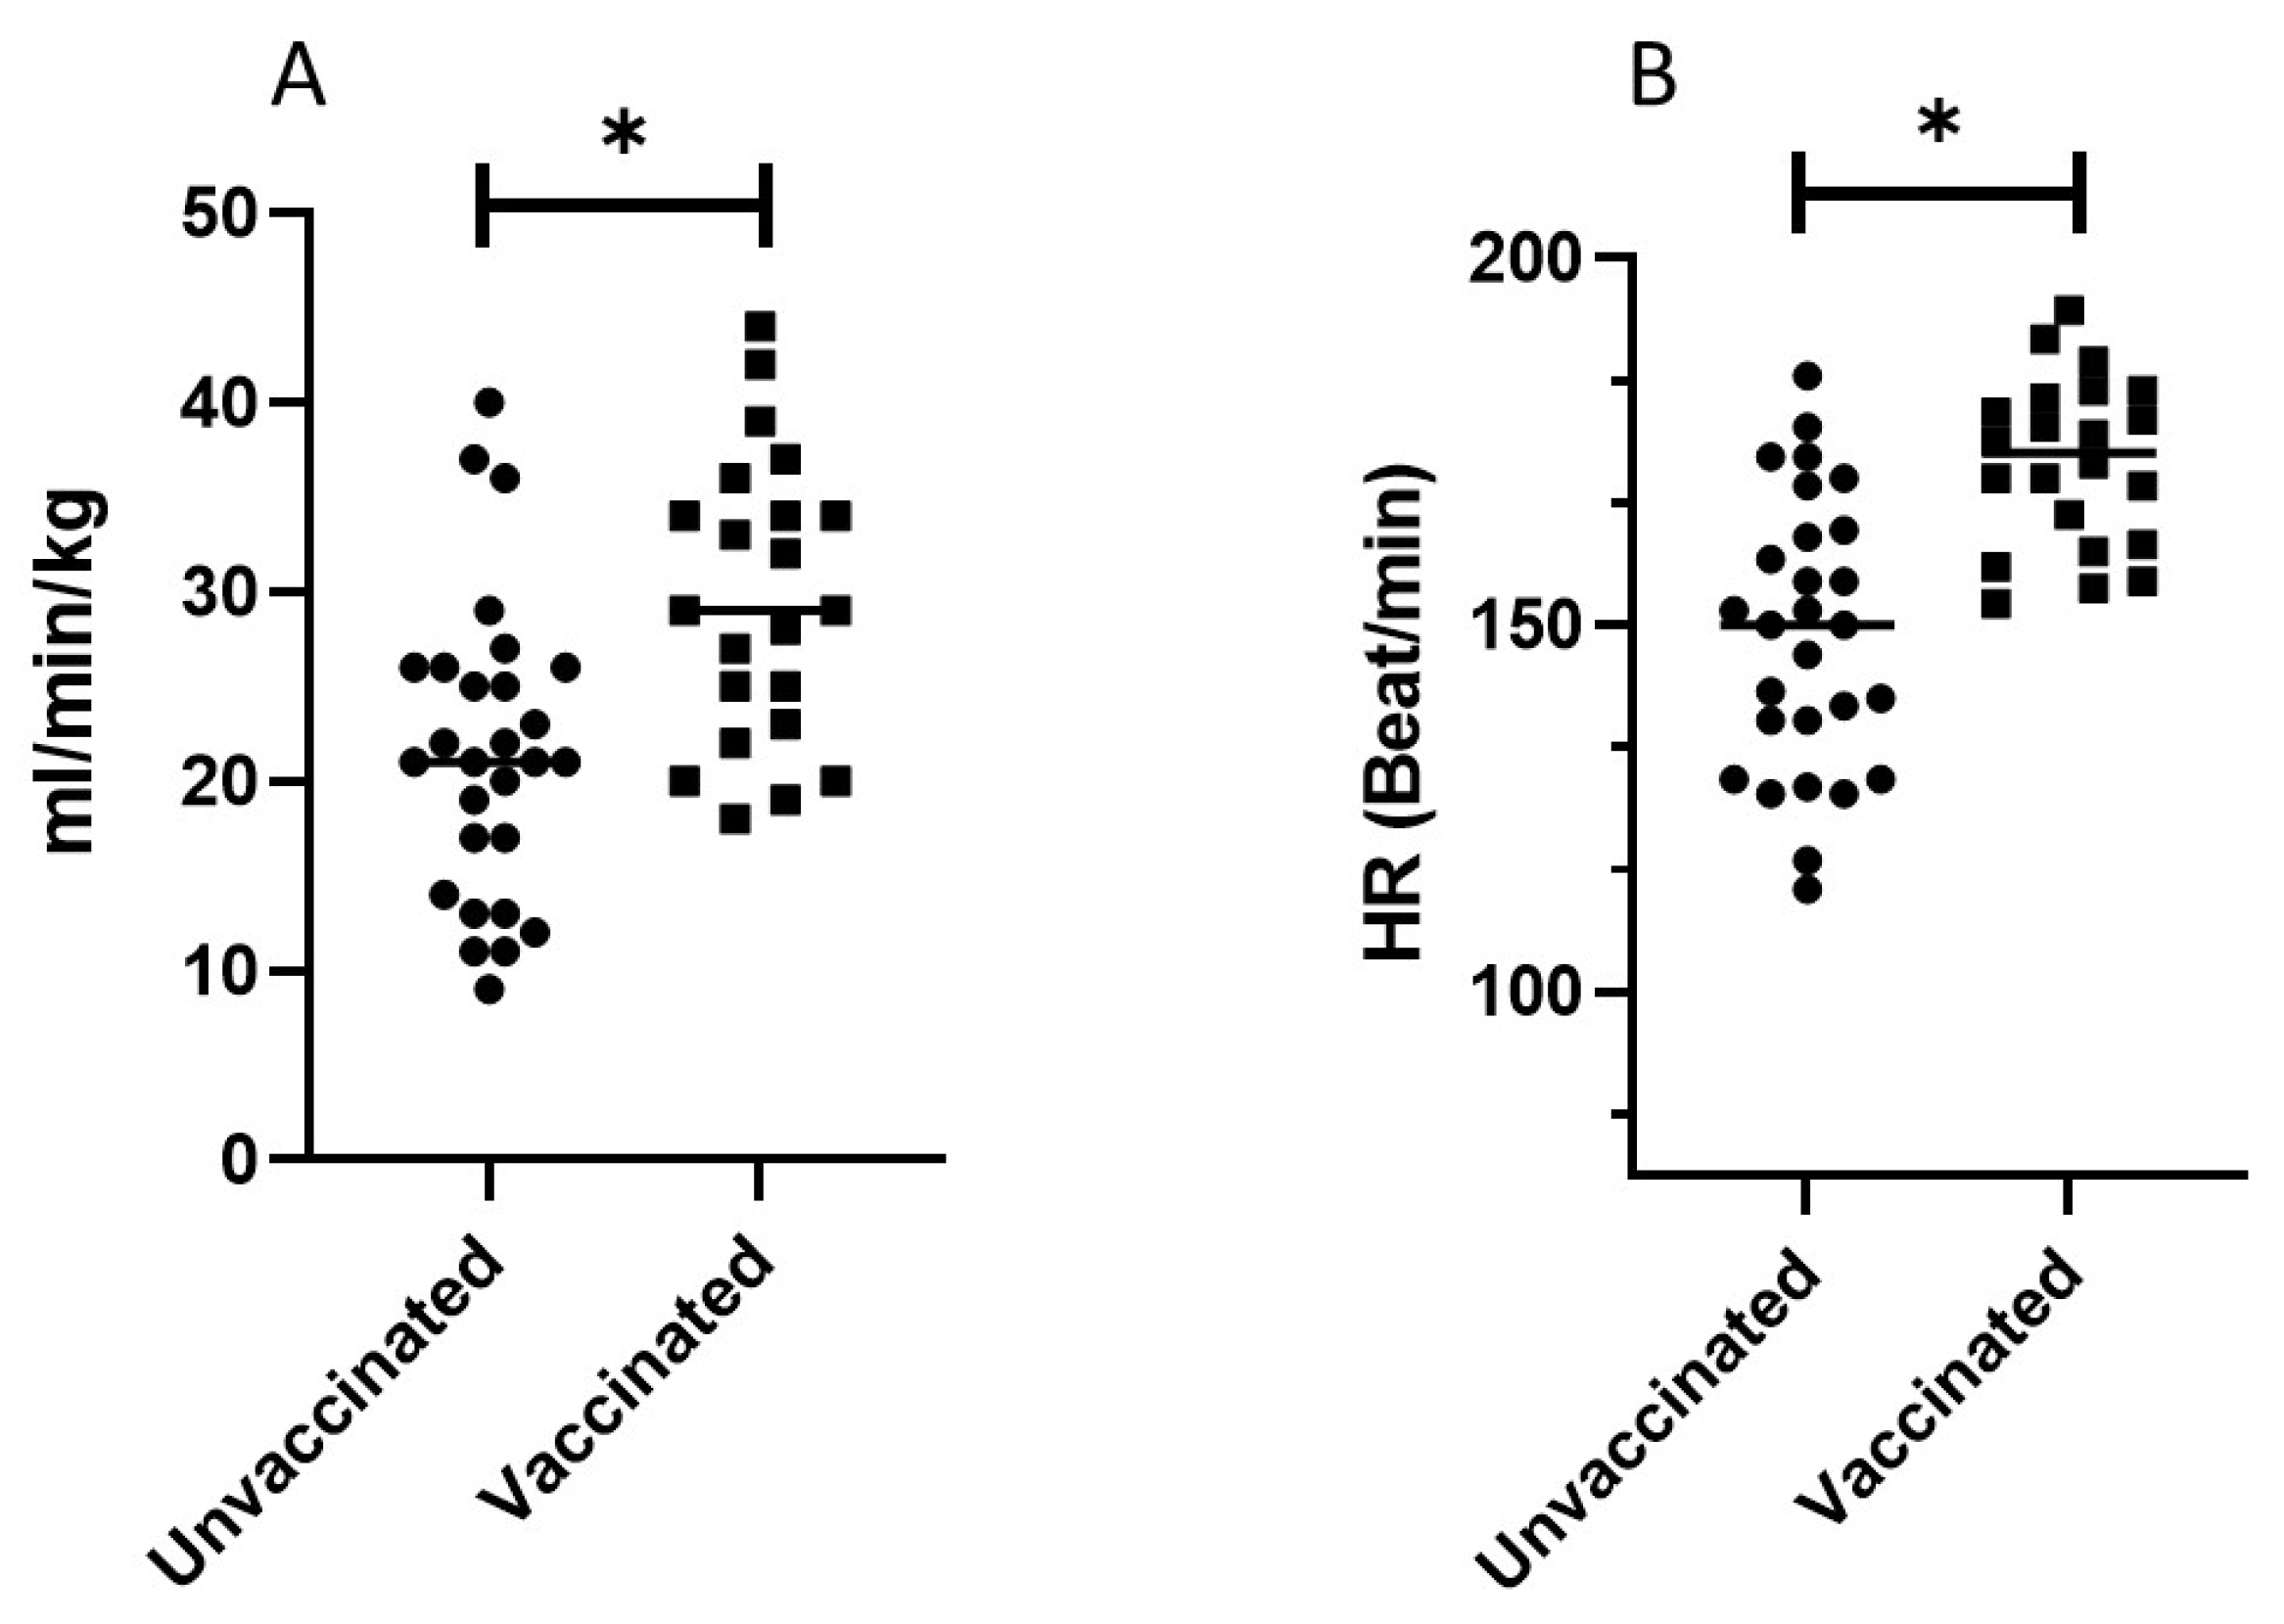
| V’O2/kg (mL/min/kg) | 21.6 ± 8 | 83.2 ± 20 | 27.8 ± 8 | 100 ± 16 | 0.04 | 0.002 |
| V’O2/HR (mL) | 11.8 ± 3.8 | 85 ± 15 | 12.7 ± 4 | 93 ± 15 | 0.39 | 0.051 |
| WR (Watt) | 112 ± 41.7 | 63.8 ± 21 | 130 ± 40 | 74 ± 19 | 0.04 | 0.06 |
| HR (bit/min) | 148.5 ± 18.8 | 96 ± 11 | 174 ± 12.5 | 108 ± 8 | 0.01 | 0.01 |
| VE (L/min) | 70.3 ± 26 | 74.7 ± 19.5 | 97 ± 33 | 93 ± 18 | 0.001 | 0.001 |
| BF (Vt/min) | 40.1 ± 7.3 | 26 ± 26.71 | 50.5 ± 7.5 | 149 ± 25 | 0.002 | 0.003 |
| OUES | 2.1 ± 0.6 | 73 ± 17 | 2.3 ± 0.9 | 83 ± 26 | 0.31 | 0.12 |
| BR (L/min) | 47.1 ± 20.6 | - | 31.29 ± 17 | - | 0.002 | - |
| RPE | 18.8 ± 2 | - | 19.2 ± 1 | - | 0.37 | - |
| VE/VO2 | 37.1 ± 6.5 | - | 41.5 ± 4.5 | - | 0.01 | - |
| VE/VCO2 | 35.4 ± 6 | - | 37.8 ± 4 | - | 0.17 | - |
| VE/VCO2 slope | 36.5 ± 7 | - | 34 ± 4 | - | 0.14 | - |
| Unvaccinated | Vaccinated | p Value | ||||
|---|---|---|---|---|---|---|
| Measured | % of Peak | Measured | % of Peak | Difference in Measured Values Unvaccinated vs. Vaccinated | Difference in % Peak Unvaccinated vs. Vaccinated | |
| V’O2 (L/min) | 1.1 ± 0.5 | 71 ± 12 | 1.4 ± 0.5 | 63 ± 8 | 0.07 | 0.02 |
| V’O2/kg (mL/min/kg) | 14.2 ± 3 | 71 ± 12 | 18.4 ± 5.5 | 63 ± 8 | 0.001 | 0.02 |
| V’O2/HR (mL) | 9.3 ± 2 | 83 ± 9 | 11 ± 4 | 85 ± 9 | 0.12 | 0.39 |
| WR (Watt) | 60 ± 23 | 61.2 ± 15 | 67 ± 13 | 52 ± 10 | 0.2 | 0.01 |
| HR (bit/min) | 120 ± 13.5 | 75 ± 12 | 131 ± 20 | 75 ± 6 | 0.05 | 0.8 |
| VE (L/min) | 36.5 ± 8 | 61.4 | 43 ± 18 | 43 ± 5 | 0.18 | 0.01 |
| BF (Vt/min) | 29.2 ± 6 | 78.7 ± 26 | 27 ± 7 | 58 ± 18 | 0.43 | 0.03 |
| BR (L/min) | 73 ± 20 | - | 84 ± 24 | - | 0.1 | - |
| RPE | 13.7 ± 3.2 | - | 11.3 ± 3 | - | 0.001 | - |
| VE/VO2 | 31 ± 9 | 83 ± 13 | 28 ± 6 | 67 ± 8 | 0.12 | 0.003 |
| VE/VCO2 | 32 ± 9 | 88 ± 10 | 28 ± 2.5 | 74 ± 8 | 0.07 | 0.001 |
Publisher’s Note: MDPI stays neutral with regard to jurisdictional claims in published maps and institutional affiliations. |
© 2022 by the authors. Licensee MDPI, Basel, Switzerland. This article is an open access article distributed under the terms and conditions of the Creative Commons Attribution (CC BY) license (https://creativecommons.org/licenses/by/4.0/).
Share and Cite
Blumberg, Y.; Edelstein, M.; Abu Jabal, K.; Golan, R.; Tuvia, N.; Perets, Y.; Saad, M.; Levinas, T.; Saleem, D.; Israeli, Z.; et al. Protective Effects of BNT162b2 Vaccination on Aerobic Capacity Following Mild to Moderate SARS-CoV-2 Infection: A Cross-Sectional Study Israel. J. Clin. Med. 2022, 11, 4420. https://doi.org/10.3390/jcm11154420
Blumberg Y, Edelstein M, Abu Jabal K, Golan R, Tuvia N, Perets Y, Saad M, Levinas T, Saleem D, Israeli Z, et al. Protective Effects of BNT162b2 Vaccination on Aerobic Capacity Following Mild to Moderate SARS-CoV-2 Infection: A Cross-Sectional Study Israel. Journal of Clinical Medicine. 2022; 11(15):4420. https://doi.org/10.3390/jcm11154420
Chicago/Turabian StyleBlumberg, Yair, Michael Edelstein, Kamal Abu Jabal, Ron Golan, Neta Tuvia, Yuval Perets, Musa Saad, Tatyana Levinas, Dabbah Saleem, Zeev Israeli, and et al. 2022. "Protective Effects of BNT162b2 Vaccination on Aerobic Capacity Following Mild to Moderate SARS-CoV-2 Infection: A Cross-Sectional Study Israel" Journal of Clinical Medicine 11, no. 15: 4420. https://doi.org/10.3390/jcm11154420
APA StyleBlumberg, Y., Edelstein, M., Abu Jabal, K., Golan, R., Tuvia, N., Perets, Y., Saad, M., Levinas, T., Saleem, D., Israeli, Z., Alaa, A. R., Elbaz Greener, G., Amital, A., & Halabi, M. (2022). Protective Effects of BNT162b2 Vaccination on Aerobic Capacity Following Mild to Moderate SARS-CoV-2 Infection: A Cross-Sectional Study Israel. Journal of Clinical Medicine, 11(15), 4420. https://doi.org/10.3390/jcm11154420