
Agonism of Prostaglandin E2 Receptor 4 Ameliorates Tubulointerstitial Injury in Nephrotoxic Serum Nephritis in Mice

 , ,
, ,  and
and 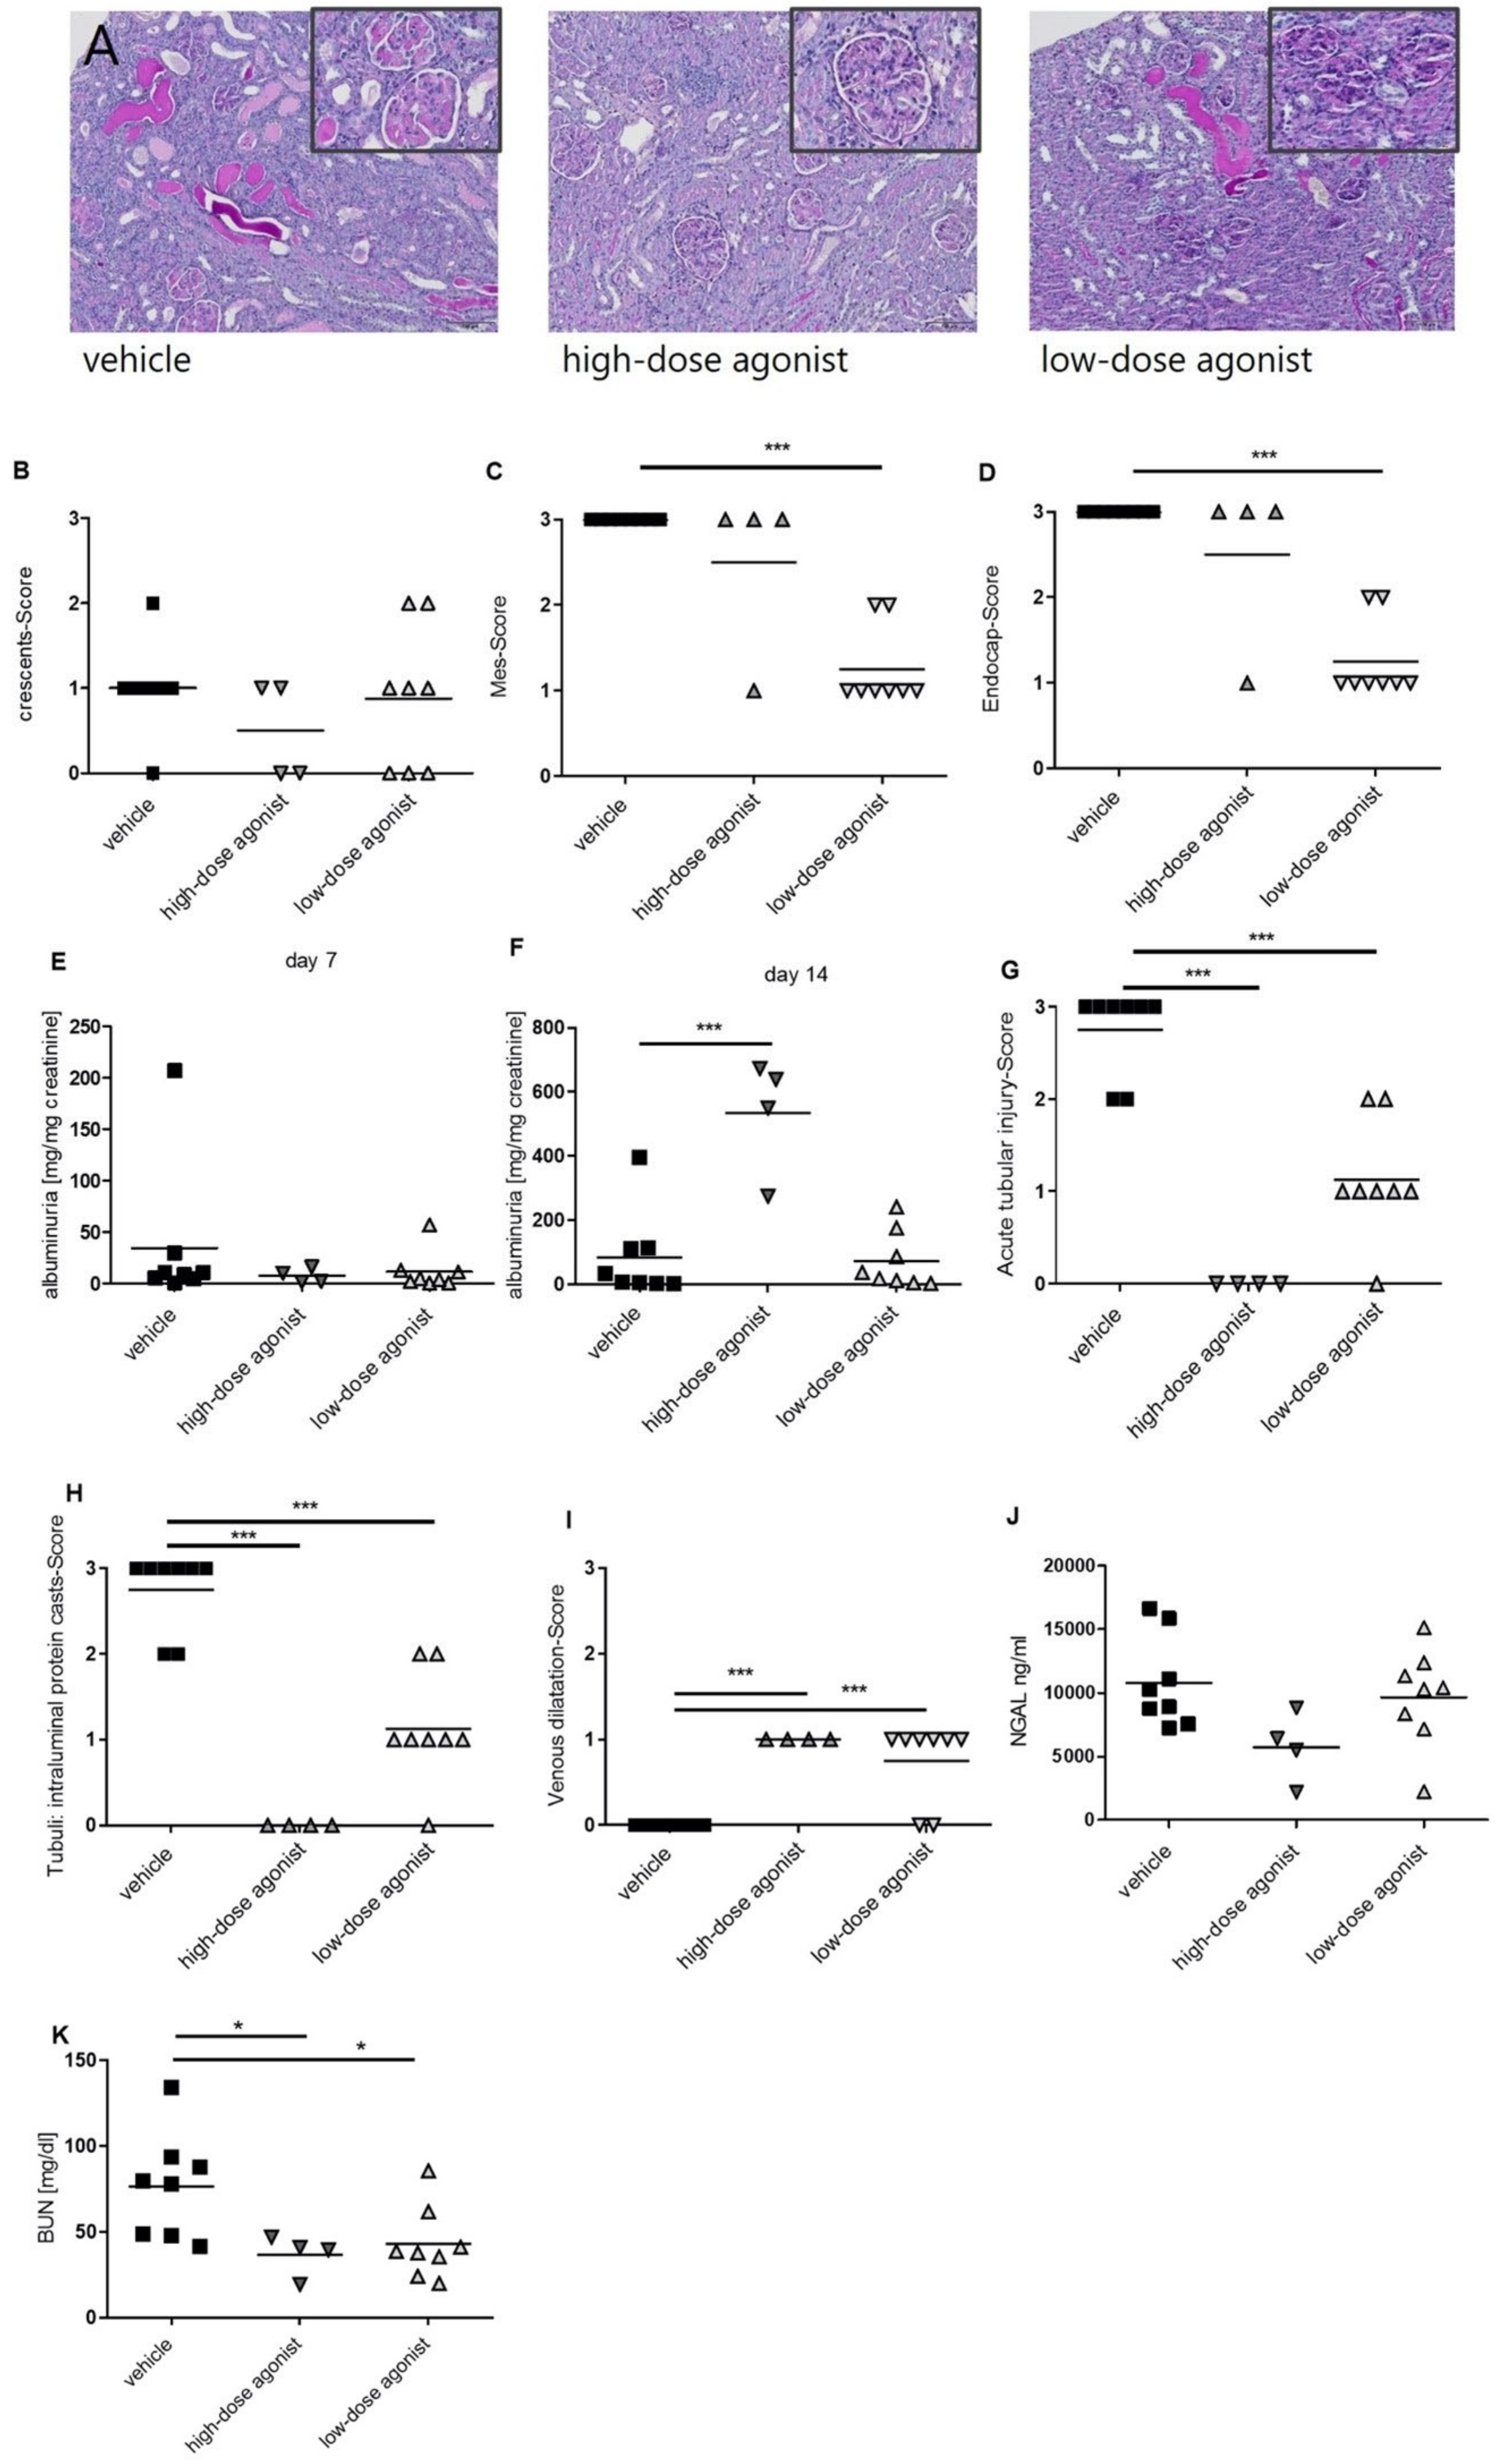
Abstract
1. Introduction
2. Materials and Methods
2.1. Animals and Study Design
2.2. Study Approval
2.3. Urine Albumin Quantification by ELISA and Urinary Creatinine Detection
2.4. Serum Lipocalin-2/NGAL ELISA
2.5. Assessment of Serum Blood Urea Nitrogen (BUN)
2.6. Immunohistochemistry Staining
2.7. Immunofluorescence Staining
2.8. IgG ELISA
2.9. Blood Pressure Measurement
2.10. RNA Isolation, Reverse Transcription (RT) Real-Time Polymerase Chain Reaction (PCR)
2.11. Cell Culture Experiments
2.12. Cell Cycle Determination
2.13. Proliferation Assay
2.14. cAMP Enzyme Immunoassay
2.15. Radioimmunoassay (RIA)
2.16. Statistical Analysis
3. Results
3.1. EP4 Agonism Mainly Improves Tubular Pathologies in NTS
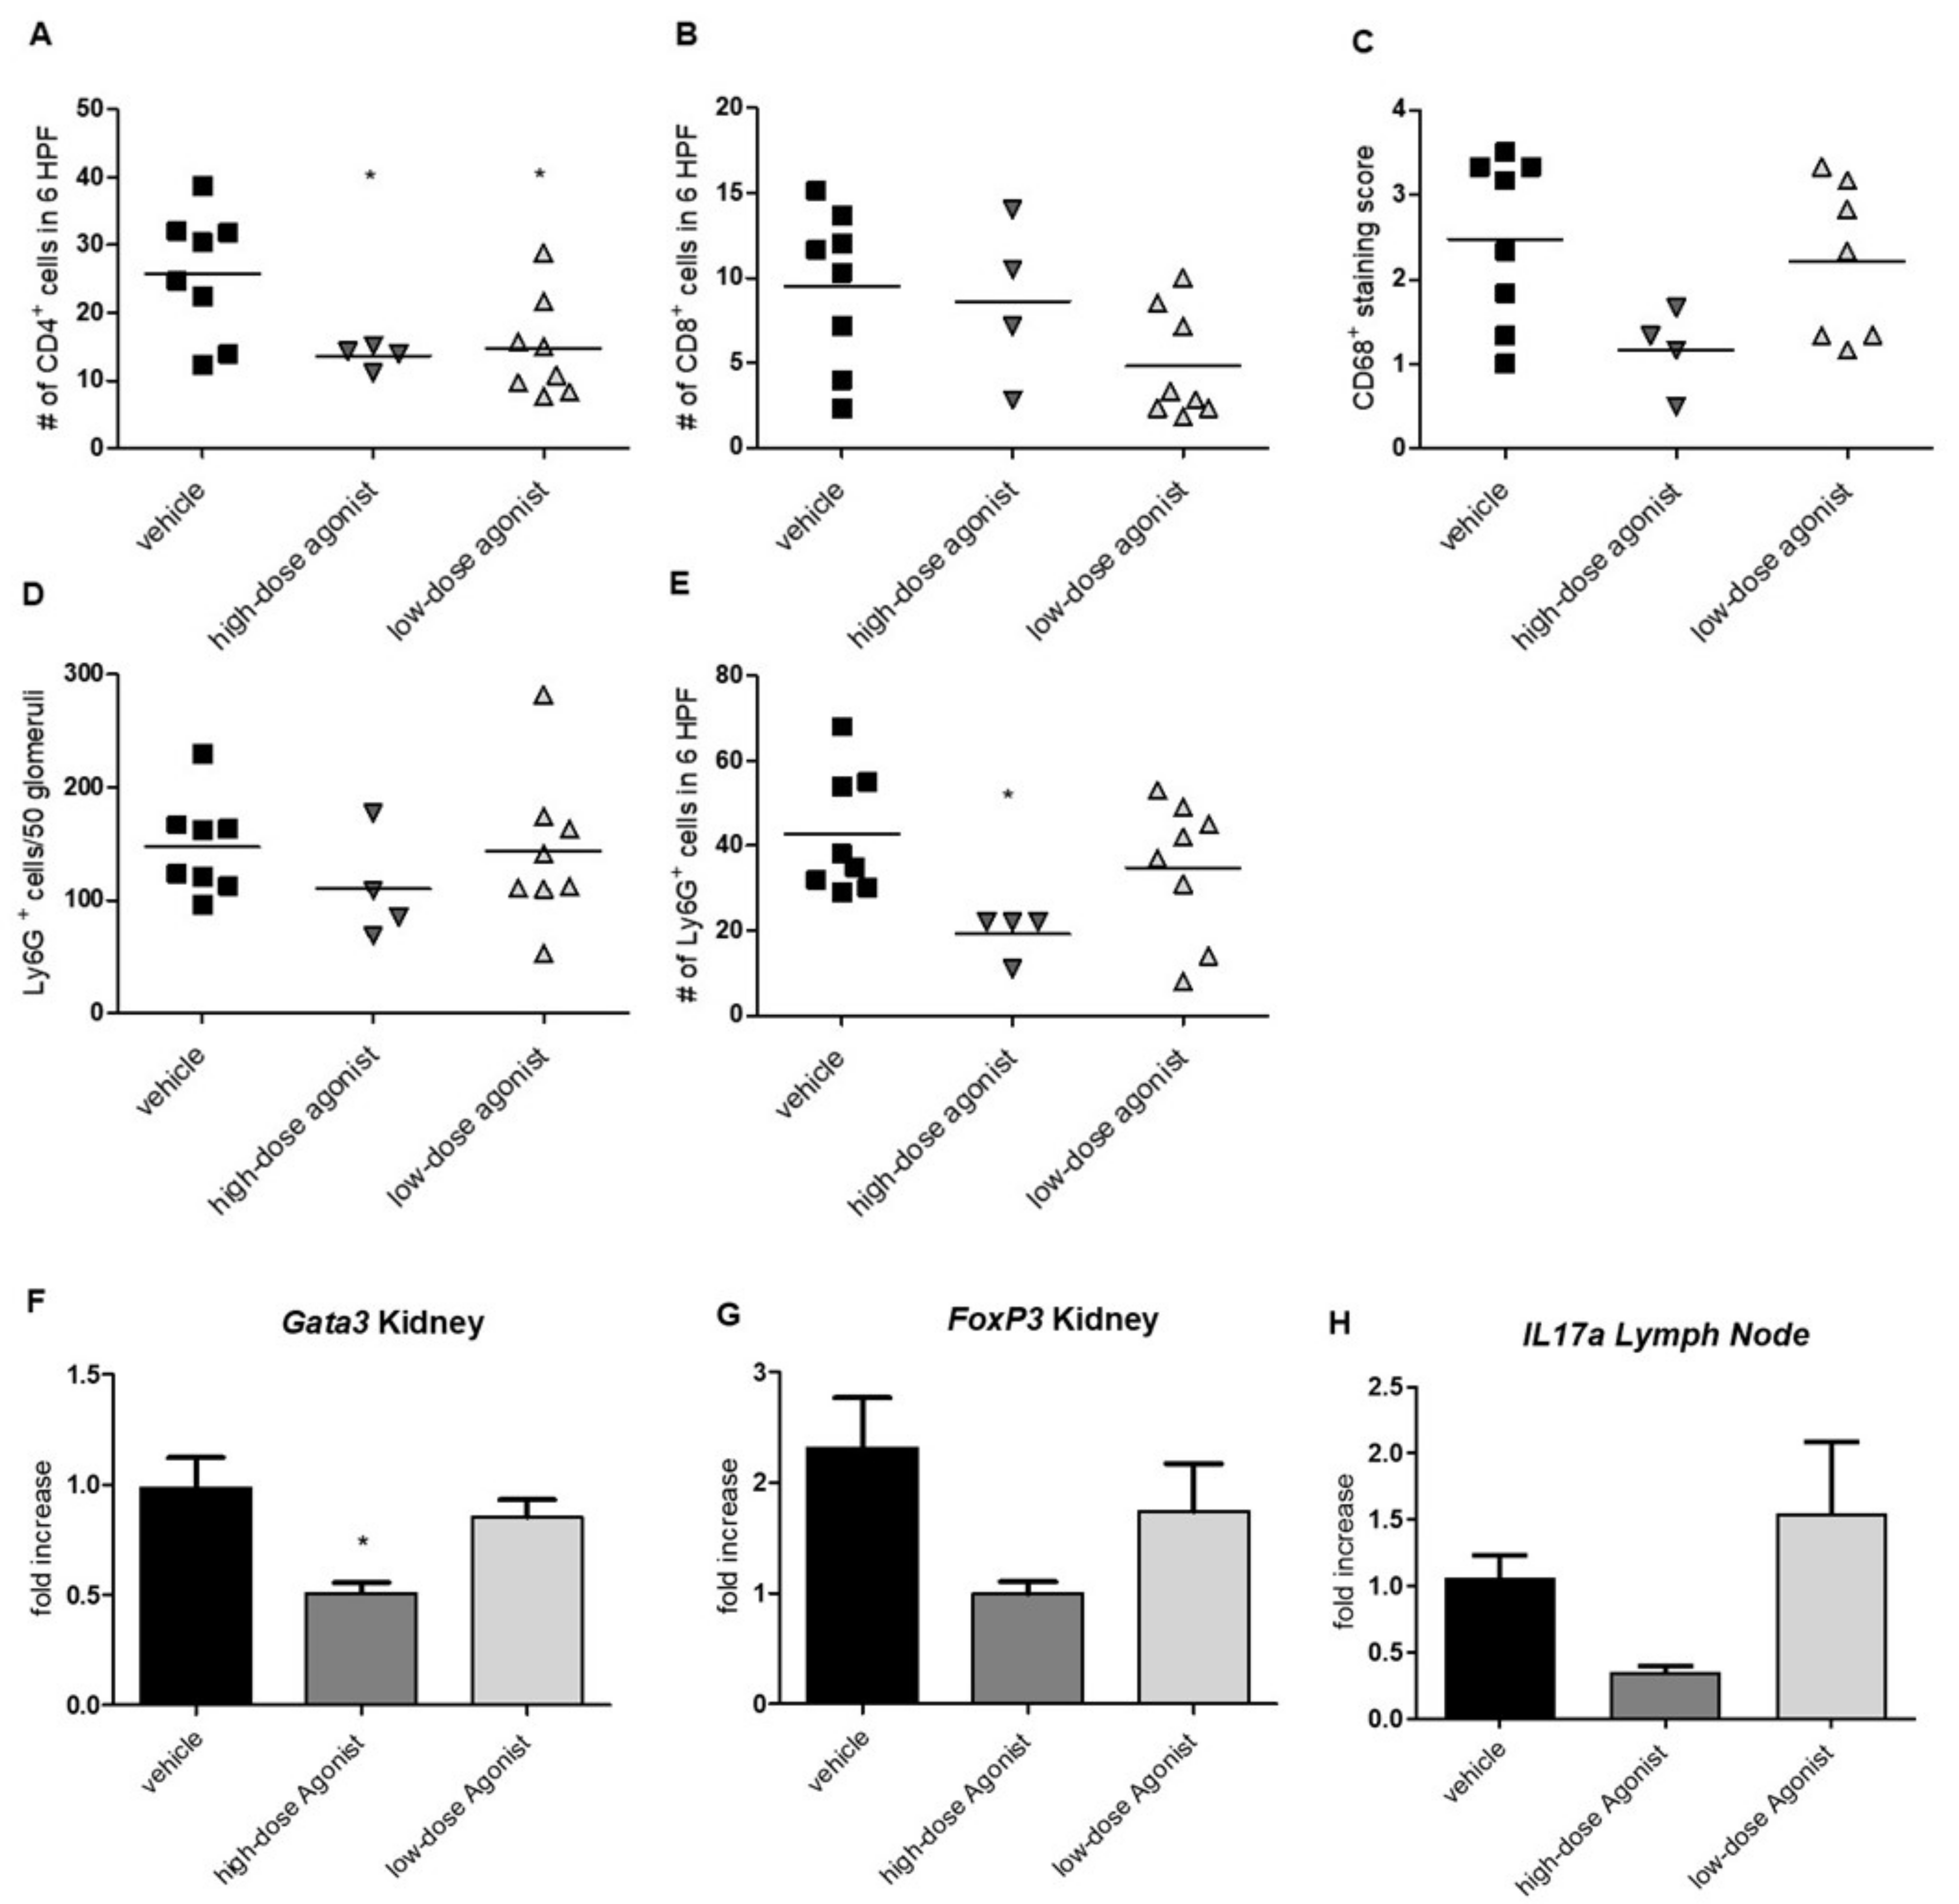
3.2. EP4 Agonism Reduces Renal CD4+ T-Cell and Neutrophil Infiltration in NTS
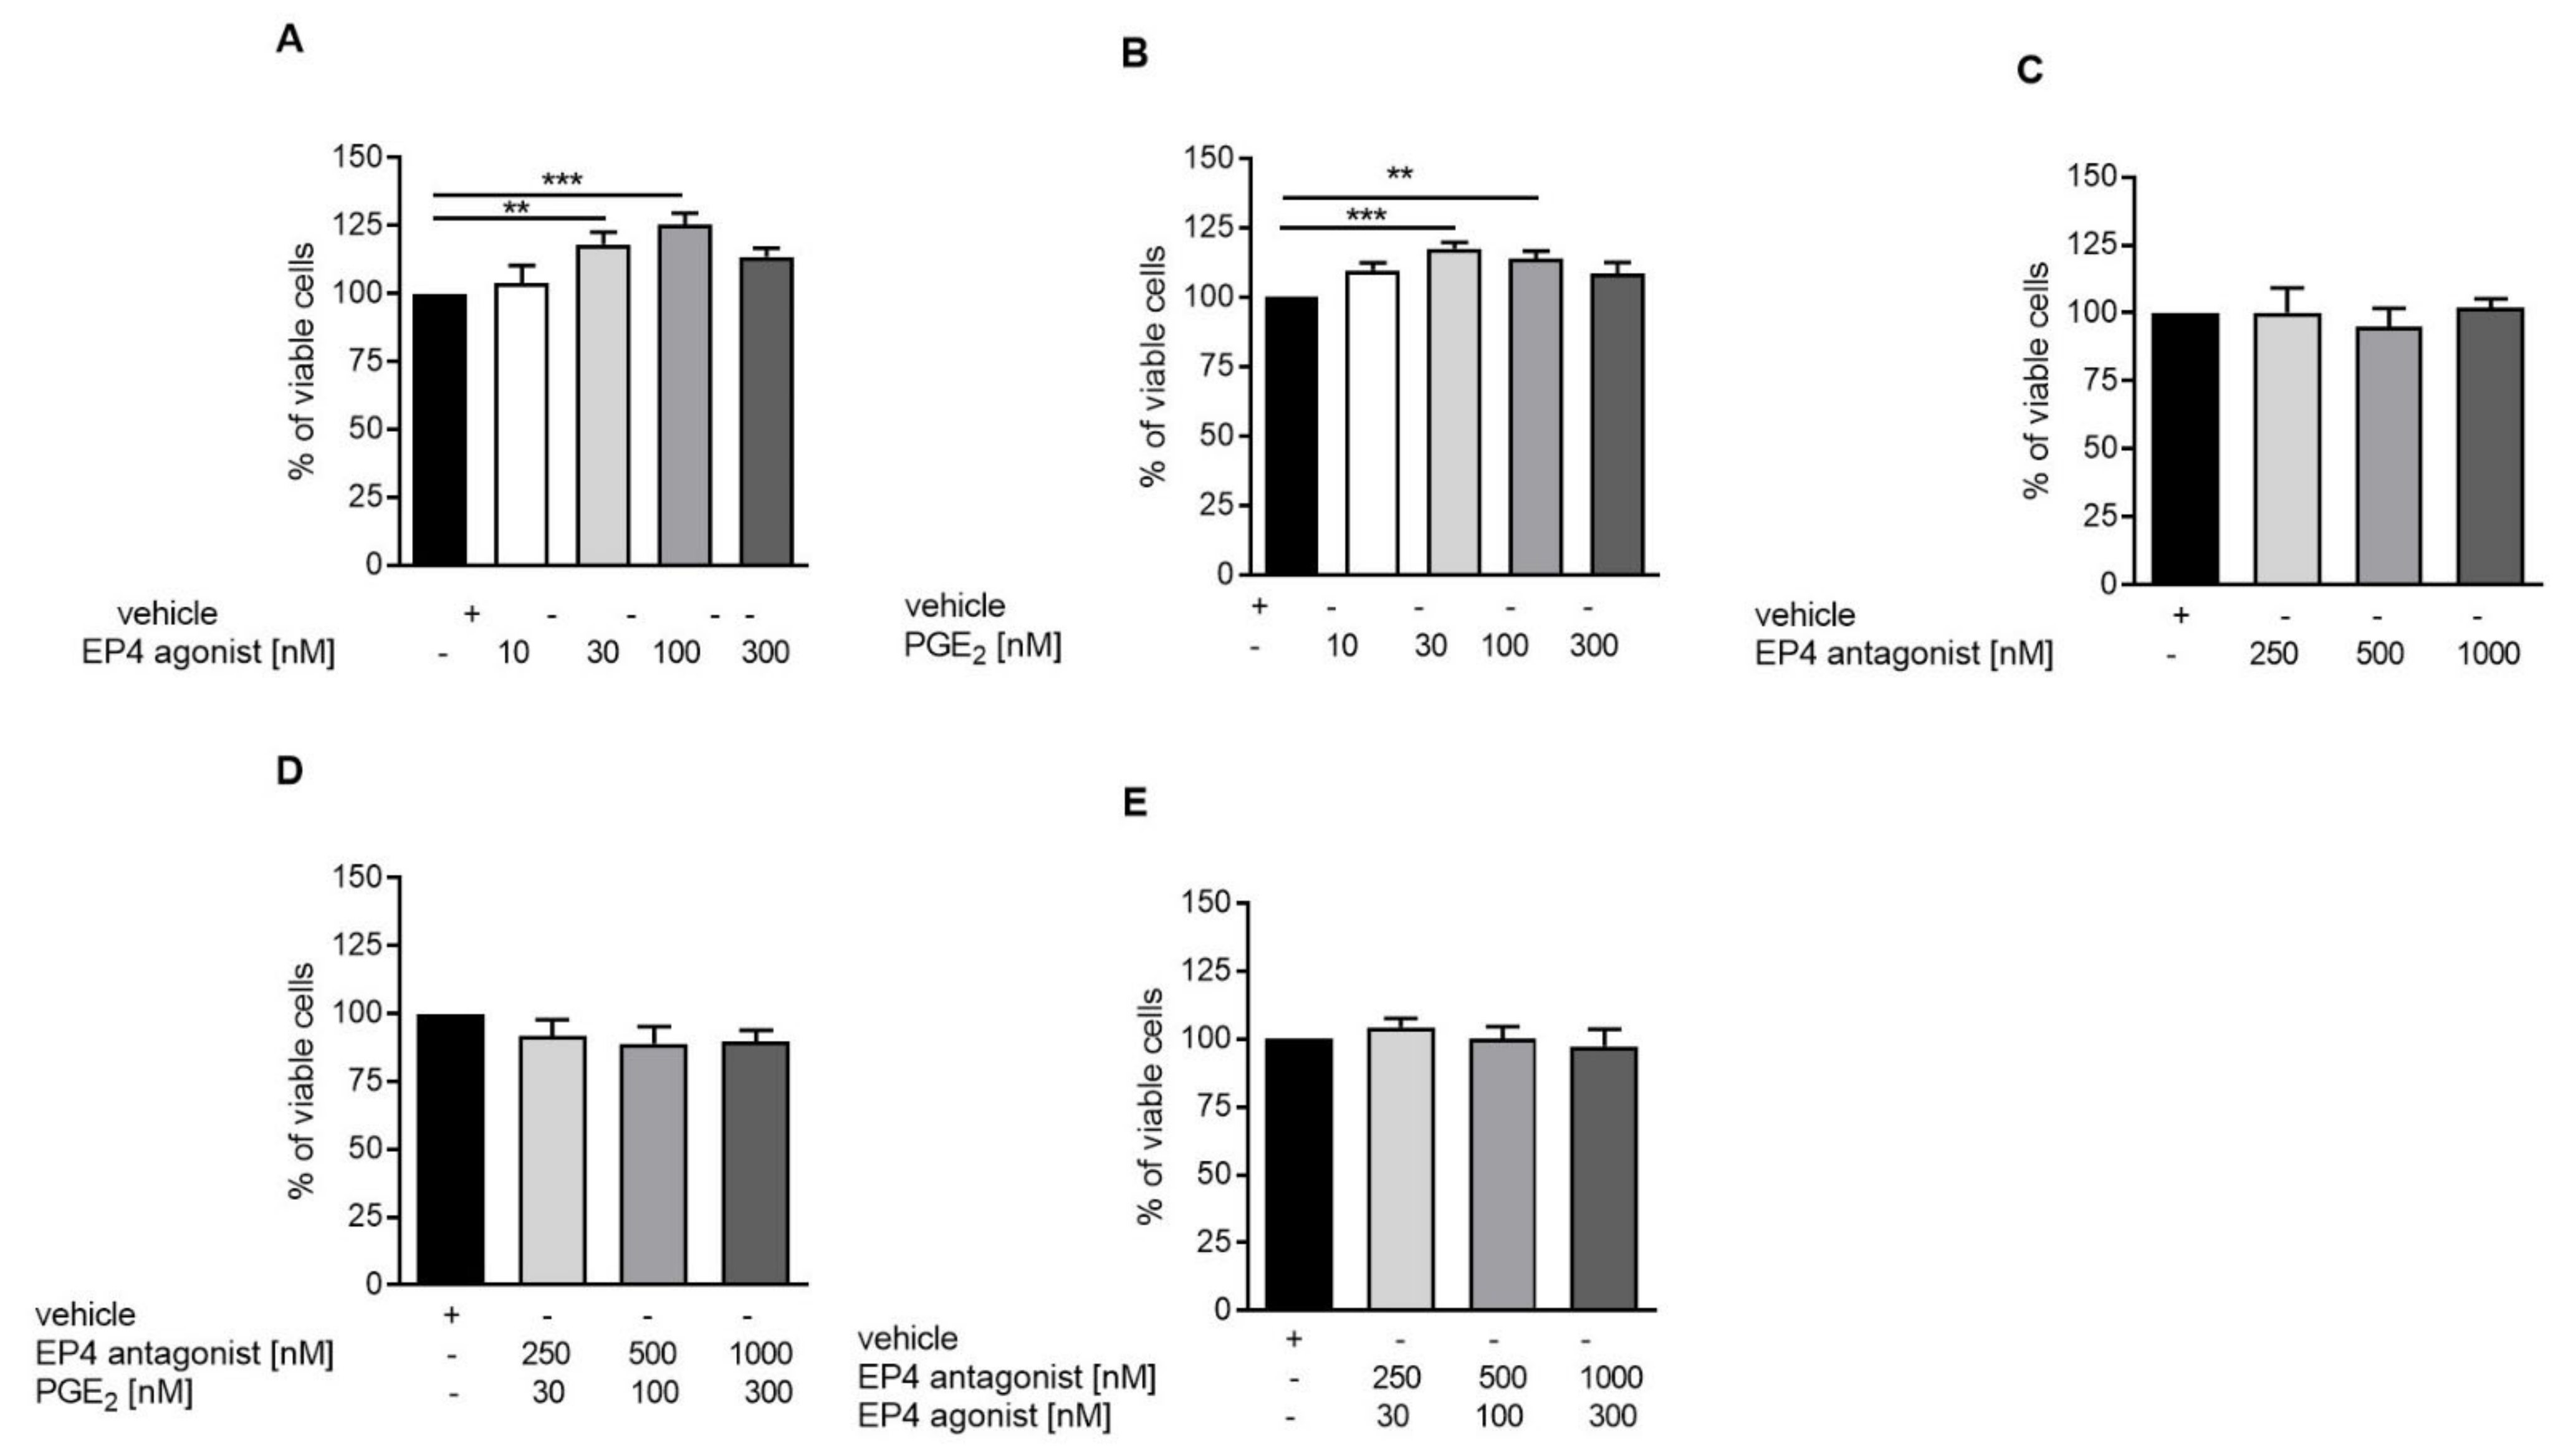
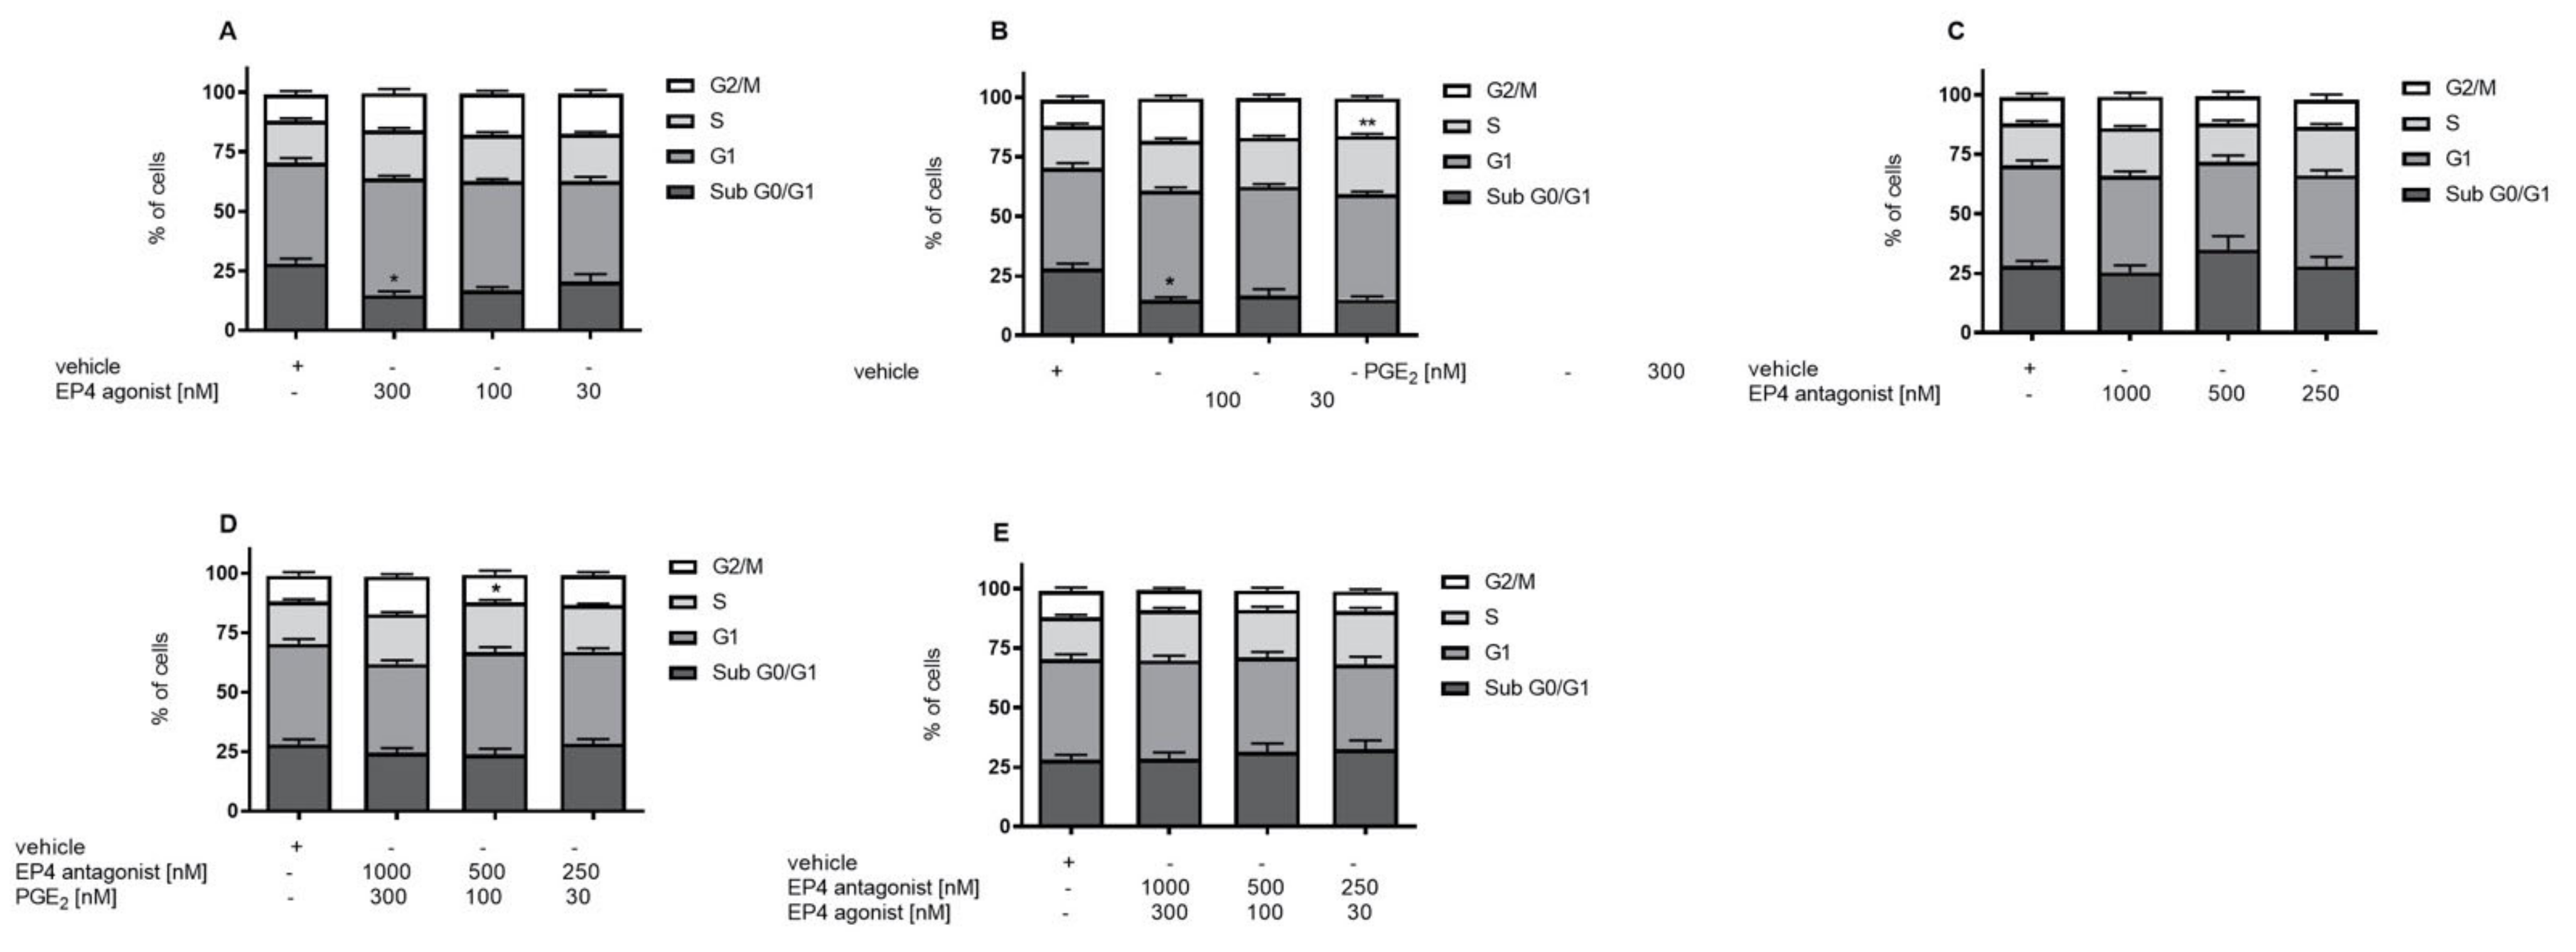
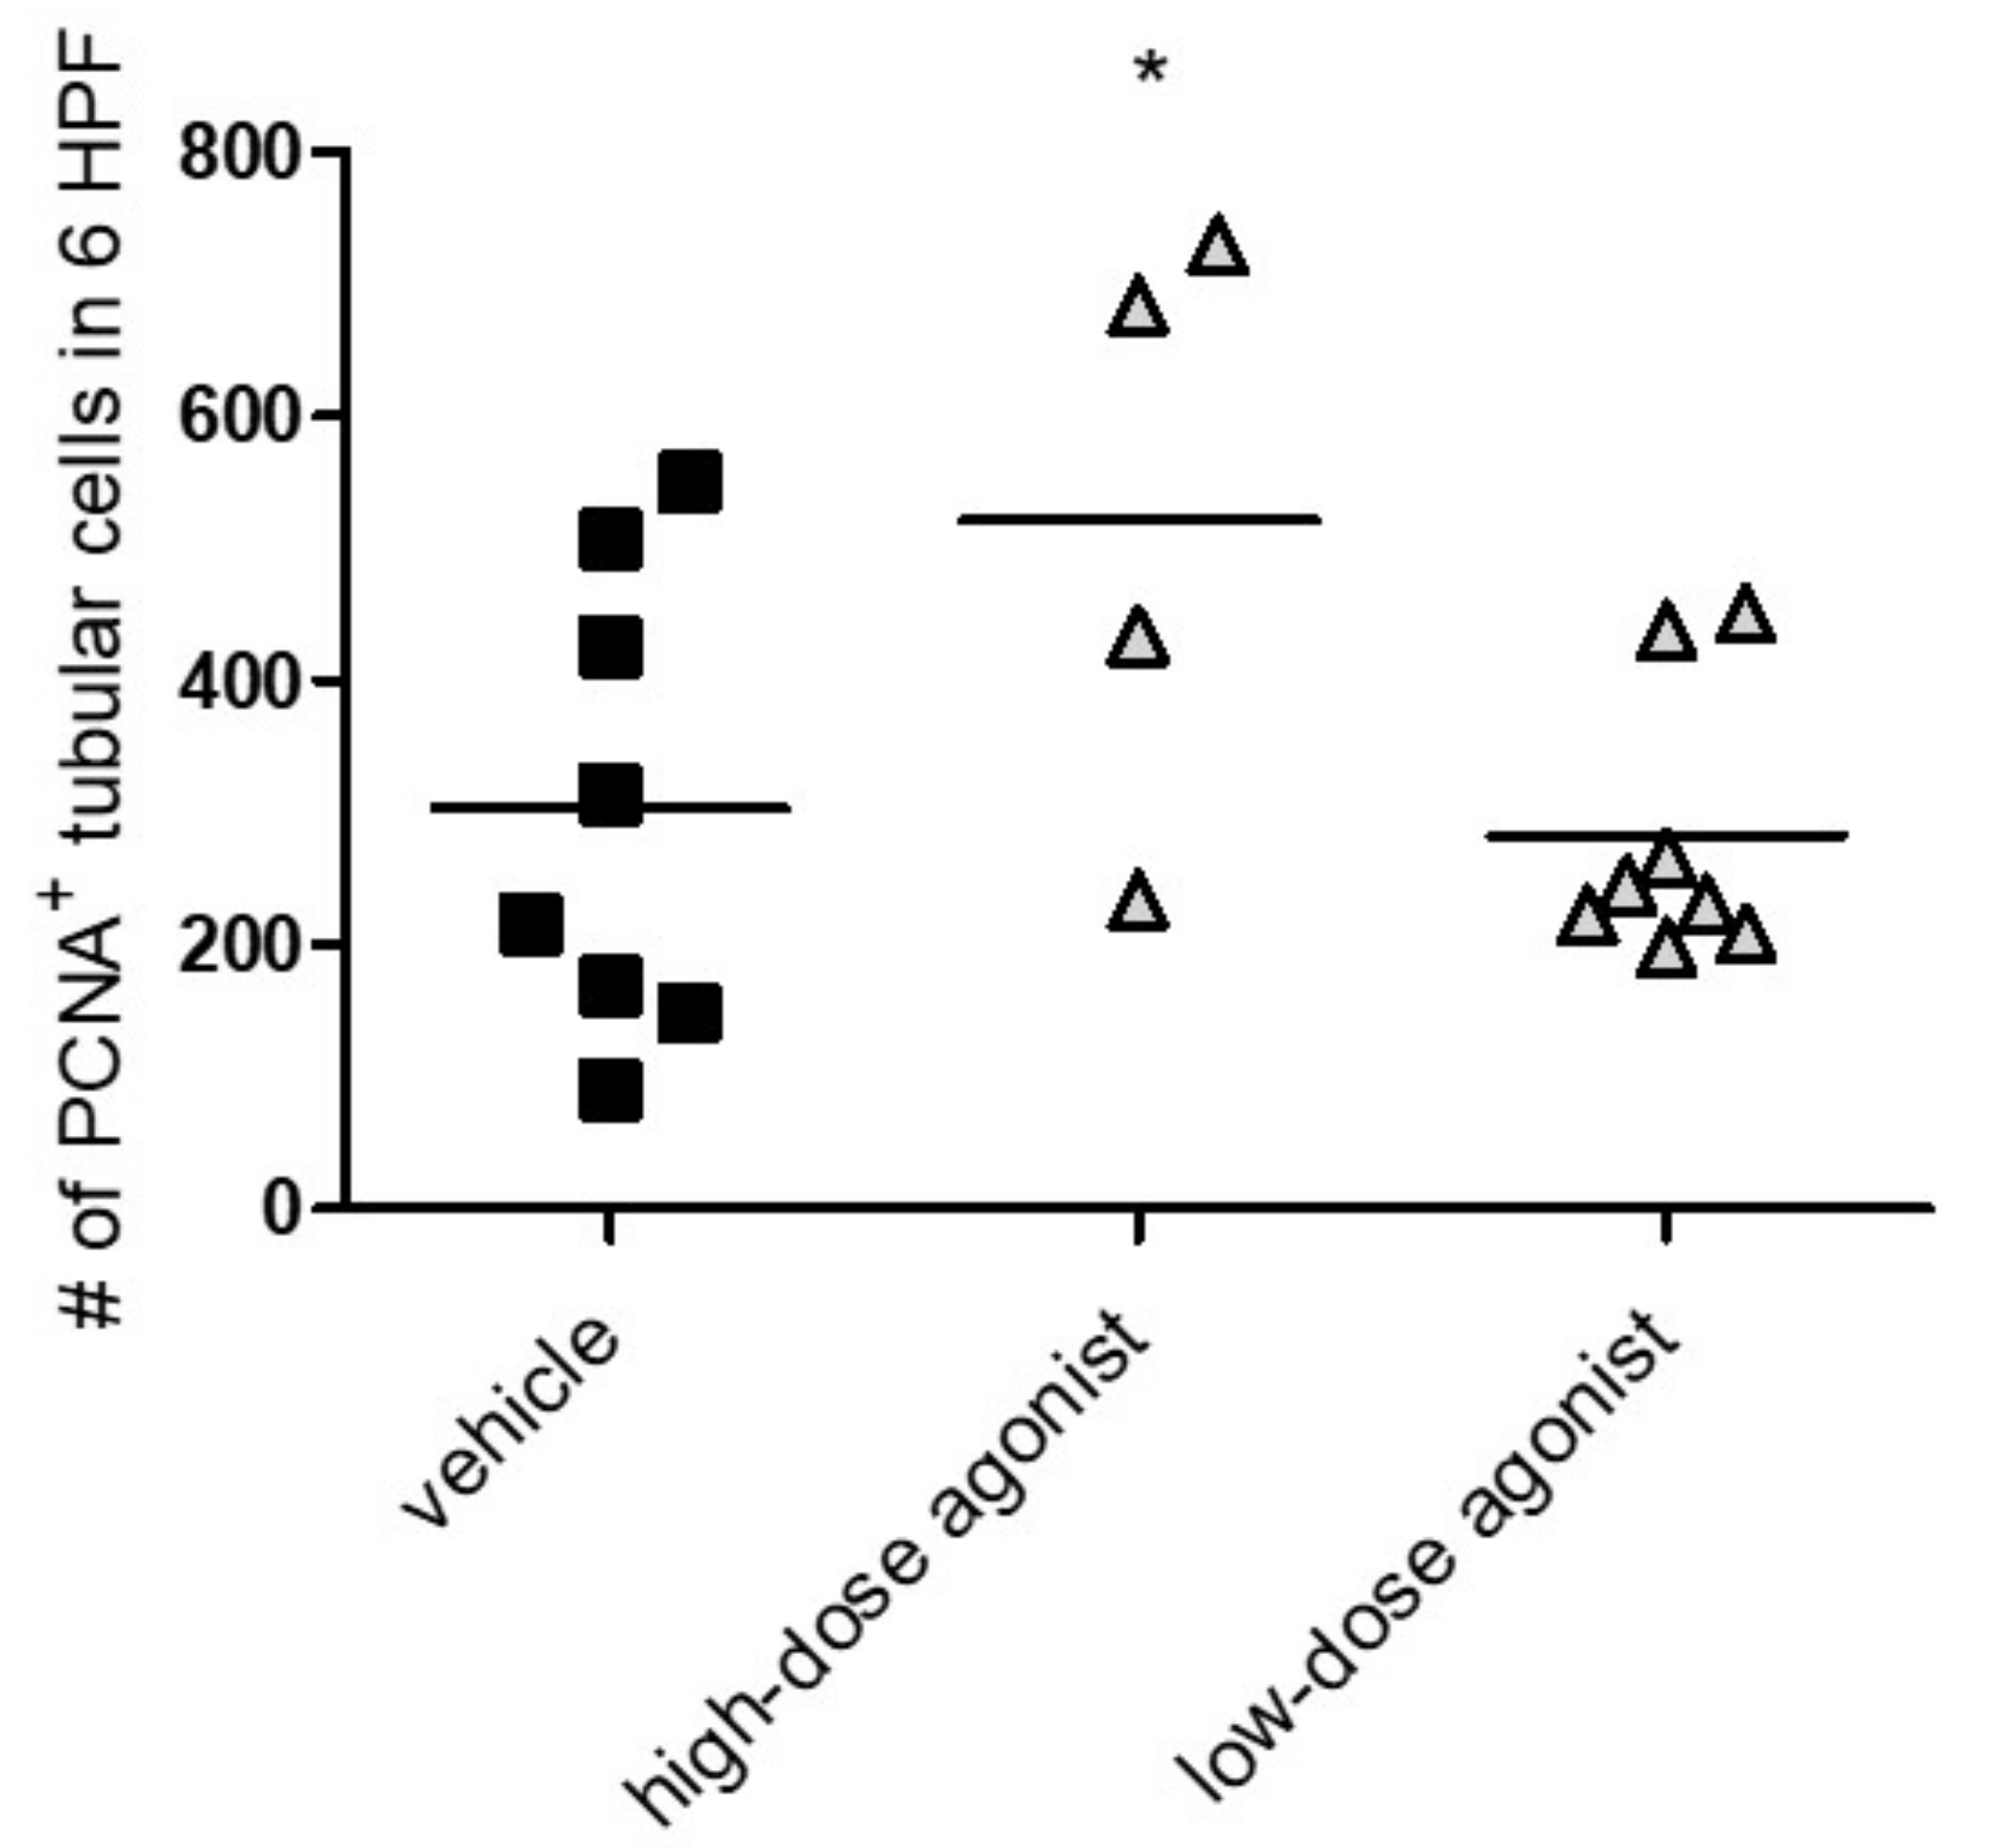
3.3. EP4 Agonism Increases Proliferation of Tubular Cells In Vivo and In Vitro
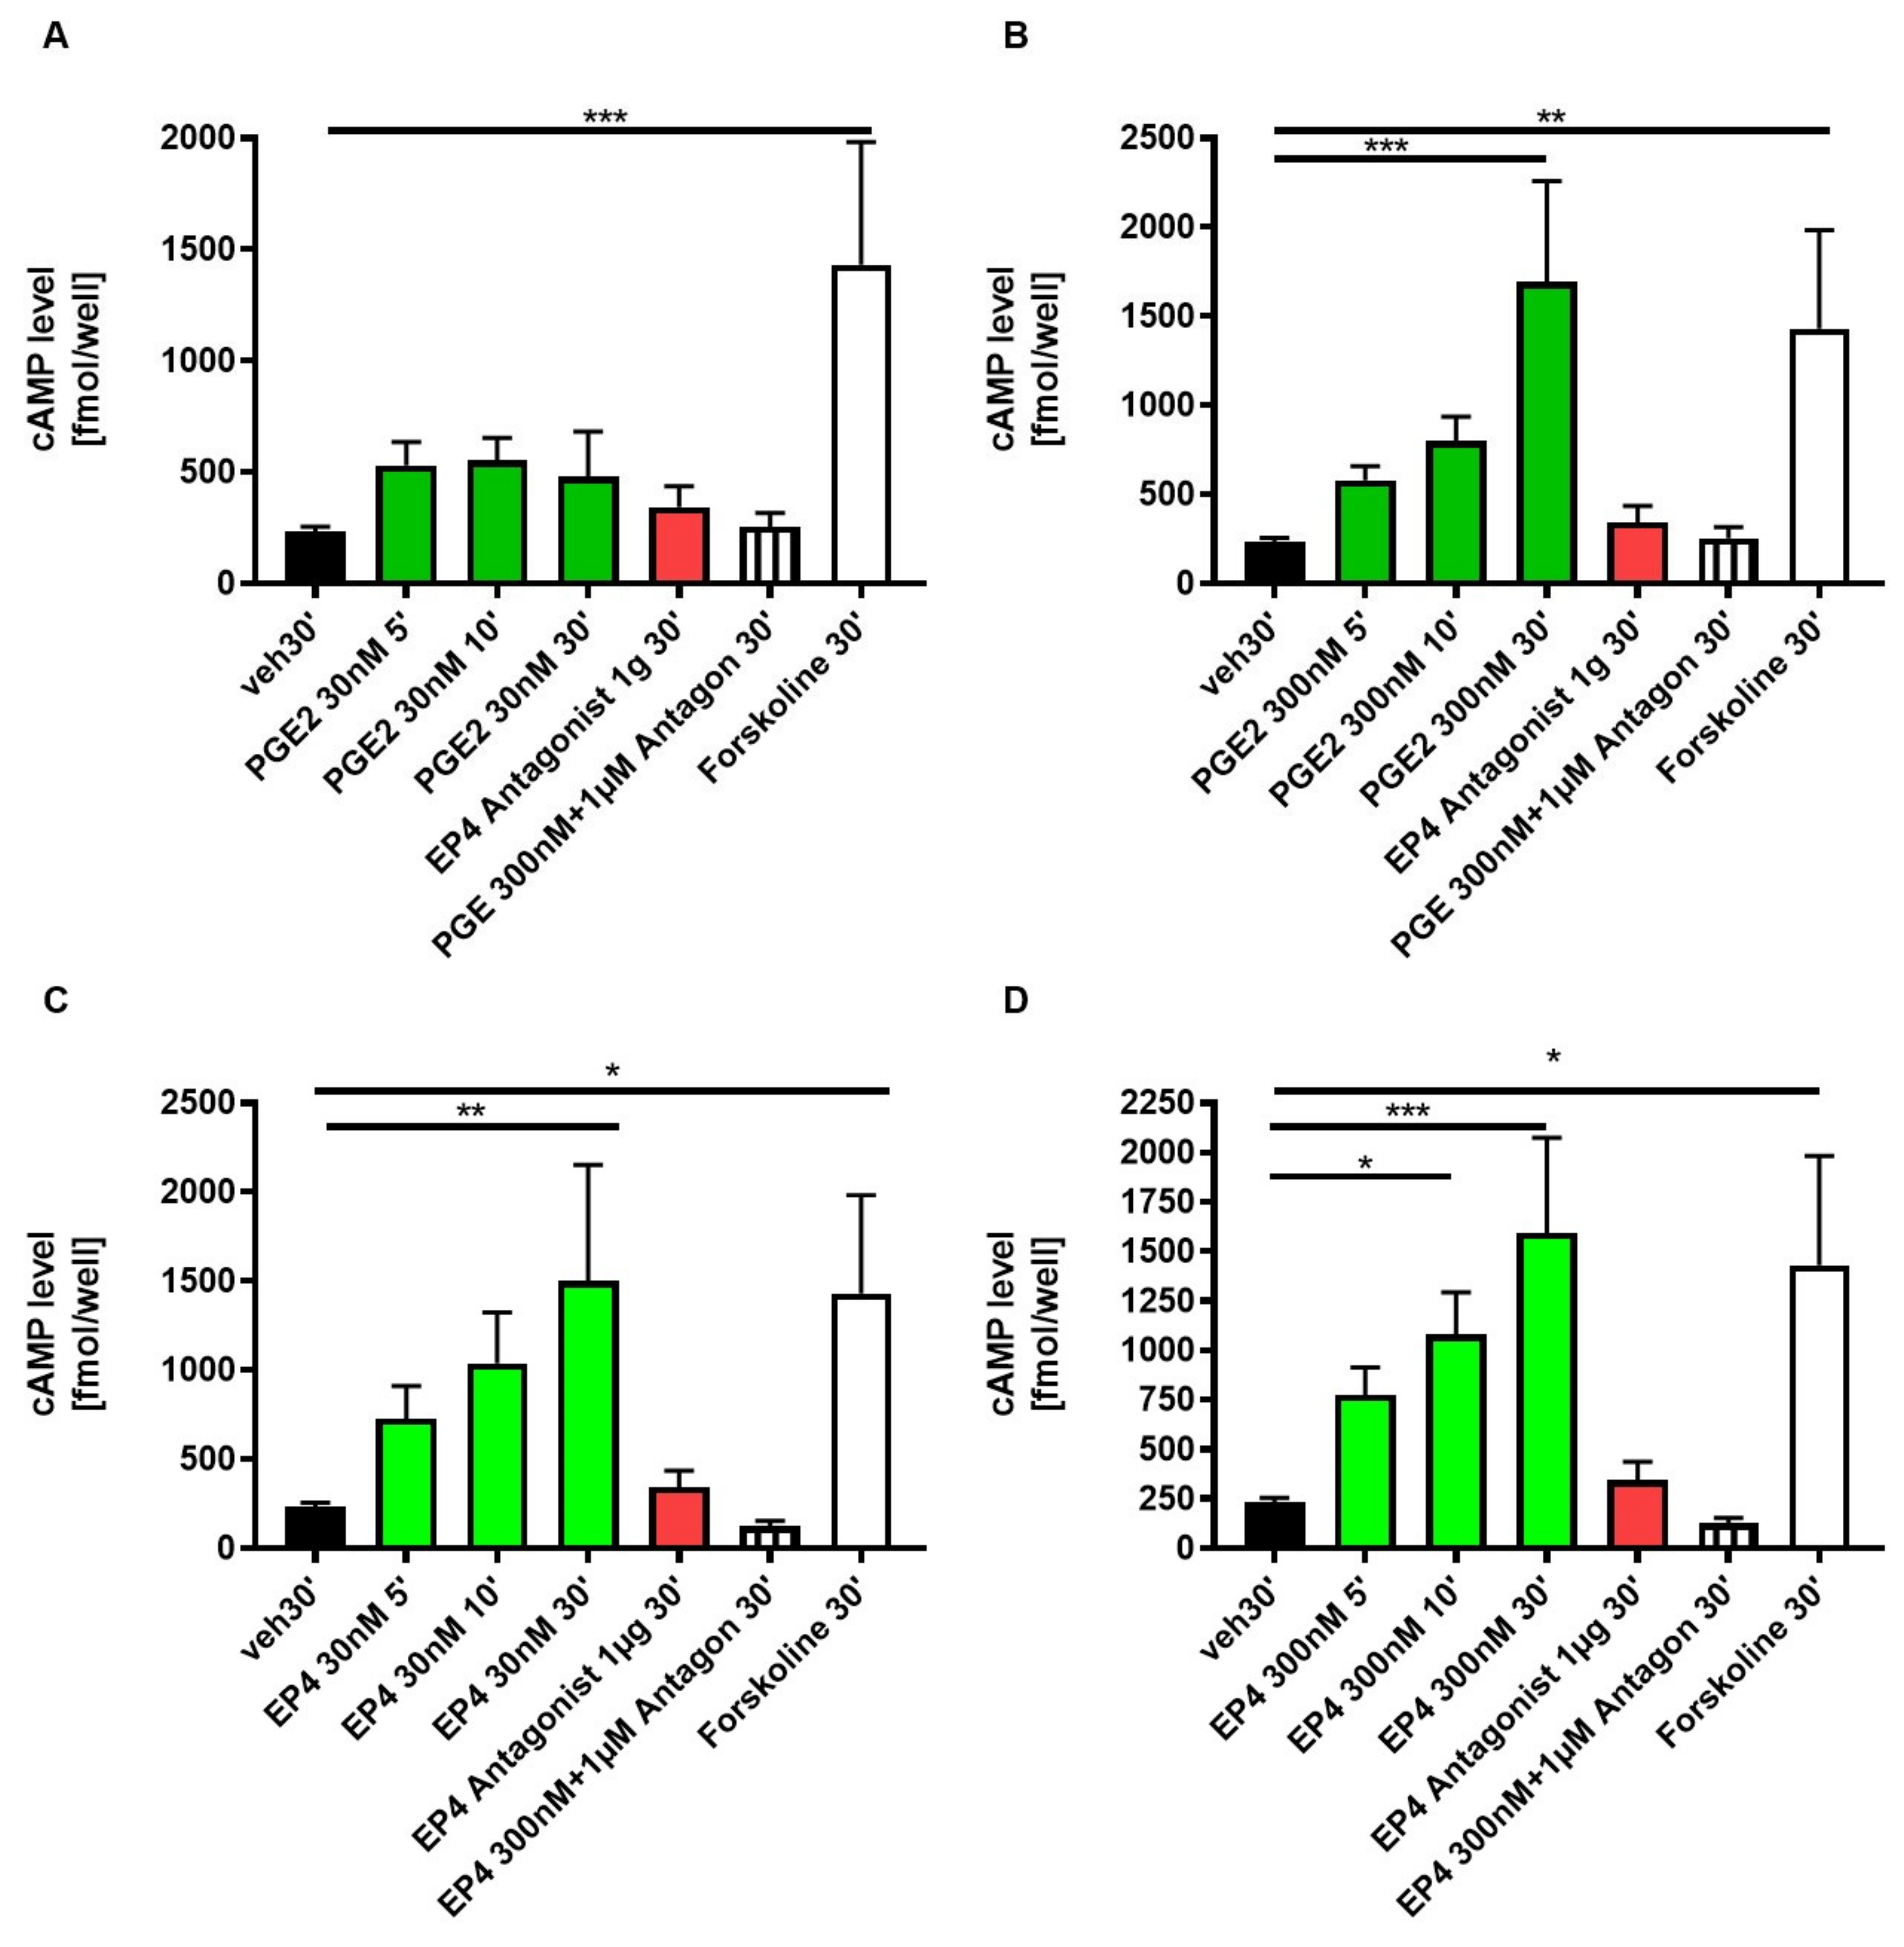
3.4. EP4 Agonism Increases cAMP Production in Tubular Cells In Vitro
4. Discussion
Supplementary Materials
Author Contributions
Funding
Institutional Review Board Statement
Informed Consent Statement
Data Availability Statement
Acknowledgments
Conflicts of Interest
References
- Konya, V.; Marsche, G.; Schuligoi, R.; Heinemann, A. E-type prostanoid receptor 4 (EP4) in disease and therapy. Pharmacol. Ther. 2013, 138, 485–502. [Google Scholar] [CrossRef]
- Nataraj, C.; Thomas, D.W.; Tilley, S.L.; Nguyen, M.T.; Mannon, R.; Koller, B.H.; Coffman, T.M. Receptors for prostaglandin E 2 that regulate cellular immune responses in the mouse. J. Clin. Investig. 2001, 108, 1229–1235. [Google Scholar] [CrossRef]
- Breyer, M.D.; Breyer, R.M. G Protein–Coupled Prostanoid Receptors and the Kidney. Ann. Rev. Physiol. 2001, 63, 579–605. [Google Scholar] [CrossRef]
- Breyer, R.M.; Clapp, L.; Coleman, R.A.; Giembycz, M.; Heinemann, A.; Hills, R.; Jones, R.L.; Narumiya, S.; Norel, X.; Pettipher, R.; et al. Prostanoid receptors (version 2020.4) in the IUPHAR/BPS Guide to Pharmacology Database. IUPHAR BPS Guid. Pharmacol. CITE 2020, 2020. [Google Scholar] [CrossRef]
- Alfranca, A.; Iñiguez, M.A.; Fresno, M.; Redondo, J.M.; Escudero, M.F. Prostanoid signal transduction and gene expression in the endothelium: Role in cardiovascular diseases. Cardiovasc. Res. 2006, 70, 446–456. [Google Scholar] [CrossRef]
- Coleman, R.A.; Woodrooffe, A.J.; Clark, K.L.; Toris, C.B.; Fan, S.; Wang, J.W.; Woodward, D.F. The affinity, intrinsic activity and selectivity of a structurally novel prostaglandin EP 2 receptor agonist at human prostanoid receptors. Br. J. Pharmacol. 2019, 176, 687–698. [Google Scholar] [CrossRef]
- Morath, R.; Klein, T.; Seyberth, H.W.; Nüsing, R.M. Immunolocalization of the Four Prostaglandin E 2 Receptor. J. Am. Soc. Nephrol. 1999, 10, 1851–1860. [Google Scholar] [PubMed]
- Nasrallah, R.; Hébert, R.L. Prostacyclin signaling in the kidney: Implications for health and disease. Am. J. Physiol. Ren. Physiol. 2005, 289, 235–246. [Google Scholar] [CrossRef]
- Saeki, T.; Ota, T.; Aihara, M.; Araie, M.; Zheng, Y.; Xiang, F.; Huang, W.; Huang, G.; Yin, Q.; He, M. Effects of Prostanoid EP Agonists on Mouse Intraocular Pressure. Investig. Opthalmology Vis. Sci. 2009, 50, 2201–2208. [Google Scholar] [CrossRef] [PubMed]
- Artinger, K.; Kirsch, A.H.; Aringer, I.; Moschovaki-Filippidou, F.; Eller, P.; Rosenkranz, A.R.; Eller, K. Innate and adaptive immunity in experimental glomerulonephritis: A pathfinder tale. Pediatr. Nephrol. 2017, 32, 943–947. [Google Scholar] [CrossRef] [PubMed]
- Eller, K.; Schroll, A.; Banas, M.; Kirsch, A.H.; Huber, J.M.; Nairz, M.; Skvortsov, S.; Weiss, G.; Rosenkranz, A.R.; Theurl, I. Lipocalin-2 Expressed in Innate Immune Cells Is an Endogenous Inhibitor of Inflammation in Murine Nephrotoxic Serum Nephritis. PLoS ONE 2013, 8, e67693. [Google Scholar] [CrossRef] [PubMed]
- Obermajer, N.; Kalinski, P. Generation of myeloid-derived suppressor cells using prostaglandin E2. Transplant. Res. 2012, 1, 15. [Google Scholar] [CrossRef]
- Tang, E.H.; Libby, P.; Vanhoutte, P.M.; Xu, A. Anti-inflammation Therapy by Activation of Prostaglandin EP4 Receptor in Cardiovascular and Other Inflammatory Diseases. J. Cardiovasc. Pharmacol. 2012, 59, 116–123. [Google Scholar] [CrossRef] [PubMed]
- Esaki, Y.; Li, Y.; Sakata, D.; Yao, C.; Segi-Nishida, E.; Matsuoka, T.; Fukuda, K.; Narumiya, S. Dual roles of PGE2-EP4 signaling in mouse experimental autoimmune encephalomyelitis. Proc. Natl. Acad. Sci. USA 2010, 107, 12233–12238. [Google Scholar] [CrossRef]
- Eller, K.; Weber, T.; Pruenster, M.; Wolf, A.M.; Mayer, G.; Rosenkranz, A.R.; Rot, A. CCR7 Deficiency Exacerbates Injury in Acute Nephritis Due to Aberrant Localization of Regulatory T Cells. J. Am. Soc. Nephrol. 2009, 21, 42–52. [Google Scholar] [CrossRef] [PubMed]
- Schlondorff, D.; Ardaillou, R. Prostaglandins and other arachidonic acid metabolites in the kidney. Kidney Int. 1986, 29, 108–119. [Google Scholar] [CrossRef]
- Dworkin, L.D.; Ichikawa, I.; Brenner, B.M. Hormonal modulation of glomerular function. Am. J. Physiol. Physiol. 1983, 244, F95–F104. [Google Scholar] [CrossRef] [PubMed]
- Breyer, M.D.; Davis, L.; Jacobson, H.R.; Breyer, R.M. Differential localization of prostaglandin E receptor subtypes in human kidney. Am. J. Physiol. Physiol. 1996, 270, F912–F918. [Google Scholar] [CrossRef]
- Pöschke, A.; Kern, N.; Maruyama, T.; Pavenstädt, H.; Narumiya, S.; Jensen, B.L.; Nüsing, R.M. The PGE2-EP4 receptor is necessary for stimulation of the renin-angiotensin-aldosterone system in response to low dietary salt intake in vivo. Am. J. Physiol. Physiol. 2012, 303, F1435–F1442. [Google Scholar] [CrossRef]
- Suganami, T.; Mori, K.; Tanaka, I.; Mukoyama, M.; Sugawara, A.; Makino, H.; Muro, S.; Yahata, K.; Ohuchida, S.; Maruyama, T.; et al. Role of Prostaglandin E Receptor EP 1 Subtype in the Development of Renal Injury in Genetically Hypertensive Rats. Hypertension 2003, 42, 1183–1190. [Google Scholar] [CrossRef]
- Hristovska, A.-M.; Rasmussen, L.E.; Hansen, P.B.; Nielsen, S.S.; Nuüsing, R.M.; Narumiya, S.; Vanhoutte, P.; Skøtt, O.; Jensen, B.L. Prostaglandin E2Induces Vascular Relaxation by E-Prostanoid 4 Receptor-Mediated Activation of Endothelial Nitric Oxide Synthase. Hypertension 2007, 50, 525–530. [Google Scholar] [CrossRef]
- Friis, U.G.; Stubbe, J.; Uhrenholt, T.R.; Svenningsen, P.; Nüsing, R.M.; Skøtt, O.; Jensen, B.L. Prostaglandin E 2 EP2 and EP4 receptor activation mediates cAMP-dependent hyperpolarization and exocytosis of renin in juxtaglomerular cells. Am. J. Physiol. Ren. Physiol. 2005, 289, 989–997. [Google Scholar] [CrossRef] [PubMed]
- Narumiya, S.; Sugimoto, Y.; Ushikubi, F. Prostanoid Receptors: Structures, Properties, and Functions. Physiol. Rev. 1999, 79, 1193–1226. [Google Scholar] [CrossRef]
- Zhang, Y.; Daaka, Y. PGE2 promotes angiogenesis through EP4 and PKA Cγ pathway. Blood 2011, 118, 5355–5364. [Google Scholar] [CrossRef] [PubMed]
- Yang, T.; Du, Y. Distinct Roles of Central and Peripheral Prostaglandin E2 and EP Subtypes in Blood Pressure Regulation. Am. J. Hypertens. 2012, 25, 1042–1049. [Google Scholar] [CrossRef] [PubMed]
- Sparks, M.A.; Coffman, T.M. The EP4 Receptor for Prostaglandin E2 in Glomerular Disease: A Good Receptor Turned Bad? J. Am. Soc. Nephrol. 2010, 21, 1597–1599. [Google Scholar] [CrossRef]
- Wang, L.; Flannery, P.J.; Rosenberg, P.B.; Fields, T.A.; Spurney, R.F. Gq-Dependent Signaling Upregulates COX2 in Glomerular Podocytes. J. Am. Soc. Nephrol. 2008, 19, 2108–2118. [Google Scholar] [CrossRef]
- Stitt-Cavanagh, E.M.; Faour, W.H.; Takami, K.; Carter, A.; Vanderhyden, B.; Guan, Y.; Schneider, A.; Breyer, M.D.; Kennedy, C.R. A Maladaptive Role for EP4 Receptors in Podocytes. J. Am. Soc. Nephrol. 2010, 21, 1678–1690. [Google Scholar] [CrossRef]
- Aringer, I.; Artinger, K.; Kirsch, A.H.; Schabhüttl, C.; Jandl, K.; Bärnthaler, T.; Mooslechner, A.A.; Herzog, S.A.; Uhlig, M.; Kirsch, A.; et al. Blockade of prostaglandin E2 receptor 4 ameliorates nephrotoxic serum nephritis. Am. J. Physiol. Physiol. 2018, 315, F1869–F1880. [Google Scholar] [CrossRef]
- Nagamatsu, T.; Imai, H.; Yokoi, M.; Nishiyama, T.; Hirasawa, Y.; Nagao, T.; Suzuki, Y. Protective effect of prostaglandin EP4-receptor agonist on anti-glomerular basement membrane antibody-associated nephritis. J. Pharmacol. Sci. 2006, 102, 182–188. [Google Scholar] [CrossRef]
- Kilkenny, C.; Browne, W.J.; Cuthill, I.C.; Emerson, M.; Altman, D.G. Improving Bioscience Research Reporting: The ARRIVE Guidelines for Reporting Animal Research. Animals 2014, 4, 35–44. [Google Scholar] [CrossRef]
- McGrath, J.C.; Lilley, E. Implementing guidelines on reporting research using animals (ARRIVE etc.): New requirements for publication in BJP. Br. J. Pharmacol. 2015, 172, 3189–3193. [Google Scholar] [CrossRef] [PubMed]
- Gesek, F.A.; Friedman, P.A. Mechanism of calcium transport stimulated by chlorothiazide in mouse distal convoluted tubule cells. J. Clin. Investig. 1992, 90, 429–438. [Google Scholar] [CrossRef] [PubMed]
- Ulcar, R.; Peskar, B.A.; Schuligoi, R.; Heinemann, A.; Kessler, H.H.; Santner, B.I.; Amann, R. Cyclooxygenase inhibition in human monocytes increases endotoxin-induced TNFα without affecting cyclooxygenase-2 expression. Eur. J. Pharmacol. 2004, 501, 9–17. [Google Scholar] [CrossRef]
- Yokoyama, U.; Iwatsubo, K.; Umemura, M.; Fujita, T.; Ishikawa, Y. The Prostanoid EP4 Receptor and Its Signaling Pathway. Pharmacol. Rev. 2013, 65, 1010–1052. [Google Scholar] [CrossRef]
- Nasrallah, R.; Hassouneh, R.; Zimpelmann, J.; Karam, A.J.; Thibodeau, J.-F.; Burger, D.; Burns, K.D.; Kennedy, C.R.; Hébert, R.L. Prostaglandin E2 increases proximal tubule fluid reabsorption, and modulates cultured proximal tubule cell responses via EP1 and EP4 receptors. Lab. Investig. 2015, 95, 1044–1055. [Google Scholar] [CrossRef]
- Nasrallah, R.; Hassouneh, R.; Hébert, R.L. Chronic kidney disease: Targeting prostaglandin E2 receptors. Am. J. Physiol. Physiol. 2014, 307, F243–F250. [Google Scholar] [CrossRef]
- Harris, R.C.; Zhang, M.-Z. Cyclooxygenase Metabolites in the Kidney. Compr. Physiol. 2011, 1, 1729–1758. [Google Scholar] [CrossRef]
- Legler, D.F.; Bruckner, M.; Allmen, E.U.-V.; Krause, P. Prostaglandin E2 at new glance: Novel insights in functional diversity offer therapeutic chances. Int. J. Biochem. Cell Biol. 2010, 42, 198–201. [Google Scholar] [CrossRef] [PubMed]
- Foudi, N.; Kotelevets, L.; Gomez, I.; Louedec, L.; Longrois, D.; Chastre, E.; Norel, X. Differential reactivity of human mammary artery and saphenous vein to prostaglandin E2: Implication for cardiovascular grafts. Br. J. Pharmacol. 2011, 163, 826–834. [Google Scholar] [CrossRef]
- Sugimoto, Y.; Narumiya, S. Prostaglandin E Receptors. J. Biol. Chem. 2007, 282, 11613–11617. [Google Scholar] [CrossRef]
- Kvirkvelia, N.; McMenamin, M.; Chaudhary, K.; Bartoli, M.; Madaio, M.P. Prostaglandin E2 promotes cellular recovery from established nephrotoxic serum nephritis in mice, prosurvival, and regenerative effects on glomerular cells. Am. J. Physiol. Physiol. 2013, 304, F463–F470. [Google Scholar] [CrossRef]
- Lotan, D.; Kaplan, B.S.; Fong, J.S.; Goodyer, P.R.; De Chadarévian, J.-P. Reduction of protein excretion by dimethyl sulfoxide in rats with passive Heymann nephritis. Kidney Int. 1984, 25, 778–788. [Google Scholar] [CrossRef] [PubMed]
- Yamamoto, E.; Izawa, T.; Juniantito, V.; Kuwamura, M.; Sugiura, K.; Takeuchi, T.; Yamate, J. Involvement of endogenous prostaglandin E2 in tubular epithelial regeneration through inhibition of apoptosis and epithelial-mesenchymal transition in cisplatin-induced rat renal lesions. Histol. Histopathol. 2010, 25, 995–1007. [Google Scholar]
- Faour, W.H.; Gomi, K.; Kennedy, C.R. PGE2 induces COX-2 expression in podocytes via the EP4 receptor through a PKA-independent mechanism. Cell. Signal. 2008, 20, 2156–2164. [Google Scholar] [CrossRef]
- Thieme, K.; Majumder, S.; Brijmohan, A.S.; Batchu, S.N.; Bowskill, B.B.; Alghamdi, T.A.; Advani, S.L.; Kabir, M.G.; Liu, Y.; Advani, A. EP4 inhibition attenuates the development of diabetic and non-diabetic experimental kidney disease. Sci. Rep. 2017, 7, 1–11. [Google Scholar] [CrossRef]
- Bek, M.; Nüsing, R.; Kowark, P.; Henger, A.; Mundel, P.; Pavenstädt, H. Characterization of Prostanoid Receptors in Podocytes. J. Am. Soc. Nephrol. 1999, 10, 2084–2093. [Google Scholar]
- Wang, W.; Yu, X.; Mo, X.; Zhang, H.; Zhu, D. Limb ischemic preconditioning attenuates cerebral ischemic injury in rat model. Perfusion 2013, 29, 210–218. [Google Scholar] [CrossRef]
- Kinsey, G.R.; Huang, L.; Vergis, A.L.; Li, L.; Okusa, M.D. Regulatory T cells contribute to the protective effect of ischemic preconditioning in the kidney. Kidney Int. 2010, 77, 771–780. [Google Scholar] [CrossRef] [PubMed]
- Burne-Taney, M.J.; Liu, M.; Baldwin, W.M.; Racusen, L.; Rabb, H. Decreased Capacity of Immune Cells to Cause Tissue Injury Mediates Kidney Ischemic Preconditioning. J. Immunol. 2006, 176, 7015–7020. [Google Scholar] [CrossRef] [PubMed]


Publisher’s Note: MDPI stays neutral with regard to jurisdictional claims in published maps and institutional affiliations. |
© 2021 by the authors. Licensee MDPI, Basel, Switzerland. This article is an open access article distributed under the terms and conditions of the Creative Commons Attribution (CC BY) license (http://creativecommons.org/licenses/by/4.0/).
Share and Cite
Aringer, I.; Artinger, K.; Schabhüttl, C.; Bärnthaler, T.; Mooslechner, A.A.; Kirsch, A.; Pollheimer, M.; Eller, P.; Rosenkranz, A.R.; Heinemann, A.; et al. Agonism of Prostaglandin E2 Receptor 4 Ameliorates Tubulointerstitial Injury in Nephrotoxic Serum Nephritis in Mice. J. Clin. Med. 2021, 10, 832. https://doi.org/10.3390/jcm10040832
Aringer I, Artinger K, Schabhüttl C, Bärnthaler T, Mooslechner AA, Kirsch A, Pollheimer M, Eller P, Rosenkranz AR, Heinemann A, et al. Agonism of Prostaglandin E2 Receptor 4 Ameliorates Tubulointerstitial Injury in Nephrotoxic Serum Nephritis in Mice. Journal of Clinical Medicine. 2021; 10(4):832. https://doi.org/10.3390/jcm10040832
Chicago/Turabian StyleAringer, Ida, Katharina Artinger, Corinna Schabhüttl, Thomas Bärnthaler, Agnes A. Mooslechner, Andrijana Kirsch, Marion Pollheimer, Philipp Eller, Alexander R. Rosenkranz, Akos Heinemann, and et al. 2021. "Agonism of Prostaglandin E2 Receptor 4 Ameliorates Tubulointerstitial Injury in Nephrotoxic Serum Nephritis in Mice" Journal of Clinical Medicine 10, no. 4: 832. https://doi.org/10.3390/jcm10040832
APA StyleAringer, I., Artinger, K., Schabhüttl, C., Bärnthaler, T., Mooslechner, A. A., Kirsch, A., Pollheimer, M., Eller, P., Rosenkranz, A. R., Heinemann, A., & Eller, K. (2021). Agonism of Prostaglandin E2 Receptor 4 Ameliorates Tubulointerstitial Injury in Nephrotoxic Serum Nephritis in Mice. Journal of Clinical Medicine, 10(4), 832. https://doi.org/10.3390/jcm10040832