
Changes in Body Composition Are Associated with Metabolic Changes and the Risk of Metabolic Syndrome

 , , and
Abstract
1. Introduction
2. Methods
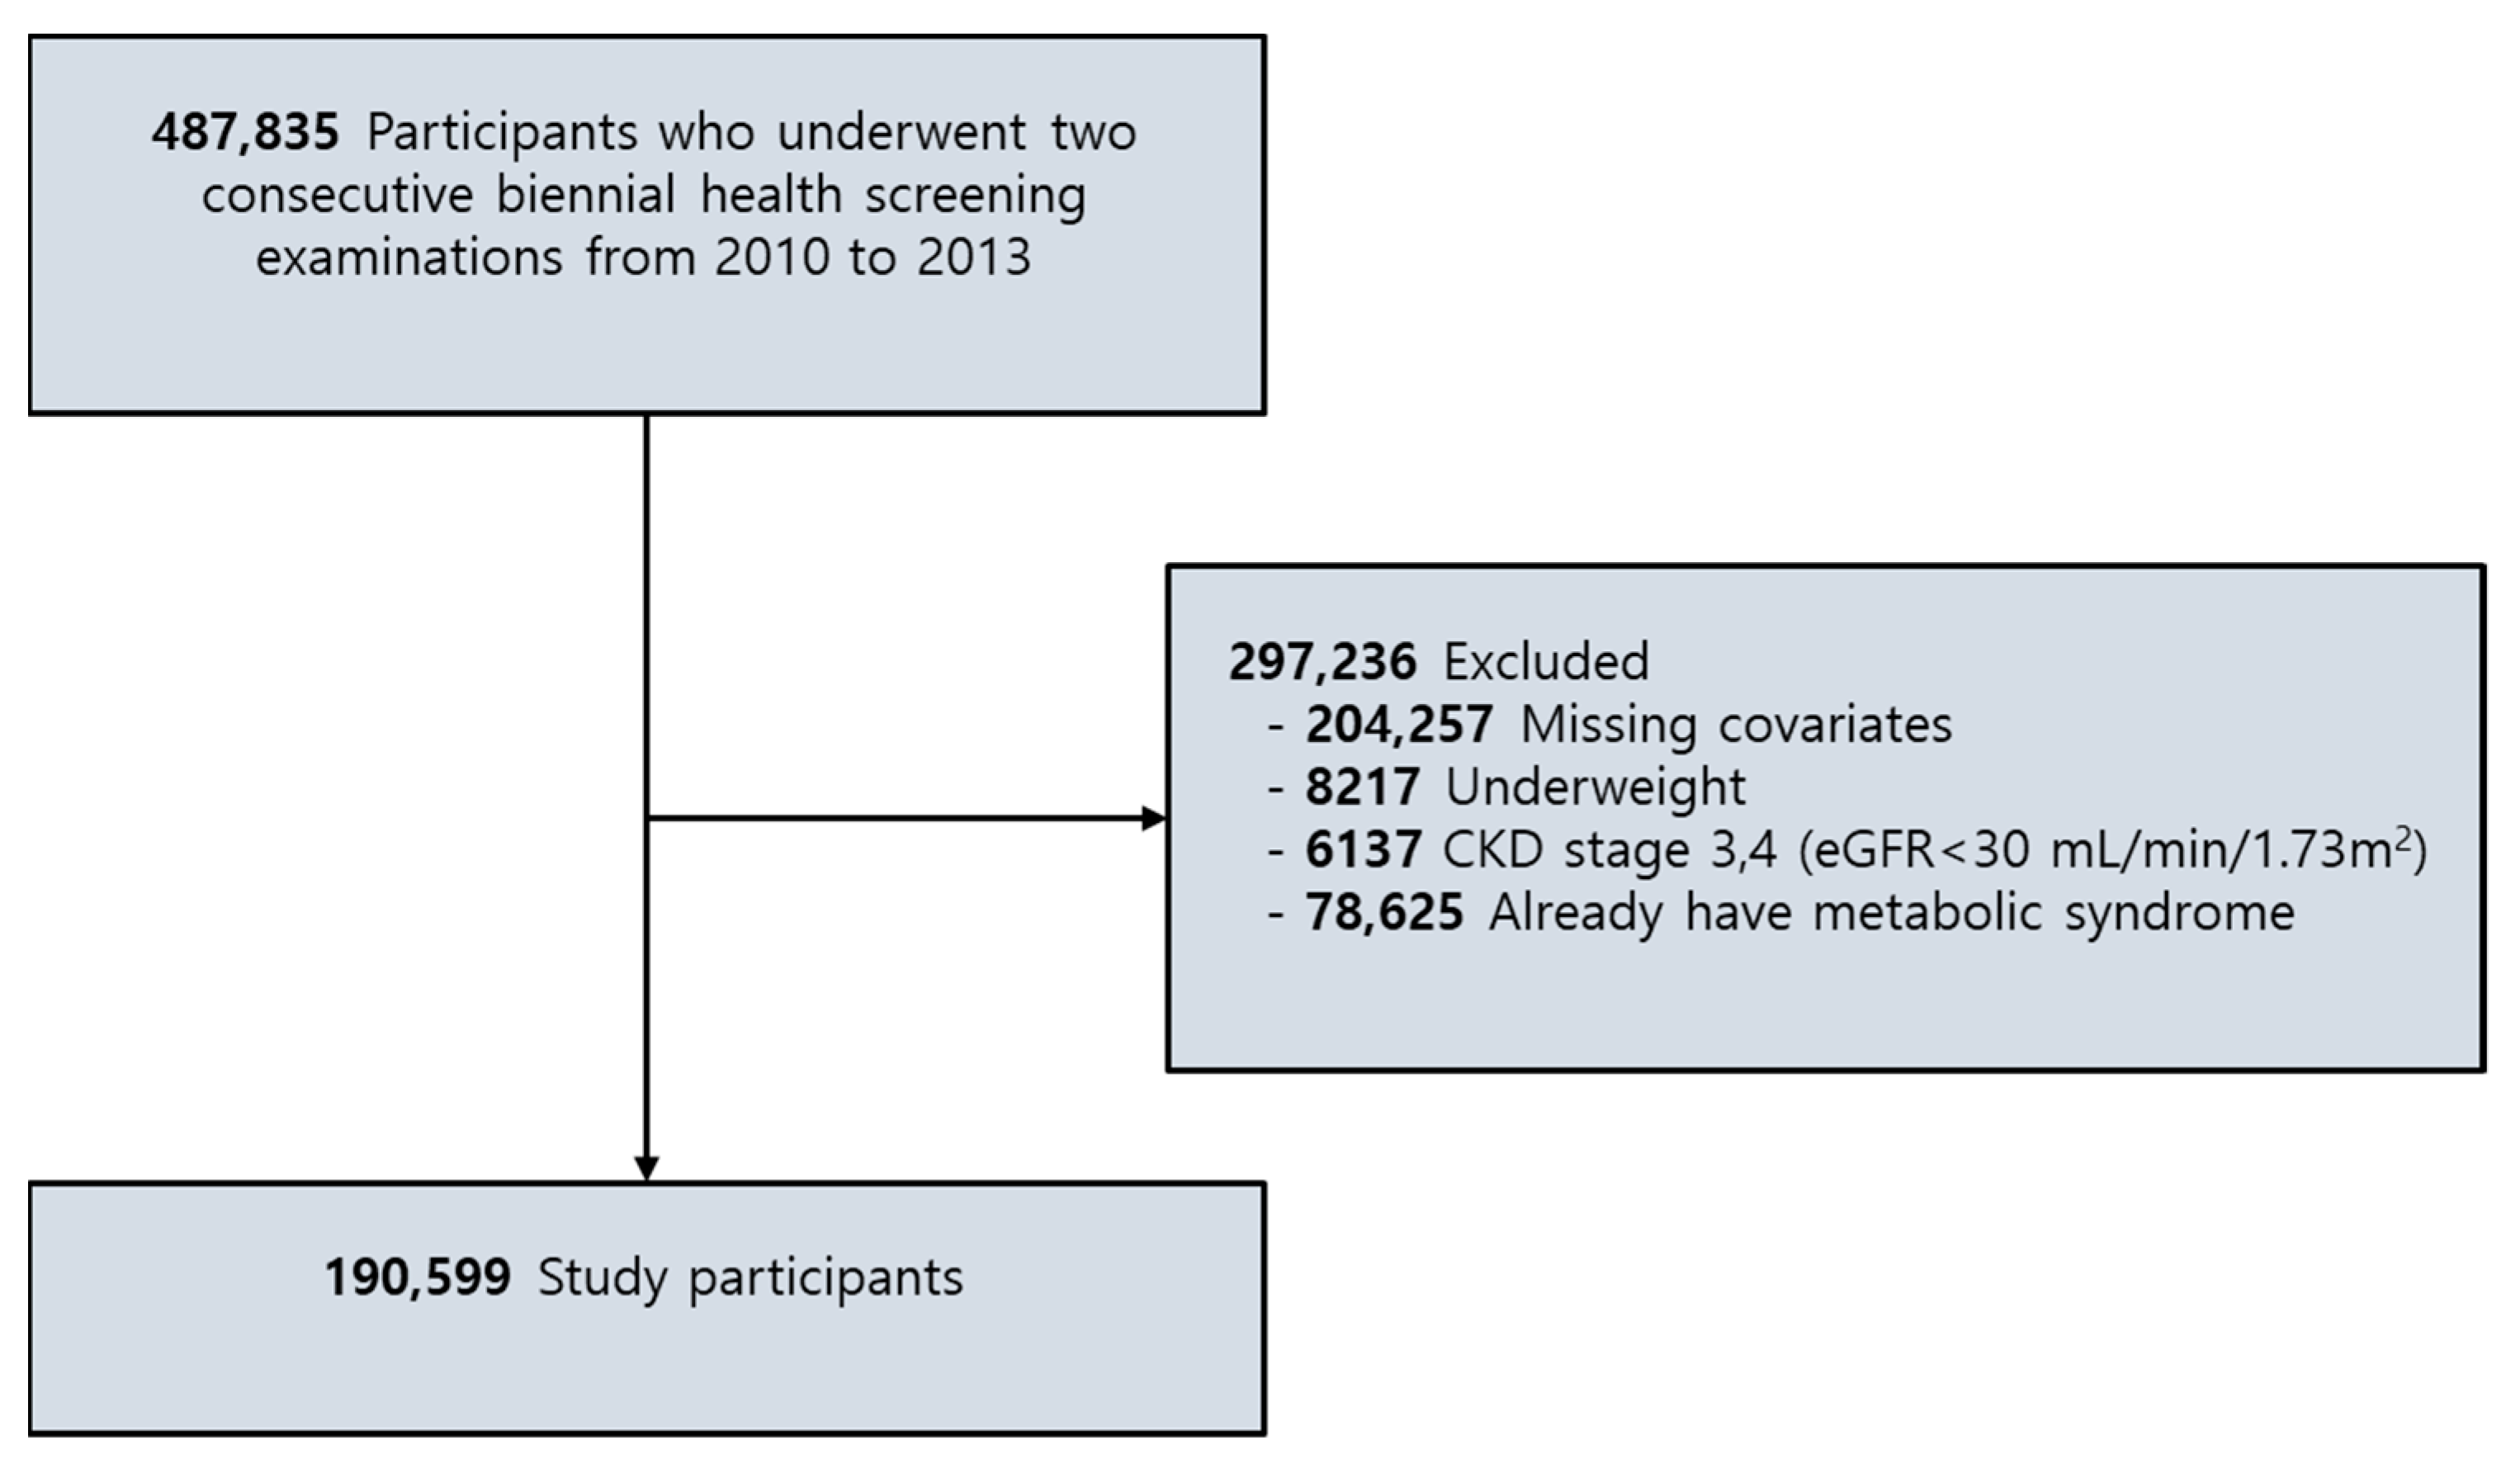
2.1. Participants
2.2. Key Variables
2.2.1. Body Composition
2.2.2. Changes in Body Composition
2.2.3. Metabolic Syndrome
2.2.4. Other Variables
2.3. Statistical Analyses
3. Results
3.1. General Characteristics of the Participants
3.2. Linear Association between Body Composition Change and Changes in the Metabolic Profile
3.3. Risk of MetS and Changes in Body Composition
3.4. Risk of Metabolic Pathologies and Body Composition Change
3.5. Risk of MetS According to The Changes in BMI
4. Discussion
5. Conclusions
Supplementary Materials
Author Contributions
Funding
Institutional Review Board Statement
Informed Consent Statement
Conflicts of Interest
References
- Saklayen, M.G. The global epidemic of the metabolic syndrome. Curr. Hypertens. Rep. 2018, 20, 1–8. [Google Scholar] [CrossRef]
- Laaksonen, D.E.; Lakka, H.-M.; Niskanen, L.K.; Kaplan, G.A.; Salonen, J.T.; Lakka, T.A. Metabolic syndrome and development of diabetes mellitus: Application and validation of recently suggested definitions of the metabolic syndrome in a prospective cohort study. Am. J. Epidemiol. 2002, 156, 1070–1077. [Google Scholar] [CrossRef] [PubMed]
- Dragsbæk, K.; Neergaard, J.S.; Laursen, J.M.; Hansen, H.B.; Christiansen, C.; Beck-Nielsen, H.; Karsdal, M.A.; Brix, S.; Henriksen, K. Metabolic syndrome and subsequent risk of type 2 diabetes and cardiovascular disease in elderly women: Challenging the current definition. Medicine 2016, 95, e4806. [Google Scholar] [CrossRef] [PubMed]
- Esposito, K.; Chiodini, P.; Colao, A.; Lenzi, A.; Giugliano, D. Metabolic syndrome and risk of cancer: A systematic review and meta-analysis. Diabetes Care 2012, 35, 2402–2411. [Google Scholar] [CrossRef] [PubMed]
- Alberti, K.G.M.M.; Zimmet, P.Z. Definition, diagnosis and classification of diabetes mellitus and its complications. Part 1: Diagnosis and classification of diabetes mellitus. Provisional report of a WHO consultation. Diabet. Med. 1998, 15, 539–553. [Google Scholar] [CrossRef]
- Grundy, S.M.; Cleeman, J.I.; Daniels, S.R.; Donato, K.A.; Eckel, R.H.; Franklin, B.A.; Gordon, D.J.; Krauss, R.M.; Savage, P.J.; Smith, S.C., Jr. Diagnosis and management of the metabolic syndrome: An American Heart Association/National Heart, Lung, and Blood Institute scientific statement. Circulation 2005, 112, 2735–2752. [Google Scholar] [CrossRef]
- Federation, I.D. The IDF consensus worldwide definition of the metabolic syndrome. IDF Commun. 2006, 23, 1–24. [Google Scholar]
- Einhorn, D. American College of Endocrinology position statement on the insulin resistance syndrome. Endocr. Pract. 2003, 9, 5–21. [Google Scholar] [CrossRef]
- Shah, R.V.; Murthy, V.L.; Abbasi, S.A.; Blankstein, R.; Kwong, R.Y.; Goldfine, A.B.; Jerosch-Herold, M.; Lima, J.A.; Ding, J.; Allison, M.A. Visceral adiposity and the risk of metabolic syndrome across body mass index: The MESA Study. JACC Cardiovasc. Imaging 2014, 7, 1221–1235. [Google Scholar] [CrossRef]
- Després, J.-P.; Lemieux, I.; Bergeron, J.; Pibarot, P.; Mathieu, P.; Larose, E.; Rodés-Cabau, J.; Bertrand, O.F.; Poirier, P. Abdominal obesity and the metabolic syndrome: Contribution to global cardiometabolic risk. Arterioscler. Thromb. Vasc. Biol. 2008, 28, 1039–1049. [Google Scholar] [CrossRef]
- Kim, K.; Park, S.M. Association of muscle mass and fat mass with insulin resistance and the prevalence of metabolic syndrome in Korean adults: A cross-sectional study. Sci. Rep. 2018, 8, 2703. [Google Scholar] [CrossRef]
- Cruz-Jentoft, A.J.; Bahat, G.; Bauer, J.; Boirie, Y.; Bruyère, O.; Cederholm, T.; Cooper, C.; Landi, F.; Rolland, Y.; Sayer, A.A. Sarcopenia: Revised European consensus on definition and diagnosis. Age Ageing 2019, 48, 16–31. [Google Scholar] [CrossRef]
- Moon, S.-S. Low skeletal muscle mass is associated with insulin resistance, diabetes, and metabolic syndrome in the Korean population: The Korea National Health and Nutrition Examination Survey (KNHANES) 2009–2010. Endocr. J. 2013. [Google Scholar] [CrossRef] [PubMed]
- Leenders, M.; Verdijk, L.B.; van der Hoeven, L.; Adam, J.J.; Van Kranenburg, J.; Nilwik, R.; Van Loon, L.J. Patients with type 2 diabetes show a greater decline in muscle mass, muscle strength, and functional capacity with aging. J. Am. Med. Dir. Assoc. 2013, 14, 585–592. [Google Scholar] [CrossRef]
- Park, S.; Ham, J.-O.; Lee, B.K. A positive association between stroke risk and sarcopenia in men aged ≥50 years, but not women: Results from the Korean National Health and Nutrition Examination Survey 2008–2010. J. Nutr. Health Aging 2014, 18, 806–812. [Google Scholar] [CrossRef]
- Chin, S.O.; Rhee, S.Y.; Chon, S.; Hwang, Y.-C.; Jeong, I.-K.; Oh, S.; Ahn, K.J.; Chung, H.Y.; Woo, J.-T.; Kim, S.-W. Sarcopenia is independently associated with cardiovascular disease in older Korean adults: The Korea National Health and Nutrition Examination Survey (KNHANES) from 2009. PLoS ONE 2013, 8, e60119. [Google Scholar] [CrossRef] [PubMed]
- Heffron, S.P.; Parham, J.S.; Pendse, J.; Alemán, J.O. Treatment of Obesity in Mitigating Metabolic Risk. Circ. Res. 2020, 126, 1646–1665. [Google Scholar] [CrossRef] [PubMed]
- Lee, J.; Lee, J.S.; Park, S.-H.; Shin, S.A.; Kim, K. Cohort profile: The national health insurance service–national sample cohort (NHIS-NSC), South Korea. Int. J. Epidemiol. 2017, 46, e15. [Google Scholar] [CrossRef] [PubMed]
- Jee, S.H.; Sull, J.W.; Park, J.; Lee, S.-Y.; Ohrr, H.; Guallar, E.; Samet, J.M. Body-mass index and mortality in Korean men and women. N. Engl. J. Med. 2006, 355, 779–787. [Google Scholar] [CrossRef]
- Lee, G.; Chang, J.; Hwang, S.-s.; Son, J.S.; Park, S.M. Development and validation of prediction equations for the assessment of muscle or fat mass using anthropometric measurements, serum creatinine level, and lifestyle factors among Korean adults. Nutr. Res. Pract. 2020, 14, 95–105. [Google Scholar]
- Expert Panel on Detection, E. Executive summary of the third report of the National Cholesterol Education Program (NCEP) expert panel on detection, evaluation, and treatment of high blood cholesterol in adults (Adult Treatment Panel III). JAMA 2001, 285, 2486. [Google Scholar]
- Lee, S.Y.; Park, H.S.; Kim, D.J.; Han, J.H.; Kim, S.M.; Cho, G.J.; Kim, D.Y.; Kwon, H.S.; Kim, S.R.; Lee, C.B. Appropriate waist circumference cutoff points for central obesity in Korean adults. Diabetes Res. Clin. Pract. 2007, 75, 72–80. [Google Scholar] [CrossRef]
- Seong, S.C.; Kim, Y.-Y.; Park, S.K.; Khang, Y.H.; Kim, H.C.; Park, J.H.; Kang, H.-J.; Do, C.-H.; Song, J.-S.; Lee, E.-J.; et al. Cohort profile: The National Health Insurance Service-National Health Screening Cohort (NHIS-HEALS) in Korea. BMJ Open 2017, 7, e016640. [Google Scholar] [CrossRef]
- Centers for Disease Control and Prevention (CDC). Adult Alcohol Use Information. Available online: https://www.cdc.gov/nchs/nhis/alcohol/alcohol_glossary.htm (accessed on 30 January 2021).
- Oh, J.Y.; Yang, Y.J.; Kim, B.S.; Kang, J.H. Validity and Reliability of Korean Version of International Physical Activity Questionnaire (IPAQ) Short Form. J. Korean Acad. Fam. Med. 2007, 28, 532–541. [Google Scholar]
- Forde, C. Scoring the International Physical Activity Questionnaire (IPAQ). University of Dublin, 2018. Available online: https://ugc.futurelearn.com/uploads/files/bc/c5/bcc53b14-ec1e-4d90-88e3-1568682f32ae/IPAQ_PDF.pdf (accessed on 30 January 2021).
- Charlson, M.E.; Pompei, P.; Ales, K.L.; MacKenzie, C.R. A new method of classifying prognostic comorbidity in longitudinal studies: Development and validation. J. Chronic. Dis. 1987, 40, 373–383. [Google Scholar] [CrossRef]
- Sundararajan, V.; Henderson, T.; Perry, C.; Muggivan, A.; Quan, H.; Ghali, W.A. New ICD-10 version of the Charlson comorbidity index predicted in-hospital mortality. J. Clin. Epidemiol. 2004, 57, 1288–1294. [Google Scholar] [CrossRef]
- Argilés, J.M.; Campos, N.; Lopez-Pedrosa, J.M.; Rueda, R.; Rodriguez-Mañas, L. Skeletal muscle regulates metabolism via interorgan crosstalk: Roles in health and disease. J. Am. Med Dir. Assoc. 2016, 17, 789–796. [Google Scholar] [CrossRef]
- Zisman, A.; Peroni, O.D.; Abel, E.D.; Michael, M.D.; Mauvais-Jarvis, F.; Lowell, B.B.; Wojtaszewski, J.F.; Hirshman, M.F.; Virkamaki, A.; Goodyear, L.J. Targeted disruption of the glucose transporter 4 selectively in muscle causes insulin resistance and glucose intolerance. Nat. Med. 2000, 6, 924–928. [Google Scholar] [CrossRef]
- Hong, H.C.; Hwang, S.Y.; Choi, H.Y.; Yoo, H.J.; Seo, J.A.; Kim, S.G.; Kim, N.H.; Baik, S.H.; Choi, D.S.; Choi, K.M. Relationship between sarcopenia and nonalcoholic fatty liver disease: The Korean Sarcopenic Obesity Study. Hepatology 2014, 59, 1772–1778. [Google Scholar] [CrossRef]
- Woo, C.-Y.; Jang, J.E.; Lee, S.E.; Koh, E.H.; Lee, K.-U. Mitochondrial dysfunction in adipocytes as a primary cause of adipose tissue inflammation. Diabetes Metab. J. 2019, 43, 247–256. [Google Scholar] [CrossRef] [PubMed]
- Rubio-Ruiz, M.E.; Guarner-Lans, V.; Pérez-Torres, I.; Soto, M.E. Mechanisms underlying metabolic syndrome-related sarcopenia and possible therapeutic measures. Int. J. Mol. Sci. 2019, 20, 647. [Google Scholar] [CrossRef]
- Ross, R.; Aru, J.; Freeman, J.; Hudson, R.; Janssen, I. Abdominal adiposity and insulin resistance in obese men. Am. J. Physiol. Endocrinol. Metab. 2002, 282, E657–E663. [Google Scholar] [CrossRef]
- Mikhail, N. The metabolic syndrome: Insulin resistance. Curr. Hypertens. Rep. 2009, 11, 156. [Google Scholar] [CrossRef]
- Lara-Castro, C.; Fu, Y.; Chung, B.H.; Garvey, W.T. Adiponectin and the metabolic syndrome: Mechanisms mediating risk for metabolic and cardiovascular disease. Curr. Opin. Lipidol. 2007, 18, 263–270. [Google Scholar] [CrossRef]
- Alley, D.E.; Chang, V.W. Metabolic syndrome and weight gain in adulthood. J. Gerontol. Ser. A Biomed. Sci. Med Sci. 2010, 65, 111–117. [Google Scholar] [CrossRef] [PubMed]
- Thomas, E.L.; Parkinson, J.R.; Frost, G.S.; Goldstone, A.P.; Doré, C.J.; McCarthy, J.P.; Collins, A.L.; Fitzpatrick, J.A.; Durighel, G.; Taylor-Robinson, S.D.; et al. The missing risk: MRI and MRS phenotyping of abdominal adiposity and ectopic fat. Obesity 2012, 20, 76–87. [Google Scholar] [CrossRef]
- Oh, Y.H.; Moon, J.H.; Kim, H.J.; Kong, M.H. Visceral-to-subcutaneous fat ratio as a predictor of the multiple metabolic risk factors for subjects with normal waist circumference in Korea. Diabetes Metab. Syndr. Obes. 2017, 10, 505–511. [Google Scholar] [CrossRef] [PubMed]
- Karelis, A.D. Obesity: To be obese—does it matter if you are metabolically healthy? Nat. Rev. Endocrinol. 2011, 7, 699. [Google Scholar] [CrossRef] [PubMed]
- Hughes, V.A.; Frontera, W.R.; Roubenoff, R.; Evans, W.J.; Singh, M.A.F. Longitudinal changes in body composition in older men and women: Role of body weight change and physical activity. Am. J. Clin. Nutr. 2002, 76, 473–481. [Google Scholar] [CrossRef]
- Aloia, J.F.; McGowan, D.M.; Vaswani, A.N.; Ross, P.; Cohn, S.H. Relationship of menopause to skeletal and muscle mass. Am. J. Clin. Nutr. 1991, 53, 1378–1383. [Google Scholar] [CrossRef] [PubMed]
- Panotopoulos, G.; Ruiz, J.-C.; Raison, J.; Guy-Grand, B.; Basdevant, A. Menopause, fat and lean distribution in obese women. Maturitas 1996, 25, 11–19. [Google Scholar] [CrossRef]
- Camhi, S.M.; Bray, G.A.; Bouchard, C.; Greenway, F.L.; Johnson, W.D.; Newton, R.L.; Ravussin, E.; Ryan, D.H.; Smith, S.R.; Katzmarzyk, P.T. The relationship of waist circumference and BMI to visceral, subcutaneous, and total body fat: Sex and race differences. Obesity 2011, 19, 402–408. [Google Scholar] [CrossRef] [PubMed]
- Chen, P.; Hou, X.; Hu, G.; Wei, L.; Jiao, L.; Wang, H.; Chen, S.; Wu, J.; Bao, Y.; Jia, W. Abdominal subcutaneous adipose tissue: A favorable adipose depot for diabetes? Cardiovasc. Diabetol. 2018, 17, 93. [Google Scholar] [CrossRef]
- Kwon, H.; Kim, D.; Kim, J.S. Body fat distribution and the risk of incident metabolic syndrome: A longitudinal cohort study. Sci. Rep. 2017, 7, 10955. [Google Scholar] [CrossRef] [PubMed]
- Xu, T.; Liu, J.; Liu, J.; Zhu, G.; Han, S. Relation between metabolic syndrome and body compositions among Chinese adolescents and adults from a large-scale population survey. BMC Public Health 2017, 17, 337. [Google Scholar] [CrossRef] [PubMed]
- Kim, G.; Lee, S.-E.; Jun, J.E.; Lee, Y.-B.; Ahn, J.; Bae, J.C.; Jin, S.-M.; Hur, K.Y.; Jee, J.H.; Lee, M.-K. Increase in relative skeletal muscle mass over time and its inverse association with metabolic syndrome development: A 7-year retrospective cohort study. Cardiovasc. Diabetol. 2018, 17, 1–13. [Google Scholar] [CrossRef]


| Variable | Initial | Follow-Up | p-Value |
|---|---|---|---|
| Age, years, mean (SD) | 58.73 ± 8.26 | 60.73 ± 8.26 | <0.001 |
| Sex, n (%) | 1.000 | ||
| Men | 101,536 (53.27) | 101,536 (53.27) | |
| Women | 89,063 (46.73) | 89,063 (46.73) | |
| Smoking, n (%) | <0.001 | ||
| Never | 124,513 (65.33) | 124,552 (65.35) | |
| Ex-smoker | 36,328 (19.06) | 38,746 (20.33) | |
| Current smoker | 29,758 (15.61) | 27,301 (14.32) | |
| Alcohol use, n (%) | <0.001 | ||
| No | 28,315 (14.86) | 27,553 (14.46) | |
| Moderate drinker | 31,605 (16.58) | 32,188 (16.89) | |
| Heavy drinker | 130,679 (68.56) | 130,858 (68.66) | |
| Physical activity, n (%) | <0.001 | ||
| None | 101,270 (53.13) | 98,484 (51.67) | |
| Moderate | 71,468 (37.50) | 73,348 (38.48) | |
| Vigorous | 17,861 (9.37) | 18,767 (9.85) | |
| BMI, kg/m2, mean (SD) | 23.53 ± 2.42 | 23.55 ± 2.47 | <0.001 |
| WC, cm, mean (SD) | 80.03 ± 7.06 | 80.46 ± 7.40 | <0.001 |
| Serum creatinine, mg/dL (SD) | 0.89 ± 0.19 | 0.87 ± 0.19 | <0.001 |
| FSG, mg/dL (SD) | 95.96 ± 18.89 | 97.89 ± 19.58 | <0.001 |
| TG, mg/dL (SD) | 113.74 ± 63.34 | 119.92 ± 71.39 | <0.001 |
| HDL-C, mg/dL (SD) | 56.78 ± 16.22 | 56.01 ± 17.63 | <0.001 |
| SBP, mm Hg (SD) | 122.71 ± 14.46 | 123.30 ± 14.40 | <0.001 |
| DBP, mm Hg (SD) | 76.27 ± 9.56 | 76.39 ± 9.53 | <0.001 |
| Taking antihypertensive, n (%) | 68,458 (35.92) | 76,260 (40.01) | <0.001 |
| Taking OHA, n (%) | 10,545 (5.53) | 12,599 (6.61) | <0.001 |
| Predicted LBM index (kg/m2) | 16.92 ± 1.77 | 16.91 ± 1.78 | <0.001 |
| Predicted ASM index (kg/m2) | 7.10 ± 1.01 | 7.11 ± 1.03 | <0.001 |
| Predicted BFM index (kg/m2) | 6.24 ± 1.88 | 6.27 ± 1.91 | <0.001 |
| Relative LBM (%) | 72.13 ± 5.94 | 72.06 ± 5.97 | <0.001 |
| Relative BFM (%) | 26.29 ± 6.55 | 26.37 ± 6.57 | <0.001 |
| Relative ASM (%) | 30.25 ± 3.73 | 30.29 ± 3.81 | <0.001 |
| Variable | ΔWC | ΔSBP | ΔDBP | ΔFSG | ΔTG | ΔHDL-C |
|---|---|---|---|---|---|---|
| β (95% CI) | β (95% CI) | β (95% CI) | β (95% CI) | β (95% CI) | β (95% CI) | |
| Men | ||||||
| ΔRelative LBM | −2.56 (−2.57, −2.56) | −0.66 (−0.72, −0.61) | −0.40 (−0.44, −0.36) | −0.28 (−0.35, −0.21) | −4.85 (−5.11, −4.58) | 0.50 (0.43, 0.57) |
| ΔRelative BFM | 2.51 (2.50, 2.51) | 0.67 (0.62, 0.72) | 0.40 (0.36, 0.43) | 0.21 (0.14−0.28) | 4.65 (4.39, 4.92) | −0.51 (−0.57, −0.44) |
| ΔRelative ASM | −5.32 (−5.34, −5.31) | −1.24 (−1.34, −1.13) | −0.75 (−0.83, −0.67) | −0.47 (−0.62, −0.32) | −9.26 (−9.81, −8.70) | 1.00 (0.86−1.13) |
| ΔBMI | 1.61 (1.58, 1.64) | 1.31 (1.22, 1.39) | 0.76 (0.71, 0.82) | 0.31 (0.20−0.42) | 9.54 (9.12, 9.96) | −1.01 (−1.11, −0.91) |
| Women | ||||||
| ΔRelative LBM | −2.64 (−2.66, −2.62) | −0.82 (−0.89, −0.75) | −0.40 (−0.45, −0.35) | −0.20 (−0.27, −0.12) | −4.38 (−4.67, −4.09) | 0.44 (0.34, 0.53) |
| ΔRelative BFM | 2.67 (2.65, 2.69) | 0.85 (0.77, 0.92) | 0.41 (0.36, 0.46) | 0.21 (0.14−0.29) | 4.58 (4.28, 4.88) | −0.45 (−0.55, −0.35) |
| ΔRelative ASM | −6.03 (−6.09, −5.98) | −2.06 (−2.24, −1.88) | −0.93 (−1.05, −0.80) | −0.10 (−0.29, 0.08) | −10.28 (−11.01, −9.55) | 1.29 (1.05−1.5) |
| ΔBMI | 1.51 (1.48, 1.54) | 0.96 (0.88, 1.05) | 0.49 (0.43, 0.55) | 0.32 (0.24−0.41) | 5.21 (4.88, 5.54) | −0.46 (−0.57, −0.35) |
| Men | Subjects, n | Events, n (%) | ΔRelative LBM | ΔRelative BFM | ΔRelative ASM |
|---|---|---|---|---|---|
| All male participants | 101,536 | 18,006 (17.73) | 0.78 (0.77, 0.79) | 1.25 (1.24, 1.27) | 0.61 (0.60, 0.62) |
| BMI category | |||||
| Normal | 41,344 | 4029 (9.75) | 0.82 (0.80, 0.83) | 1.20 (1.18, 1.22) | 0.69 (0.66, 0.71) |
| Overweight | 33,179 | 5717 (17.23) | 0.72 (0.71, 0.73) | 1.36 (1.34, 1.39) | 0.54 (0.52, 0.56) |
| Obese | 27,013 | 8260 (30.58) | 0.66 (0.65, 0.68) | 1.47 (1.44, 1.50) | 0.46 (0.44, 0.48) |
| p for trend | <0.001 | <0.001 | <0.001 | ||
| BFMI quartile | |||||
| Q1 | 25,384 | 1990 (7.84) | 0.79 (0.77, 0.81) | 1.24 (1.21, 1.27) | 0.65 (0.61, 0.68) |
| Q2 | 25,384 | 3347 (13.19) | 0.67 (0.66, 0.69) | 1.45 (1.42, 1.49) | 0.47 (0.44, 0.49) |
| Q3 | 25,384 | 4898 (19.30) | 0.58 (0.56, 0.59) | 1.71 (1.67, 1.75) | 0.35 (0.33, 0.36) |
| Q4 | 25,384 | 7771 (30.61) | 0.58 (0.56, 0.59) | 1.69 (1.65, 1.73) | 0.34 (0.33, 0.36) |
| p for trend | <0.001 | <0.001 | <0.001 | ||
| No. of metabolic pathologies recorded in the baseline health exam | |||||
| 0 | 18,117 | 869 (4.80) | 0.72 (0.69, 0.75) | 1.36 (1.31, 1.41) | 0.51 (0.47, 0.56) |
| 1 | 39,773 | 4803 (12.08) | 0.74 (0.73, 0.75) | 1.32 (1.30, 1.35) | 0.55 (0.53, 0.57) |
| 2 | 43,646 | 12,334 (28.26) | 0.76 (0.75, 0.77) | 1.29 (1.28, 1.31) | 0.57 (0.56, 0.59) |
| p for trend | <0.001 | <0.001 | <0.001 | ||
| Women | |||||
| All women participants | 89,063 | 14,858 (16.68) | 0.80 (0.79−0.81) | 1.24 (1.22−1.26) | 0.61 (0.59−0.63) |
| Initial BMI category | |||||
| Normal | 41,497 | 4104 (9.89) | 0.82 (0.80, 0.84) | 1.21 (1.19, 1.24) | 0.64 (0.60, 0.68) |
| Overweight | 25,511 | 4380 (17.12) | 0.72 (0.70, 0.74) | 1.39 (1.36, 1.43) | 0.48 (0.45, 0.52) |
| Obese | 21,883 | 6374 (29.00) | 0.67 (0.65, 0.68) | 1.50 (1.46, 1.55) | 0.41 (0.38, 0.44) |
| p for trend | <0.001 | <0.001 | <0.001 | ||
| Initial BFMI quartile | |||||
| Q1 | 22,266 | 1701 (7.64) | 0.83 (0.80, 0.85) | 1.21 (1.17, 1.25) | 0.65 (0.60, 0.70) |
| Q2 | 22,266 | 2688 (12.07) | 0.75 (0.73, 0.77) | 1.33 (1.29, 1.38) | 0.52 (0.48, 0.56) |
| Q3 | 22,266 | 3976 (17.86) | 0.68 (0.66, 0.70) | 1.47 (1.43, 1.52) | 0.41 (0.38, 0.44) |
| Q4 | 22,266 | 6493 (29.16) | 0.64 (0.62, 0.66) | 1.56 (1.51, 1.60) | 0.36 (0.34, 0.39) |
| p for trend | <0.001 | <0.001 | <0.001 | ||
| No. of metabolic pathologies recorded in the baseline health exam | |||||
| 0 | 20,928 | 811 (3.88) | 0.72 (0.68, 0.76) | 1.290 (1.32, 1.47) | 0.48 (0.42, 0.54) |
| 1 | 35,743 | 4280 (11.97) | 0.78 (0.76, 0.80) | 1.28 (1.25, 1.31) | 0.57 (0.53, 0.60) |
| 2 | 32,392 | 9767 (30.15) | 0.78 (0.76, 0.79) | 1.28 (1.26, 1.30) | 0.56 (0.54, 0.59) |
| p for trend | <0.001 | <0.001 | <0.001 |
| Men | Participants, n | Events, n (%) | ΔRelative LBM | ΔRelative BFM | ΔRelative ASM |
| Waist ≥ 90 cm | 90,895 | 9148 (10.06) | 0.50 (0.49, 0.51) | 1.95 (1.92, 1.98) | 0.23 (0.22, 0.24) |
| Hyperglycemia | 69,355 | 18,633 (26.87) | 0.94 (0.93, 0.95) | 1.04 (1.03, 1.05) | 0.90 (0.88, 0.92) |
| High BP | 44,191 | 16,380 (37.07) | 0.92 (0.91, 0.93) | 1.07 (1.06, 1.08) | 0.85 (0.83, 0.87) |
| Low HDL-C | 95,127 | 8717 (9.16) | 0.94 (0.93, 0.95) | 1.05 (1.04, 1.06) | 0.90 (0.88, 0.93) |
| High TG | 81,047 | 15,030 (18.54) | 0.88 (0.87, 0.89) | 1.12 (1.11, 1.13) | 0.80 (0.78, 0.81) |
| Women | Subjects, n | Events, n (%) | ΔRelative LBM | ΔRelative BFM | ΔRelative ASM |
| Waist ≥ 85 cm | 79,332 | 8407 (10.60) | 0.53 (0.52, 0.54) | 1.86 (1.82, 1.89) | 0.25 (0.24, 0.26) |
| Hyperglycemia | 71,159 | 13,657 (19.19) | 0.97 (0.95, 0.98) | 1.03 (1.01, 1.04) | 0.96 (0.93, 1.00) |
| High BP | 43,154 | 14,093 (32.66) | 0.93 (0.92, 0.95) | 1.06 (1.05, 1.08) | 0.86 (0.83, 0.89) |
| Low HDL-C | 72,799 | 13,469 (18.50) | 0.96 (0.94, 0.97) | 1.04 (1.02, 1.05) | 0.90 (0.87, 0.93) |
| High TG | 78,344 | 11,684 (14.91) | 0.88 (0.87, 0.89) | 1.13 (1.11, 1.15) | 0.76 (0.73, 0.79) |
| Men | Participants | Events | ΔRelative LBM | ΔRelative BFM | ΔRelative ASM |
| BMI change | |||||
| Decreased | 2848 | 296 (10.39) | 0.68 (0.63, 0.73) | 1.44 (1.34, 1.55) | 0.47 (0.40, 0.54) |
| Maintained | 95,750 | 16,767 (17.51) | 0.78 (0.78, 0.79) | 1.25 (1.24, 1.26) | 0.62 (0.61, 0.63) |
| Increased | 2938 | 943 (32.10) | 0.92 (0.88, 0.96) | 1.07 (1.03, 1.12) | 0.80 (0.73, 0.88) |
| p for trend | <0.001 | <0.001 | <0.001 | ||
| Women | Subjects | Events | ΔRelative LBM | ΔRelative BFM | ΔRelative ASM |
| BMI change | |||||
| Decreased | 3393 | 501 (14.77) | 0.71 (0.65, 0.78) | 1.40 (1.28, 1.54) | 0.49 (0.40, 0.61) |
| Maintained | 82,303 | 13,358 (16.23) | 0.78 (0.77, 0.80) | 1.28 (1.26, 1.30) | 0.61 (0.58, 0.63) |
| Increased | 3367 | 999 (29.67) | 1.04 (0.97, 1.11) | 0.93 (0.87, 1.00) | 1.12 (0.95, 1.31) |
| p for trend | <0.001 | <0.001 | <0.001 |
Publisher’s Note: MDPI stays neutral with regard to jurisdictional claims in published maps and institutional affiliations. |
© 2021 by the authors. Licensee MDPI, Basel, Switzerland. This article is an open access article distributed under the terms and conditions of the Creative Commons Attribution (CC BY) license (http://creativecommons.org/licenses/by/4.0/).
Share and Cite
Oh, Y.H.; Choi, S.; Lee, G.; Son, J.S.; Kim, K.H.; Park, S.M. Changes in Body Composition Are Associated with Metabolic Changes and the Risk of Metabolic Syndrome. J. Clin. Med. 2021, 10, 745. https://doi.org/10.3390/jcm10040745
Oh YH, Choi S, Lee G, Son JS, Kim KH, Park SM. Changes in Body Composition Are Associated with Metabolic Changes and the Risk of Metabolic Syndrome. Journal of Clinical Medicine. 2021; 10(4):745. https://doi.org/10.3390/jcm10040745
Chicago/Turabian StyleOh, Yun Hwan, Seulggie Choi, Gyeongsil Lee, Joung Sik Son, Kyae Hyung Kim, and Sang Min Park. 2021. "Changes in Body Composition Are Associated with Metabolic Changes and the Risk of Metabolic Syndrome" Journal of Clinical Medicine 10, no. 4: 745. https://doi.org/10.3390/jcm10040745
APA StyleOh, Y. H., Choi, S., Lee, G., Son, J. S., Kim, K. H., & Park, S. M. (2021). Changes in Body Composition Are Associated with Metabolic Changes and the Risk of Metabolic Syndrome. Journal of Clinical Medicine, 10(4), 745. https://doi.org/10.3390/jcm10040745