
Do Metabolically Healthy People with Obesity Have a Lower Health-Related Quality of Life? A Prospective Cohort Study in Taiwan

 ,
,  and
and
Abstract
:1. Introduction
2. Materials and Methods
2.1. Study Design and Participants
2.2. Definition of Overweight/Obesity and Metabolic Health
2.3. Evaluation of Health-Related Quality of Life
2.4. Covariates
2.5. Statistical Analysis
3. Results
4. Discussion
5. Conclusions
Supplementary Materials
Author Contributions
Funding
Institutional Review Board Statement
Informed Consent Statement
Data Availability Statement
Acknowledgments
Conflicts of Interest
References
- World Health Organization. Obesity and Overweight. Available online: https://www.who.int/news-room/fact-sheets/detail/obesity-and-overweight (accessed on 15 June 2021).
- Dai, H.; Alsalhe, T.A.; Chalghaf, N.; Riccò, M.; Bragazzi, N.L.; Wu, J. The global burden of disease attributable to high body mass index in 195 countries and territories, 1990-2017: An analysis of the Global Burden of Disease Study. PLoS Med. 2020, 17, e1003198. [Google Scholar] [CrossRef]
- Kinlen, D.; Cody, D.; O’Shea, D. Complications of obesity. QJM 2017, 111, 437–443. [Google Scholar] [CrossRef] [PubMed]
- Tremmel, M.; Gerdtham, U.-G.; Nilsson, P.M.; Saha, S. Economic burden of obesity: A systematic literature review. Int. J. Environ. Res. Public Health 2017, 14, 435. [Google Scholar] [CrossRef]
- Sims, E.A. Are there persons who are obese, but metabolically healthy? Metabolism 2001, 50, 1499–1504. [Google Scholar] [CrossRef] [PubMed]
- Rey-López, J.P.; de Rezende, L.F.; Pastor-Valero, M.; Tess, B.H. The prevalence of metabolically healthy obesity: A systematic review and critical evaluation of the definitions used. Obes. Rev. 2014, 15, 781–790. [Google Scholar] [CrossRef]
- Smith, G.I.; Mittendorfer, B.; Klein, S. Metabolically healthy obesity: Facts and fantasies. J. Clin. Invest. 2019, 129, 3978–3989. [Google Scholar] [CrossRef] [PubMed] [Green Version]
- Yeh, T.L.; Hsu, H.Y.; Tsai, M.C.; Hsu, L.Y.; Hwang, L.C.; Chien, K.L. Association between metabolically healthy obesity/overweight and cardiovascular disease risk: A representative cohort study in Taiwan. PLoS ONE 2021, 16, e0246378. [Google Scholar] [CrossRef]
- Bell, J.A.; Kivimaki, M.; Hamer, M. Metabolically healthy obesity and risk of incident type 2 diabetes: A meta-analysis of prospective cohort studies. Obes. Rev. 2014, 15, 504–515. [Google Scholar] [CrossRef] [Green Version]
- Appleton, S.L.; Seaborn, C.J.; Visvanathan, R.; Hill, C.L.; Gill, T.K.; Taylor, A.W.; Adams, R.J. Diabetes and cardiovascular disease outcomes in the metabolically healthy obese phenotype: A cohort study. Diabetes Care 2013, 36, 2388–2394. [Google Scholar] [CrossRef] [Green Version]
- Hays, R.; Reeve, B.B. Measurement and Modeling of Health-Related Quality of Life, 1st ed.; Elsevier: Kidlington, UK, 2008; pp. 195–205. [Google Scholar]
- Pequeno, N.P.F.; de Araújo Cabral, N.L.; Marchioni, D.M.; Lima, S.C.V.C.; de Oliveira Lyra, C. Quality of life assessment instruments for adults: A systematic review of population- based studies. Health Qual. Life Outcomes. 2020, 18, 208. [Google Scholar] [CrossRef]
- Ul-Haq, Z.; Mackay, D.F.; Fenwick, E.; Pell, J.P. Meta-analysis of the association between body mass index and health-related quality of life among adults, assessed by the SF-36. Obesity (Silver Spring) 2013, 21, E322–E327. [Google Scholar] [CrossRef] [PubMed]
- Lopez-Garcia, E.; Guallar-Castillón, P.; Garcia-Esquinas, E.; Rodríguez-Artalejo, F. Metabolically healthy obesity and health-related quality of life: A prospective cohort study. Clin. Nutr. 2017, 36, 853–860. [Google Scholar] [CrossRef] [PubMed]
- Song, H.J.; Lee, E.K.; Kwon, J.W. Gender differences in the impact of obesity on health-related quality of life. Asia Pac. J. Public Health 2016, 28, 146–156. [Google Scholar] [CrossRef]
- Wee, H.-L.; Cheung, Y.-B.; Loke, W.C.; Tan, C.-B.; Chow, M.-H.; Li, S.C.; Fong, K.-Y.; Feeny, D.; Machin, D.; Luo, N.; et al. The association of body mass index with health-related quality of life: An exploratory study in a multiethnic Asian population. Value Health 2008, 11 (Suppl. 1), S105–S114. [Google Scholar] [CrossRef]
- Ibrahim, J.G.; Molenberghs, G. Missing data methods in longitudinal studies: A review. Test 2009, 18, 1–43. [Google Scholar] [CrossRef] [Green Version]
- Health Promotion Administration; Ministry of Health and Welfare; Taiwan. Taiwan’s Obesity Prevention and Management Strategy. Available online: https://www.hpa.gov.tw/File/Attach/10299/File_11744.pdf (accessed on 23 June 2021). (In Chinese)
- Grundy, S.M.; Cleeman, J.I.; Daniels, S.R.; Donato, K.A.; Eckel, R.H.; Franklin, B.A.; Gordon, D.J.; Krauss, R.M.; Savage, P.J.; Smith, S.C., Jr.; et al. Diagnosis and management of the metabolic syndrome: An American Heart Association/National Heart, Lung, and Blood Institute Scientific Statement. Circulation 2005, 112, 2735–2752. [Google Scholar] [CrossRef] [PubMed] [Green Version]
- Lu, J.F.; Tseng, H.M.; Tsai, Y.J. Assessment of health-related quality of life in Taiwan (I): Development and psychometric testing of SF-36 Taiwan version. Taiwan J. Public Health. 2003, 22, 501–511. [Google Scholar]
- Maruish, M.E. User’s Manual for the SF-36v2 Health Survey, 3rd ed.; QualityMetric Incorporated: Lincoln, RI, USA, 2011. [Google Scholar]
- Liou, Y.M.; Jwo, C.J.; Yao, K.G.; Chiang, L.C.; Huang, L.H. Selection of appropriate Chinese terms to represent intensity and types of physical activity terms for use in the Taiwan version of IPAQ. J. Nurs. Res. 2008, 16, 252–263. [Google Scholar] [CrossRef] [Green Version]
- The International Physical Activity Questionnaire Group. IPAQ Scoring Protocol. Available online: https://sites.google.com/site/theipaq/scoring-protocol (accessed on 9 July 2021).
- Gillies, C.S.; Hebblewhite, M.; Nielsen, S.E.; Krawchuk, M.A.; Aldridge, C.L.; Frair, J.L.; Saher, D.J.; Stevens, C.E.; Jerde, C.L. Application of random effects to the study of resource selection by animals. J. Anim. Ecol. 2006, 75, 887–898. [Google Scholar] [CrossRef]
- Kuk, J.L.; Ardern, C.I. Are metabolically normal but obese individuals at lower risk for all-cause mortality? Diabetes Care 2009, 32, 2297–2299. [Google Scholar] [CrossRef] [Green Version]
- Gao, M.; Lv, J.; Yu, C.; Guo, Y.; Bian, Z.; Yang, R.; Du, H.; Yang, L.; Chen, Y.; Li, Z.; et al. Metabolically healthy obesity, transition to unhealthy metabolic status, and vascular disease in Chinese adults: A cohort study. PLoS Med. 2020, 17, e1003351. [Google Scholar] [CrossRef] [PubMed]
- Mongraw-Chaffin, M.; Foster, M.C.; Anderson, C.A.M.; Burke, G.L.; Haq, N.; Kalyani, R.R.; Ouyang, P.; Sibley, C.T.; Tracy, R.; Woodward, M.; et al. Metabolically healthy obesity, transition to metabolic syndrome, and cardiovascular risk. J. Am. Coll. Cardiol. 2018, 71, 1857–1865. [Google Scholar] [CrossRef]
- Koster, A.; Stenholm, S.; Alley, D.E.; Kim, L.J.; Simonsick, E.M.; Kanaya, A.M.; Visser, M.; Houston, D.K.; Nicklas, B.J.; Tylavsky, F.A.; et al. Body fat distribution and inflammation among obese older adults with and without metabolic syndrome. Obesity (Silver Spring) 2010, 18, 2354–2361. [Google Scholar] [CrossRef]
- Hayes, L.; Pearce, M.S.; Firbank, M.J.; Walker, M.; Taylor, R.; Unwin, N.C. Do obese but metabolically normal women differ in intra-abdominal fat and physical activity levels from those with the expected metabolic abnormalities? A cross-sectional study. BMC Public Health 2010, 10, 723. [Google Scholar] [CrossRef] [Green Version]
- McVinnie, D.S. Obesity and pain. Br. J. Pain 2013, 7, 163–170. [Google Scholar] [CrossRef] [Green Version]
- Price, R.C.; Asenjo, J.F.; Christou, N.V.; Backman, S.B.; Schweinhardt, P. The role of excess subcutaneous fat in pain and sensory sensitivity in obesity. Eur. J. Pain 2013, 17, 1316–1326. [Google Scholar] [CrossRef] [PubMed]
- Juge-Aubry, C.E.; Somm, E.; Giusti, V.; Pernin, A.; Chicheportiche, R.; Verdumo, C.; Rohner-Jeanrenaud, F.; Burger, D.; Dayer, J.M.; Meier, C.A. Adipose tissue is a major source of interleukin-1 receptor antagonist: Upregulation in obesity and inflammation. Diabetes 2003, 52, 1104–1110. [Google Scholar] [CrossRef] [PubMed] [Green Version]
- Sung, E.-S.; Choi, C.K.; Jeong, J.-A.; Shin, M.-H. The relationship between body mass index and poor self-rated health in the South Korean population. PLoS ONE 2020, 15, e0219647. [Google Scholar] [CrossRef]
- Okosun, I.S.; Choi, S.; Matamoros, T.; Dever, G.E. Obesity is associated with reduced self-rated general health status: Evidence from a representative sample of white, black, and Hispanic Americans. Prev. Med. 2001, 32, 429–436. [Google Scholar] [CrossRef]


| Total | Metabolically Healthy Normal Weight a | Metabolically Healthy Overweight a | Metabolically Healthy Obesity a | Metabolically Unhealthy Normal Weight | Metabolically Unhealthy Overweight | Metabolically Unhealthy Obesity | p | |
|---|---|---|---|---|---|---|---|---|
| n = 906 | n = 404 (44.6%) | n = 136 (15.0%) | n = 59 (6.5%) | n = 118 (13.0%) | n = 93 (10.3%) | n = 96 (10.6%) | ||
| Age years, n (%) | ||||||||
| 35–39 | 132 (14.6) | 76 (18.8) | 25 (18.4) | 9 (15.3) | 5 (4.2) | 9 (9.7) | 8 (8.3) | <0.001 |
| 40–49 | 457 (50.4) | 218 (54.0) | 67 (49.3) | 30 (50.9) | 55 (46.6) | 41 (44.1) | 46 (47.9) | |
| 50–55 | 317 (35.0) | 110 (27.2) | 44 (32.4) | 20 (33.9) | 58 (49.2) | 43 (46.2) | 42 (43.8) | |
| Mean age (SD) | 46.9 (5.5) | 45.9 (5.6) | 46.6 (5.6) | 46.9 (5.5) | 48.8 (4.7) | 48.3 (5.5) | 48.0 (5.3) | <0.001 |
| Women, n (%) | 559 (61.7) | 315 (78.0) | 72 (52.9) | 33 (55.9) | 73 (61.9) | 33 (35.5) | 33 (34.4) | <0.001 |
| Mean BMI (SD), kg/m2 | 23.8 (3.5) | 21.3 (1.7) | 25.3 (0.9) | 29.4 (2.5) | 22.2 (1.5) | 25.4 (0.8) | 29.7 (2.7) | <0.001 |
| Married, n (%) | 764 (84.9) | 320 (79.8) | 124 (91.2) | 53 (89.8) | 102 (87.9) | 85 (91.4) | 80 (84.2) | 0.004 |
| Alcohol consumption, n (%) | 139 (15.4) | 52 (12.9) | 24 (17.7) | 9 (15.3) | 15 (12.7) | 25 (26.9) | 14 (14.6) | 0.03 |
| Cigarette smoking, n (%) | ||||||||
| Nonsmokers | 723 (80.0) | 342 (85.1) | 107 (79.3) | 46 (78.0) | 99 (83.9) | 69 (74.2) | 60 (62.5) | <0.001 |
| Smokers | 125 (13.8) | 44 (11.0) | 18 (13.3) | 8 (13.6) | 16 (13.6) | 14 (15.1) | 25 (26.0) | |
| Ex-smokers | 55 (6.1) | 16 (4.0) | 10 (7.4) | 5 (8.5) | 3 (2.5) | 10 (10.8) | 11 (11.5) | |
| Physical activity b, n (%) | ||||||||
| Low | 318 (35.1) | 146 (36.1) | 49 (36.0) | 18 (30.5) | 40 (33.9) | 28 (30.1) | 37 (38.5) | 0.88 |
| Moderate | 403 (44.5) | 173 (42.8) | 62 (45.6) | 28 (47.5) | 50 (42.4) | 49 (52.7) | 41 (42.7) | |
| High | 185 (20.4) | 85 (21.0) | 25 (18.4) | 13 (22.0) | 28 (23.7) | 16 (17.2) | 18 (18.8) | |
| Education, n (%) | ||||||||
| Illiterate/ elementary school | 16 (1.8) | 7 (1.8) | 3 (2.2) | 2 (3.4) | 0 | 1 (1.1) | 3 (3.1) | 0.12 |
| Senior/junior high school | 324 (35.9) | 125 (31.2) | 54 (39.7) | 25 (42.4) | 43 (36.4) | 33 (35.5) | 44 (45.8) | |
| University and above | 563 (62.4) | 269 (67.1) | 79 (58.1) | 32 (54.2) | 75 (63.6) | 59 (63.4) | 49 (51.0) | |
| SF-36 (mean ± SD) | ||||||||
| PCS | 54.7 (6.9) | 55.4 (6.4) | 54.3 (7.5) | 56.8 (6.4) | 52.3 (7.7) | 55.5 (5.4) | 53.6 (7.5) | <0.001 |
| MCS | 38.0 (5.0) | 37.5 (5.5) | 38.3 (4.6) | 37.8 (3.9) | 38.3 (4.8) | 38.5 (4.2) | 38.6 (4.8) | 0.17 |
| Physical functioning | 53.1 (5.1) | 53.6 (4.8) | 52.6 (4.9) | 52.7 (5.9) | 51.9 (5.6) | 53.4 (4.7) | 52.8 (5.3) | 0.01 |
| Role-physical | 51.8 (8.4) | 52.2 (8.1) | 50.6 (9.4) | 54.1 (6.0) | 50.0 (9.7) | 53.2 (7.0) | 51.2 (8.3) | 0.007 |
| Bodily pain | 52.9 (8.2) | 53.1 (7.7) | 53.1 (8.6) | 55.0 (7.9) | 50.5 (8.8) | 54.3 (7.5) | 52.0 (9.6) | 0.002 |
| General health | 47.3 (9.2) | 47.6 (8.8) | 47.7 (9.9) | 51.3 (7.9) | 44.7 (10.1) | 47.6 (7.7) | 45.6 (9.8) | <0.001 |
| Vitality | 47.8 (4.6) | 47.9 (4.6) | 48.4 (4.7) | 46.7 (4.4) | 47.1 (4.0) | 47.9 (4.8) | 47.9 (4.7) | 0.13 |
| Social functioning | 31.6 (4.2) | 31.3 (4.0) | 31.8 (3.6) | 32.8 (4.2) | 31.4 (4.4) | 31.5 (4.1) | 32.5 (5.2) | 0.04 |
| Role-emotional | 50.4 (9.8) | 49.9 (10.1) | 50.0 (10.3) | 52.1 (7.1) | 50.5 (10.2) | 51.7 (8.0) | 50.4 (10.4) | 0.44 |
| Mental health | 38.5 (4.5) | 38.5 (4.7) | 38.7 (4.0) | 37.6 (3.5) | 37.9 (4.7) | 39.3 (4.6) | 38.7 (4.0) | 0.14 |
| Physical Component Summary | Mental Component Summary | |||
|---|---|---|---|---|
| β (95% CI) | p | β (95% CI) | p | |
| Status of metabolic health a and BMI | ||||
| Metabolically healthy normal weight | Reference group | Reference group | ||
| Metabolically healthy overweight | −0.91 (−2.01, 0.20) | 0.13 | 0.16 (−1.01, 1.34) | 0.78 |
| Metabolically healthy obesity | 1.09 (−0.45, 2.62) | 0.17 | −0.56 (−2.07, 0.96) | 0.47 |
| Metabolically unhealthy normal weight | −2.17 (−3.38, −0.97) | <0.001 | 0.50 (−0.73, 1.73) | 0.43 |
| Metabolically unhealthy overweight | −0.53 (−1.62, 0.55) | 0.34 | 0.81 (−0.58, 2.20) | 0.26 |
| Metabolically unhealthy obesity | −2.29 (−3.70, −0.87) | 0.002 | 0.97 (−0.36, 2.30) | 0.16 |
| Age | −0.08 (−0.15, −0.01) | 0.03 | 0.06 (−0.02, 0.13) | 0.13 |
| Women | −1.44 (−2.39, −0.50) | 0.003 | −0.28 (−1.22, 0.66) | 0.56 |
| Marital status | ||||
| Single/Divorced/Separated/Widowed/Others | Reference group | Reference group | ||
| Married | −0.04 (−1.21, 1.13) | 0.95 | 0.76 (−0.36, 1.89) | 0.19 |
| Education | ||||
| Illiterate/elementary school | Reference group | Reference group | ||
| Senior/junior high school | 3.44 (0.70, 6.19) | 0.01 | −1.25 (−3.86, 1.37) | 0.35 |
| University and above | 4.46 (1.72, 7.19) | 0.001 | −0.83 (−3.45, 1.79) | 0.54 |
| Cigarette smoking | ||||
| Nonsmokers | Reference group | Reference group | ||
| Smokers | −1.10 (−2.39, 0.19) | 0.10 | −2.06 (−3.37, −0.76) | 0.004 |
| Ex-smokers | 1.87 (0.63, 3.10) | 0.005 | −0.48 (−2.14, 1.17) | 0.57 |
| Alcohol | 1.24 (0.25, 2.24) | 0.02 | 0.36 (−0.85, 1.57) | 0.56 |
| Physical activity b, n (%) | ||||
| Low | Reference group | Reference group | ||
| Moderate | 0.81 (0.04, 1.59) | 0.04 | −1.17 (−2.05, −0.28) | 0.01 |
| High | 2.27 (1.28, 3.27) | <0.001 | −1.39 (−2.53, −0.26) | 0.02 |
| Follow-up year | −0.08 (−0.17, 0.01) | 0.09 | 0.56 (0.48, 0.64) | <0.001 |
| Metabolically Healthy Normal Weight | Metabolically Healthy Overweight | Metabolically Healthy Obesity | Metabolically Unhealthy Normal Weight | Metabolically Unhealthy Overweight | Metabolically Unhealthy Obesity | pinteractions | |
|---|---|---|---|---|---|---|---|
| Physical Component Summary | |||||||
| Sex | |||||||
| Men (n = 347) | Reference group | −0.36 (−2.05, 1.32) | 0.13 (−2.31, 2.57) | −2.38 (−4.48, −0.28) | −0.48 (−2.03, 1.06) | −1.70 (−3.56, 0.16) | 0.56 |
| Women (n = 559) | Reference group | −1.09 (−2.67, 0.49) | 2.14 (0.21, 4.08) | −2.04 (−3.52, −0.57) | −0.57 (−2.12, 0.98) | −3.14 (−5.45, −0.83) | |
| Marital status | |||||||
| Married (n = 764) | Reference group | −0.72 (−1.94, 0.50) | 1.15 (−0.49, 2.79) | −2.06 (−3.37, −0.75) | −0.24 (−1.38, 0.90) | −1.53 (−2.90, −0.15) | 0.60 |
| Single/Divorced/ Separated/ Widowed/Others (n = 136) | Reference group | 0.92 (−2.29, 4.14) | 3.02 (−1.40, 7.44) | −1.63 (−4.49, 1.24) | 0.56 (−2.56, 3.68) | −3.27 (−8.21, 1.66) | |
| Smoking status | |||||||
| Smokers (n = 125) | Reference group | 1.94 (−1.25, 5.13) | −1.02 (−6.63, 4.59) | −4.82 (−8.12, −1.52) | −0.13 (−3.07, 2.81) | −1.53 (−4.25, 1.18) | 0.001 |
| Nonsmokers + Ex-smokers (n = 778) | Reference group | −1.29 (−2.53, −0.05) | 1.37 (−0.17, 2.92) | −1.90 (−3.16, −0.64) | −0.57 (−1.73, 0.58) | −2.36 (−4.03, −0.69) | |
| Alcohol consumption | |||||||
| Yes (n = 765) | Reference group | 1.10 (−1.33, 3.53) | −0.50 (−4.16, 3.15) | 1.08 (−1.38, 3.54) | −0.04 (−2.46, 2.38) | −1.96 (−5.10, 1.19) | 0.04 |
| No (n = 139) | Reference group | −0.78 (−2.05, 0.49) | 1.87 (0.23, 3.50) | −2.31 (−3.63, −0.99) | 0.17 (−1.04, 1.37) | −1.64 (−3.19, −0.09) | |
| Mental Component Summary | |||||||
| Sex | |||||||
| Men (n = 347) | Reference group | 0.23 (−1.47, 1.93) | −1.16 (−3.61, 1.28) | 0.63 (−1.53, 2.79) | −0.15 (−2.05, 1.76) | −0.08 (−1.95, 1.78) | 0.23 |
| Women (n = 559) | Reference group | −0.37 (−1.98, 1.24) | −0.47 (−2.48, 1.54) | 0.36 (−1.13, 1.86) | 1.80 (−0.31, 3.92) | 2.39 (0.51, 4.26) | |
| Marital status | |||||||
| Married (n = 764) | Reference group | 0.18 (−1.00, 1.37) | −0.43 (−2.08, 1.21) | 0.58 (−0.74, 1.91) | 0.74 (−0.72, 2.20) | 1.68 (0.37, 3.00) | 0.22 |
| Single/Divorced/ Separated/ Widowed/Others (n = 136) | Reference group | 1.74 (−2.49, 5.97) | −1.41 (−5.64, 2.83) | 1.02 (−2.21, 4.25) | 3.43 (0.20, 6.65) | −2.48 (−5.82, 0.86) | |
| Smoking status | |||||||
| Smokers (n = 125) | Reference group | −0.34 (−3.37, 2.70) | 1.821 (−1.89, 5.54) | 0.24 (−4.48, 4.95) | 3.66 (−0.10, 7.43) | 0.90 (−2.09, 3.88) | 0.34 |
| Nonsmokers + Ex-smokers (n = 778) | Reference group | 0.22 (−1.04, 1.49) | −0.83 (−2.48, 0.82) | 0.50 (−0.76, 1.77) | 0.43 (−1.03, 1.90) | 1.05 (−0.37, 2.47) | |
| Alcohol consumption | |||||||
| Yes (n = 765) | Reference group | 1.74 (−0.95, 4.43) | 2.30 (−1.61, 6.22) | 3.19 (−0.33, 6.72) | 1.28 (−2.20, 4.75) | 0.48 (−3.55, 4.51) | 0.22 |
| No (n = 139) | Reference group | −0.28 (−1.54, 0.97) | −1.01 (−2.52, 0.51) | −0.09 (−1.37, 1.19) | 0.88 (−0.61, 2.37) | 0.96 (−0.40, 2.31) | |
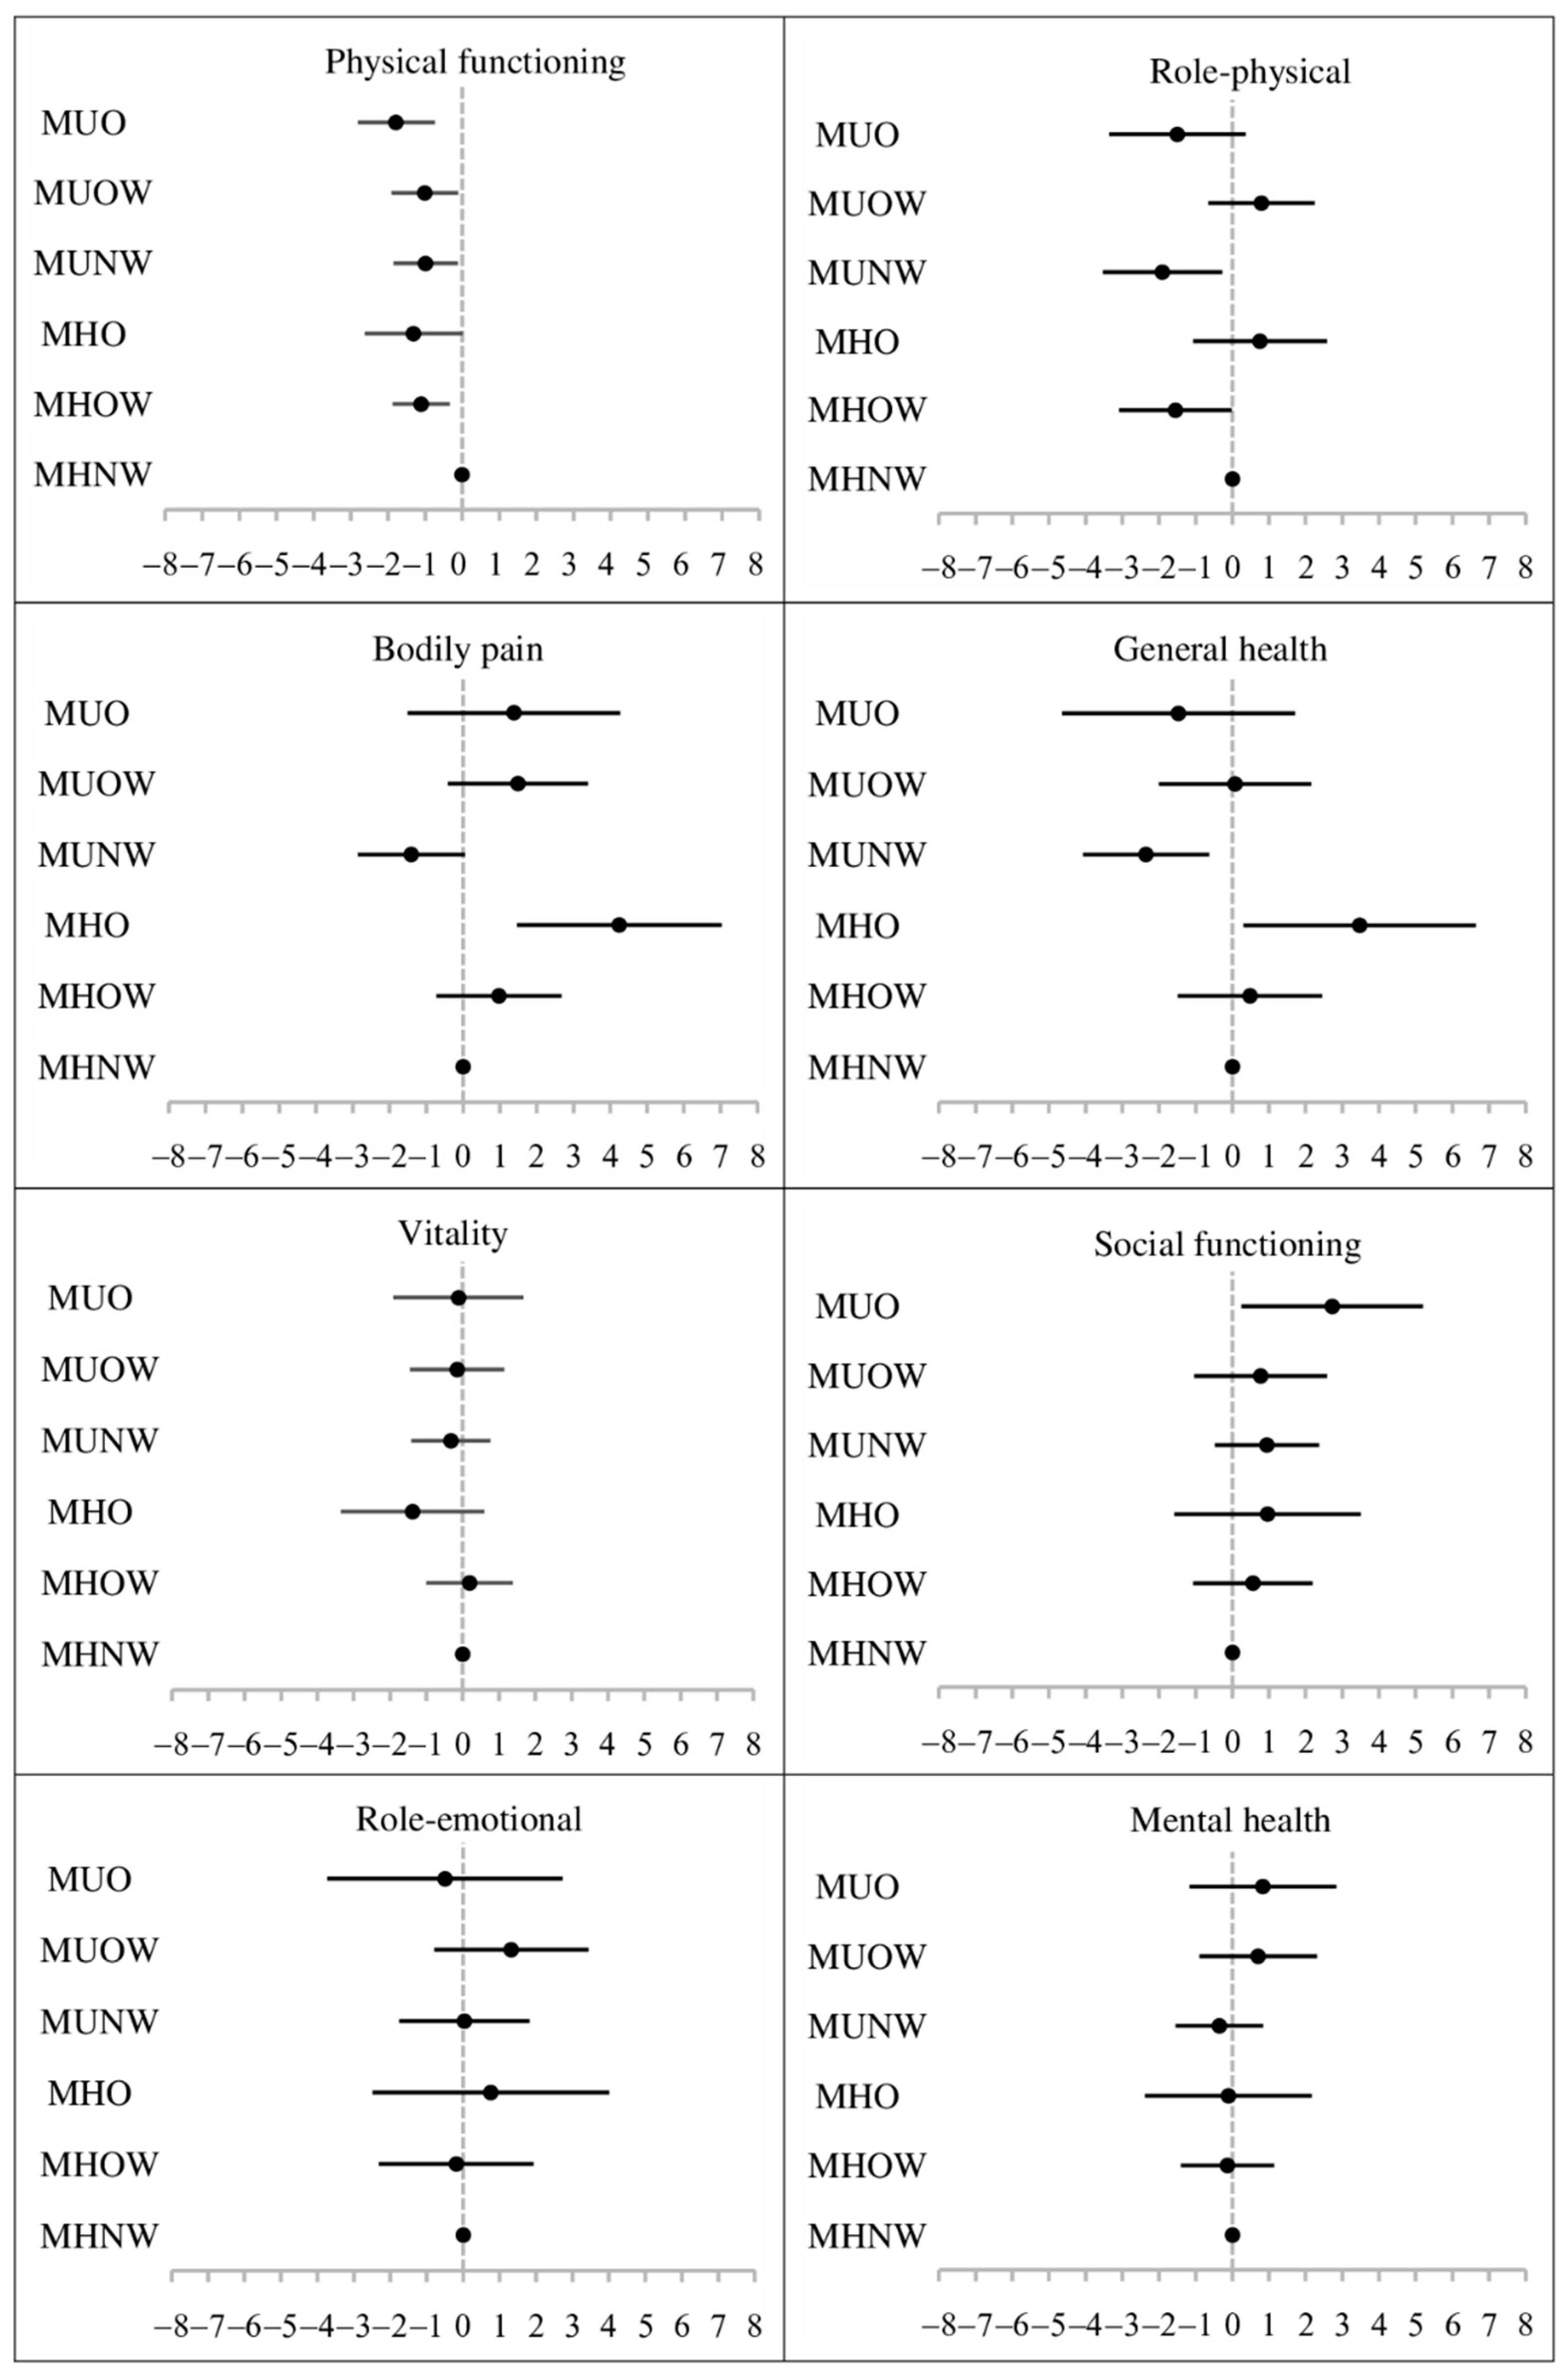
| Metabolically Healthy a Normal Weight | Metabolically Healthy a Overweight | Metabolically Healthy a Obesity | Metabolically Unhealthy Normal Weight | Metabolically Unhealthy Overweight | Metabolically Unhealthy Obesity | |
|---|---|---|---|---|---|---|
| PCS | Reference group | −0.79 (−1.90, 0.32) | 1.09 (−0.42, 2.59) | −2.45 (−3.84, −1.06) | −0.21 (−1.33, 0.91) | −2.16 (−3.58, −0.74) |
| MCS | Reference group | 0.53 (−0.60, 1.67) | −0.51 (−1.97, 0.94) | −0.30 (−1.50, 0.90) | −0.29 (−1.73, 1.15) | 0.71 (−0.63, 2.04) |
| Physical functioning | Reference group | −0.98 (−1.71, −0.25) | −1.28 (−2.55, −0.01) | −1.27 (−2.30, −0.24) | −1.10 (−2.07, −0.14) | −1.74 (−2.78, −0.69) |
| Role-physical | Reference group | −1.02 (−2.48, 0.43) | 0.80 (−1.02, 2.61) | −1.61 (−3.44, 0.22) | 0.97 (−0.61, 2.55) | −1.29 (−3.12, 0.55) |
| Bodily pain | Reference group | 0.91 (−0.74, 2.57) | 4.09 (1.32, 6.85) | −2.39 (−4.02, −0.76) | 1.52 (−0.40, 3.45) | 1.19 (−1.68, 4.06) |
| General health | Reference group | 0.63 (−1.21, 2.48) | 3.39 (0.30, 6.48) | −2.90 (−4.87, −0.94) | 0.12 (−2.04, 2.28) | −1.30 (−4.43, 1.82) |
| Vitality | Reference group | 0.37 (−0.75, 1.49) | −1.38 (−3.27, 0.51) | −0.97 (−2.18, 0.23) | −0.98 (−2.32, 0.36) | −0.37 (−2.17, 1.43) |
| Social functioning | Reference group | 0.38 (−1.19, 1.95) | 0.62 (−1.87, 3.10) | −0.93 (−2.57, 0.70) | −0.63 (−2.51, 1.25) | 1.65 (−0.78, 4.08) |
| Role-emotional | Reference group | 0.34 (−1.68, 2.35) | 0.82 (−2.51, 4.15) | 0.62 (−1.25, 2.50) | 1.02 (−1.28, 3.31) | −0.34 (−3.50, 2.83) |
| Mental health | Reference group | 0.14 (−1.10, 1.38) | −0.34 (−2.53, 1.85) | −1.47 (−2.70, −0.24) | −0.33 (−2.02, 1.36) | 0.47 (−1.54, 2.49) |
Publisher’s Note: MDPI stays neutral with regard to jurisdictional claims in published maps and institutional affiliations. |
© 2021 by the authors. Licensee MDPI, Basel, Switzerland. This article is an open access article distributed under the terms and conditions of the Creative Commons Attribution (CC BY) license (https://creativecommons.org/licenses/by/4.0/).
Share and Cite
Lin, Y.-H.; Chang, H.-T.; Tseng, Y.-H.; Chen, H.-S.; Chiang, S.-C.; Chen, T.-J.; Hwang, S.-J. Do Metabolically Healthy People with Obesity Have a Lower Health-Related Quality of Life? A Prospective Cohort Study in Taiwan. J. Clin. Med. 2021, 10, 5117. https://doi.org/10.3390/jcm10215117
Lin Y-H, Chang H-T, Tseng Y-H, Chen H-S, Chiang S-C, Chen T-J, Hwang S-J. Do Metabolically Healthy People with Obesity Have a Lower Health-Related Quality of Life? A Prospective Cohort Study in Taiwan. Journal of Clinical Medicine. 2021; 10(21):5117. https://doi.org/10.3390/jcm10215117
Chicago/Turabian StyleLin, Yi-Hsuan, Hsiao-Ting Chang, Yen-Han Tseng, Harn-Shen Chen, Shu-Chiung Chiang, Tzeng-Ji Chen, and Shinn-Jang Hwang. 2021. "Do Metabolically Healthy People with Obesity Have a Lower Health-Related Quality of Life? A Prospective Cohort Study in Taiwan" Journal of Clinical Medicine 10, no. 21: 5117. https://doi.org/10.3390/jcm10215117
APA StyleLin, Y.-H., Chang, H.-T., Tseng, Y.-H., Chen, H.-S., Chiang, S.-C., Chen, T.-J., & Hwang, S.-J. (2021). Do Metabolically Healthy People with Obesity Have a Lower Health-Related Quality of Life? A Prospective Cohort Study in Taiwan. Journal of Clinical Medicine, 10(21), 5117. https://doi.org/10.3390/jcm10215117