
The Role of Non-Gaussian Models of Diffusion Weighted MRI in Hepatocellular Carcinoma: A Systematic Review


Abstract
1. Introduction
2. Materials and Methods
2.1. Search Strategy and Selection Criteria
2.2. Planning and Conducting the Review
2.3. Quality Assessment
3. Results
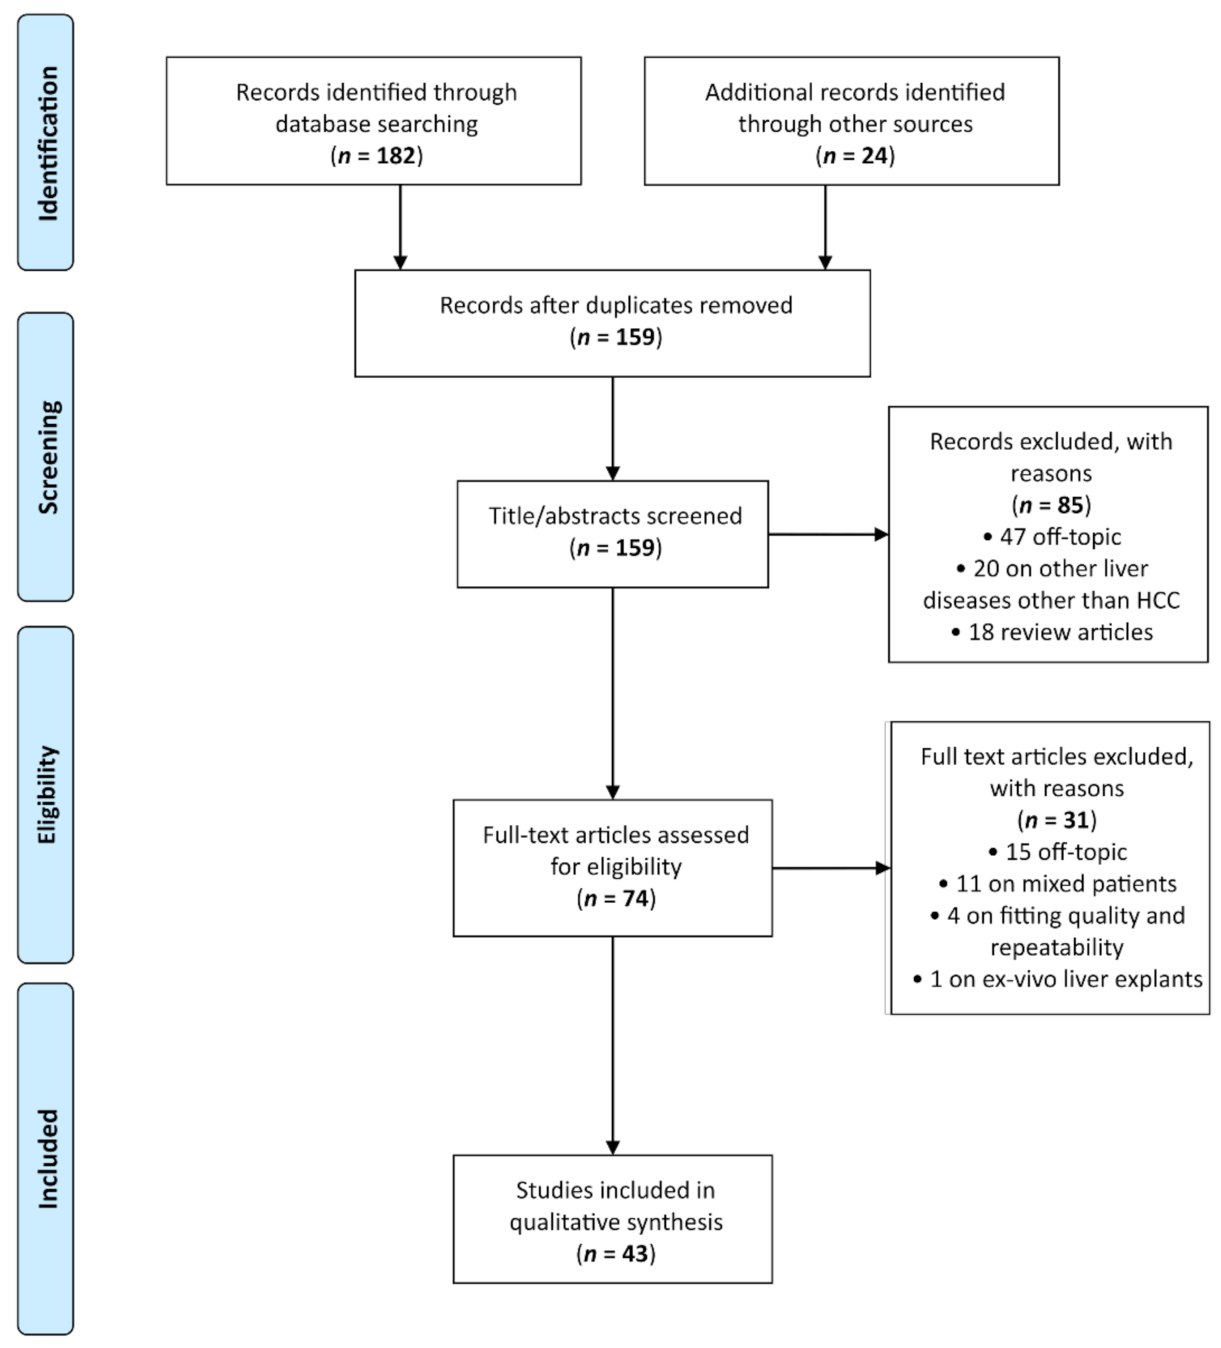
3.1. Study Selection
3.2. Characteristics of Included Studies
3.3. Studies on IVIM
3.3.1. Diagnosis
3.3.2. Grading
3.3.3. Response to Therapy
3.3.4. Prognosis
3.4. Studies on DKI
3.5. Studies on SE
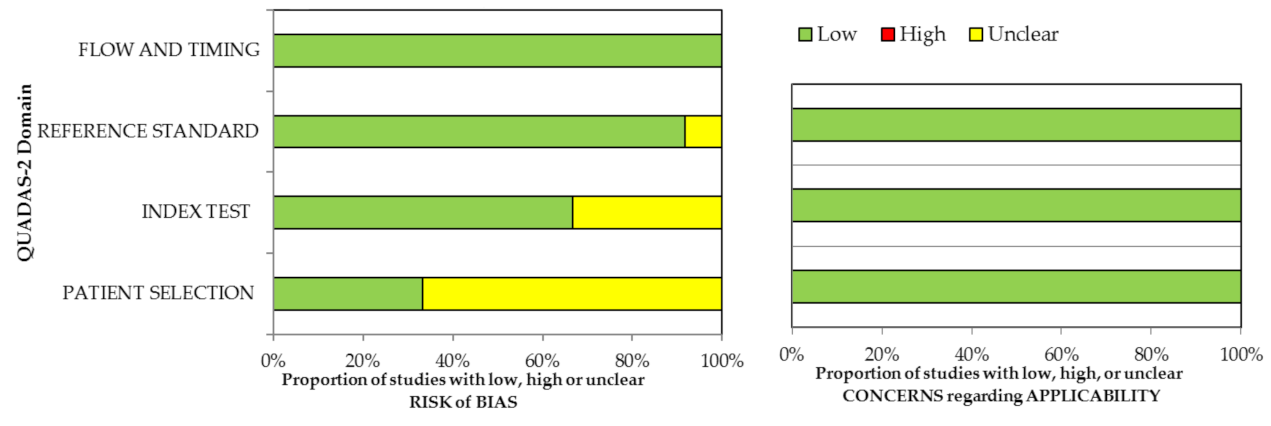
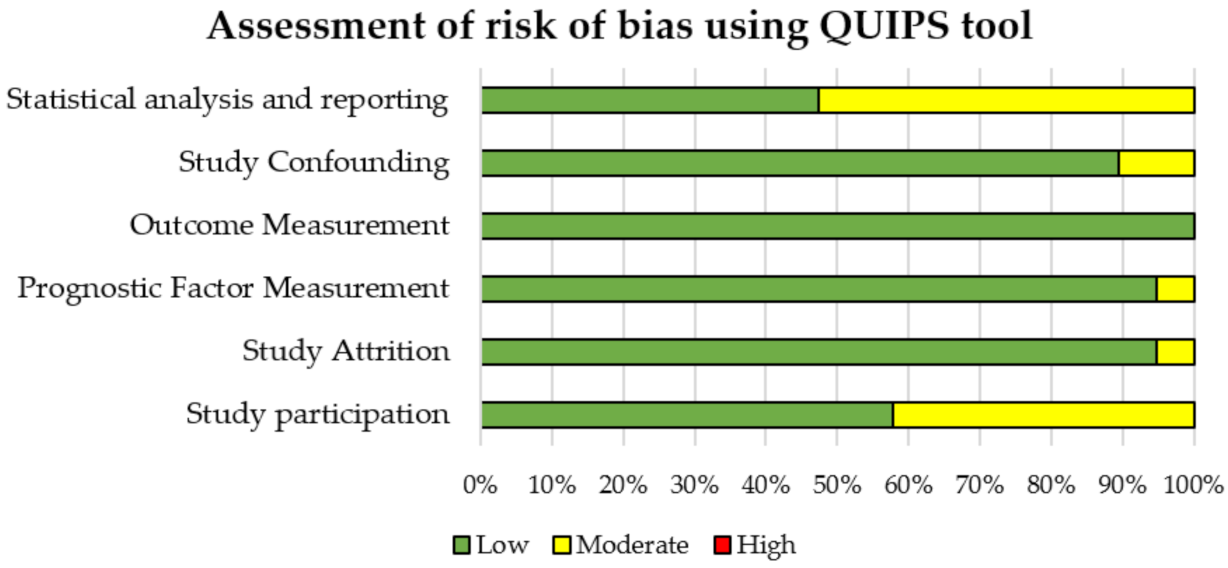
3.6. Quality Assessment
4. Discussion
5. Conclusions
Supplementary Materials
Author Contributions
Funding
Informed Consent Statement
Conflicts of Interest
References
- Sung, H.; Ferlay, J.; Siegel, R.L.; Laversanne, M.; Soerjomataram, I.; Jemal, A.; Bray, F. Global cancer statistics 2020: GLOBOCAN estimates of incidence and mortality worldwide for 36 cancers in 185 countries. CA Cancer J. Clin. 2021, 71, 209–249. [Google Scholar] [CrossRef] [PubMed]
- Nevola, R.; Rinaldi, L.; Giordano, M.; Marrone, A.; Adinolfi, L.E. Mechanisms and clinical behavior of hepatocellular carcinoma in HBV and HCV infection and alcoholic and non-alcoholic fatty liver disease. Hepatoma Res. 2018, 4, 55. [Google Scholar] [CrossRef]
- Chen, C.; Wang, G. Mechanisms of hepatocellular carcinoma and challenges and opportunities for molecular targeted therapy. World J. Hepatol. 2015, 7, 1964–1970. [Google Scholar] [CrossRef] [PubMed]
- Ogunwobi, O.O.; Harricharran, T.; Huaman, J.; Galuza, A.; Odumuwagun, O.; Tan, Y.; Ma, G.X.; Nguyen, M.T. Mechanisms of hepatocellular carcinoma progression. World J. Gastroenterol. 2019, 25, 2279–2293. [Google Scholar] [CrossRef]
- Jiang, H.-Y.; Chen, J.; Xia, C.-C.; Cao, L.-K.; Duan, T.; Song, B. Noninvasive imaging of hepatocellular carcinoma: From diagnosis to prognosis. World J. Gastroenterol. 2018, 24, 2348–2362. [Google Scholar] [CrossRef] [PubMed]
- European Association for the Study of the Liver; European Organisation for Research and Treatment of Cancer. EASL–EORTC Clinical Practice Guidelines: Management of Hepatocellular Carcinoma. J. Hepatol. 2012, 56, 908–943. [Google Scholar] [CrossRef] [PubMed]
- Choi, J.-Y.; Lee, J.-M.; Sirlin, C.B. CT and MR Imaging Diagnosis and Staging of Hepatocellular Carcinoma: Part I. Development, Growth, and Spread: Key Pathologic and Imaging Aspects. Radiology 2014, 272, 635–654. [Google Scholar] [CrossRef] [PubMed]
- Choi, J.-Y.; Lee, J.-M.; Sirlin, C.B. CT and MR Imaging Diagnosis and Staging of Hepatocellular Carcinoma: Part II. Extracellular Agents, Hepatobiliary Agents, and Ancillary Imaging Features. Radiology 2014, 273, 30–50. [Google Scholar] [CrossRef] [PubMed]
- Le Bihan, D.; Iima, M. Diffusion Magnetic Resonance Imaging: What Water Tells Us about Biological Tissues. PLoS Biol. 2015, 13, e1002203. [Google Scholar] [CrossRef]
- Koh, D.-M.; Collins, D.J. Diffusion-Weighted MRI in the Body: Applications and Challenges in Oncology. Am. J. Roentgenol. 2007, 188, 1622–1635. [Google Scholar] [CrossRef] [PubMed]
- Gluskin, J.S.; Chegai, F.; Monti, S.; Squillaci, E.; Mannelli, L. Hepatocellular Carcinoma and Diffusion-Weighted MRI: Detection and Evaluation of Treatment Response. J. Cancer 2016, 7, 1565–1570. [Google Scholar] [CrossRef]
- Shankar, S.; Kalra, N.; Bhatia, A.; Srinivasan, R.; Singh, P.; Dhiman, R.K.; Khandelwal, N.; Chawla, Y. Role of Diffusion Weighted Imaging (DWI) for Hepatocellular Carcinoma (HCC) Detection and Its Grading on 3T MRI: A Prospective Study. J. Clin. Exp. Hepatol. 2016, 6, 303–310. [Google Scholar] [CrossRef] [PubMed]
- Vouche, M.; Salem, R.; Lewandowski, R.J.; Miller, F.H. Can volumetric ADC measurement help predict response to Y90 radioembolization in HCC? Abdom. Imaging 2015, 40, 1471–1480. [Google Scholar] [CrossRef] [PubMed]
- Park, H.J.; Kim, S.H.; Jang, K.M.; Lim, S.; Kang, T.W.; Park, H.C.; Choi, N. Added Value of Diffusion-Weighted MRI for Evaluating Viable Tumor of Hepatocellular Carcinomas Treated with Radiotherapy in Patients with Chronic Liver Disease. Am. J. Roentgenol. 2014, 202, 92–101. [Google Scholar] [CrossRef] [PubMed]
- Surov, A.; Pech, M.; Omari, J.; Fischbach, F.; Damm, R.; Fischbach, K.; Powerski, M.; Relja, B.; Wienke, A. Diffusion-Weighted Imaging Reflects Tumor Grading and Microvascular Invasion in Hepatocellular Carcinoma. Liver Cancer 2021, 10, 10–24. [Google Scholar] [CrossRef] [PubMed]
- Shaghaghi, M.; Ghasabeh, M.A.; Ameli, S.; Ghadimi, M.; Hazhirkarzar, B.; Habibabadi, R.R.; Khoshpouri, P.; Pandey, A.; Pandey, P.; Kamel, I.R. Post-TACE changes in ADC histogram predict overall and transplant-free survival in patients with well-defined HCC: A retrospective cohort with up to 10 years follow-up. Eur. Radiol. 2021, 31, 1378–1390. [Google Scholar] [CrossRef] [PubMed]
- Labeur, T.A.; Runge, J.H.; Klompenhouwer, E.G.; Klümpen, H.-J.; Takkenberg, R.B.; Van Delden, O.M. Diffusion-weighted imaging of hepatocellular carcinoma before and after transarterial chemoembolization: Role in survival prediction and response evaluation. Abdom. Radiol. 2019, 44, 2740–2750. [Google Scholar] [CrossRef] [PubMed]
- Alexander, A.L.; Lee, J.E.; Lazar, M.; Field, A.S. Diffusion tensor imaging of the brain. Neurotherapeutics 2007, 4, 316–329. [Google Scholar] [CrossRef]
- Wang, Y.-T.; Li, Y.-C.; Kong, W.-F.; Yin, L.-L.; Pu, H. Diffusion tensor imaging beyond brains: Applications in abdominal and pelvic organs. World J. Meta Anal. 2017, 5, 71–79. [Google Scholar] [CrossRef]
- Li, X.; Liang, Q.; Zhuang, L.; Zhang, X.; Chen, T.; Li, L.; Liu, J.; Calimente, H.; Wei, Y.; Hu, J. Preliminary Study of MR Diffusion Tensor Imaging of the Liver for the Diagnosis of Hepatocellular Carcinoma. PLoS ONE 2015, 10, e0135568. [Google Scholar] [CrossRef]
- Brancato, V.; Cavaliere, C.; Salvatore, M.; Monti, S. Non-Gaussian models of diffusion weighted imaging for detection and characterization of prostate cancer: A systematic review and meta-analysis. Sci. Rep. 2019, 9, 16837. [Google Scholar] [CrossRef] [PubMed]
- Tang, L.; Zhou, X.J. Diffusion MRI of cancer: From low to high b-values. J. Magn. Reson. Imaging 2019, 49, 23–40. [Google Scholar] [CrossRef] [PubMed]
- Zhang, G.; Wang, S.; Wen, D.; Zhang, J.; Wei, X.; Ma, W.; Zhao, W.; Wang, M.; Wu, G.; Zhang, J. Comparison of non-Gaussian and Gaussian diffusion models of diffusion weighted imaging of rectal cancer at 3.0 T MRI. Sci. Rep. 2016, 6, 38782. [Google Scholar] [CrossRef] [PubMed]
- Le Bihan, D. What can we see with IVIM MRI? NeuroImage 2019, 187, 56–67. [Google Scholar] [CrossRef]
- Le Bihan, D.; Breton, E.; Lallemand, D.; Aubin, M.L.; Vignaud, J.; Laval-Jeantet, M. Separation of diffusion and perfusion in intravoxel incoherent motion MR imaging. Radiology 1988, 168, 497–505. [Google Scholar] [CrossRef]
- Jensen, J.H.; Helpern, J.A. MRI quantification of non-Gaussian water diffusion by kurtosis analysis. NMR Biomed. 2010, 23, 698–710. [Google Scholar] [CrossRef]
- Bennett, K.M.; Schmainda, K.M.; Bennett, R.; Rowe, D.B.; Lu, H.; Hyde, J.S. Characterization of continuously distributed cortical water diffusion rates with a stretched-exponential model. Magn. Reson. Med. 2003, 50, 727–734. [Google Scholar] [CrossRef]
- Granata, V.; Fusco, R.; Catalano, O.; Guarino, B.; Granata, F.; Tatangelo, F.; Avallone, A.; Piccirillo, M.; Palaia, R.; Izzo, F.; et al. Intravoxel incoherent motion (IVIM) in diffusion-weighted imaging (DWI) for Hepatocellular carcinoma: Correlation with histologic grade. Oncotarget 2016, 7, 79357–79364. [Google Scholar] [CrossRef]
- Noda, Y.; Goshima, S.; Fujimoto, K.; Akamine, Y.; Kajita, K.; Kawai, N.; Matsuo, M. Comparison of the Diagnostic Value of Mono-exponential, Bi-exponential, and Stretched Exponential Signal Models in Diffusion-weighted MR Imaging for Differentiating Benign and Malignant Hepatic Lesions. Magn. Reson. Med. Sci. 2021, 20, 69–75. [Google Scholar] [CrossRef]
- Cao, L.; Chen, J.; Duan, T.; Wang, M.; Jiang, H.; Wei, Y.; Xia, C.; Zhou, X.; Yan, X.; Song, B. Diffusion kurtosis imaging (DKI) of hepatocellular carcinoma: Correlation with microvascular invasion and histologic grade. Quant. Imaging Med. Surg. 2019, 9, 590–602. [Google Scholar] [CrossRef]
- Kim, H.C.; Seo, N.; Chung, Y.E.; Park, M.-S.; Choi, J.-Y.; Kim, M.-J. Characterization of focal liver lesions using the stretched exponential model: Comparison with monoexponential and biexponential diffusion-weighted magnetic resonance imaging. Eur. Radiol. 2019, 29, 5111–5120. [Google Scholar] [CrossRef]
- Granata, V.; Fusco, R.; Amato, D.M.; Albino, V.; Patrone, R.; Izzo, F.; Petrillo, A. Beyond the Vascular Profile: Conventional DWI, IVIM and Kurtosis in the Assessment of Hepatocellular Carcinoma. Eur. Rev. Med. Pharmacol. Sci. 2020, 24, 7284–7293. [Google Scholar] [CrossRef]
- Moher, D.; Liberati, A.; Tetzlaff, J.; Altman, D.G.; The PRISMA Group. Preferred reporting items for systematic reviews and meta-analyses: The PRISMA statement. PLoS Med. 2009, 6, e1000097. [Google Scholar] [CrossRef] [PubMed]
- Whiting, P.F.; Rutjes, A.W.S.; Westwood, M.E.; Mallett, S.; Deeks, J.J.; Reitsma, J.B.; Leeflang, M.M.G.; Sterne, J.A.C.; Bossuyt, P.M.M.; The QUADAS-2 Group. QUADAS-2: A Revised Tool for the Quality Assessment of Diagnostic Accuracy Studies. Ann. Intern. Med. 2011, 155, 529–536. [Google Scholar] [CrossRef] [PubMed]
- Hayden, J.A.; Van Der Windt, D.A.; Cartwright, J.L.; Côté, P.; Bombardier, C. Assessing Bias in Studies of Prognostic Factors. Ann. Intern. Med. 2013, 158, 280–286. [Google Scholar] [CrossRef] [PubMed]
- Hayden, J.A.; Côté, P.; Bombardier, C. Evaluation of the Quality of Prognosis Studies in Systematic Reviews. Ann. Intern. Med. 2006, 144, 427–437. [Google Scholar] [CrossRef] [PubMed]
- Peng, J.; Zheng, J.; Yang, C.; Wang, R.; Zhou, Y.; Tao, Y.-Y.; Gong, X.-Q.; Wang, W.-C.; Zhang, X.-M.; Yang, L. Intravoxel incoherent motion diffusion-weighted imaging to differentiate hepatocellular carcinoma from intrahepatic cholangiocarcinoma. Sci. Rep. 2020, 10, 7717. [Google Scholar] [CrossRef] [PubMed]
- Shan, Q.; Kuang, S.; Zhang, Y.; He, B.; Wu, J.; Zhang, T.; Wang, J. A comparative study of monoexponential versus biexponential models of diffusion-weighted imaging in differentiating histologic grades of hepatitis B virus-related Hepatocellular Carcinoma. Abdom. Radiol. 2020, 45, 90–100. [Google Scholar] [CrossRef] [PubMed]
- Wu, B.; Jia, F.; Li, X.; Li, L.; Wang, K.; Han, D. Comparative Study of Amide Proton Transfer Imaging and Intravoxel Incoherent Motion Imaging for Predicting Histologic Grade of Hepatocellular Carcinoma. Front. Oncol. 2020, 10, 562049. [Google Scholar] [CrossRef]
- Jia, F.; Wu, B.; Yan, R.; Li, L.; Wang, K.; Han, D. Prediction Model for Intermediate-Stage Hepatocellular Carcinoma Response to Transarterial Chemoembolization. J. Magn. Reson. Imaging 2020, 52, 1657–1667. [Google Scholar] [CrossRef]
- Shi, G.; Han, X.; Wang, Q.; Ding, Y.; Liu, H.; Zhang, Y.; Dai, Y. Evaluation of Multiple Prognostic Factors of Hepatocellular Carcinoma with Intra-Voxel Incoherent Motions Imaging by Extracting the Histogram Metrics. Cancer Manag. Res. 2020, 12, 6019–6031. [Google Scholar] [CrossRef] [PubMed]
- Hectors, S.J.; Lewis, S.; Kennedy, P.; Bane, O.; Said, D.; Segall, M.; Schwartz, M.; Kim, E.; Taouli, B. Assessment of Hepatocellular Carcinoma Response to 90Y Radioembolization Using Dynamic Contrast Material-Enhanced MRI and Intravoxel Incoherent Motion Diffusion-weighted Imaging. Radiol. Imaging Cancer 2020, 2, e190094. [Google Scholar] [CrossRef] [PubMed]
- Wang, G.-Z.; Guo, L.-F.; Gao, G.-H.; Li, Y.; Wang, X.-Z.; Yuan, Z.-G. Magnetic Resonance Diffusion Kurtosis Imaging versus Diffusion-Weighted Imaging in Evaluating the Pathological Grade of Hepatocellular Carcinoma. Cancer Manag. Res. 2020, 12, 5147–5158. [Google Scholar] [CrossRef]
- Wu, B.; Jia, F.; Li, X.; Zhang, M.; Han, D.; Jia, Z. Amide Proton Transfer Imaging vs. Diffusion Kurtosis Imaging for Predicting Histological Grade of Hepatocellular Carcinoma. J. Hepatocell. Carcinoma 2020, 7, 159–168. [Google Scholar] [CrossRef]
- Jia, Y.; Cai, H.; Wang, M.; Luo, Y.; Xu, L.; Dong, Z.; Yan, X.; Li, Z.-P.; Feng, S.-T. Diffusion Kurtosis MR Imaging versus Conventional Diffusion-Weighted Imaging for Distinguishing Hepatocellular Carcinoma from Benign Hepatic Nodules. Contrast Media Mol. Imaging 2019, 2019, 2030147. [Google Scholar] [CrossRef]
- Yuan, Z.-G.; Wang, Z.-Y.; Xia, M.-Y.; Li, F.-Z.; Li, Y.; Shen, Z.; Wang, X.-Z. Comparison of diffusion kurtosis imaging versus diffusion weighted imaging in predicting the recurrence of early stage single nodules of hepatocellular carcinoma treated by radiofrequency ablation. Cancer Imaging 2019, 19, 30. [Google Scholar] [CrossRef]
- Luo, X.; Li, Y.; Shang, Q.; Liu, H.; Song, L. Role of Diffusional Kurtosis Imaging in Evaluating the Efficacy of Transcatheter Arterial Chemoembolization in Patients with Liver Cancer. Cancer Biother. Radiopharm. 2019, 34, 614–620. [Google Scholar] [CrossRef]
- Server, S.; Sabet, S.; Bilgin, R.; Inan, N.; Yuzer, Y.; Tokat, Y. Intravoxel Incoherent Motion Parameters for Assessing the Efficiency of Locoregional Bridging Treatments before Liver Transplantation. Transplant. Proc. 2019, 51, 2391–2396. [Google Scholar] [CrossRef]
- Shao, S.; Shan, Q.; Zheng, N.; Wang, B.; Wang, J. Role of Intravoxel Incoherent Motion in Discriminating Hepatitis B Virus-Related Intrahepatic Mass-Forming Cholangiocarcinoma from Hepatocellular Carcinoma Based on Liver Imaging Reporting and Data System v2018. Cancer Biother. Radiopharm. 2019, 34, 511–518. [Google Scholar] [CrossRef] [PubMed]
- Sokmen, B.K.; Sabet, S.; Oz, A.; Server, S.; Namal, E.; Dayangac, M.; Dogusoy, G.B.; Tokat, Y.; Inan, N. Value of Intravoxel Incoherent Motion for Hepatocellular Carcinoma Grading. Transplant. Proc. 2019, 51, 1861–1866. [Google Scholar] [CrossRef] [PubMed]
- Wei, Y.; Huang, Z.; Tang, H.; Deng, L.; Yuan, Y.; Li, J.; Wu, D.; Wei, X.; Song, B. IVIM improves preoperative assessment of microvascular invasion in HCC. Eur. Radiol. 2019, 29, 5403–5414. [Google Scholar] [CrossRef]
- Zhang, Y.; Kuang, S.; Shan, Q.; Rong, D.; Zhang, Z.; Yang, H.; Wu, J.; Chen, J.; He, B.; Deng, Y.; et al. Can IVIM help predict HCC recurrence after hepatectomy? Eur. Radiol. 2019, 29, 5791–5803. [Google Scholar] [CrossRef] [PubMed]
- Wu, L.-F.; Rao, S.-X.; Xu, P.-J.; Yang, L.; Chen, C.-Z.; Liu, H.; Huang, J.-F.; Fu, C.-X.; Halim, A.; Zeng, M.-S. Pre-TACE kurtosis of ADCtotal derived from histogram analysis for diffusion-weighted imaging is the best independent predictor of prognosis in hepatocellular carcinoma. Eur. Radiol. 2019, 29, 213–223. [Google Scholar] [CrossRef] [PubMed]
- Budjan, J.; Sauter, E.A.; Zoellner, F.G.; Lemke, A.; Wambsganss, J.; Schoenberg, S.O.; Attenberger, U.I. Diffusion kurtosis imaging of the liver at 3 Tesla: In Vivo comparison to standard diffusion-weighted imaging. Acta Radiol. 2018, 59, 18–25. [Google Scholar] [CrossRef]
- Hectors, S.J.; Wagner, M.; Besa, C.; Huang, W.; Taouli, B. Multiparametric FDG-PET/MRI of Hepatocellular Carcinoma: Initial Experience. Contrast Media Mol. Imaging 2018, 2018, 5638283. [Google Scholar] [CrossRef] [PubMed]
- Li, H.; Zhang, J.; Zheng, Z.; Guo, Y.; Chen, M.; Xie, C.; Zhang, Z.; Mei, Y.; Feng, Y.; Xu, Y. Preoperative histogram analysis of intravoxel incoherent motion (IVIM) for predicting microvascular invasion in patients with single Hepatocellular Carcinoma. Eur. J. Radiol. 2018, 105, 65–71. [Google Scholar] [CrossRef] [PubMed]
- Wei, Y.; Gao, F.; Zheng, D.; Huang, Z.; Wang, M.; Hu, F.; Chen, C.; Duan, T.; Chen, J.; Cao, L.; et al. Intrahepatic cholangiocarcinoma in the setting of HBV-related cirrhosis: Differentiation with Hepatocellular Carcinoma by using Intravoxel incoherent motion diffusion-weighted MR imaging. Oncotarget 2018, 9, 7975–7983. [Google Scholar] [CrossRef]
- Zhao, W.; Liu, W.; Liu, H.; Yi, X.; Hou, J.; Pei, Y.; Liu, H.; Feng, D.; Liu, L.; Li, W. Preoperative prediction of microvascular invasion of Hepatocellular Carcinoma with IVIM diffusion-weighted MR imaging and Gd-EOB-DTPA-enhanced MR imaging. PLoS ONE 2018, 13, e0197488. [Google Scholar] [CrossRef]
- Zhu, S.-C.; Liu, Y.-H.; Wei, Y.; Li, L.-L.; Dou, S.-W.; Sun, T.-Y.; Shi, D.-P. Intravoxel incoherent motion diffusion-weighted magnetic resonance imaging for predicting histological grade of Hepatocellular Carcinoma: Comparison with conventional diffusion-weighted imaging. World J. Gastroenterol. 2018, 24, 929–940. [Google Scholar] [CrossRef]
- Wang, W.-T.; Yang, L.; Yang, Z.-X.; Hu, X.-X.; Ding, Y.; Yan, X.; Fu, C.-X.; Grimm, R.; Zeng, M.-S.; Rao, S.-X. Assessment of Microvascular Invasion of Hepatocellular Carcinoma with Diffusion Kurtosis Imaging. Radiology 2018, 286, 571–580. [Google Scholar] [CrossRef]
- Choi, I.Y.; Lee, S.S.; Sung, Y.S.; Cheong, H.; Lee, H.; Byun, J.H.; Kim, S.Y.; Lee, S.J.; Shin, Y.M.; Lee, M.-G. Intravoxel incoherent motion diffusion-weighted imaging for characterizing focal hepatic lesions: Correlation with lesion enhancement. J. Magn. Reson. Imaging 2017, 45, 1589–1598. [Google Scholar] [CrossRef]
- Luo, M.; Zhang, L.; Jiang, X.H.; Zhang, W.D. Intravoxel incoherent motion: Application in differentiation of Hepatocellular Carcinoma and focal nodular hyperplasia. Diagn. Interv. Radiol. 2017, 23, 263–271. [Google Scholar] [CrossRef]
- Shan, Q.; Chen, J.; Zhang, T.; Yan, R.; Wu, J.; Shu, Y.; Kang, Z.; He, B.; Zhang, Z.; Wang, J. Evaluating histologic differentiation of hepatitis B virus-related Hepatocellular Carcinoma using intravoxel incoherent motion and AFP levels alone and in combination. Abdom. Radiol. 2017, 42, 2079–2088. [Google Scholar] [CrossRef] [PubMed]
- Wu, L.; Xu, P.; Rao, S.-X.; Yang, L.; Chen, C.; Liu, H.; Fu, C.; Zeng, M. ADCtotal ratio and D ratio derived from intravoxel incoherent motion early after TACE are independent predictors for survival in Hepatocellular Carcinoma. J. Magn. Reson. Imaging 2017, 46, 820–830. [Google Scholar] [CrossRef] [PubMed]
- Hectors, S.J.; Wagner, M.; Besa, C.; Bane, O.; Dyvorne, H.A.; Fiel, M.I.; Zhu, H.; Donovan, M.; Taouli, B. Intravoxel incoherent motion diffusion-weighted imaging of Hepatocellular Carcinoma: Is there a correlation with flow and perfusion metrics obtained with dynamic contrast-enhanced MRI? J. Magn. Reson. Imaging 2016, 44, 856–864. [Google Scholar] [CrossRef]
- Mürtz, P.; Penner, A.-H.; Pfeiffer, A.-K.; Sprinkart, A.M.; Pieper, C.C.; König, R.; Block, W.; Schild, H.H.; Willinek, W.A.; Kukuk, G.M. Intravoxel incoherent motion model-based analysis of diffusion-weighted magnetic resonance imaging with 3 b-values for response assessment in locoregional therapy of Hepatocellular Carcinoma. OncoTargets Ther. 2016, 9, 6425–6433. [Google Scholar] [CrossRef] [PubMed]
- Kakite, S.; Dyvorne, H.A.; Lee, K.M.; Jajamovich, G.H.; Knight-Greenfield, A.; Taouli, B. Hepatocellular Carcinoma: IVIM diffusion quantification for prediction of tumor necrosis compared to enhancement ratios. Eur. J. Radiol. Open 2016, 3, 1–7. [Google Scholar] [CrossRef]
- Klauss, M.; Mayer, P.; Maier-Hein, K.; Laun, F.B.; Mehrabi, A.; Kauczor, H.-U.; Stieltjes, B. IVIM-diffusion-MRI for the differentiation of solid benign and malign hypervascular liver lesions—Evaluation with two different MR scanners. Eur. J. Radiol. 2016, 85, 1289–1294. [Google Scholar] [CrossRef] [PubMed]
- Shirota, N.; Saito, K.; Sugimoto, K.; Takara, K.; Moriyasu, F.; Tokuuye, K. Intravoxel incoherent motion MRI as a biomarker of sorafenib treatment for advanced hepatocellular carcinoma: A pilot study. Cancer Imaging 2016, 16, 1. [Google Scholar] [CrossRef] [PubMed]
- Goshima, S.; Kanematsu, M.; Noda, Y.; Kondo, H.; Watanabe, H.; Bae, K.T. Diffusion Kurtosis Imaging to Assess Response to Treatment in Hypervascular Hepatocellular Carcinoma. Am. J. Roentgenol. 2015, 204, W543–W549. [Google Scholar] [CrossRef]
- Qu, J.; Li, X.; Qin, L.; Wang, L.; Luo, J.; Zhang, J.; Zhang, H.; Li, J.; Sun, F.; Zhang, S.; et al. Comparison of Intra-Voxel Incoherent Motion Diffusion Magnetic Resonance Imaging and Apparent Diffusion Coefficient in the Evaluation of Focal Malignant Liver Masses. Cancer Transl. Med. 2015, 1, 11–15. [Google Scholar]
- Zhu, L.; Cheng, Q.; Luo, W.; Bao, L.; Guo, G. A comparative study of apparent diffusion coefficient and intravoxel incoherent motion-derived parameters for the characterization of common solid hepatic tumors. Acta Radiol. 2015, 56, 1411–1418. [Google Scholar] [CrossRef]
- Park, Y.S.; Lee, C.H.; Kim, J.H.; Kim, I.S.; Kiefer, B.; Seo, T.S.; Kim, K.A.; Park, C.M. Using intravoxel incoherent motion (IVIM) MR imaging to predict lipiodol uptake in patients with hepatocellular carcinoma following transcatheter arterial chemoembolization: A preliminary result. Magn. Reson. Imaging 2014, 32, 638–646. [Google Scholar] [CrossRef] [PubMed]
- Watanabe, H.; Kanematsu, M.; Goshima, S.; Kajita, K.; Kawada, H.; Noda, Y.; Tatahashi, Y.; Kawai, N.; Kondo, H.; Moriyama, N. Characterizing focal hepatic lesions by free-breathing intravoxel incoherent motion MRI at 3.0 T. Acta Radiol. 2014, 55, 1166–1173. [Google Scholar] [CrossRef]
- Woo, S.; Lee, J.M.; Yoon, J.H.; Joo, I.; Han, J.K.; Choi, B.I. Intravoxel Incoherent Motion Diffusion-weighted MR Imaging of Hepatocellular Carcinoma: Correlation with Enhancement Degree and Histologic Grade. Radiology 2014, 270, 758–767. [Google Scholar] [CrossRef] [PubMed]
- Boas, F.E.; Kamaya, A.; Do, B.; Desser, T.S.; Beaulieu, C.F.; Vasanawala, S.S.; Hwang, G.L.; Sze, D.Y. Classification of Hypervascular Liver Lesions Based on Hepatic Artery and Portal Vein Blood Supply Coefficients Calculated from Triphasic CT Scans. J. Digit. Imaging 2015, 28, 213–223. [Google Scholar] [CrossRef] [PubMed][Green Version]
- Brannigan, M.; Burns, P.N.; Wilson, S.R. Blood Flow Patterns in Focal Liver Lesions at Microbubble-enhanced US. RadioGraphics 2004, 24, 921–935. [Google Scholar] [CrossRef] [PubMed]
- Wu, H.; Liang, Y.; Jiang, X.; Wei, X.; Liu, Y.; Liu, W.; Guo, Y.; Tang, W. Meta-analysis of intravoxel incoherent motion magnetic resonance imaging in differentiating focal lesions of the liver. Medicine 2018, 97, e12071. [Google Scholar] [CrossRef]
- Fan, Z.-H.; Chen, M.-H.; Dai, Y.; Wang, Y.-B.; Yan, K.; Wu, W.; Yang, W.; Yin, S.-S. Evaluation of Primary Malignancies of the Liver Using Contrast-Enhanced Sonography: Correlation with Pathology. Am. J. Roentgenol. 2006, 186, 1512–1519. [Google Scholar] [CrossRef]
- Asayama, Y.; Yoshimitsu, K.; Nishihara, Y.; Irie, H.; Aishima, S.; Taketomi, A.; Honda, H. Arterial Blood Supply of Hepatocellular Carcinoma and Histologic Grading: Radiologic-Pathologic Correlation. Am. J. Roentgenol. 2008, 190, W28–W34. [Google Scholar] [CrossRef]
- Edmondson, H.A.; Steiner, P.E. Primary Carcinoma of the Liver: A Study of 100 Cases among 48,900 Necropsies. Cancer 1954, 7, 462–503. [Google Scholar] [CrossRef]
- Nagtegaal, I.D.; Odze, R.D.; Klimstra, D.; Paradis, V.; Rugge, M.; Schirmacher, P.; Washington, M.K.; Carneiro, F.; Cree, I.A.; the WHO Classification of Tumours Editorial Board. The 2019 WHO classification of tumours of the digestive system. Histopathology 2020, 76, 182–188. [Google Scholar] [CrossRef] [PubMed]
- Martins-Filho, S.N.; Paiva, C.; Azevedo, R.S.; Alves, V.A.F. Histological Grading of Hepatocellular Carcinoma—A Systematic Review of Literature. Front. Med. 2017, 4, 193. [Google Scholar] [CrossRef] [PubMed]
- Kakite, S.; Dyvorne, H.; Besa, C.; Cooper, N.; Facciuto, M.; Donnerhack, C.; Taouli, B. Hepatocellular carcinoma: Short-term reproducibility of apparent diffusion coefficient and intravoxel incoherent motion parameters at 3.0 T. J. Magn. Reson. Imaging 2015, 41, 149–156. [Google Scholar] [CrossRef]
- Wei, Y.; Gao, F.; Wang, M.; Huang, Z.; Tang, H.; Li, J.; Wang, Y.; Zhang, T.; Wei, X.; Zheng, D.; et al. Intravoxel incoherent motion diffusion-weighted imaging for assessment of histologic grade of hepatocellular carcinoma: Comparison of three methods for positioning region of interest. Eur. Radiol. 2019, 29, 535–544. [Google Scholar] [CrossRef]
- Rosenkrantz, A.B.; Padhani, A.R.; Chenevert, T.L.; Koh, D.-M.; De Keyzer, F.; Taouli, B.; Le Bihan, D. Body diffusion kurtosis imaging: Basic principles, applications, and considerations for clinical practice. J. Magn. Reson. Imaging 2015, 42, 1190–1202. [Google Scholar] [CrossRef]
- Seo, N.; Chung, Y.E.; Park, Y.N.; Kim, E.; Hwang, J.; Kim, M.-J. Liver fibrosis: Stretched exponential model outperforms mono-exponential and bi-exponential models of diffusion-weighted MRI. Eur. Radiol. 2018, 28, 2812–2822. [Google Scholar] [CrossRef]
- Fu, F.; Li, X.; Liu, Q.; Chen, C.; Bai, Y.; Shi, D.; Sang, J.; Wang, K.; Wang, M. Noninvasive DW-MRI metrics for staging hepatic fibrosis and grading inflammatory activity in patients with chronic hepatitis B. Abdom. Radiol. 2021, 46, 1864–1875. [Google Scholar] [CrossRef]
- Ren, H.; Liu, Y.; Lu, J.; An, W.; Wang, W.; Yan, T.; Li, Y.; Dong, J.; Cai, J. Evaluating the clinical value of MRI multi-model diffusion-weighted imaging on liver fibrosis in chronic hepatitis B patients. Abdom. Radiol. 2021, 46, 1552–1561. [Google Scholar] [CrossRef]
- Chan, M.V.; Huo, Y.R.; Trieu, N.; Mitchelle, A.; George, J.; He, E.; Lee, A.U.; Chang, J.; Yang, J. Noncontrast MRI for Hepatocellular Carcinoma Detection: A Systematic Review and Meta-analysis—A Potential Surveillance Tool? Clin. Gastroenterol. Hepatol. 2021. [Google Scholar] [CrossRef]
- Liu, Z.; Fan, J.-M.; He, C.; Li, Z.-F.; Xu, Y.-S.; Liu, H.-F.; Lei, J.-Q.; Li, Z. Utility of diffusion weighted imaging with the quantitative apparent diffusion coefficient in diagnosing residual or recurrent hepatocellular carcinoma after transarterial chemoembolization: A meta-analysis. Cancer Imaging 2020, 20, 3. [Google Scholar] [CrossRef] [PubMed]
- Tao, Y.-Y.; Zhou, Y.; Wang, R.; Gong, X.-Q.; Zheng, J.; Yang, C.; Yang, L.; Zhang, X.-M. Progress of intravoxel incoherent motion diffusion-weighted imaging in liver diseases. World J. Clin. Cases 2020, 8, 3164–3176. [Google Scholar] [CrossRef] [PubMed]
- Pieper, C.C.; Sprinkart, A.M.; Kukuk, G.M.; Mürtz, P. Short-Term Measurement Repeatability of a Simplified Intravoxel Incoherent Motion (IVIM) Analysis for Routine Clinical Diffusion-Weighted Imaging in Malignant Liver Lesions and Liver Parenchyma at 1.5 T. Fortschr. Röntgenstr. 2019, 191, 199–208. [Google Scholar] [CrossRef]
- Gillies, R.J.; Kinahan, P.E.; Hricak, H. Radiomics: Images Are More than Pictures, They Are Data. Radiology 2016, 278, 563–577. [Google Scholar] [CrossRef]
- Wakabayashi, T.; Ouhmich, F.; Gonzalez-Cabrera, C.; Felli, E.; Saviano, A.; Agnus, V.; Savadjiev, P.; Baumert, T.F.; Pessaux, P.; Marescaux, J.; et al. Radiomics in hepatocellular carcinoma: A quantitative review. Hepatol. Int. 2019, 13, 546–559. [Google Scholar] [CrossRef]


| Reference | Year | NS | HCC Lesions | SD (P/R) | Clinical Purpose | Diffusion Acquisition Details | Non-Gaussian Diffusion Models | b-Values (s/mm2) | Non-Gaussian Parameters | ROI Info | Main Findings |
|---|---|---|---|---|---|---|---|---|---|---|---|
| Noda et al. [29] | 2020 | 56 HCC | 19 | P | Diagnosis | TR = 5000 ms, TE = 57 ms; FOV = 40 × 32 cm; matrix = 96 × 96; EPI factor, 2.0; ST = 6 mm, SG = 1 mm; slices = 30, VS = NR | SE | 0, 10, 25, 50, 75, 100, 200, 500, and 800 | DDC, α | ROIs on the entire hepatic lesions in DWI images; manual segmentation. | DDC values were higher in HCC than in benign lesions and similar to those in metastases |
| Peng et al. [37] | 2020 | 82 (55 HCC, 10 IHCC, and 17 HV) | 55 | P | Diagnosis and grading | TR = 3529 ms; TE = 60.8 ms, FOV = 36 × 36–40 cm × 40 cm, matrix of 128 × 160, ST = 5 mm, SG = 0,5 mm, vs. = NR | IVIM | 0, 20, 40, 80, 100, 200, 400, 800, and 1000 | D, D*, f | ROIs on the largest solid areas of the lesions avoiding regions of necrosis and hemorrhage; NR. | D lower in HCC than IHCC and inversely correlated with grade; D* higher in HCC than IHCC and not correlated with HCC grade; f not useful for differentiation HCC/IHCC but positively correlated with HCC grade |
| Shan et al. [38] | 2020 | 117 HCC | 120 | R | Grading | TR = 6000–10,000 ms; TE = 56 ms; FOV = 30 × 30 cm, FA = 90°; matrix size = 128 × 128; BW = 250 kHz/pixel, ST = 5 mm, SG = 1 mm, VS = NR | IVIM | 11 b-values (b = 0, 30, 50, 100, 150, 200, 300, 500, 800, 1000, and 1500) and 2 b-values (b = 0, 800) | D, D*, f | ROIs on the axial b800 images of solid components; manual segmentation. | D and f inversely correlated with HCC grading and significantly different among HCC grades. D* not significant. |
| Wu et al. [39] | 2020 | 88 HCC | 88 | P | Grading | TR = 2500 ms, TE = 58.8 ms; FOV = 380 × 380 mm, FA = 90; matrix = 128 × 128; number of excitations = 2–6; ST = 5 mm; SG = 1.0 mm; slices = 20, vs. = NR | IVIM | 0, 20, 40, 80, 160, 200, 400, 600, 800, and 1000 | D, D*, f | ROIs on the solid part of the tumor avoiding cystic degeneration, necrosis, and bleeding; manual segmentation. | D and f inversely correlated with HCC grading and significantly different among HCC grades. D* not significant. |
| Jia et al. [40] | 2020 | 56 HCC | 56 | P | Response to treatment | TR = 2500 ms; TE = 5 8.8 ms; FOV = 380 × 380 mm, FA = 90; matrix = 128 × 128; number of excitations = 2–6; ST = 5.0 mm; SG = 1 mm; slices 20, VS = NR | IVIM | 0,20, 40, 80, 160, 200, 400, 600, 800, and 1000 | D, D*, f | ROIs on the solid part of the tumor avoiding cystic degeneration, necrosis, and bleeding; manual segmentation. | D may be useful for predicting the response of intermediate-stage HCC to TACE. |
| Shi et al. [41] | 2020 | 52 HCC | 52 | P | Grading and prediction of prognostic factors | TR: 4294.0 ms, TE:67.1 ms, FA = 90°, ST = 5 mm, SG = 1.0 mm, matrix = 200 × 256,VS = NR | IVIM | 0, 10, 20, 30, 40, 60, 80, 100, 200, 500, and 800 | D, D*, f (histogram analysis) | ROIs on the whole lesion of HCC in D map with T2WI image as a reference; semi-automatic segmentation. | Histopathologic grade, Ki67 expression status, and capsule formation can be predicted by IVIM histogram metrics. |
| Hectors et al. [42] | 2020 | 24 HCC | 25 | P | Response to treatment | TR = one respiratory cycle, TE = 74–81 ms, FOV: 340–450 × 220–305 mm, matrix 160 × 80–132, GRAPPA 2, ST = 7 or 8 mm; at 3.0T was performed during free breathing, TR = 4500 ms, vs. = NR | IVIM | 0, 15, 30, 45, 60, 75, 90, 105, 120, 135, 150, 175, 200, 400, 600, 800 | D, D*, f (histogram analysis) | ROIs on slices on which the lesion was visible, avoiding partial volume effects. Liver ROI placed in a single slice mid liver away from the tumor and large vessels; manual segmentation. | IVIM histogram features together with perfusion features can be used to predict HCC response to radioembolization. |
| Wang et al. [43] | 2020 | 128 HCC | 128 | P | Grading | TR = 3300 ms, TE = 88 ms, FOV = 380 × 420 mm, matrix size = 168 × 105, FA = 90°, ST = 5 mm; SG = 1.5 mm, VS = NR | DKI | 0, 800, and 1500 | DK, K | ROIs on solid parts of the largest lesions avoiding large vessels, bile ducts, necrosis and artifacts; manual segmentation. | High-grade HCCs have higher K values and lower DK values than low-grade HCCs |
| Wu et al. [44] | 2020 | 88 HCC | 88 | P | Grading | TR = 2500 ms; TE = 58.9 ms; FOV = 360 × 280 mm; matrix = 128 × 128, FA = 90; excitations = 2; ST = 5.0 mm; SG = 0.5 mm; slices = 24, vs. = NR | DKI | 0, 1000, and 2000 | DK, K | ROIs on the solid part of the tumor; manual segmentation. | High-grade HCCs have higher K values and lower DK values than low-grade HCCs. |
| Cao et al. [30] | 2019 | 74 HCC | 74 | P | Predicting MVI and grading | TR = 5600 ms; TE = 63 ms; FOV = 380 × 289 mm2; matrix size = 100 × 76; ST = 6 mm; SG = 1 mm; FA = 90°, VS = 3.8 × 3.8 × 6 mm3 | DKI | 0, 200, 700, 1400, and 2100 | DK, K | ROIs on the entire margin of the tumor on the slice where tumors showed their largest transverse diameter on the ADC maps, excluding areas of necrosis and hemorrhage by referring to T2w and T1w images; manual segmentation. | High-grade HCCs have higher mean K values and lower D values than low-grade HCCs. K showed better diagnostic performances for HCC grading and MVI prediction. |
| Jia et al. [45] | 2019 | 151 patients with 182 hepatic nodules (114 HCCs, 33 FNHs, 29 hemangiomas, 6 HCAs) | 114 | R | Diagnosis | TR = 4500 ms, TE = 66 ms; FOV = 380 × 380 mm; matrix = 128 × 128; FA = 90; BW = 1954; ST = 6 mm, VS = NR | DKI | 0, 200, 500, 800, 1500, and 2000 | K, DK | ROIs on the level of maximum lesion transactional diameter, avoiding hemorrhage, necrosis, and cystic changes; manual segmentation. | HCC showed higher K and lower MD than benign nodules. |
| Yuan et al. [46] | 2019 | 107 HCC | 107 | R | Response to treatment and prediction of recurrence | TR = 3300 ms; TE = 88 ms; FOV = 380 × 420 mm, FA = 90°, ST = 5 mm; SG = 1.5 mm; slices = 26; NEX = 3, VS = NR | DKI | 0, 800, 1500, 2000 mm2/s | DK, K | ROIs on the largest HCC diameter; manual segmentation. | DK and K were able to predict recurrence of early stage HCC single nodules. |
| Kim et al. [31] | 2019 | 180 (86 metastases, 61 HCC, 12 hemangioma, 10 simple cysts, 4 IHCC, 7 others) | 61 | R | Diagnosis | TE = 50.2 ms; TR = 5000 ms; FOV = 400 mm; matrix = 90 × 92, echo train length = 27; BW = 2877; ST = 5 mm, VS = NR | SE, IVIM | 0,10, 25, 50, 75, 100, 200, 500, and 800 | DDC, α, D, D*, f | ROIs on three consecutive slices of DWI images, including the largest lesion area; NR. | The DDC showed best performances for differentiating HCC from benign lesions. |
| Luo et al. [47] | 2019 | 54 HCC | 54 | P | Response to treatment | TR = 4000 ms, TE = 88 ms, FOV = 380 × 380 mm, matrix = 128 × 128, ST = 6 mm, SG = 1.0 mm, VS = NR | DKI | 300/500/1000 | Dr, Da, DK, Ka, FAk, Kr, K | ROIs on the significant tumor enhanced area, avoiding iodized oil deposition and perivascular tissue; NR. | Dr, Da, and DK increased, and Ka and FAk decreased after TACE. No significant changes in FA, Kr, and K. |
| Server et al. [48] | 2019 | 15 HCC | 15 | R | Response to treatment | TR = 2400 ms; TE = 82 ms; FOV between 240 and 380 mm, matrix of 115 × 192, EPI factor = 115; ST = 5 mm; SG = 1 mm, VS = NR | IVIM | 0, 50, 100, 150, 200, 300, 400, 500, 600, 700, 800, 900, 1000, 1100, 1200, and 1300 | D, D*, f | ROIs on the lesion with at least two-thirds of the lesions covered to prevent interference from the vascular and biliary structures; NR. | D increased and f decreased after treatment. Any significant results were found on D*. |
| Shao et al. [49] | 2019 | 40 (20 IHCC, 20 HCC) | 20 | R | Diagnosis | TR = 9231 ms; TE = 56 ms FOV 38 × 30 cm; matrix size = 128 × 128; BW = 250 kHz; FA = 90; NEX acceleration factor 4, ST = 5 mm; SG = 1 mm; VS = NR | IVIM | 0, 30, 50, 100, 150, 200, 300, 500, 800, 1000, and 1500 | D, D*, f | ROIs on axial DWI images to encompass as much of the tumor as possible on the maximum tumor cross-section; manual segmentation. | D significantly higher and f lower in IMCC than in HCC. D* not significant. |
| Sokmen et al. [50] | 2019 | 29 HCC | 42 | R | Grading | FOV between 240 and 380 mm, matrix = 115 × 192, ST = 5 mm; SG = 1 mm; vs. = NR | IVIM | 0, 50, 100, 150, 200, 300, 400, 500, 600, 700, 800, 900, 1000, 1100, 1200, and 1300 | D, D*, f | ROIs on DWI and IVIM images, covering at least two-thirds of the diameter of lesions to avoid blood vessels; NR. | High-grade HCCs had significantly lower D and higher f than low-grade HCCs, respectively. D values and f-values were negatively and positively correlated with HCC grade, respectively. The best discriminative parameter was f-value. |
| Wei et al. [51] | 2019 | 115 HCC | 135 | P | Prediction of MVI | TR = 9230 ms; TE = 84.7 ms; FOV = 40 × 30 cm2; matrix = 80 × 128; ST = 6 mm; SG = 2 mm, VS = NR | IVIM | 0, 10, 20, 40, 80, 100, 150, 200, 400, 600, 800, 1000, and 1200 | D, D*, f | ROIs outlining the tumor margin on DWI images; manual segmentation. | D was higher in MVI-negative than in MVI-positive patients and is superior to ADC for evaluating the MVI of HCC. D* and f were not significant. |
| Zhang et al. [52] | 2019 | 157 HCC | 157 | R | Prediction of recurrence | TR = 6000 to 10,000 ms, TE = 56 ms, FOV = 38 × 30 cm, matrix = 128 × 128, BW = 250 kHz/pixel, ST = 5 mm, SG = 1 mm, VS = NR | IVIM | 0, 30, 50, 100, 150, 200, 300, 500, 800, 1000, and 1500 | D, D*, f | ROIs encompassing much of the lesion as possible on DWI images, using T2WI as a reference; manual segmentation. | D is a potential biomarker for the preoperative prediction of recurrence after hepatectomy in HCC. |
| Wu et al. [53] | 2018 | 55 HCC | 55 | P | Response to treatment and survival prediction | TR = 4100 ms; TE = 70 ms; FOV = 285 × 214–308 × 380 mm; matrix = 128× 128, ST = 6 mm, SG = 1 mm, vs. = NR | IVIM | 0, 10, 20, 30, 40, 50, 70, 100, 200, 300, 500, and 800 | D, D*, f (histogram analysis) | ROIs on IVIM sequences; semi-automatic segmentation. | F mean, median, and 25th percentile were higher, while skewness and kurtosis of PF were lower in responders than in non-responders. |
| Budjan et al. [54] | 2018 | 56 patients with 68 hepatic lesions (25 HCC, 4 hepatic adenoma, 18 cysts, 18 hepatic hemangioma) | 25 | R | Diagnosis | TE = 75 ms, TR = 7800 ms; FOV = 340 × 240 mm; matrix = 192 × 140; FA = 90; GRAPPA 2; BW = 1644 Hz/pixel; ST = 4 mm, vs. = NR | DKI | 50, 400, 800, and 1000. | DK, K | ROIs in the lesions excluding vessels and bile ducts; NR. | DK was able to distinguish HCC from benign lesions. K was not useful for lesion differentiation. |
| Hectors et al. [55] | 2018 | 15 HCC | 21 | P | Diagnosis | TR = one respiration; TE = 75; FOV = 360 × 270 mm; matrix = 128 × 96, FA = 90; NEX = 1; ST = 7 mm; slices = 20; acceleration factor = 2, VS = NR | IVIM | 0, 15, 30, 45, 60, 75, 90, 105, 120, 135, 150, 175, 200, 400, 600, and 800 | D, D*, f | ROIs on the highest tracer activity of tumor. For normal liver, ROIs on left lobe and right lobe; manual segmentation. | IVIM parameters did not show significant differences between liver parenchyma and HCC. |
| Li et al. [56] | 2018 | 41 HCC | 41 | P | Prediction of MVI | TR = 1973 ms; TE = 57 ms, FOV = 375 × 302 × 176 mm, matrix = 132 × 114, ST = 5 mm, SG = 0.5 mm, slices = 32, NSA = 2, vs. = NR | IVIM | 0, 10, 20, 40, 80, 200, 400, 600, and 1000 | D, D*, f (histogram analysis) | ROIs to encompass as much of the entire lesion in each slice, including cystic necrotic regions; NR. | D histogram features can be useful for predicting MVI. The 5th percentile of D was most useful value to predict MVI of HCC. The histogram parameters of D* and f showed no statistically significant differences between HCCs with and without MVI. |
| Wei et al. [57] | 2018 | 65 HCC | 68 | R | Diagnosis | TR = 3750 ms; TE = 61.4 ms; FOV = 38 × 28 cm2; matrix = 128 × 128, ST = 5.0 mm, SG = 1 mm, VS = NR | IVIM | 0, 10, 20, 40, 80, 100, 150, 200, 400, 600, 800, 1000, and 1200 | D, D*, f | ROIs on the solid parts of the tumor; manual segmentation. | D is useful in differentiating ICC and HCC, while D* and f showed no significant results. |
| Zhao et al. [58] | 2018 | 51 HCC | 51 | R | Prediction of MVI | TR = 5714 ms; TE = 65.5 ms; FOV = 38 × 28 cm2; matrix = 96 × 130; FA = 90; ST = 6 mm, NEX = 1, VS = NR | IVIM | 0, 10, 20, 30, 40, 50, 60, 70,80, 90, 100, 200, 300, 400, 500, and 1000 | D, D*, f | ROIs on the maximum representative slice in the tumor avoiding necrosis, cystic, hemorrhage, fat, fiber, blood vessels, and bile ducts; manual segmentation. | D was significantly lower in HCCs with MVI than HCCs without MVI and is an independent predictor of MVI. |
| Zhu et al. [59] | 2018 | 62 HCC | 62 | R | Grading | TR = 4286 ms; TE = 61.2 ms; FOV = 38 cm × 28.5 cm; matrix size = 128 × 128, ST = 7 mm, SG = 1 mm, NEX = 6, 4, 2, 2, 2, 1, 1, 2, 4, 6, 6, 8, VS = NR | IVIM | 10, 20, 40, 80, 100, 150, 200, 400, 600, 800, 1000, and 1200 | D, D*, f | ROIs covering the largest solid part of the tumor; manual segmentation. | D was able to differentiate low-grade from high-grade HCC and was negatively correlated with histological grade. Any significant differences in D* values and f-values were found among the different HCC grades. D* was negatively correlated with HCC grade. |
| Wang et al. [60] | 2018 | 84 HCC | 92 | P | Prediction of MVI | TR = 8000 ms; TE = 63 ms; FOV = 380 mm × 308 mm; matrix size = 128 × 128, ST = 5 mm, SG = 1 mm, VS = NR | DKI | 0, 200, 500, 1000, 1500, and 2000 | DK, K | ROI outlined around the tumor on ADC maps; manual segmentation. | Higher K values is a potential predictive biomarker for MVI of HCC. |
| Choi et al. [61] | 2017 | 161 (91 HCCs, 27 IHCCs, 20 hemangiomas, 9 combined IHCC, 9 metastases, and 5 other tumors) | 91 | R | Diagnosis | TE = 60 ms; TR = 2100 ms; FOV = 340 × 256 mm; matrix size = 192 × 115, EPI factor = 115; BW = 1594 Hz; averages = 4; ST = 7 mm; SG = 1.4 mm; slices = 20, VS = NR | IVIM | 0, 30, 60, 100, 150, 200, 400, 600, and 900 | D, D*, f | ROIs on DWI images to covered the largest portion of the lesion; manual segmentation. | HCCs showed a significantly lower D than IHCC and a higher f than did IHCC and metastasis. No significant results concerning D*. |
| Luo et al. [62] | 2017 | 27 (22 HCC, 5 FNH) | 22 | P | Diagnosis | TE = 60 ms; TR = 2100 ms; FOV = 340 × 256 mm; matrix = 192 × 115; EPI factor = 115; BW = 1594 Hz; averages = 4; ST = 7 mm; SG = 1.4 mm; slices = 20, VS = NR | IVIM | 0, 30, 60, 100, 150, 200, 400, 600, and 900 | D, D*, f | ROIs on the hepatic tumor in arterial phase T1w; manual segmentation. | D and D* were significantly lower in HCC in FNH, while f did not show any significant difference. |
| Shan et al. [63] | 2017 | 106 HCC | 109 | R | Grading | TR = 9231, TE = 56; FOV = 38 × 30 cm2; matrix = 128 × 128; FA = 90, BW = 250, ST = 5 mm, SG = 1 mm; NEX = 1, VS = NR | IVIM | 0, 30, 50, 100, 150, 200, 300, 500, 800, 1000, and 1500 | D, D*, f | ROIs on b1000 DWI images to encompass as much lesion body; manual segmentation. | D and f were significantly different among well-, moderately, and poorly differentiated HCCs and were significantly correlated with histologic differentiation. No significant difference in D* value among the three groups. |
| Wu et al. [64] | 2017 | 30 HCC | 30 | P | Response to treatment and survival prediction | TR = 54,100 ms; TE = 70 ms; FOV adapted patients’ body habitus, FOV = 285 × 214–308 × 380 mm; matrix = 128 × 128, ST = 6 mm, SG = 1 mm, vs. = NR | IVIM | 0, 10, 20, 30, 40, 50, 70, 100, 200, 300, 500, 800 | D, D*, f | ROIs on the whole lesion as large as possible to cover the viable and necrotic lesion part; NR. | D ratio 24–48 h after TACE was independent predictors for response to TACE for HCC and was associated with PFS. |
| Granata et al. [28] | 2016 | 34 HCC | 62 | R | Grading | TR = 7500 ms; TE = 91 ms; FA = 90; matrix = 192 × 192, VS = NR | IVIM | 0, 50, 100, 200, 400, 600, and 800. | D, D*, f | ROIs including hyper-intense voxels on b800 DWI images; manual segmentation. | D and f were statistically different in HCC groups with 1, 2, and 3 histological grade and were positively correlated with HCC grade. |
| Hectors et al. [65] | 2016 | 25 HCC | 37 | P | Diagnosis | TR = one respiratory cycle, TE = 74–81 ms, FOV = 340–450 × 220–305 mm2, matrix = 160 × 80–132, reconstruction matrix = 320 × 100–256, EPI factor = 2, ST = 7 or 8 mm, VS = NR | IVIM | 0, 15, 30, 45, 60, 75, 90, 105, 120,135, 150, 175, 200, 400, 600, and 800 | D, D*, f | ROIs on HCC lesions and in the entire liver parenchyma; manual segmentation. | D, D*, and f were all significantly lower in HCC vs. liver parenchyma. |
| Murtz et al. [66] | 2016 | 25 HCC | 31 | R | Response to treatment | FOV = 380×326 mm; matrix = 112 × 93; slice number = 28 BW = 1680.3 Hz; TE = 63 ms; TR = 1 respiratory cycle; imaging time per respiration = 1648 ms, ST = 7 mm; SG = 0.7 mm; VS = NR | IVIM | 0, 50, 800 | D, D*, f | ROIs on b800 DWI images as large as possible; manual segmentation. | D was increased after therapy, while f was decreased in responders. No significant changes were found in non-responders. |
| Kakite et al. [67] | 2016 | 46 HCC | 79 | R | Prediction of necrosis | TR = 3000 ms; TE = 55–58, FOV = 80 × 128, FA = 90°, slice = 8; SG = 1.6 mm, acceleration factor 2, VS = NR | IVIM | 0, 15, 30, 45, 60, 75, 90, 105,120, 135, 150, 175, 200, 400, 600, and 800 | D, D*, f | ROIs on lesions and liver placed on T1W and copied to DWI images; NR. | D and f were higher in HCC than in liver. A significant correlation between D and f and tumor necrosis was found. D had the highest area under the curve for predicting complete tumor necrosis. |
| Klauss et al. [68] | 2016 | 72 (29 FNH, 43 HCC) | 43 | P | Diagnosis | Slices = 14, ST = 5 mm, SG = 0.5 mm; acceleration factor = 2, vs. = NR | IVIM | 0, 50, 100, 150, 200, 300, 400, 600, and 800 | D, D*, f | ROIs on T1W, T2W and DWI; manual segmentation. | D were significantly lower in HCC compared to FNH and there was no significant difference for f and D*. |
| Shirota et al. [69] | 2016 | 9 HCC | 9 | P | Response to treatment | TR = 1200 ms; TE = 63 ms; FOV = 400 × 454 mm, matrix = 110 × 110; FA = 90°; ST = 5 mm; BW = 921 Hz, VS = NR | IVIM | 0, 50, 100, 150, 200, 400, and 800 | D, D*, f | NR | Among IVIM metrics, only D of responders at baseline was significantly higher than that of the non-responders. Any significant results were found after treatment. |
| Goshima et al. [70] | 2015 | 62 HCC | 112 | P | Response to treatment | TR = 2000 ms, TE = 67 ms; FOV = 380 × 304 mm; matrix = 256 × 256; acceleration factor = 2, ST = 6 mm, SG = 0 mm, VS = NR | DKI | 0, 100, 500, 1000, 1500, and 2000 | K | ROIs in entire HCCs and the surrounding liver parenchyma; NR. | K was able to assess post therapeutic response in HCC. |
| Qu et al. [71] | 2015 | 53 patients with 85 liver masses (47 HCCs, 18 IHCC, 20 metastases) | 47 | P | Diagnosis | TR = variable, TE = 81.3 ms; FOV = 380 × 380 mm; matrix = 128 × 128, FA = 90, ST = 7 mm, VS = NR | IVIM | 0, 50, 100, 250, 500, 750, 1000, and DWI 0, 700 | D, D*, f | ROIs on the tumor, avoiding the hemorrhage and necrosis regions; NR | D was significantly higher in IHCCs than in HCCs and showed better performances than ADC. D* and f did not show significant differences between the two groups. No significant differences were found between HCCs and metastases. |
| Zhu et al. [72] | 2015 | 55 (12 HV, 43 HCC) | 23 | P | Diagnosis | TR = 8571 ms; TE = 97.2–98.8 ms; FOV = 40 × 40 cm; FA = 90, ST = 8 mm; SG = 2 mm; number of excitations = 4; BW = 250 kHz, VS = NR | IVIM | 10,20, 30, 50, 100, 200, 500, and 800 | D, D*, f | ROIs at the S7 liver segment while avoiding the bile ducts and vessels (healthy group). For the patient group, ROIs on the b0 DWI images in restricted diffusion area, avoiding tumor vessels and necrosis; manual segmentation. | D was significantly lower in HCC than in hemangioma and healthy liver, but not different with respect to metastases. D* and f were not useful for HCC differentiation versus hemangioma, healthy liver, and metastases. |
| Park et al. [73] | 2014 | 44 HCC | 51 | R | Response to treatment | TR = 1500 ms, FE = 70 ms, FOV = 284–300 × 284–301 mm; matrix = 192 × 108, FA = 90; ST = 5 mm; SG = 1 mm, vs. = NR | IVIM | 0, 25, 50, 75, 100, 200, 500 and 800 | D, D*, f | ROIs in any tumor area of lipiodol uptake or lipiodol defect; ROIs also on the adjacent non-tumorous hepatic parenchyma; manual segmentation. | D* values for HCC were significantly higher in lipiodol good uptake group than in poor uptake group. No significant differences were found on D and f. |
| Watanabe et al. [74] | 2014 | 74 with 120 hepatic lesions (34 metastases, 32 HCC, 33 hemangiomas, and 21 liver cysts) | 32 | P | Diagnosis | TR = 1597 ms; TE = 55 ms; FOV = 380 × 304 mm, matrix = 112 × 90, FA = 90, BW = 59.3/7.32 Hz/pixel; EPI factor = 3; slices = 40; ST = 6 mm, SG = 0, VS = NR | IVIM | 0, 10, 20, 30, 50, 80, 100, 200, 400, and 800 | D, D*, f | ROIs encompassing the hepatic lesions on T1W, T2W, and contrast-enhanced MR images; manual segmentation. | D in hemangiomas and liver cysts were significantly greater than those of HCCs but were similar to those of metastases. |
| Woo et al. [75] | 2014 | 40 HCC | 42 | R | Grading | TR = 5000ms; TE = 52 ms, FOV = 380 × 380 mm; matrix = 136 × 136; FA = 90, ST = 7 mm; SG = 0 mm, VS = NR | IVIM | 0, 25, 50,75, 100, 200, 500, and 800 sec/mm2 | D, D*, f | ROIs along the margin of the tumor on ADC maps, T2w, and T1 post contrast; manual segmentation. | D was higher in low-grade than in high-grade HCCs and was negatively correlated with histological grade. |
Publisher’s Note: MDPI stays neutral with regard to jurisdictional claims in published maps and institutional affiliations. |
© 2021 by the authors. Licensee MDPI, Basel, Switzerland. This article is an open access article distributed under the terms and conditions of the Creative Commons Attribution (CC BY) license (https://creativecommons.org/licenses/by/4.0/).
Share and Cite
Tramontano, L.; Cavaliere, C.; Salvatore, M.; Brancato, V. The Role of Non-Gaussian Models of Diffusion Weighted MRI in Hepatocellular Carcinoma: A Systematic Review. J. Clin. Med. 2021, 10, 2641. https://doi.org/10.3390/jcm10122641
Tramontano L, Cavaliere C, Salvatore M, Brancato V. The Role of Non-Gaussian Models of Diffusion Weighted MRI in Hepatocellular Carcinoma: A Systematic Review. Journal of Clinical Medicine. 2021; 10(12):2641. https://doi.org/10.3390/jcm10122641
Chicago/Turabian StyleTramontano, Liberatore, Carlo Cavaliere, Marco Salvatore, and Valentina Brancato. 2021. "The Role of Non-Gaussian Models of Diffusion Weighted MRI in Hepatocellular Carcinoma: A Systematic Review" Journal of Clinical Medicine 10, no. 12: 2641. https://doi.org/10.3390/jcm10122641
APA StyleTramontano, L., Cavaliere, C., Salvatore, M., & Brancato, V. (2021). The Role of Non-Gaussian Models of Diffusion Weighted MRI in Hepatocellular Carcinoma: A Systematic Review. Journal of Clinical Medicine, 10(12), 2641. https://doi.org/10.3390/jcm10122641