
Correlation of Plasma Amino Acid and Anthropometric Profiles with Brown Adipose Tissue Density in Humans

 , , ,
, , ,
Abstract
1. Introduction
2. Materials and Methods
2.1. Participants and Diagnosis
2.2. Measurement of Anthropometric Parameters
2.3. Sample Collection
2.4. Amino Acid Profiling
2.5. Data Analysis
3. Results
4. Discussion
5. Conclusions
Supplementary Materials
Author Contributions
Funding
Institutional Review Board Statement
Informed Consent Statement
Data Availability Statement
Acknowledgments
Conflicts of Interest
References
- Cannon, B.; Nedergaard, J. Brown adipose tissue: Function and physiological significance. Physiol. Rev. 2004, 84, 277–359. [Google Scholar] [CrossRef] [PubMed]
- Becher, T.; Palanisamy, S.; Kramer, D.J.; Eljalby, M.; Marx, S.J.; Wibmer, A.G.; Butler, S.D.; Jiang, C.S.; Vaughan, R.; Schoder, H.; et al. Brown adipose tissue is associated with cardiometabolic health. Nat. Med. 2021, 27, 58–65. [Google Scholar] [CrossRef]
- van Marken Lichtenbelt, W.D.; Vanhommerig, J.W.; Smulders, N.M.; Drossaerts, J.M.; Kemerink, G.J.; Bouvy, N.D.; Schrauwen, P.; Teule, G.J. Cold-activated brown adipose tissue in healthy men. N. Engl. J. Med. 2009, 360, 1500–1508. [Google Scholar] [CrossRef] [PubMed]
- Virtanen, K.A.; Lidell, M.E.; Orava, J.; Heglind, M.; Westergren, R.; Niemi, T.; Taittonen, M.; Laine, J.; Savisto, N.J.; Enerbäck, S.; et al. Functional brown adipose tissue in healthy adults. N. Engl. J. Med. 2009, 360, 1518–1525. [Google Scholar] [CrossRef] [PubMed]
- Matsushita, M.; Yoneshiro, T.; Aita, S.; Kameya, T.; Sugie, H.; Saito, M. Impact of brown adipose tissue on body fatness and glucose metabolism in healthy humans. Int. J. Obes. 2014, 38, 812–817. [Google Scholar] [CrossRef]
- Hanssen, M.J.; van der Lans, A.A.; Brans, B.; Hoeks, J.; Jardon, K.M.; Schaart, G.; Mottaghy, F.M.; Schrauwen, P.; van Marken Lichtenbelt, W.D. Short-term cold acclimation recruits brown adipose tissue in obese humans. Diabetes 2016, 65, 1179–1189. [Google Scholar] [CrossRef]
- Hanssen, M.J.; Hoeks, J.; Brans, B.; van der Lans, A.A.; Schaart, G.; van den Driessche, J.J.; Jörgensen, J.A.; Boekschoten, M.V.; Hesselink, M.K.; Havekes, B.; et al. Short-term cold acclimation improves insulin sensitivity in patients with type 2 diabetes mellitus. Nat. Med. 2015, 21, 863–865. [Google Scholar] [CrossRef]
- Cypess, A.M.; Lehman, S.; Williams, G.; Tal, I.; Rodman, D.; Goldfine, A.B.; Kuo, F.C.; Palmer, E.L.; Tseng, Y.H.; Doria, A.; et al. Identification and importance of brown adipose tissue in adult humans. N. Engl. J. Med. 2009, 360, 1509–1517. [Google Scholar] [CrossRef] [PubMed]
- Saito, M.; Okamatsu-Ogura, Y.; Matsushita, M.; Watanabe, K.; Yoneshiro, T.; Nio-Kobayashi, J.; Iwanaga, T.; Miyagawa, M.; Kameya, T.; Nakada, K.; et al. High incidence of metabolically active brown adipose tissue in healthy adult humans: Effects of cold exposure and adiposity. Diabetes 2009, 58, 1526–1531. [Google Scholar] [CrossRef]
- Holstila, M.; Pesola, M.; Saari, T.; Koskensalo, K.; Raiko, J.; Borra, R.J.; Nuutila, P.; Parkkola, R.; Virtanen, K.A. MR signal-fat-fraction analysis and T2* weighted imaging measure BAT reliably on humans without cold exposure. Metabolism 2017, 70, 23–30. [Google Scholar] [CrossRef]
- Sun, L.; Verma, S.; Michael, N.; Chan, S.P.; Yan, J.; Sadananthan, S.A.; Camps, S.G.; Goh, H.J.; Govindharajulu, P.; Totman, J.; et al. Brown adipose tissue: Multimodality evaluation by PET, MRI, infrared thermography, and whole-body calorimetry (TACTICAL-II). Obesity 2019, 27, 1434–1442. [Google Scholar] [CrossRef] [PubMed]
- El Hadi, H.; Frascati, A.; Granzotto, M.; Silvestrin, V.; Ferlini, E.; Vettor, R.; Rossato, M. Infrared thermography for indirect assessment of activation of brown adipose tissue in lean and obese male subjects. Physiol. Meas. 2016, 37, N118–N128. [Google Scholar] [CrossRef]
- Nirengi, S.; Yoneshiro, T.; Sugie, H.; Saito, M.; Hamaoka, T. Human brown adipose tissue assessed by simple, noninvasive near-infrared time-resolved spectroscopy. Obesity 2015, 23, 973–980. [Google Scholar] [CrossRef]
- Hamaoka, T.; Nirengi, S.; Fuse, S.; Amagasa, S.; Kime, R.; Kuroiwa, M.; Endo, T.; Sakane, N.; Matsushita, M.; Saito, M.; et al. Near-infrared time-resolved spectroscopy for assessing brown adipose tissue density in humans: A review. Front. Endocrinol. 2020, 11, 261. [Google Scholar] [CrossRef]
- Baron, D.M.; Clerte, M.; Brouckaert, P.; Raher, M.J.; Flynn, A.W.; Zhang, H.; Carter, E.A.; Picard, M.H.; Bloch, K.D.; Buys, E.S.; et al. In vivo noninvasive characterization of brown adipose tissue blood flow by contrast ultrasound in mice. Circ. Cardiovasc. Imaging 2012, 5, 652–659. [Google Scholar] [CrossRef] [PubMed]
- Chondronikola, M.; Volpi, E.; Borsheim, E.; Porter, C.; Annamalai, P.; Enerback, S.; Lidell, M.E.; Saraf, M.K.; Labbe, S.M.; Hurren, N.M.; et al. Brown adipose tissue improves whole-body glucose homeostasis and insulin sensitivity in humans. Diabetes 2014, 63, 4089–4099. [Google Scholar] [CrossRef]
- Yoneshiro, T.; Wang, Q.; Tajima, K.; Matsushita, M.; Maki, H.; Igarashi, K.; Dai, Z.; White, P.J.; McGarrah, R.W.; Ilkayeva, O.R.; et al. BCAA catabolism in brown fat controls energy homeostasis through SLC25A44. Nature 2019, 572, 614–619. [Google Scholar] [CrossRef]
- Nirengi, S.; Fuse, S.; Amagasa, S.; Homma, T.; Kime, R.; Kuroiwa, M.; Endo, T.; Sakane, N.; Matsushita, M.; Saito, M.; et al. Applicability of supraclavicular oxygenated and total hemoglobin evaluated by near-infrared time-resolved spectroscopy as indicators of brown adipose tissue density in humans. Int. J. Mol. Sci. 2019, 20, 2214. [Google Scholar] [CrossRef] [PubMed]
- Fuse, S.; Sugimoto, M.; Kurosawa, Y.; Kuroiwa, M.; Aita, Y.; Tomita, A.; Yamaguchi, E.; Tanaka, R.; Endo, T.; Kime, R.; et al. Relationships between plasma lipidomic profiles and brown adipose tissue density in humans. Int. J. Obes. 2020, 44, 1387–1396. [Google Scholar] [CrossRef] [PubMed]
- Gunadi, S.; Leung, T.S.; Elwell, C.E.; Tachtsidis, I. Spatial sensitivity and penetration depth of three cerebral oxygenation monitors. Biomed. Opt. Express 2014, 5, 2896–2912. [Google Scholar] [CrossRef]
- Flynn, A.; Li, Q.; Panagia, M.; Abdelbaky, A.; MacNabb, M.; Samir, A.; Cypess, A.M.; Weyman, A.E.; Tawakol, A.; Scherrer-Crosbie, M. Contrast-enhanced ultrasound: A novel noninvasive, nonionizing method for the detection of brown adipose tissue in humans. J. Am. Soc. Echocardiogr. 2015, 28, 1247–1254. [Google Scholar] [CrossRef]
- Hamaoka, T.; McCully, K.K.; Quaresima, V.; Yamamoto, K.; Chance, B. Near-infrared spectroscopy/imaging for monitoring muscle oxygenation and oxidative metabolism in healthy and diseased humans. J. Biomed. Opt. 2007, 12, 062105. [Google Scholar] [CrossRef] [PubMed]
- Yamamoto, K.; Niwayama, M.; Kohata, D.; Kudo, N.; Hamaoka, T.; Kime, R.; Katsumura, T. Functional imaging of muscle oxygenation using a 200-channel cw NIRS system. In Optical Tomography and Spectroscopy of Tissue IV; International Society for Optics and Photonics: Bellingham, WA, USA, 2001; Volume 4250, pp. 142–152. [Google Scholar]
- Shimizu, H.; Usui, Y.; Asakage, M.; Nezu, N.; Wakita, R.; Tsubota, K.; Sugimoto, M.; Goto, H. Serum metabolomic profiling of patients with non-infectious uveitis. J. Clin. Med. 2020, 9, 3955. [Google Scholar] [CrossRef]
- Ministry of Health; Labour and Welfare; E-Health Net. Body Fat Scale. Available online: http://www.e-healthnet.mhlw.go.jp/ (accessed on 15 May 2021).
- Bagheri, R.; Forbes, S.C.; Candow, D.G.; Wong, A. Effects of branched-chain amino acid supplementation and resistance training in postmenopausal women. Exp. Gerontol. 2021, 144, 111185. [Google Scholar] [CrossRef]
- Manaf, F.A.; Peiffer, J.J.; Maker, G.L.; Fairchild, T.J. Branched-chain amino acid supplementation improves cycling performance in untrained cyclists. J. Sci. Med. Sport 2021, 24, 412–417. [Google Scholar] [CrossRef] [PubMed]
- Huffman, K.M.; Shah, S.H.; Stevens, R.D.; Bain, J.R.; Muehlbauer, M.; Slentz, C.A.; Tanner, C.J.; Kuchibhatla, M.; Houmard, J.A.; Newgard, C.B.; et al. Relationships between circulating metabolic intermediates and insulin action in overweight to obese, inactive men and women. Diabetes Care 2009, 32, 1678–1683. [Google Scholar] [CrossRef]
- Wang, T.J.; Larson, M.G.; Vasan, R.S.; Cheng, S.; Rhee, E.P.; McCabe, E.; Lewis, G.D.; Fox, C.S.; Jacques, P.F.; Fernandez, C.; et al. Metabolite profiles and the risk of developing diabetes. Nat. Med. 2011, 17, 448–453. [Google Scholar] [CrossRef]
- Guizar-Heredia, R.; Tovar, A.R.; Granados-Portillo, O.; Pichardo-Ontiveros, E.; Flores-López, A.; González-Salazar, L.E.; Arteaga-Sanchez, L.; Medina-Vera, I.; Orozco-Ruiz, X.; Torres, N.; et al. Serum amino acid concentrations are modified by age, insulin resistance, and BCAT2 rs11548193 and BCKDH rs45500792 polymorphisms in subjects with obesity. Clin. Nutr. 2021. [Google Scholar] [CrossRef] [PubMed]
- Lackey, D.E.; Lynch, C.J.; Olson, K.C.; Mostaedi, R.; Ali, M.; Smith, W.H.; Karpe, F.; Humphreys, S.; Bedinger, D.H.; Dunn, T.N.; et al. Regulation of adipose branched-chain amino acid catabolism enzyme expression and cross-adipose amino acid flux in human obesity. Am. J. Physiol. Endocrinol. Metab. 2013, 304, E1175–E1187. [Google Scholar] [CrossRef]
- Herman, M.A.; She, P.; Peroni, O.D.; Lynch, C.J.; Kahn, B.B. Adipose tissue branched chain amino acid (BCAA) metabolism modulates circulating BCAA levels. J. Biol. Chem. 2010, 285, 11348–11356. [Google Scholar] [CrossRef]
- Yu, J.; Xiao, F.; Guo, Y.; Deng, J.; Liu, B.; Zhang, Q.; Li, K.; Wang, C.; Chen, S.; Guo, F. Hepatic phosphoserine aminotransferase 1 regulates insulin sensitivity in mice via tribbles homolog 3. Diabetes 2015, 64, 1591–1602. [Google Scholar] [CrossRef]
- Mullner, E.; Rohnisch, H.E.; von Bromssen, C.; Moazzami, A.A. Metabolomics analysis reveals altered metabolites in lean compared with obese adolescents and additional metabolic shifts associated with hyperinsulinaemia and insulin resistance in obese adolescents: A cross-sectional study. Metabolomics 2021, 17, 11. [Google Scholar] [CrossRef]
- White, P.J.; Newgard, C.B. Branched-chain amino acids in disease. Science. 2019, 363, 582–583. [Google Scholar] [CrossRef]
- Adeva-Andany, M.; Souto-Adeva, G.; Ameneiros-Rodriguez, E.; Fernandez-Fernandez, C.; Donapetry-Garcia, C.; Dominguez-Montero, A. Insulin resistance and glycine metabolism in humans. Amino Acids 2018, 50, 11–27. [Google Scholar] [CrossRef]
- Okamatsu-Ogura, Y.; Matsushita, M.; Bariuan, J.V.; Nagaya, K.; Tsubota, A.; Saito, M. Association of circulating exosomal miR-122 levels with BAT activity in healthy humans. Sci. Rep. 2019, 9, 13243. [Google Scholar] [CrossRef]
- Boon, M.R.; Bakker, L.E.H.; Prehn, C.; Adamski, J.; Vosselman, M.J.; Jazet, I.M.; Arias-Bouda, L.M.P.; van Lichtenbelt, W.D.M.; van Dijk, K.W.; Rensen, P.C.N.; et al. LysoPC-acyl C16:0 is associated with brown adipose tissue activity in men. Metabolomics 2017, 13, 48. [Google Scholar] [CrossRef] [PubMed]
- Lynes, M.D.; Leiria, L.O.; Lundh, M.; Bartelt, A.; Shamsi, F.; Huang, T.L.; Takahashi, H.; Hirshman, M.F.; Schlein, C.; Lee, A.; et al. The cold-induced lipokine 12,13-diHOME promotes fatty acid transport into brown adipose tissue. Nat. Med. 2017, 23, 631–637. [Google Scholar] [CrossRef] [PubMed]
- Nirengi, S.; Homma, T.; Inoue, N.; Sato, H.; Yoneshiro, T.; Matsushita, M.; Kameya, T.; Sugie, H.; Tsuzaki, K.; Saito, M.; et al. Assessment of human brown adipose tissue density during daily ingestion of thermogenic capsinoids using near-infrared time-resolved spectroscopy. J. Biomed. Opt. 2016, 21, 091305. [Google Scholar] [CrossRef] [PubMed]
- Fuse, S.; Endo, T.; Tanaka, R.; Kuroiwa, M.; Ando, A.; Kume, A.; Yamamoto, A.; Kuribayashi, K.; Somekawa, S.; Takeshita, M.; et al. Effects of capsinoid intake on brown adipose tissue vascular density and resting energy expenditure in healthy, middle-aged adults: A randomized, double-blind, placebo-controlled study. Nutrients 2020, 12, 2676. [Google Scholar] [CrossRef]


| Men (n = 69) | Women (n = 104) | All (n = 173) | p-Value * | |
|---|---|---|---|---|
| Age (years) | 38.12 ± 10.11 | 37.86 ± 7.30 | 37.96 ± 8.51 | 0.999 |
| Height (cm) ** | 172.53 ± 5.69 | 159.18 ± 5.46 | 164.50 ± 8.58 | <0.001 |
| Body weight (kg) ** | 69.54 ± 10.42 | 54.96 ± 8.62 | 60.78 ± 11.77 | <0.001 |
| BMI ** | 23.38 ± 3.48 | 21.67 ± 3.00 | 22.35 ± 3.30 | 0.001 |
| %BF (%) ** | 20.92 ± 6.44 | 28.74 ± 6.04 | 25.60 ± 7.28 | <0.001 |
| VFA (cm2) ** | 66.51 ± 39.00 | 34.37 ± 23.62 | 47.27 ± 34.45 | <0.001 |
| [total-Hb]sup (µM) | 69.48 ± 24.76 | 64.06 ± 18.95 | 66.22 ± 21.55 | 0.216 |
| Men | Women | |||||||
|---|---|---|---|---|---|---|---|---|
| Valine, Leucine, and Isoleucine (BCAAs) | Valine, Leucine, and Isoleucine (BCAAs) | |||||||
| r | p-Value | Q-Value | Q-Value | r | p-Value | Q-Value | Q-Value | |
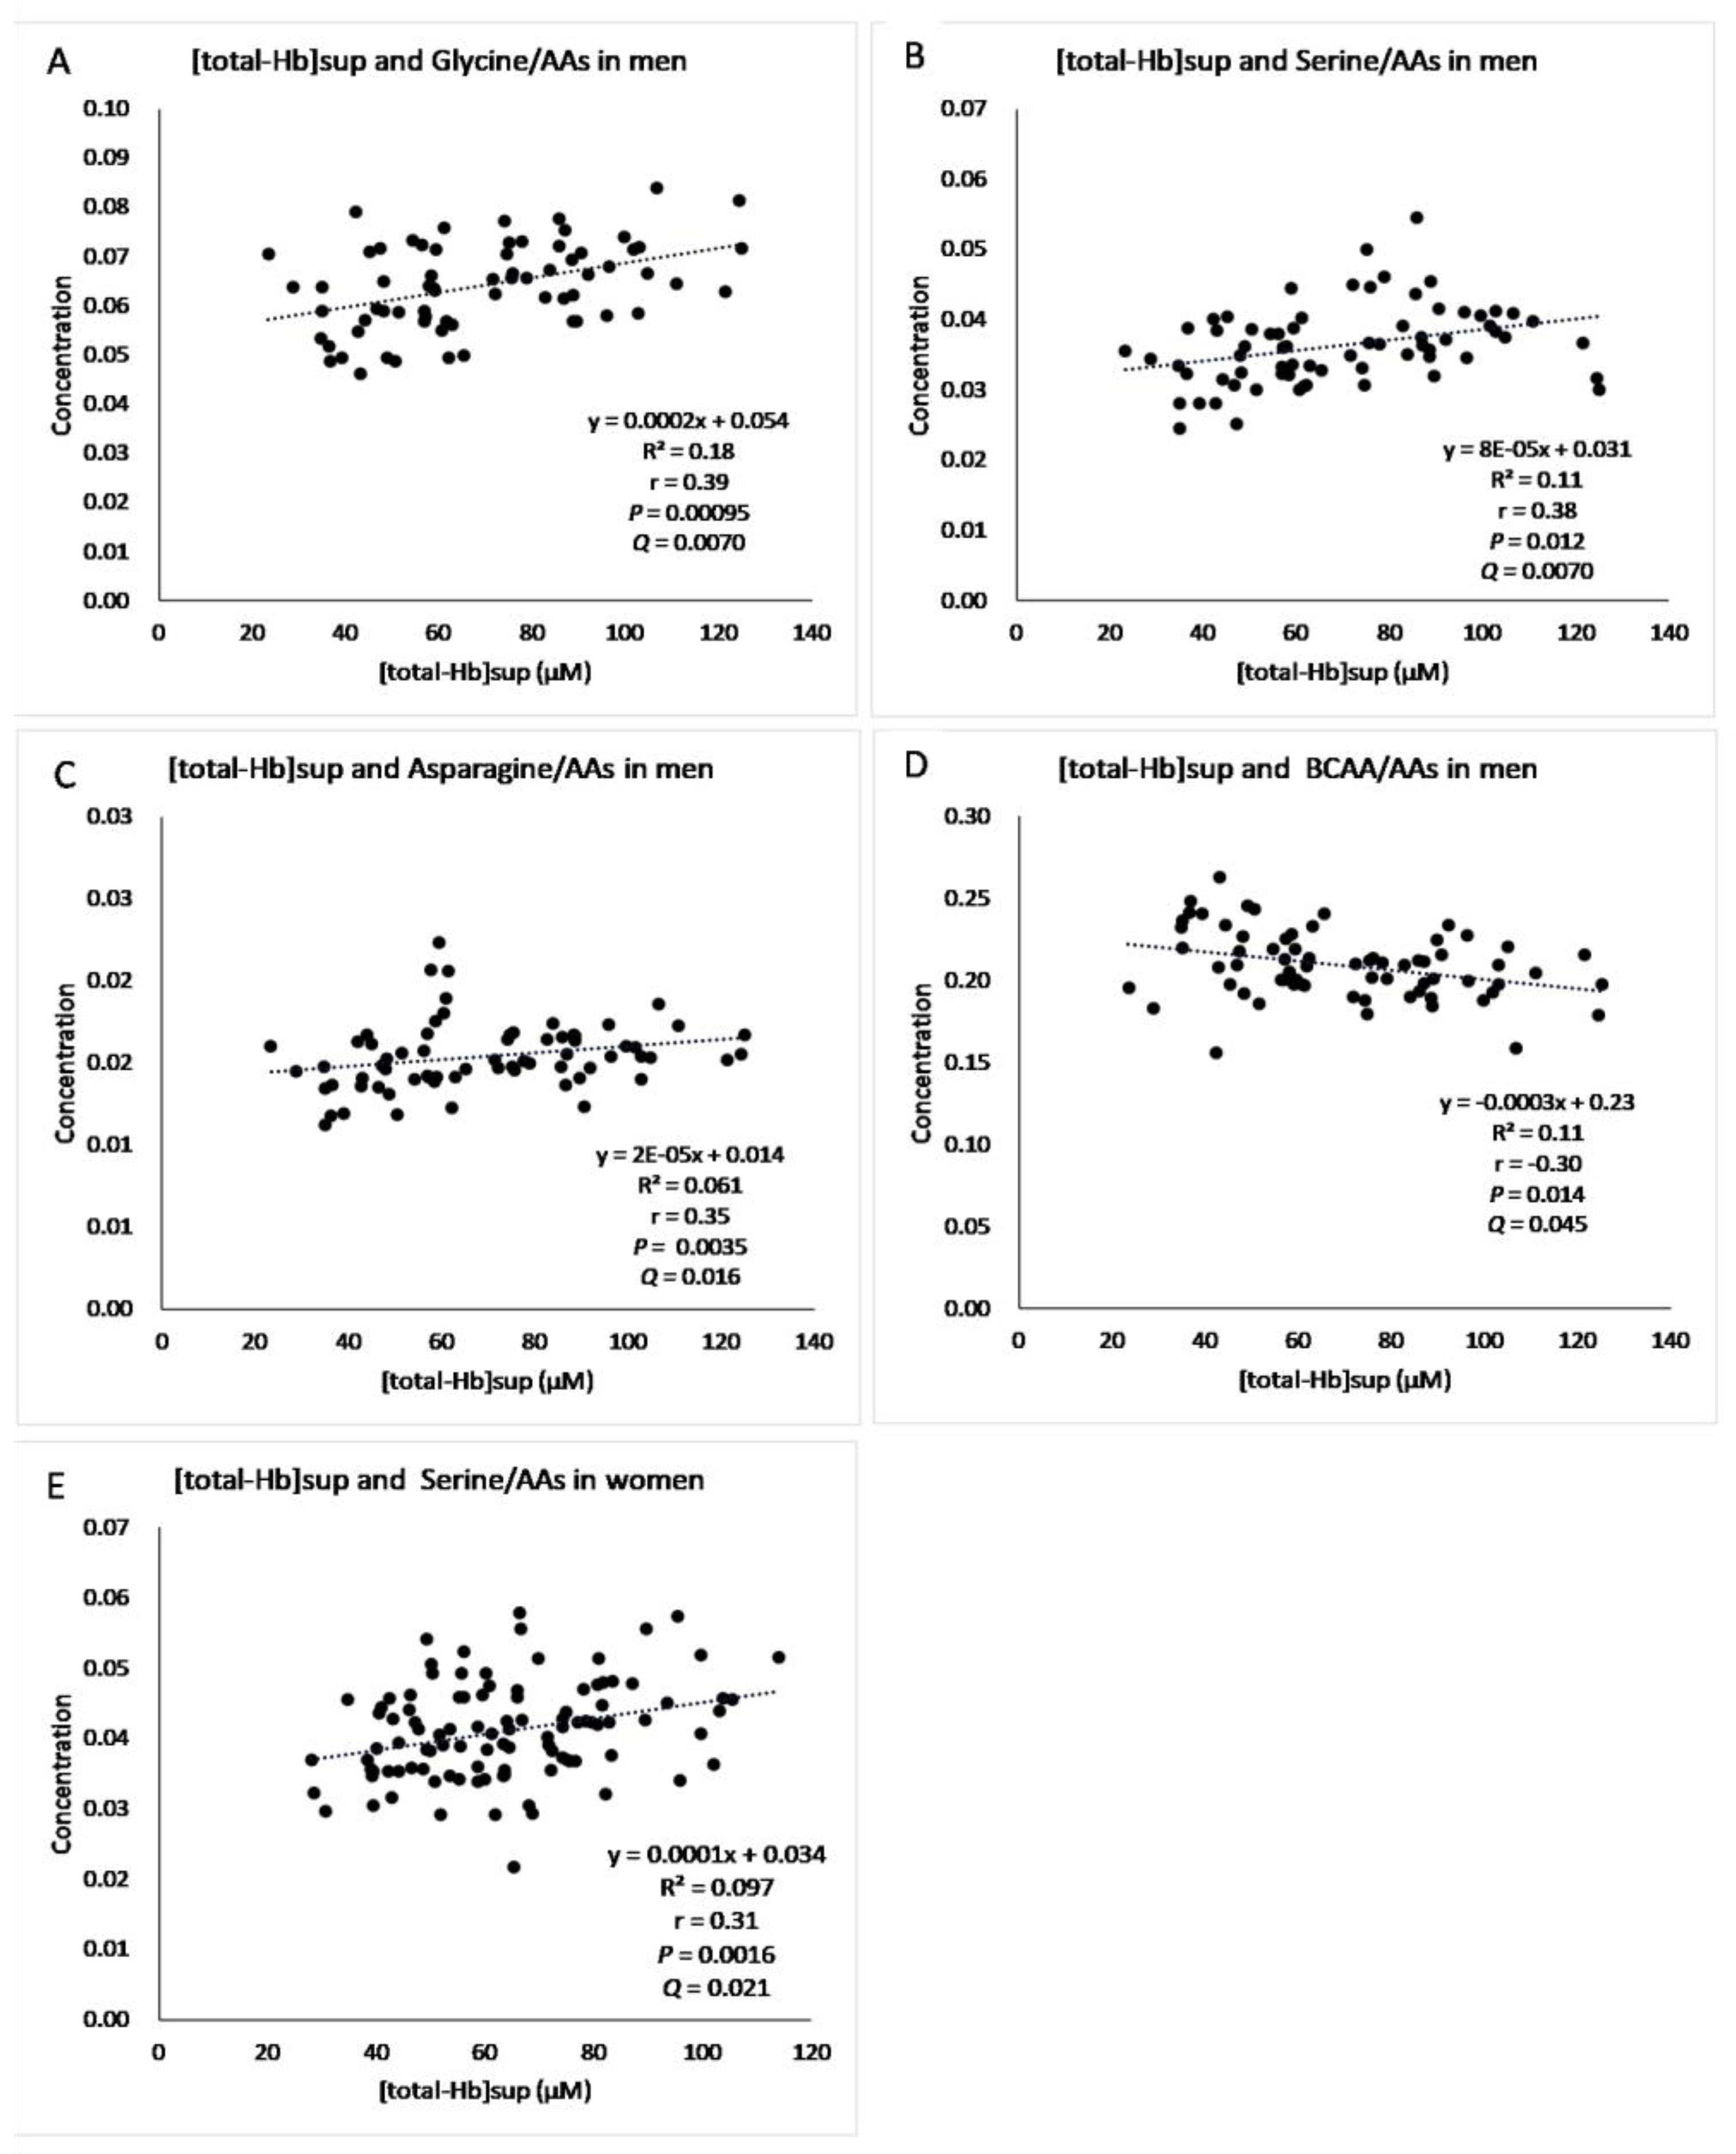
| Glycine/AAa | 0.39 ** | 0.00095 | 0.00700 | 0.00500 | 0.14 | 0.160 | 0.33 | 0.36 |
| Alanine/AAs | −0.086 | 0.48 | 0.63 | 0.55 | −0.0043 | 0.966 | 0.97 | 0.97 |
| Valine/AAs | −0.29 * | 0.016 | 0.067 | −0.18 | 0.065 | 0.20 | ||
| Leucine/AAs | −0.025 * | 0.037 | 0.13 | −0.23 * | 0.018 | 0.080 | ||
| Isoleucine/AAs | −0.19 | 0.12 | 0.32 | −0.23 * | 0.019 | 0.080 | ||
| Cysteine/AAs | −0.11 | 0.35 | 0.52 | 0.47 | −0.06 | 0.564 | 0.74 | 0.77 |
| Methionine/AAs | 0.047 | 0.70 | 0.78 | 0.67 | 0.14 | 0.172 | 0.33 | 0.36 |
| Serine/AAs | 0.38 ** | 0.0012 | 0.0070 | 0.0050 | 0.31 ** | 0.0016 | 0.021 | 0.019 |
| Homoserine + threonine/AAs | 0.23 | 0.057 | 0.17 | 0.15 | 0.071 | 0.476 | 0.67 | 0.70 |
| Aspartate/AAs | 0.038 | 0.76 | 0.80 | 0.68 | −0.090 | 0.365 | 0.59 | 0.63 |
| Glutamate/AAs | −0.15 | 0.22 | 0.44 | 0.41 | −0.19 * | 0.049 | 0.17 | 0.19 |
| Asparagine/AAs | 0.35 ** | 0.0035 | 0.016 | 0.012 | 0.14 | 0.143 | 0.33 | 0.36 |
| Glutamine/AAs | 0.170 | 0.16 | 0.38 | 0.37 | 0.048 | 0.630 | 0.77 | 0.78 |
| Arginine/AAs | 0.075 | 0.54 | 0.63 | 0.55 | 0.12 | 0.241 | 0.42 | 0.46 |
| Lysine/AAs | −0.14 | 0.24 | 0.44 | 0.41 | 0.016 | 0.869 | 0.91 | 0.92 |
| Histidine/AAs | 0.094 | 0.44 | 0.62 | 0.55 | 0.044 | 0.657 | 0.77 | 0.78 |
| Phenylalanine/AAs | 0.140 | 0.25 | 0.44 | 0.41 | 0.025 | 0.801 | 0.89 | 0.90 |
| Tyrosine/AAs | −0.130 | 0.29 | 0.46 | 0.42 | −0.079 | 0.427 | 0.64 | 0.68 |
| Tryptophan/AAs | −0.080 | 0.52 | 0.63 | 0.55 | 0.24 * | 0.015 | 0.08 | 0.10 |
| Proline/AAs | −0.031 | 0.80 | 0.80 | 0.68 | −0.14 | 0.167 | 0.33 | 0.36 |
| BCAAs/AAs | −0.30 * | 0.014 | 0.045 | −0.22 * | 0.028 | 0.13 | ||
Publisher’s Note: MDPI stays neutral with regard to jurisdictional claims in published maps and institutional affiliations. |
© 2021 by the authors. Licensee MDPI, Basel, Switzerland. This article is an open access article distributed under the terms and conditions of the Creative Commons Attribution (CC BY) license (https://creativecommons.org/licenses/by/4.0/).
Share and Cite
Kuroiwa, M.; Hamaoka-Fuse, S.; Sugimoto, M.; Kurosawa, Y.; Aita, Y.; Tomita, A.; Anjo, M.; Tanaka, R.; Endo, T.; Kime, R.; et al. Correlation of Plasma Amino Acid and Anthropometric Profiles with Brown Adipose Tissue Density in Humans. J. Clin. Med. 2021, 10, 2339. https://doi.org/10.3390/jcm10112339
Kuroiwa M, Hamaoka-Fuse S, Sugimoto M, Kurosawa Y, Aita Y, Tomita A, Anjo M, Tanaka R, Endo T, Kime R, et al. Correlation of Plasma Amino Acid and Anthropometric Profiles with Brown Adipose Tissue Density in Humans. Journal of Clinical Medicine. 2021; 10(11):2339. https://doi.org/10.3390/jcm10112339
Chicago/Turabian StyleKuroiwa, Miyuki, Sayuri Hamaoka-Fuse, Masahiro Sugimoto, Yuko Kurosawa, Yasuko Aita, Atsumi Tomita, Mikiko Anjo, Riki Tanaka, Tasuki Endo, Ryotaro Kime, and et al. 2021. "Correlation of Plasma Amino Acid and Anthropometric Profiles with Brown Adipose Tissue Density in Humans" Journal of Clinical Medicine 10, no. 11: 2339. https://doi.org/10.3390/jcm10112339
APA StyleKuroiwa, M., Hamaoka-Fuse, S., Sugimoto, M., Kurosawa, Y., Aita, Y., Tomita, A., Anjo, M., Tanaka, R., Endo, T., Kime, R., & Hamaoka, T. (2021). Correlation of Plasma Amino Acid and Anthropometric Profiles with Brown Adipose Tissue Density in Humans. Journal of Clinical Medicine, 10(11), 2339. https://doi.org/10.3390/jcm10112339