1. Introduction
The recovery and reuse of solvents are important objectives in many industries to improve sustainability and circularity, as well as to reduce operating costs and carbon footprint. In many applications, water is typically the primary contaminant that must be removed before the solvent can be reused [
1]. The chemical industry relies extensively on thermal-based separation processes, such as distillation, to dehydrate the solvent and achieve high purity. These separation processes are energy-intensive, primarily utilizing steam generated from the combustion of natural gas. In recent years, the cost of steam has escalated significantly, with further increases anticipated due to diminishing natural resource supplies and the 2050 climate goals [
2]. The pressure to reduce energy consumption and CO
2 emissions triggers companies to explore alternative separation methods, such as membrane technologies or hybrid systems. One notable example of such a hybrid system is combining pervaporation with distillation. The use of a simple distillation process to complete purification is not possible or is energy- and capital-intensive when dealing with azeotropes or close boiling points. In such cases, a hybrid process combining distillation and pervaporation, or a standalone pervaporation process, can be an attractive alternative.
The market for pervaporation membranes is expected to witness significant growth in the coming years, primarily driven by the growing demand for solvent recovery, comprising dehydration as well as the separation of organic solvents. On average, only 39% of spent solvents were recycled in the EU-28 in 2018 [
3]. The current market for pervaporation membranes was valued at 4.8 billion euros in 2023 and is projected to reach 6.7 billion euros, growing at a compound annual growth rate (CAGR) of 6.9% during the forecasted period 2024 to 2031 [
4]. Pervatech developed and commercialized a unique and robust hybrid silica membrane (HybSi
® AR), designed to separate water or other small polar compounds from solvents. They have superior acid resistance and are a good fit for a variety of dehydrations and throughputs [
5]. A full-scale isopropanol (IPA) dehydration plant using HybSi
® AR membranes in vapor permeation mode was already realized by Pervatech [
5]. These membranes are being used in a wide variety of industrial applications such as the dehydration of both process and waste solvent mixtures relevant to chemical, pharma, food, and biotech processing. Advantages of HybSi
® AR membranes include superior chemical and thermal stability, and up to 50% potential savings in energy. The reader can refer to the suggested literature for more information on general solvent recovery [
6], dehydration by pervaporation [
1], pervaporation membrane materials [
7], and specifically ceramic PV membrane materials [
8,
9].
Isopropyl alcohol (IPA) has numerous applications, including use as a solvent, cleaning agent, and disinfectant. The majority of its market share comes from its role as a solvent in various industries, such as pharmaceuticals, chemicals, and electronics [
10]. The global market volume of isopropyl alcohol was approximately 2.3 million metric tons. Europe is the third-largest market for IPA, largely due to the presence of several prominent pharmaceutical companies [
10].
The separation of IPA from water, particularly near its azeotropic composition (~87 wt.% IPA), presents both thermodynamic and economic challenges. Traditional azeotropic distillation, though widely used, is energy-intensive and costly when using entrainers like benzene [
11]. Hybrid distillation–pervaporation (D–PV) processes, especially those employing NaA-type ceramic membranes, have shown significantly improved economics. It was reported that incorporating pervaporation reduced the total separation cost by 49%, while maintaining a product purity of 99.5 wt.% IPA [
11]. Membrane performance data support these gains, as zeolite NaA membranes demonstrated water/IPA separation factors of ~10,000 and fluxes up to 1.76–2.0 kg/m
2·h at 70–90 °C [
9]. Further enhancement was observed in vapor permeation–distillation (D–VP) hybrids, where Harvianto et al. reported reductions in separation cost by 77% compared to azeotropic distillation, largely due to a lower energy input and the elimination of entrainer handling [
12]. These systems delivered comparable purities (>99.5 wt.% IPA) and benefited from the high thermal stability and selectivity of hollow fibre modules. Furthermore, Spatolisano and Pellegrini reviewed process intensification strategies and proposed alternative schemes combining azeotropic distillation and extraction, confirming energy savings over traditional setups, though without matching the cost-effectiveness of membrane-based routes [
13]. Overall, techno-economic assessments favour membrane-assisted processes, particularly those using ceramic materials, for their ability to combine high separation efficiency, lower energy demands, and favorable operational costs, making them strong candidates for sustainable IPA recovery at scale.
Recent studies have showcased various advancements in membrane design and modeling for IPA–water dehydration. Flexible hybrid silica membranes fabricated via ultrasonic spray coating achieved a water flux of approximately 0.6 kg/(m
2·h) and a separation factor of approximately 1300 for 90 wt.% IPA solutions, demonstrating scalability and high performance [
14]. Vacuum-assisted interfacial polymerization produced thin-film composite polyamide membranes with a water flux of approximately 1.504 kg/(m
2·h) and a separation factor of approximately 314 for 70 wt.% IPA feeds [
15]. Meanwhile, mixed-matrix membranes incorporating In (BTC) MOFs into PVA reported fluxes of 0.142–0.341 kg/(m
2·h) with permeate water purities up to 99.9 wt.% [
16], and PVA membranes enhanced with kaolinite showed a flux of 0.86 kg/(m
2·h) in ternary solvent systems (epichlorohydrin/IPA/water) [
17].
Despite these recent material-level developments, relatively few studies integrate detailed membrane performance into system-level techno-economic analysis (TEA). Aziaba et al. (2022) developed a modular solution–diffusion-based pervaporation model compatible with open-source simulators and validated against experimental results [
18]. Separately, Van Hecke et al. (2021) embedded experimental HybSi
® membrane performance data into a digital twin simulation for the intensification of transesterification processes, enabling process optimization and membrane sizing via TEA principles [
19]. These efforts illustrate the growing importance of combining experimental data with economic and environmental metrics, a direction further explored in the present study.
Several modeling studies and economic assessments of IPA dehydration are available in the literature. One such notable study, conducted about two decades ago, was reported by Van Hoof et al. [
11]. In this study, economic evaluations were carried out based on experimental data obtained with two commercial membranes available at the time, i.e., a polymeric membrane (i.e., PERVAP
® 2510, Sulzer Chemtech, Germany) and one ceramic membrane (i.e., NaA zeolite, Mitsui & Co.). These membranes have limited selectivity and permeability compared to current HybSi
® AR membranes that combine the best properties of organic and inorganic materials. For example, the Mitsui membrane had a flux of approximately 4 kg/h∙m
2 at a feed water concentration of 10 wt.% [
11] as opposed to the HybSi
® AR membrane in this study, which showed a flux of nearly 20 kg/h∙m
2 under similar conditions. This paper has been and is being highly cited, and is considered very relevant by the industry. However, the data used in the paper on energy and membrane costs, as well as membrane performance, are outdated.
This study presents the first combined techno-economic and environmental analysis of IPA dehydration using HybSi
® membranes across three configurations. A new cost efficiency metric,
COPCO, is introduced, alongside updated modeling under 2024 market conditions. The results in terms of technical, economic, and environmental performance were compared with a benchmark azeotropic distillation process. This was achieved by conducting experimental pervaporation experiments, as well as simulations and model calculations of distillation columns. Compared to the study by Van Hoof et al. [
11], important additional costs such as the outside battery limit (OSBL) costs, insurance, labor, and waste disposal costs were also considered. This study aims to inform a broad audience on the technical capabilities, energy, and separation costs of pervaporation technology for solvent recovery, more specifically for the dehydration of a highly relevant solvent/water system, i.e., IPA-water. By quantifying the energy/cost gains, CO
2 footprint reduction, and process intensification potential, industrial implementation of this alternative technology, as well as market uptake of HybSi
® membranes, can be further pushed. To further evaluate the techno-economic potential of pervaporation for solvent recovery, the insights and methodology adopted in this study will be extended to several other industrially relevant solvent/water mixtures in a future paper.
3. Results
Results are presented for the experimental, technical, economic, and environmental performances of the pervaporation systems. For the experimental results, the average water flux obtained at different vacuum pressures and inlet water concentrations for different pervaporation processes is discussed. In the technical analysis, the performance based on recovery efficiency, energy intensity, steam, and cooling water consumption is presented. Subsequently, the results of the economic and environmental analysis are presented in terms of LCOS, emission intensity, and COPCO index. Lastly, a sensitivity analysis is also presented for the parameters involving high uncertainty, such as feed flow rate, vacuum pressure, feed water content (FWC) to pervaporation, average water flux, membrane life, prices of membrane, steam, and cooling water.
3.1. Experimental Pervaporation Results
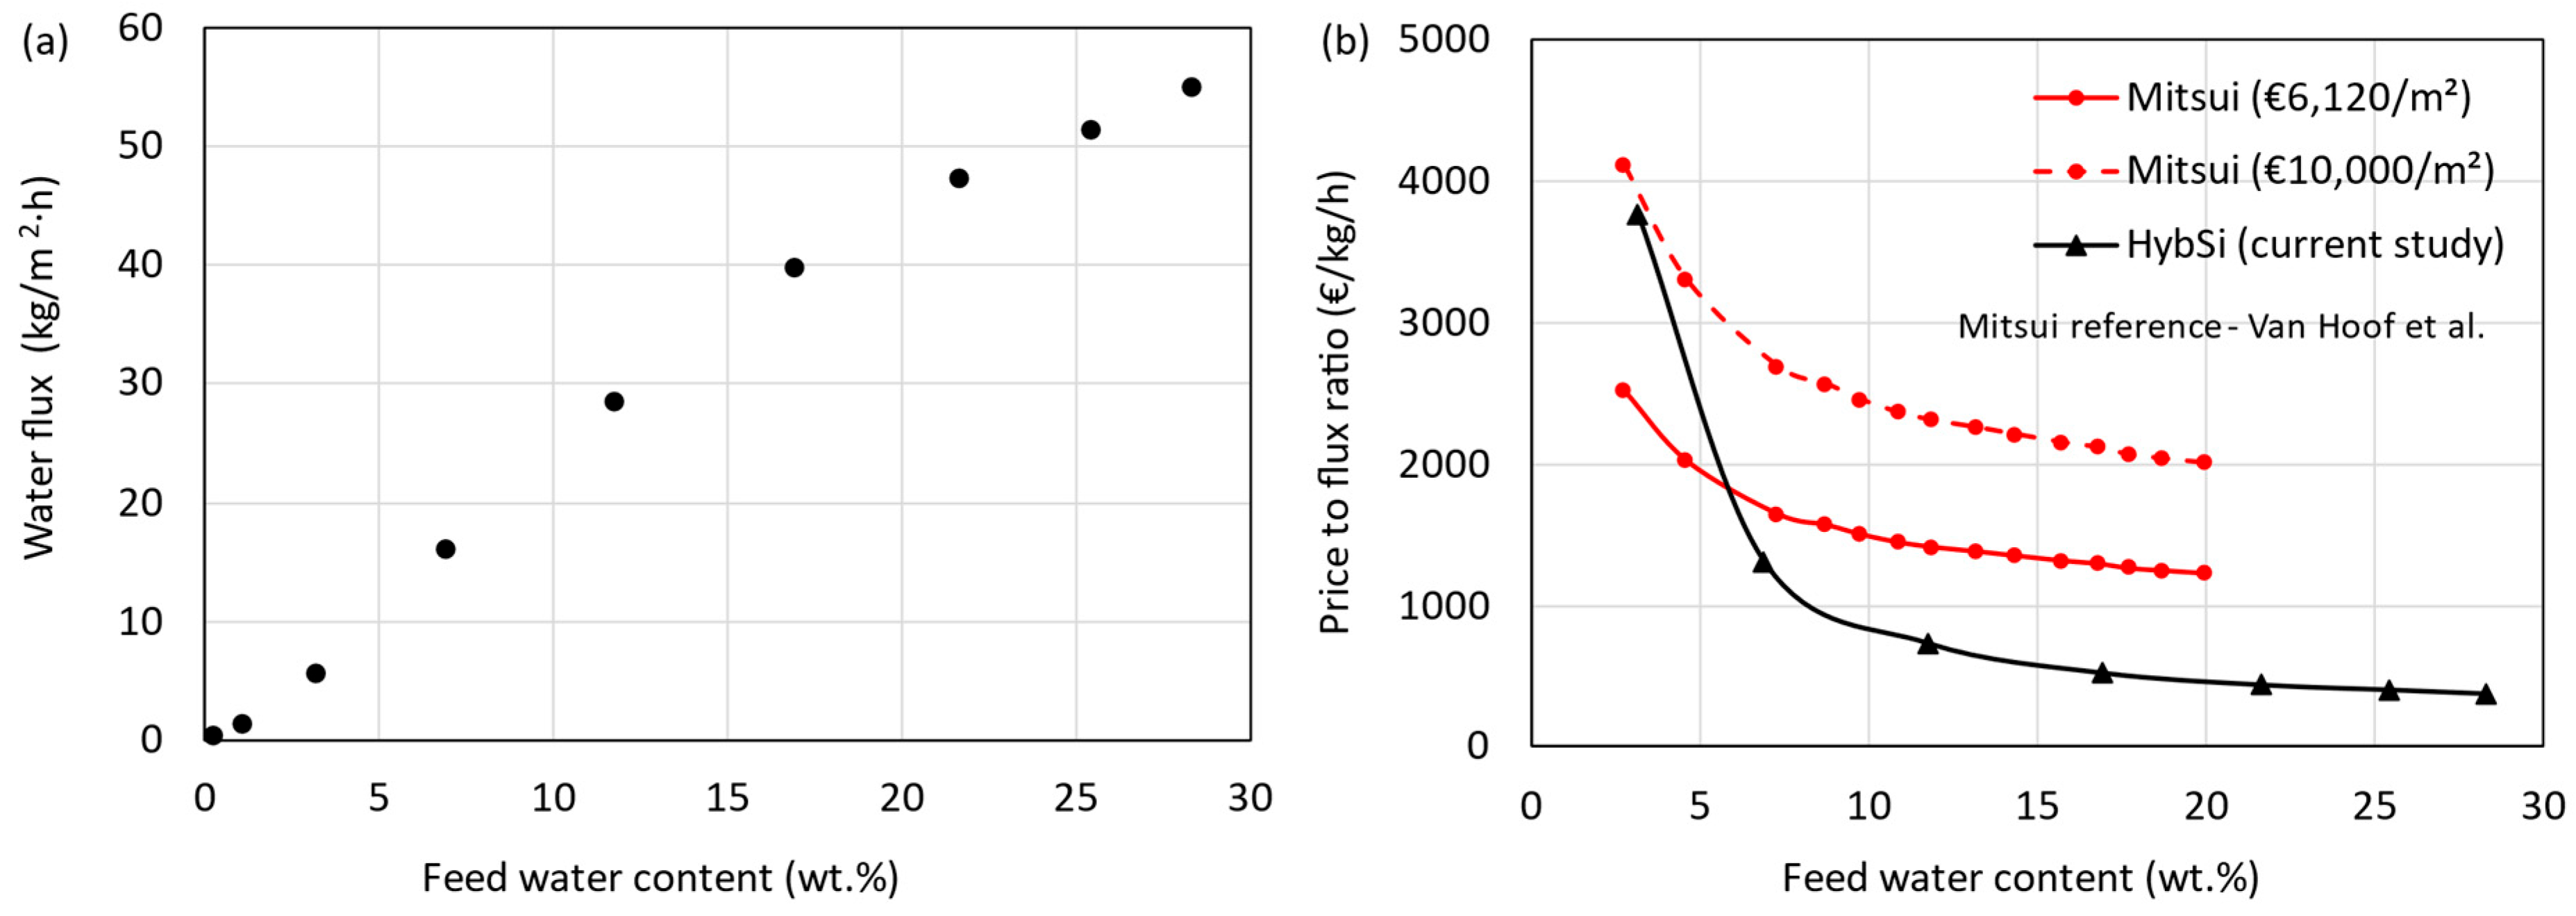
The total water flux obtained as a function of feed water content at a feed temperature of 130 °C is shown in
Figure 7a. The HybSi
® AR membranes showed high selectivity and high flux, demonstrating their exceptional suitability for IPA dehydration. The silica network of HybSi
® membranes facilitates water transport through preferential sorption and diffusion, driven by molecular size and polarity differences. Operating at 130 °C increases water mobility and vapor pressure, enhancing flux while maintaining selectivity. As noted in
Section 2.1, the driving force in pervaporation is the partial pressure gradient of water across the membrane. Elevated temperatures raise the feed-side partial pressure, thereby intensifying the driving force and resulting in higher permeation rates. The fluxes of Mitsui membranes reported by Van Hoof et al. [
11] are significantly lower than the current HybSi
® AR membrane (e.g., 5 times lower at 10 wt.% water). Flux increases nonlinearly with feed water content due to Raoult’s law effects and enhanced sorption-driven transport. Similarly, the price of the Mitsui membrane (€ 3400/m
2) reported was also lower than the HybSi
® AR membranes. The current price of Mitsui membranes was not available. Therefore, the prices were updated to the current year using the chemical engineering plant cost index (CEPCI) (2004-444.2 and 2024-800.3), resulting in a price of € 6120/m
2. However, using CEPCI may not be the right index to use, considering the increase in material, manufacturing, and labor costs in the past decades. A comparison between the Mitsui and HybSi
® AR membranes can be made by considering the price-to-flux ratio (€/kg/h) as a function of feed water content, as shown in
Figure 7b. The flux values of Mitsui membranes at 90 °C were extracted from Van Hoof et al. [
11]. These fluxes were used with the updated price (€ 6120/m
2) to calculate the price-to-flux ratios represented by the red continuous line in
Figure 7b. The black continuous line represents the price-to-flux ratio for the HybSi
® AR membrane. The results show that the HybSi
® AR membrane performs better for most feed water contents. At a feed water content below about 6 wt.%, the Mitsui membranes showed better performance. However, as mentioned earlier, the actual membrane price could be higher than the estimation based on the Mitsui membrane price reported by Van Hoof et al. [
11]. Considering a price of € 10,000/m
2, the performance of HybSi
® AR membranes is better at all feed water contents.
Table S13 compares our system to prior work (Van Hoof et al. [
11] and Harvianto et al. [
12]), showing superior flux and competitive LCOS. This comparison highlights the competitive performance of our HybSi
®-based system, particularly at low water concentrations, and supports the feasibility of the proposed hybrid configurations.
Table 9 shows the average flux, permeate water concentration, and membrane surface area requirement at various vacuum pressures, feed water contents, and product water contents. The permeance and selectivity values were also calculated at representative operating conditions and are reported in
Table S15 of the Supplementary Material. Permeance (
) was defined as the molar flux divided by the partial pressure difference across the membrane, while selectivity (or separation factor) was defined as the ratio of product water-to-IPA concentrations in the permeate and feed, respectively. These formulations are consistent with established definitions in pervaporation and membrane science [
1,
43,
44]. The experiments were performed until 30 wt.% of water concentration and extrapolated further until 50 wt.% water concentration using the VLE relation data. The organic flux was assumed to be 0.1 kg/h∙m
2 for all cases due to difficulties in determination. It can be seen that the average flux values are greatly dependent on the aforementioned parameters. When the vacuum pressure increases, the average flux decreases, irrespective of the feed water concentration. A higher flux at lower permeate pressures (20 mbar) is due to a higher driving force, while at higher permeate pressures (50 mbar), the driving force is reduced, leading to a lower flux [
45]. Furthermore, the operating vacuum pressures also affect the evaporation rate of the permeate. At lower pressures, the evaporation rate of water is enhanced, leading to higher fluxes [
46]. The feed water content (water in) and retentate water content (water out) also have a significant influence on the average flux values, as shown in
Figure 7a and
Table 9. This is due to the difference in driving force resulting from the concentration gradient across the membrane. For the hybrid D-PV and D-PV-D processes, water in (wt.%) represents the top stream water content of column 1. For example, when the feed water content increases from 15 wt.% (D-PV) to 50 wt.% (PV), the average flux values increase by almost 70% at both vacuum pressures. This increase is not reflected in the required membrane area, as it also depends on the permeate flow rate. The permeate quality (or selectivity) is also listed in
Table 9 and seems to be dependent on the average flux. The higher the flux, the better the permeate quality, meaning that the loss of organic solvent is minimal, resulting in high IPA recovery efficiencies. The high permeate quality indicates the high selectivity of the HybSi
® AR membranes toward water.
3.2. Technical Performance
The technical performance of the azeotropic distillation process and the three pervaporation-based processes is presented in
Table 10. The membrane area required was calculated based on the average water flux and the permeate flow rates. Depending on the size of the process, the number of membrane modules can be estimated based on the standard module size of 3 m
2, which is readily available. However, a design for 10 m
2 modules is also available on the market. Several modules are arranged in series to achieve the desired retentate purity. For the D-PV process, a total of 11 m
2 area is required, resulting in three modules of 3 m
2 area and 1 module of 2 m
2 area. For the D-PV-D process, since the retentate purity required was restricted to 5 wt.% water, the membrane area required was just 4 m
2, resulting in one module of 3 m
2 area and another one of just 1 m
2 area. For the standalone PV process, the membrane area required was 19 m
2, resulting in 6 modules of 3 m
2 and 1 module of 1 m
2. The recovery efficiencies of pervaporation-based processes are on par with the benchmark process. The highest recovery efficiency was observed for the D-PV-D process, as it involved a second distillation column after the pervaporation module.
Steam is the primary energy source that is used in reboilers of distillation columns, feed heating to operating temperature, and interstage heating in pervaporation processes. A boiler may be used on-site to generate this steam; however, only the costs associated with producing this steam were considered in this study. The interstage heating was carried out after each module to reheat the retentate to 130 °C before the next pervaporation module. For simplicity, it was assumed that the heat required in the interstage heating was equivalent to the heat of vaporization of the entire permeate flow rate. In the benchmark process (D-D-D), only steam was considered as the energy consumption. The combined steam consumption shown in
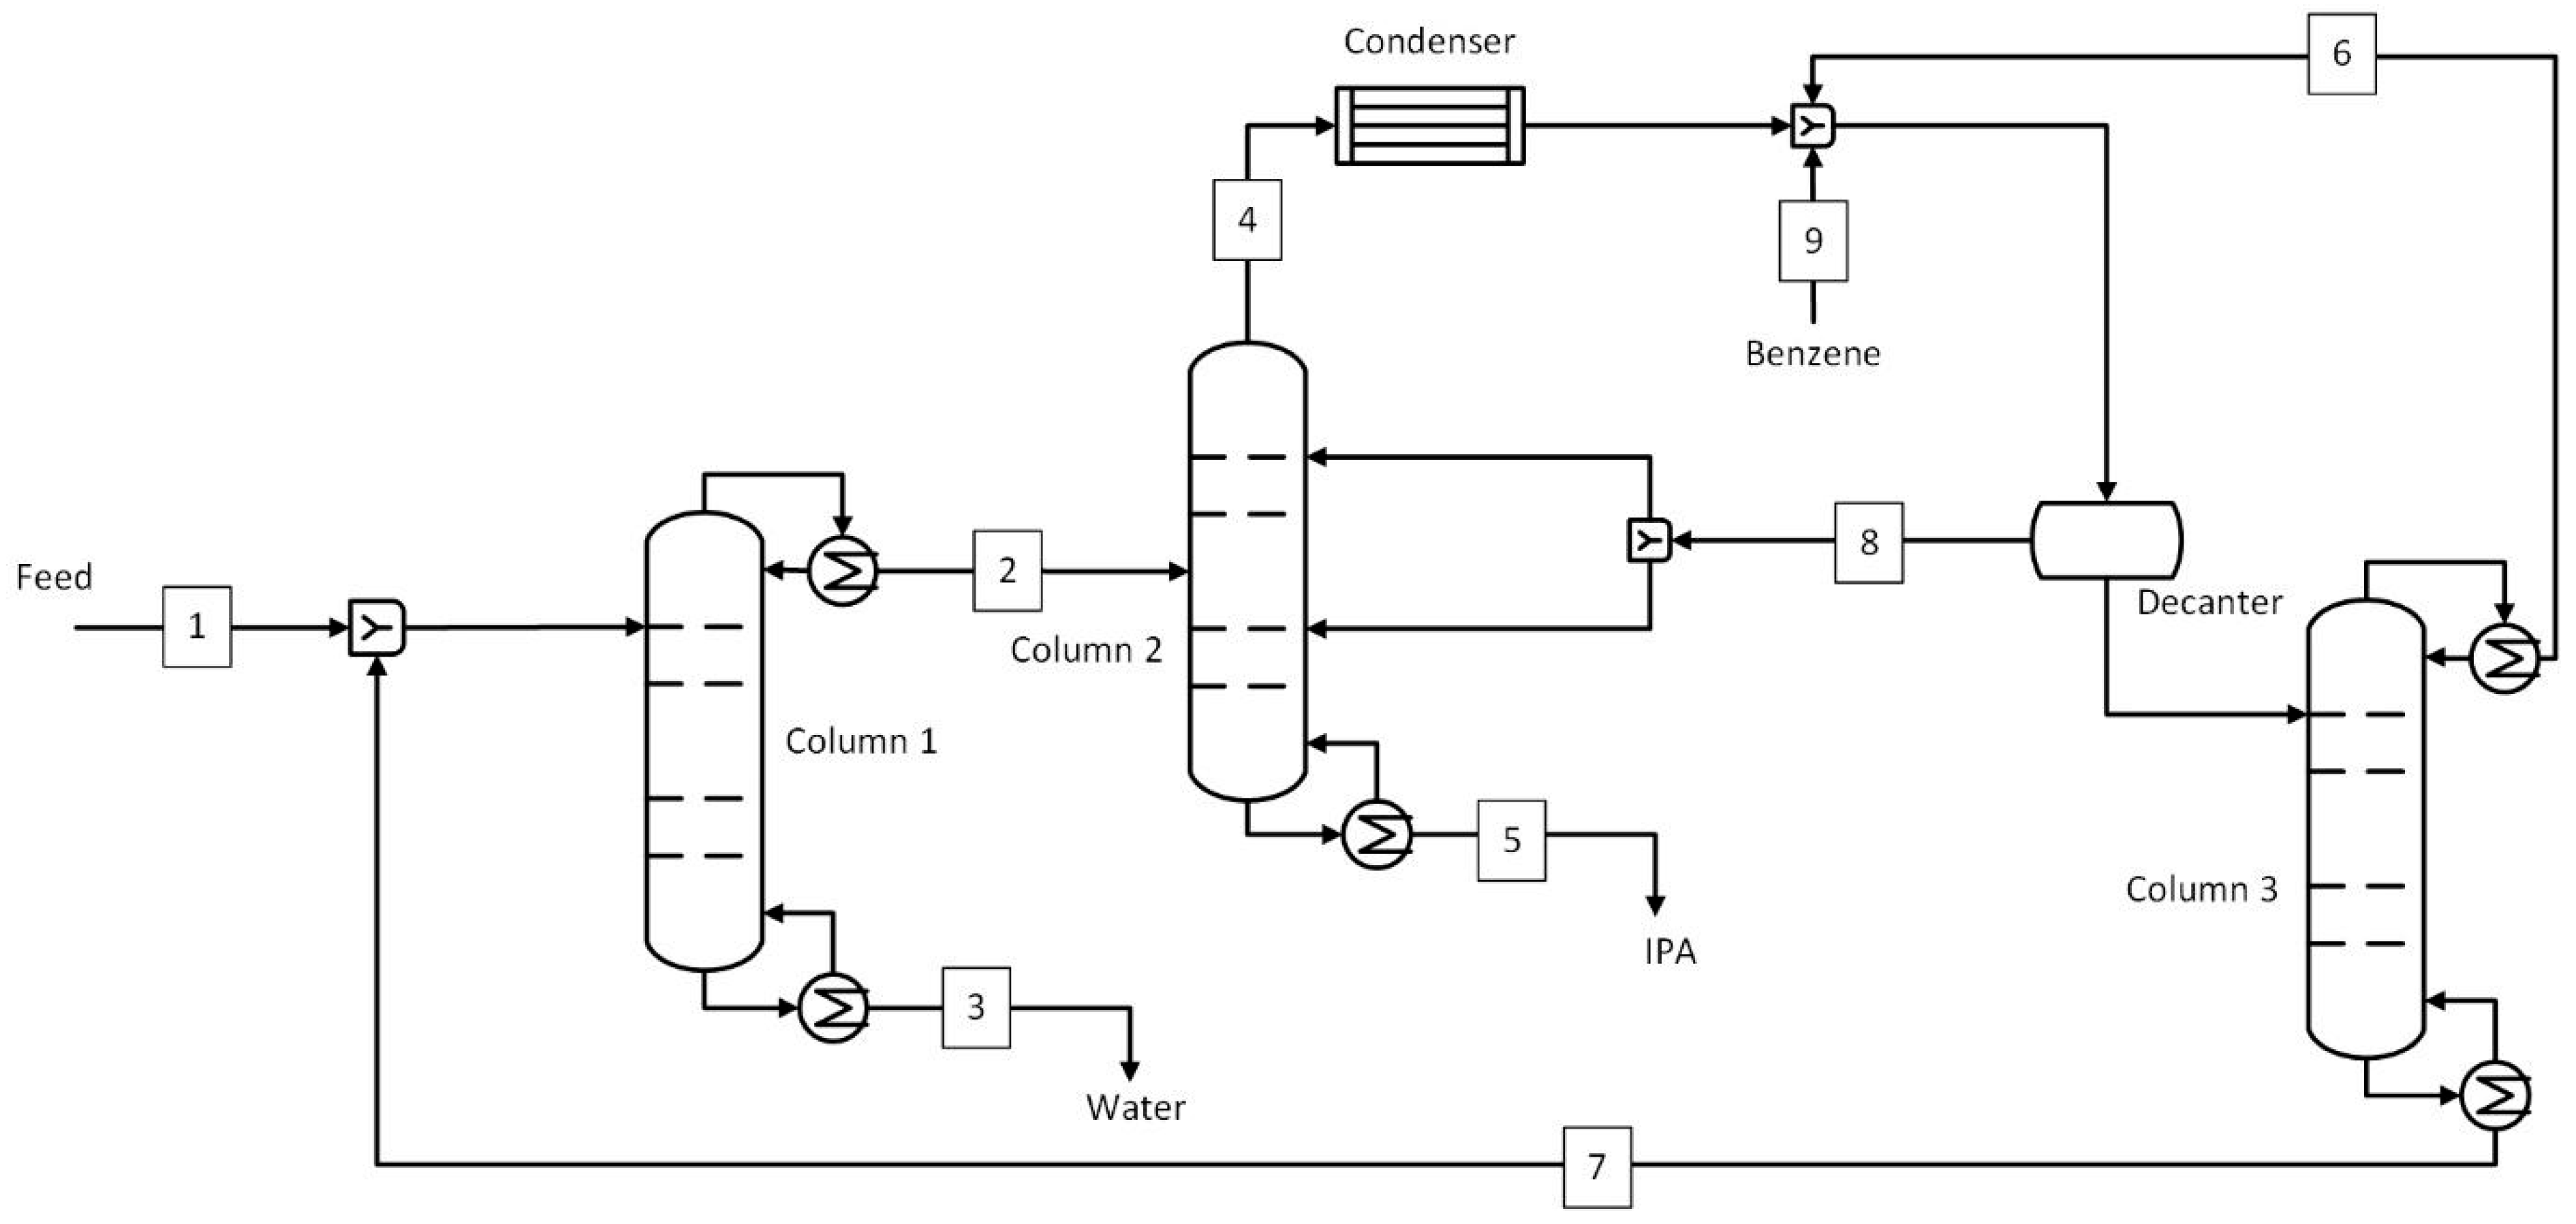
Table 10 is divided among the three columns in a ratio of 41:16:1. The most steam was consumed in column 1, as it has to heat the mixture to a near-azeotropic boiling point (~80 °C). In column 2, the top stream was a mixture of IPA, water, and benzene, forming a ternary azeotrope, and also had a temperature near their azeotropic point (~62 °C). The least steam was needed in column 3, which was used to recover benzene in the top stream at 10 kg/h (
Figure 2 and
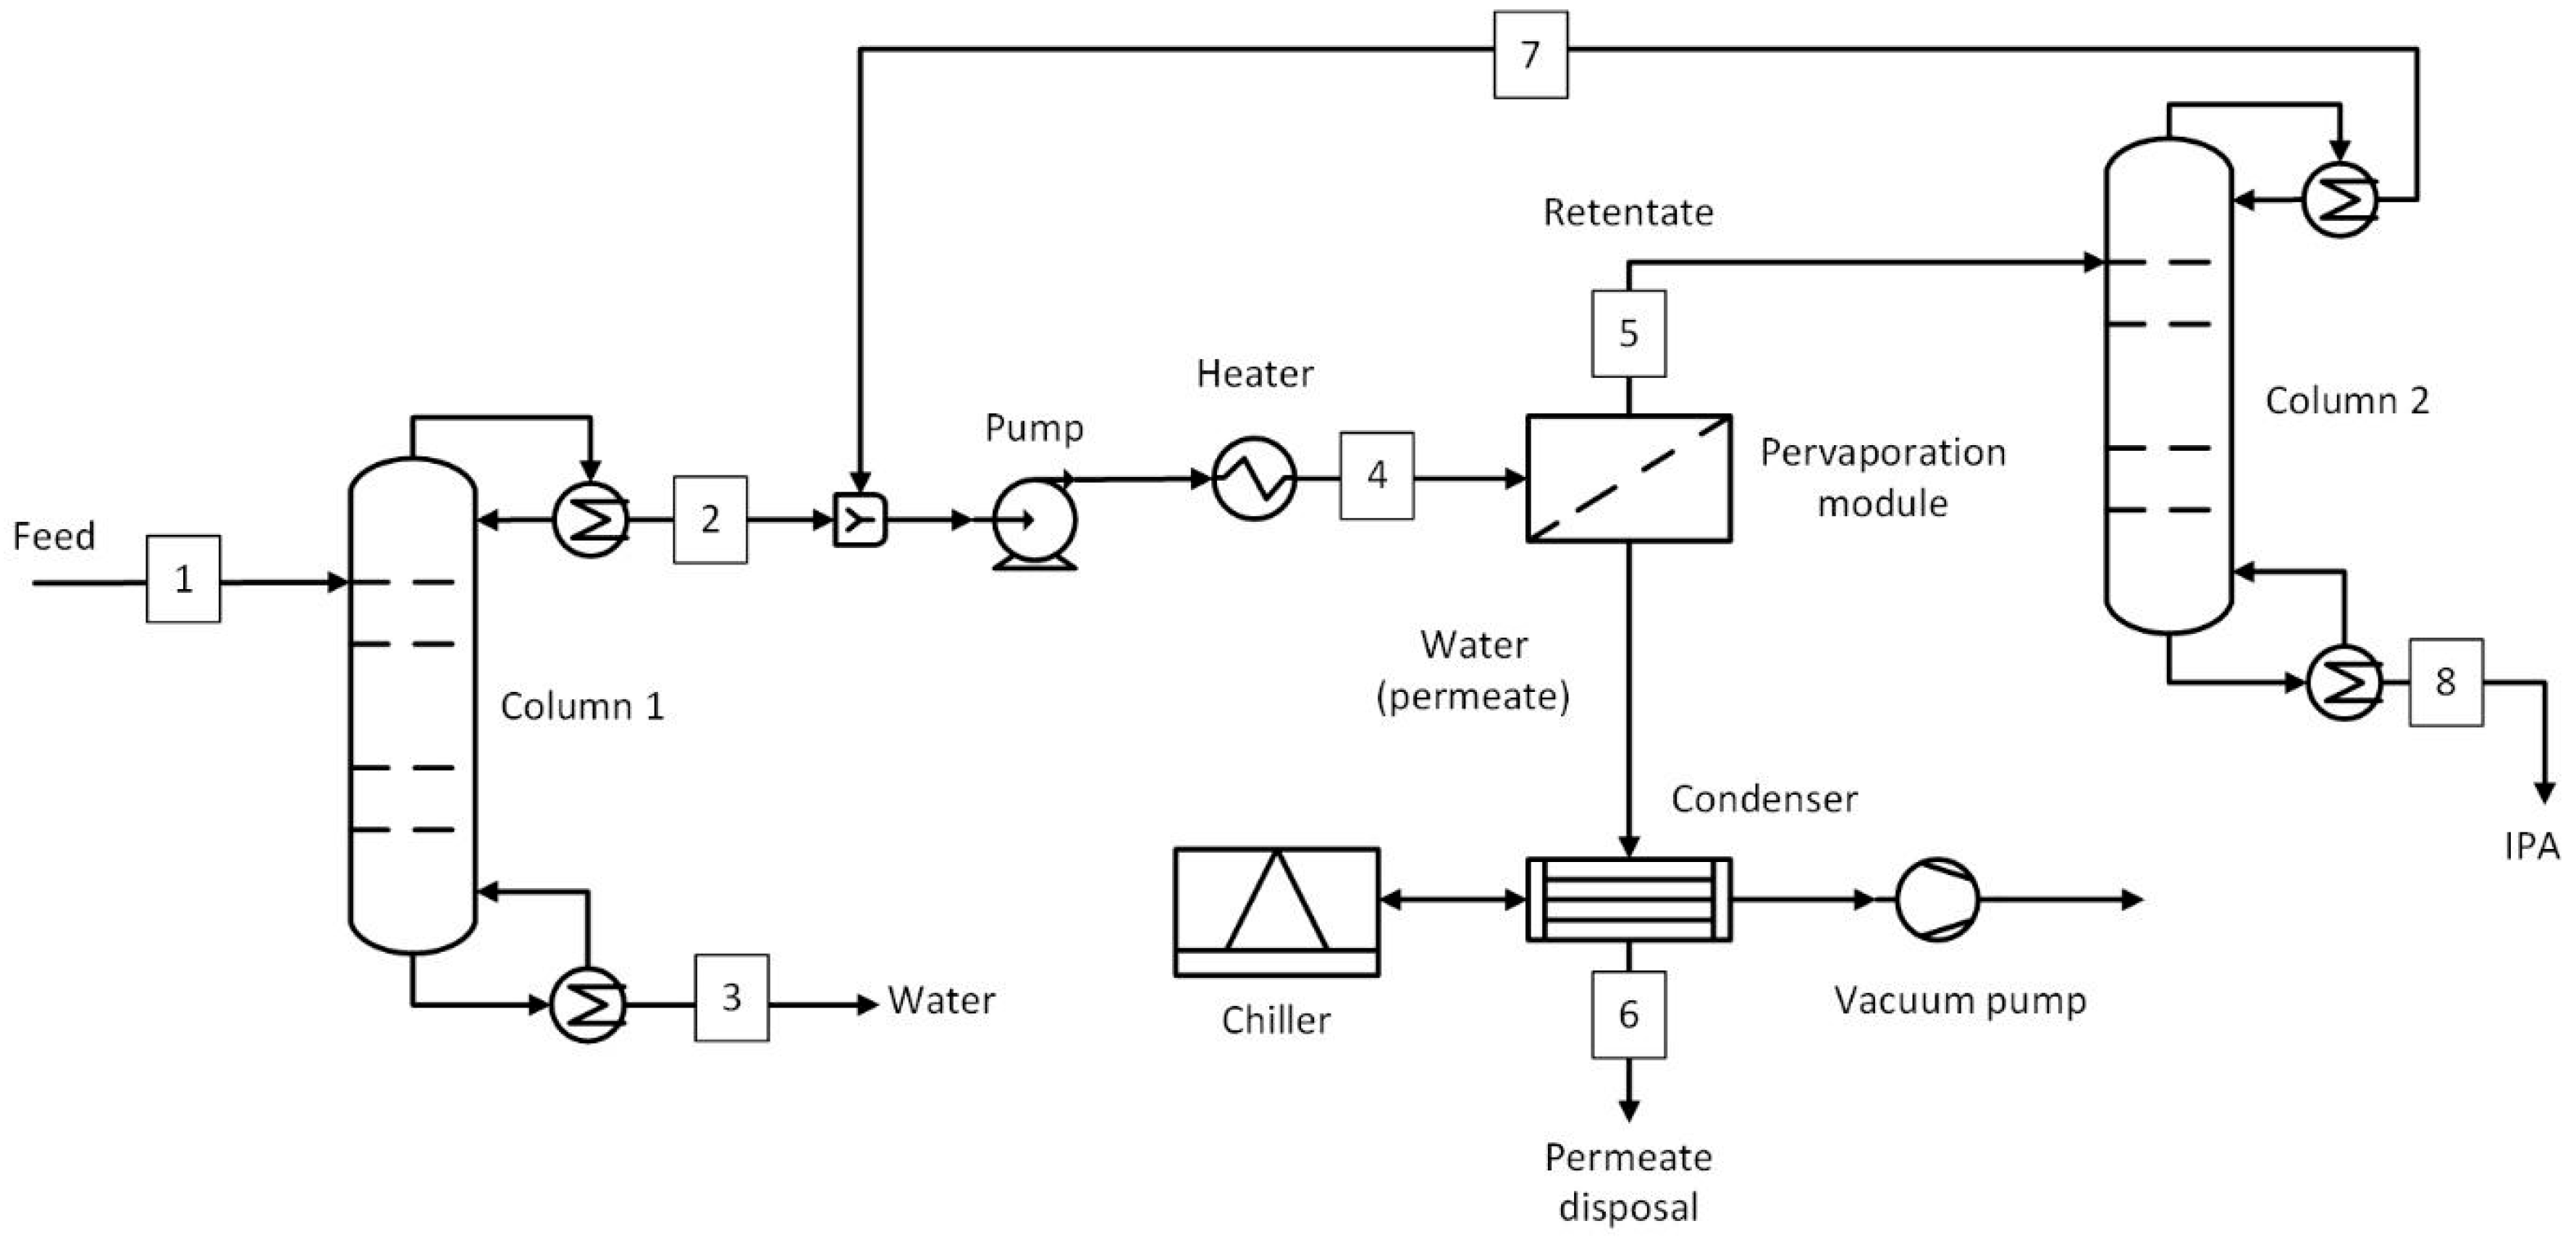
Table 1). The D-PV process required 58% less steam than the benchmark, most of which was used in column 1 (~80%), where the top stream was brought to near azeotropic conditions (80 °C). The rest of the steam was used in feed heating (8%) and interstage heating (12%). For the D-PV-D process, column 1 used 41% of the steam while column 2 used 46% as it handles larger flow rates (see
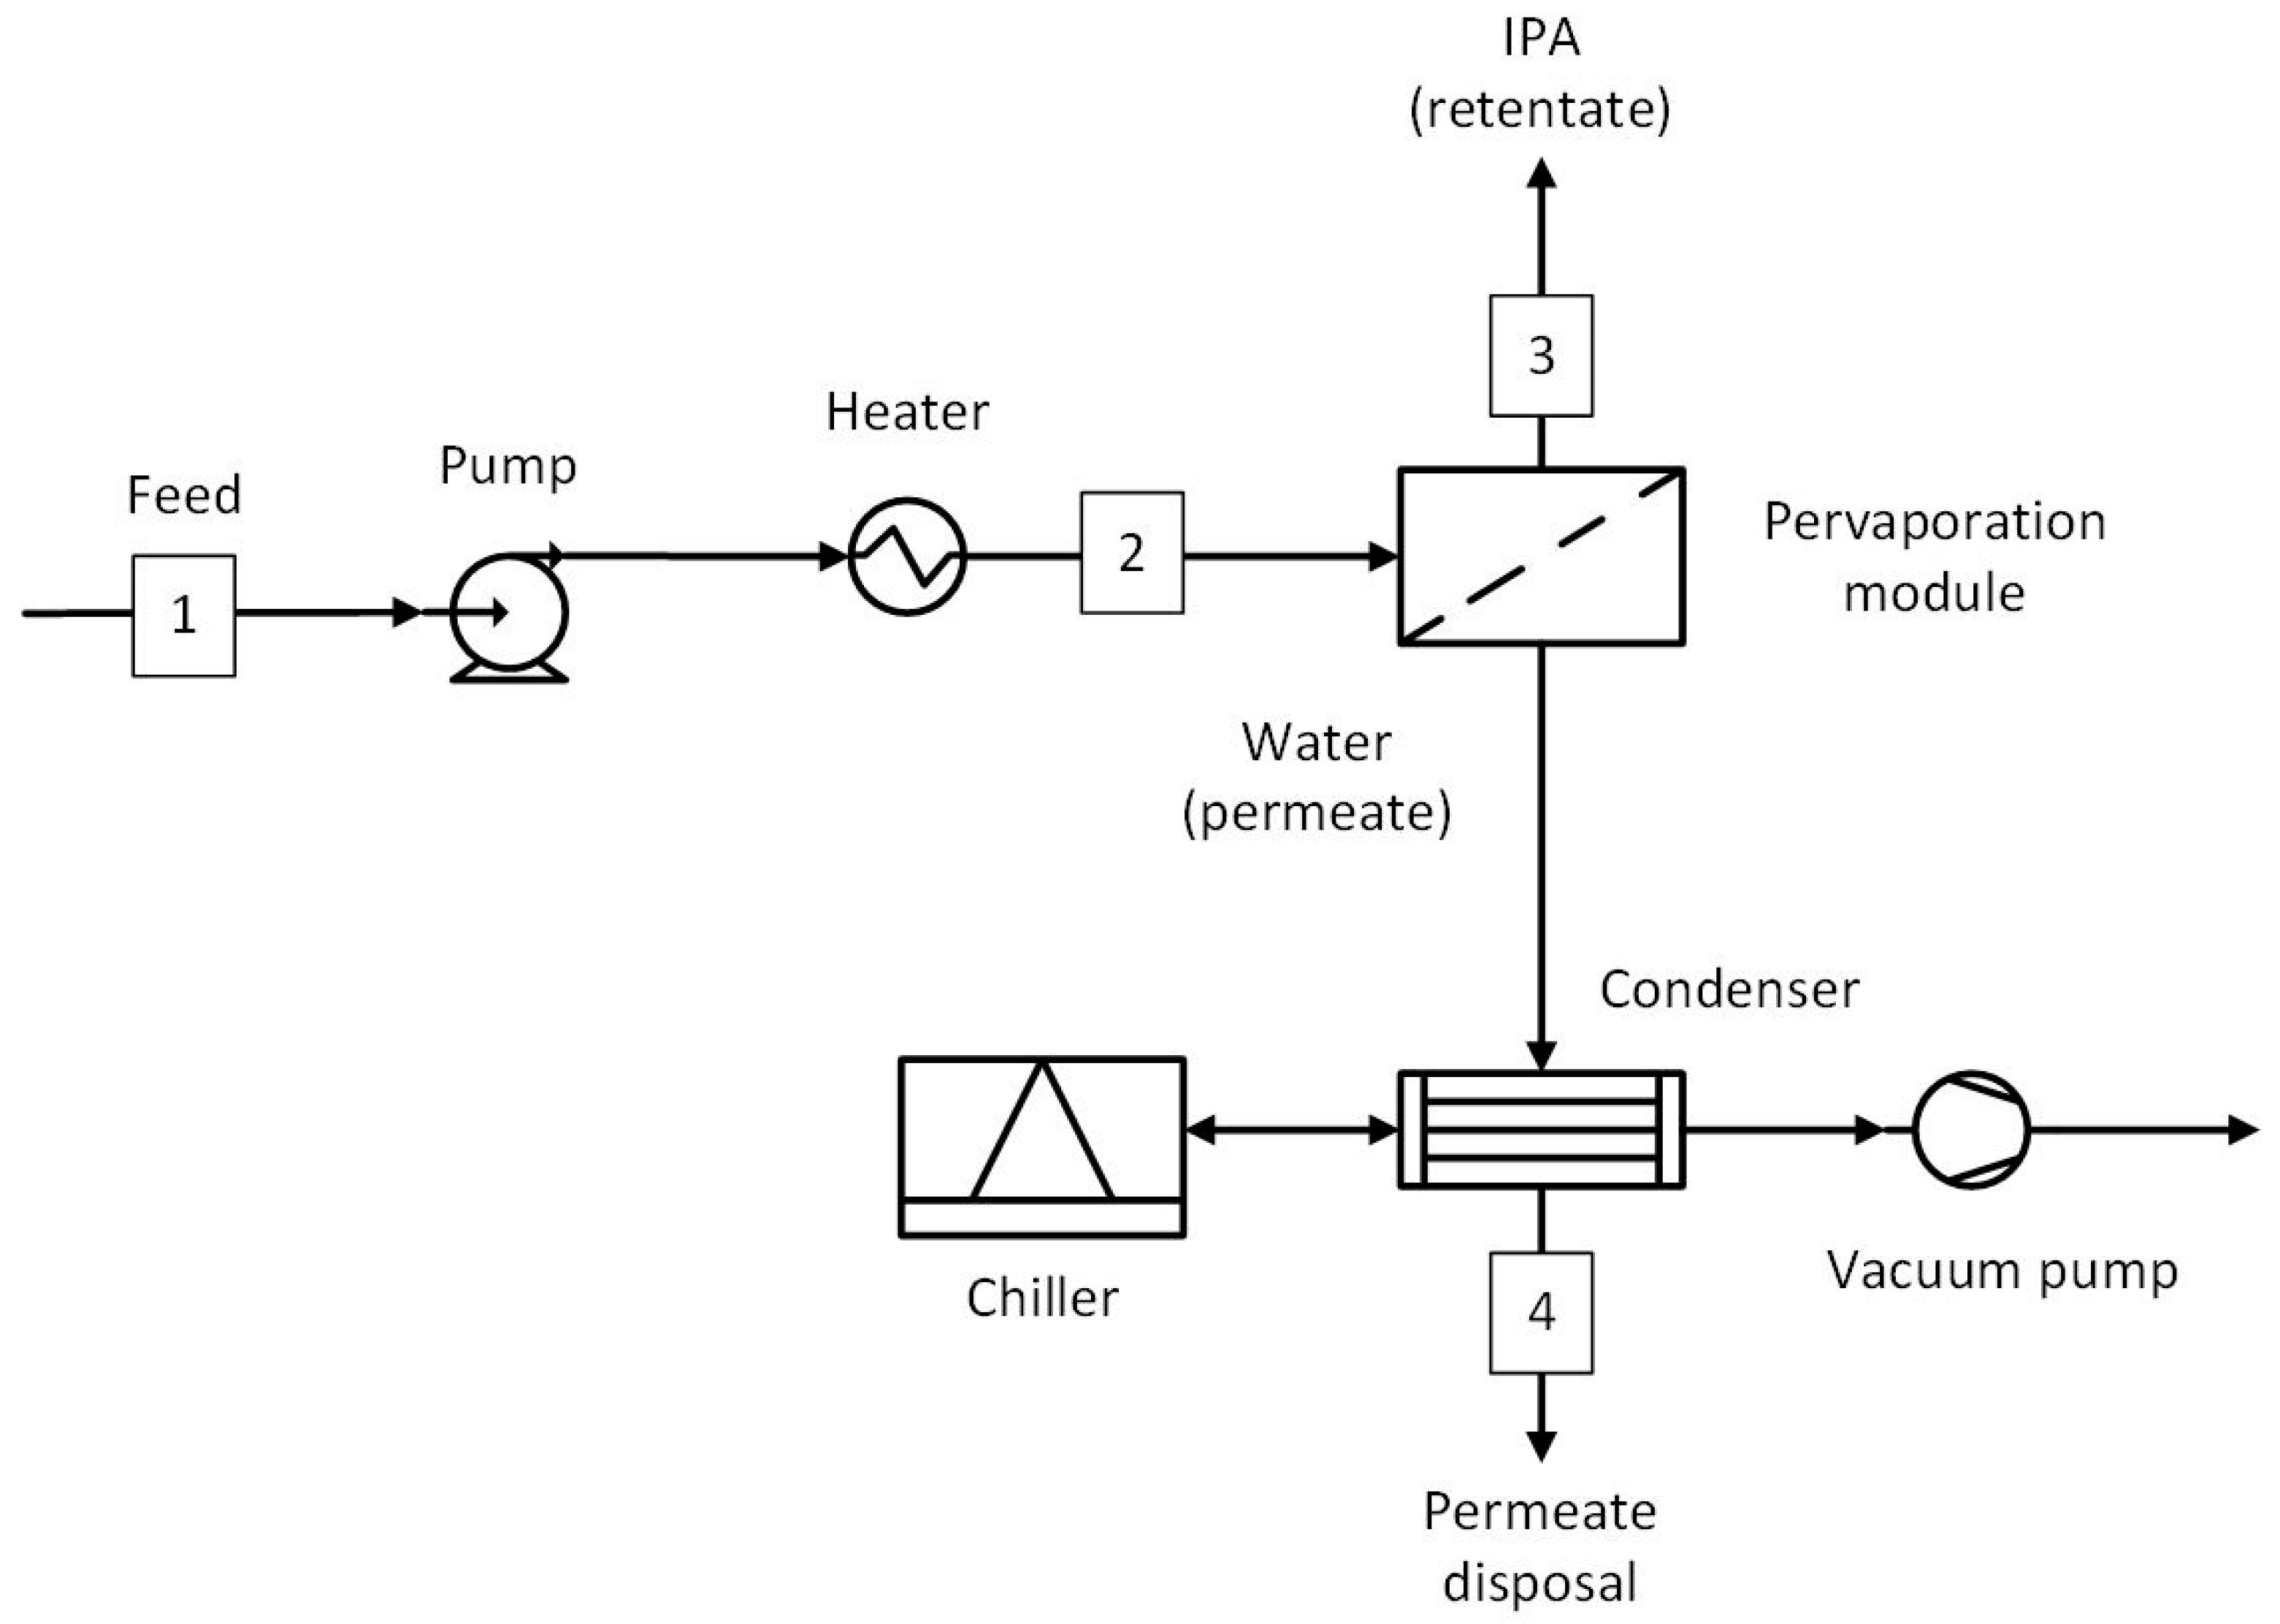
Figure 4). The feed and interstage steam requirements were 7% and 6%, respectively. In the standalone PV, about 30% of the steam was used for feed heating, while the remaining steam was used for interstage heating. If a boiler was used on-site to produce the required steam, the D-PV and PV processes would have smaller-sized boilers compared to the benchmark.
The electricity consumption was neglected for the azeotropic distillation process since all distillation columns operated at atmospheric pressure. The only electricity required was for pumping, which was not considered in the current study. The electricity required in pervaporation-based processes was mainly consumed by the chiller required for permeate condensation (>90%), followed by the vacuum pump and feed pump. For the D-PV and D-PV-D processes, the electricity consumption was similar since the permeate flow rates are the same. The electricity consumption of the standalone PV process was 884 MWh/yr, about 82% more than the hybrid processes, due to larger permeate flow rates. In this case, about 98% of the electricity was consumed by the chiller.
Cooling water was required for the condensation of the distillate in the columns and the vacuum pump. Depending on the solvent system under consideration, cooling water may also be required for condensing the permeate instead of a chiller. This may reduce the separation costs resulting from eliminating the capital and electricity costs of the chiller in certain cases. However, in the current study, using cooling water for permeate condensation was not feasible due to a low vacuum pressure of 20 mbar at which the saturation temperature was ~17 °C. Compared to the benchmark, the cooling water consumption by D-PV, D-PV-D, and PV processes was 72%, 24.6%, and 99.9% less. The heat accumulated by the cooling water is generally rejected in a cooling tower integrated with the base plant, requiring additional auxiliary equipment and land. The less cooling water is consumed, the less piping and recycling equipment are required. The PV process uses just above 1 m3/day of cooling water and would not require a dedicated cooling tower compared to the benchmark and the hybrid cases.
To have a proper comparison in terms of energy consumption, energy intensity was used, which combines both electricity and steam into one metric, as discussed in
Section 2.5. The benchmark case consumed about 2 MWh/t-IPA, whereas the D-PV, D-PV-D, and PV cases consumed 56%, 16%, and 46% less energy, respectively. For the benchmark case, all energy comes from steam, whereas for the hybrid and PV cases, the majority of the energy comes from steam.
3.3. Economic Performance
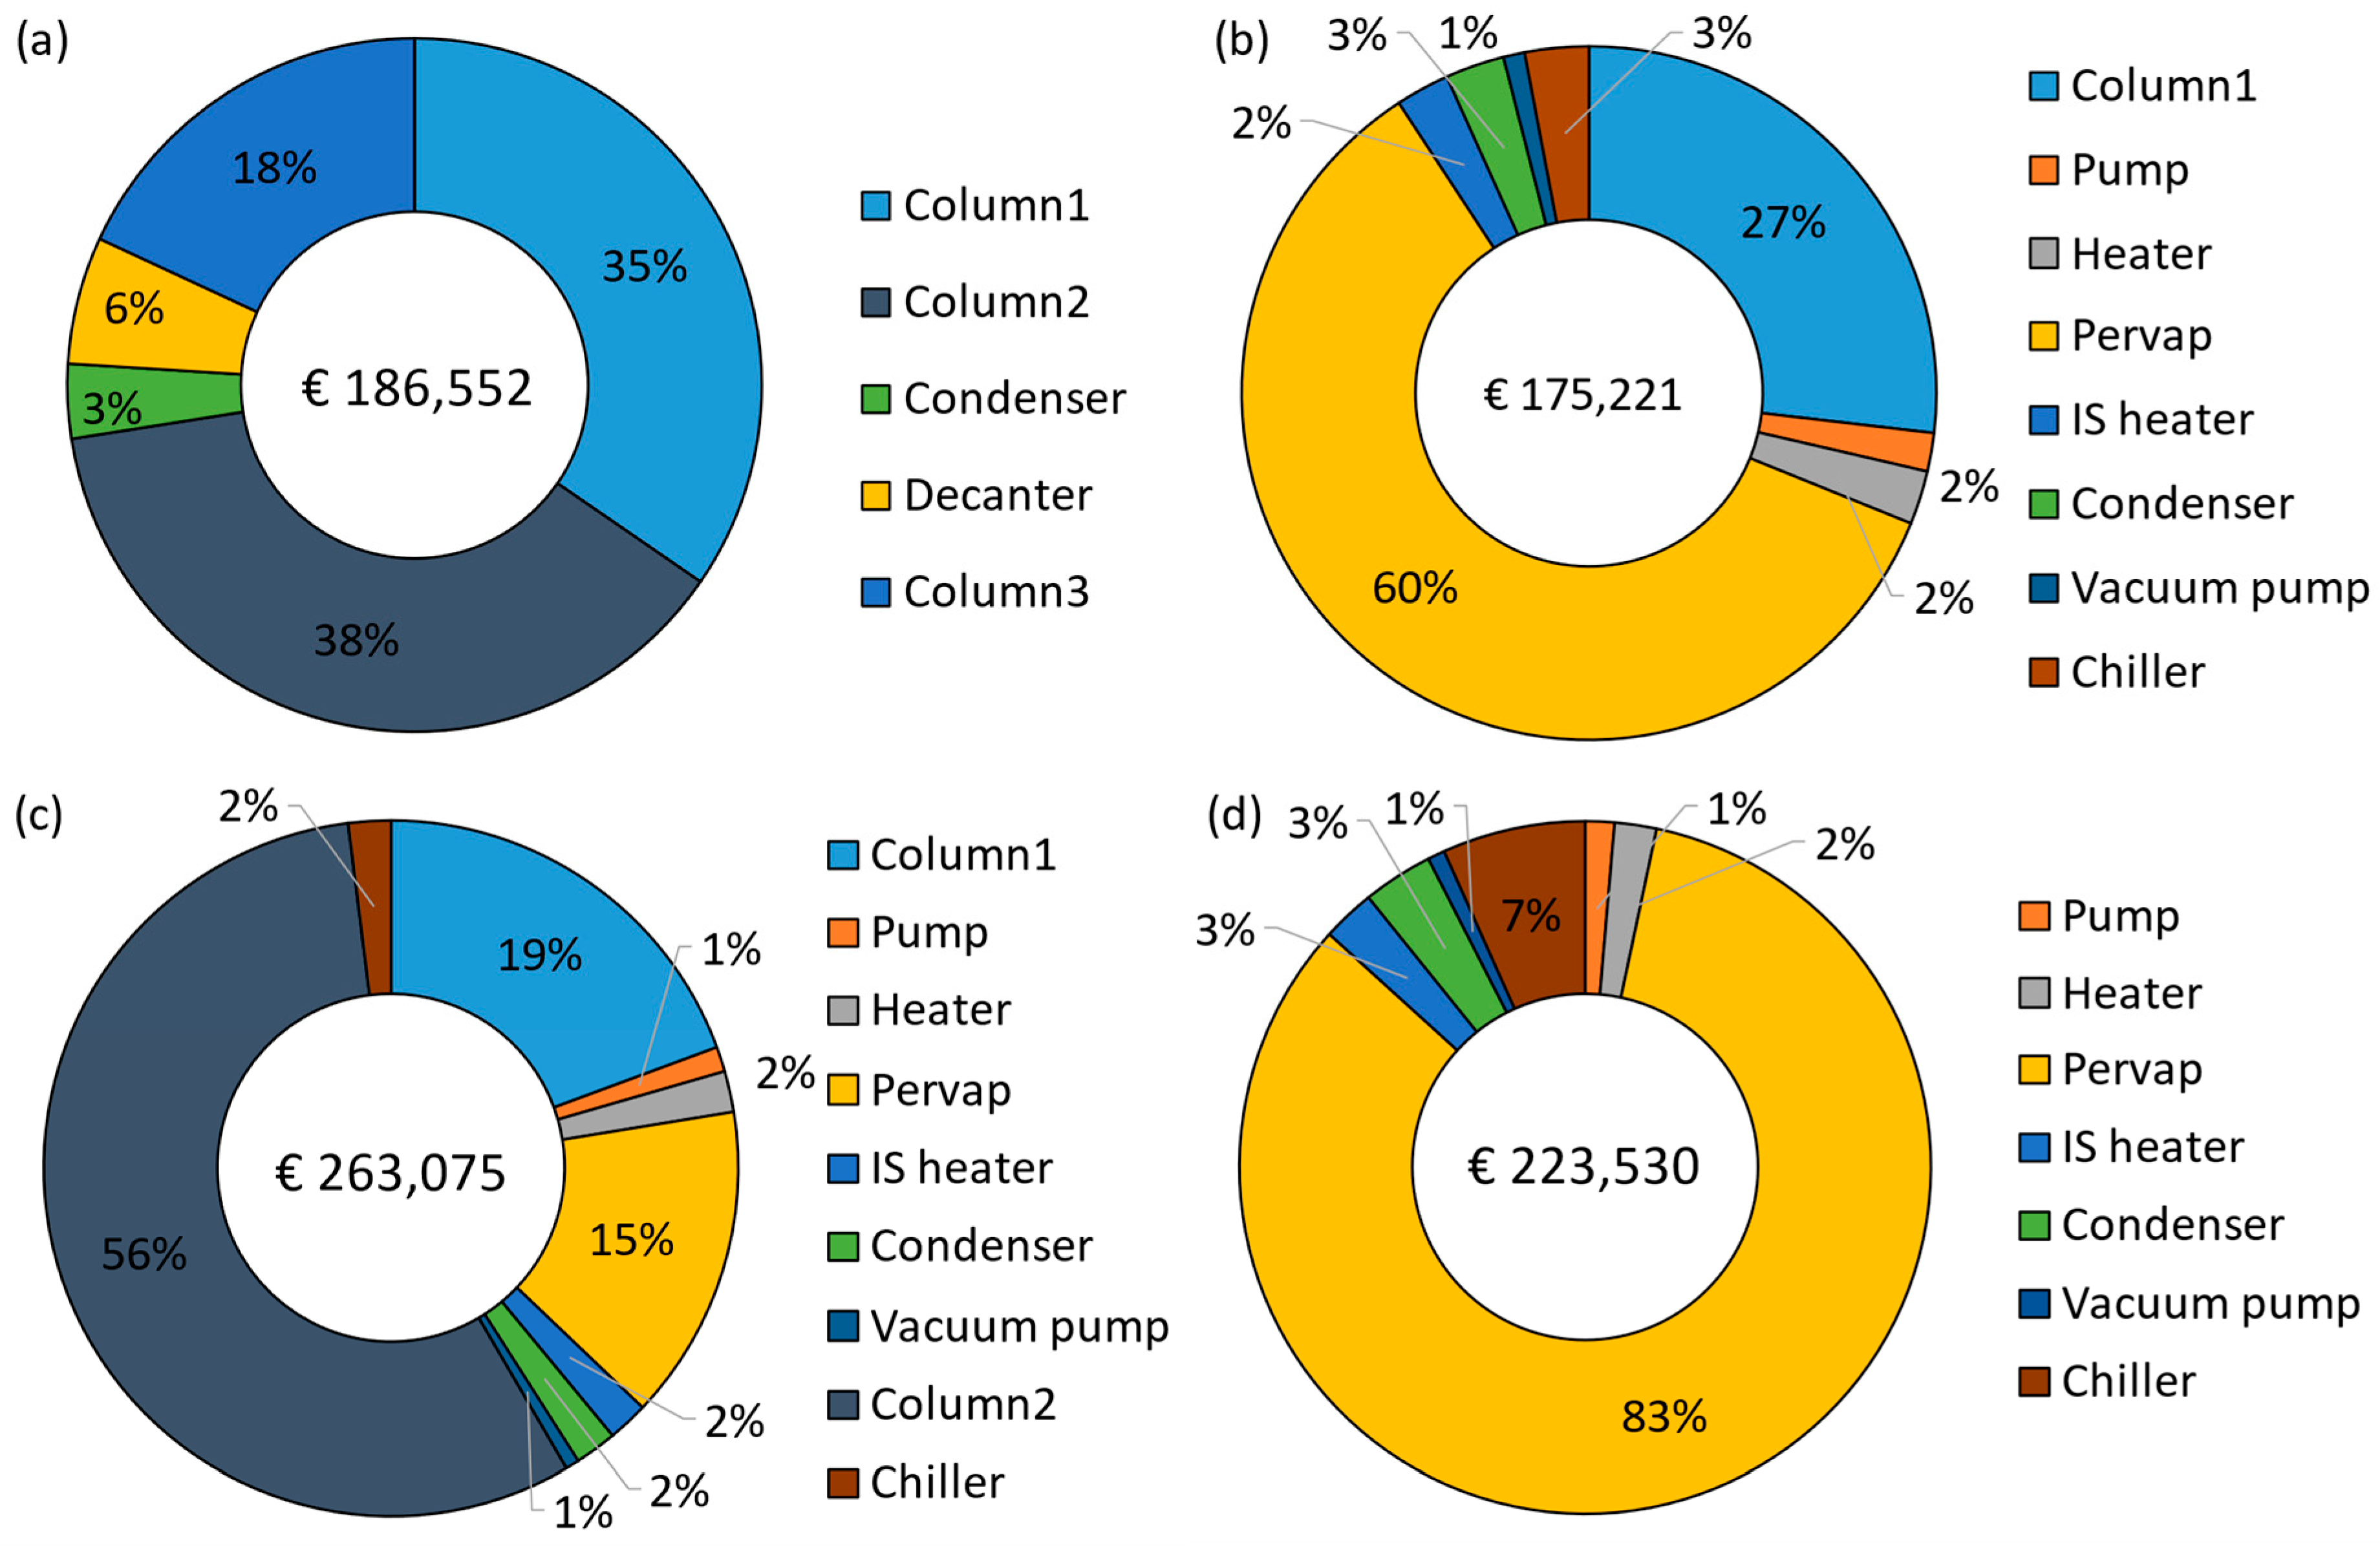
The annualized capital costs and their breakdown are shown in
Figure 8, with the equipment names corresponding to
Figure 2,
Figure 3,
Figure 4 and
Figure 5. The capital costs were estimated for the feed capacity of 1000 kg/h and included all equipment related to distillation and pervaporation units. It also includes the installation, off-site, design and engineering, and contingency costs. The distillation unit includes a tower, reboiler, condenser, overhead accumulator, and reflux pump, while the pervaporation unit includes a feed pump, heater, pervaporation modules including membranes, interstage heater, condenser, vacuum pump, and a chiller. The
IS heater in
Figure 8a–c refers to the interstage heater, which is not shown in the process flow diagrams. It is considered one big heater heating the entire permeate stream instead of smaller heaters after each module. The
Pervap in
Figure 8a–c consists of only the initial membrane costs, while the replacements were included in the operating costs.
The capital cost of the benchmark was € 186,552/yr, where the majority of the cost comes from distillation columns (91%), with column 2 (azeotropic) accounting for 38%, followed by column 1 at 35% and column 3 at 18%. The capital cost of the D-PV process stands at € 175,221/yr, about 6% less than the benchmark. About 60% of the cost comes from the pervaporation module, followed by 27% from column 1. The cost considered for the HybSi
® AR membranes is relatively high and thus results in capital costs close to the benchmark. This is different from Van Hoof et al. [
11], where comparatively cheaper Mitsui membranes were considered, which resulted in an almost 50% reduction in capital costs. The capital cost estimate for the D-PV-D process was 41% more expensive than the benchmark, while it was 33.4% more expensive than the D-PV process due to the contribution from the second column. About 56% is attributed to column 2 as it handles larger flows (874 kg/h) due to the top recycle stream (see
Table 3), followed by column 1 at 19%. The pervaporation module contributes only 15% due to lower membrane area requirements. In Van Hoof et al. [
11], unlike the current study, the D-PV-D process still had lower capital costs compared to the benchmark, probably due to the differences in the cost considerations. The standalone PV process has a capital cost of € 223,530/yr, which is 16.5% more than the benchmark. Compared to hybrid processes, the capital cost of the PV process is 21.6% more than the D-PV and 15% less than the D-PV-D. The capital cost is higher due to the cost of HybSi
® AR membranes, which account for 83% of the total capital cost, but still less than the contribution from distillation columns in the hybrid D-PV-D process. Furthermore, a big chiller was required in the PV process as it condenses a large permeate flow rate (499.4 kg/h).
Space requirements are sometimes critical in selecting or designing appropriate separation processes. The cost associated with the spatial footprint may have an additional impact on the total capital costs. However, due to limited information available on the space requirements, these costs were excluded from the assessment. The distillation columns require more space and large buildings, depending on the column diameter and height. They also require substantial space to accommodate the reboilers, condensers, piping, and supporting infrastructure such as pumps and control systems. The pervaporation systems are more compact compared to distillation columns and can be arranged in a smaller footprint. These systems require less vertical space, making them suitable for locations with height constraints. Furthermore, since they are modular, scaling and integration into existing systems is relatively easy. This is the reason why the capital cost scaling of pervaporation systems was assumed to be linear in the current assessment.
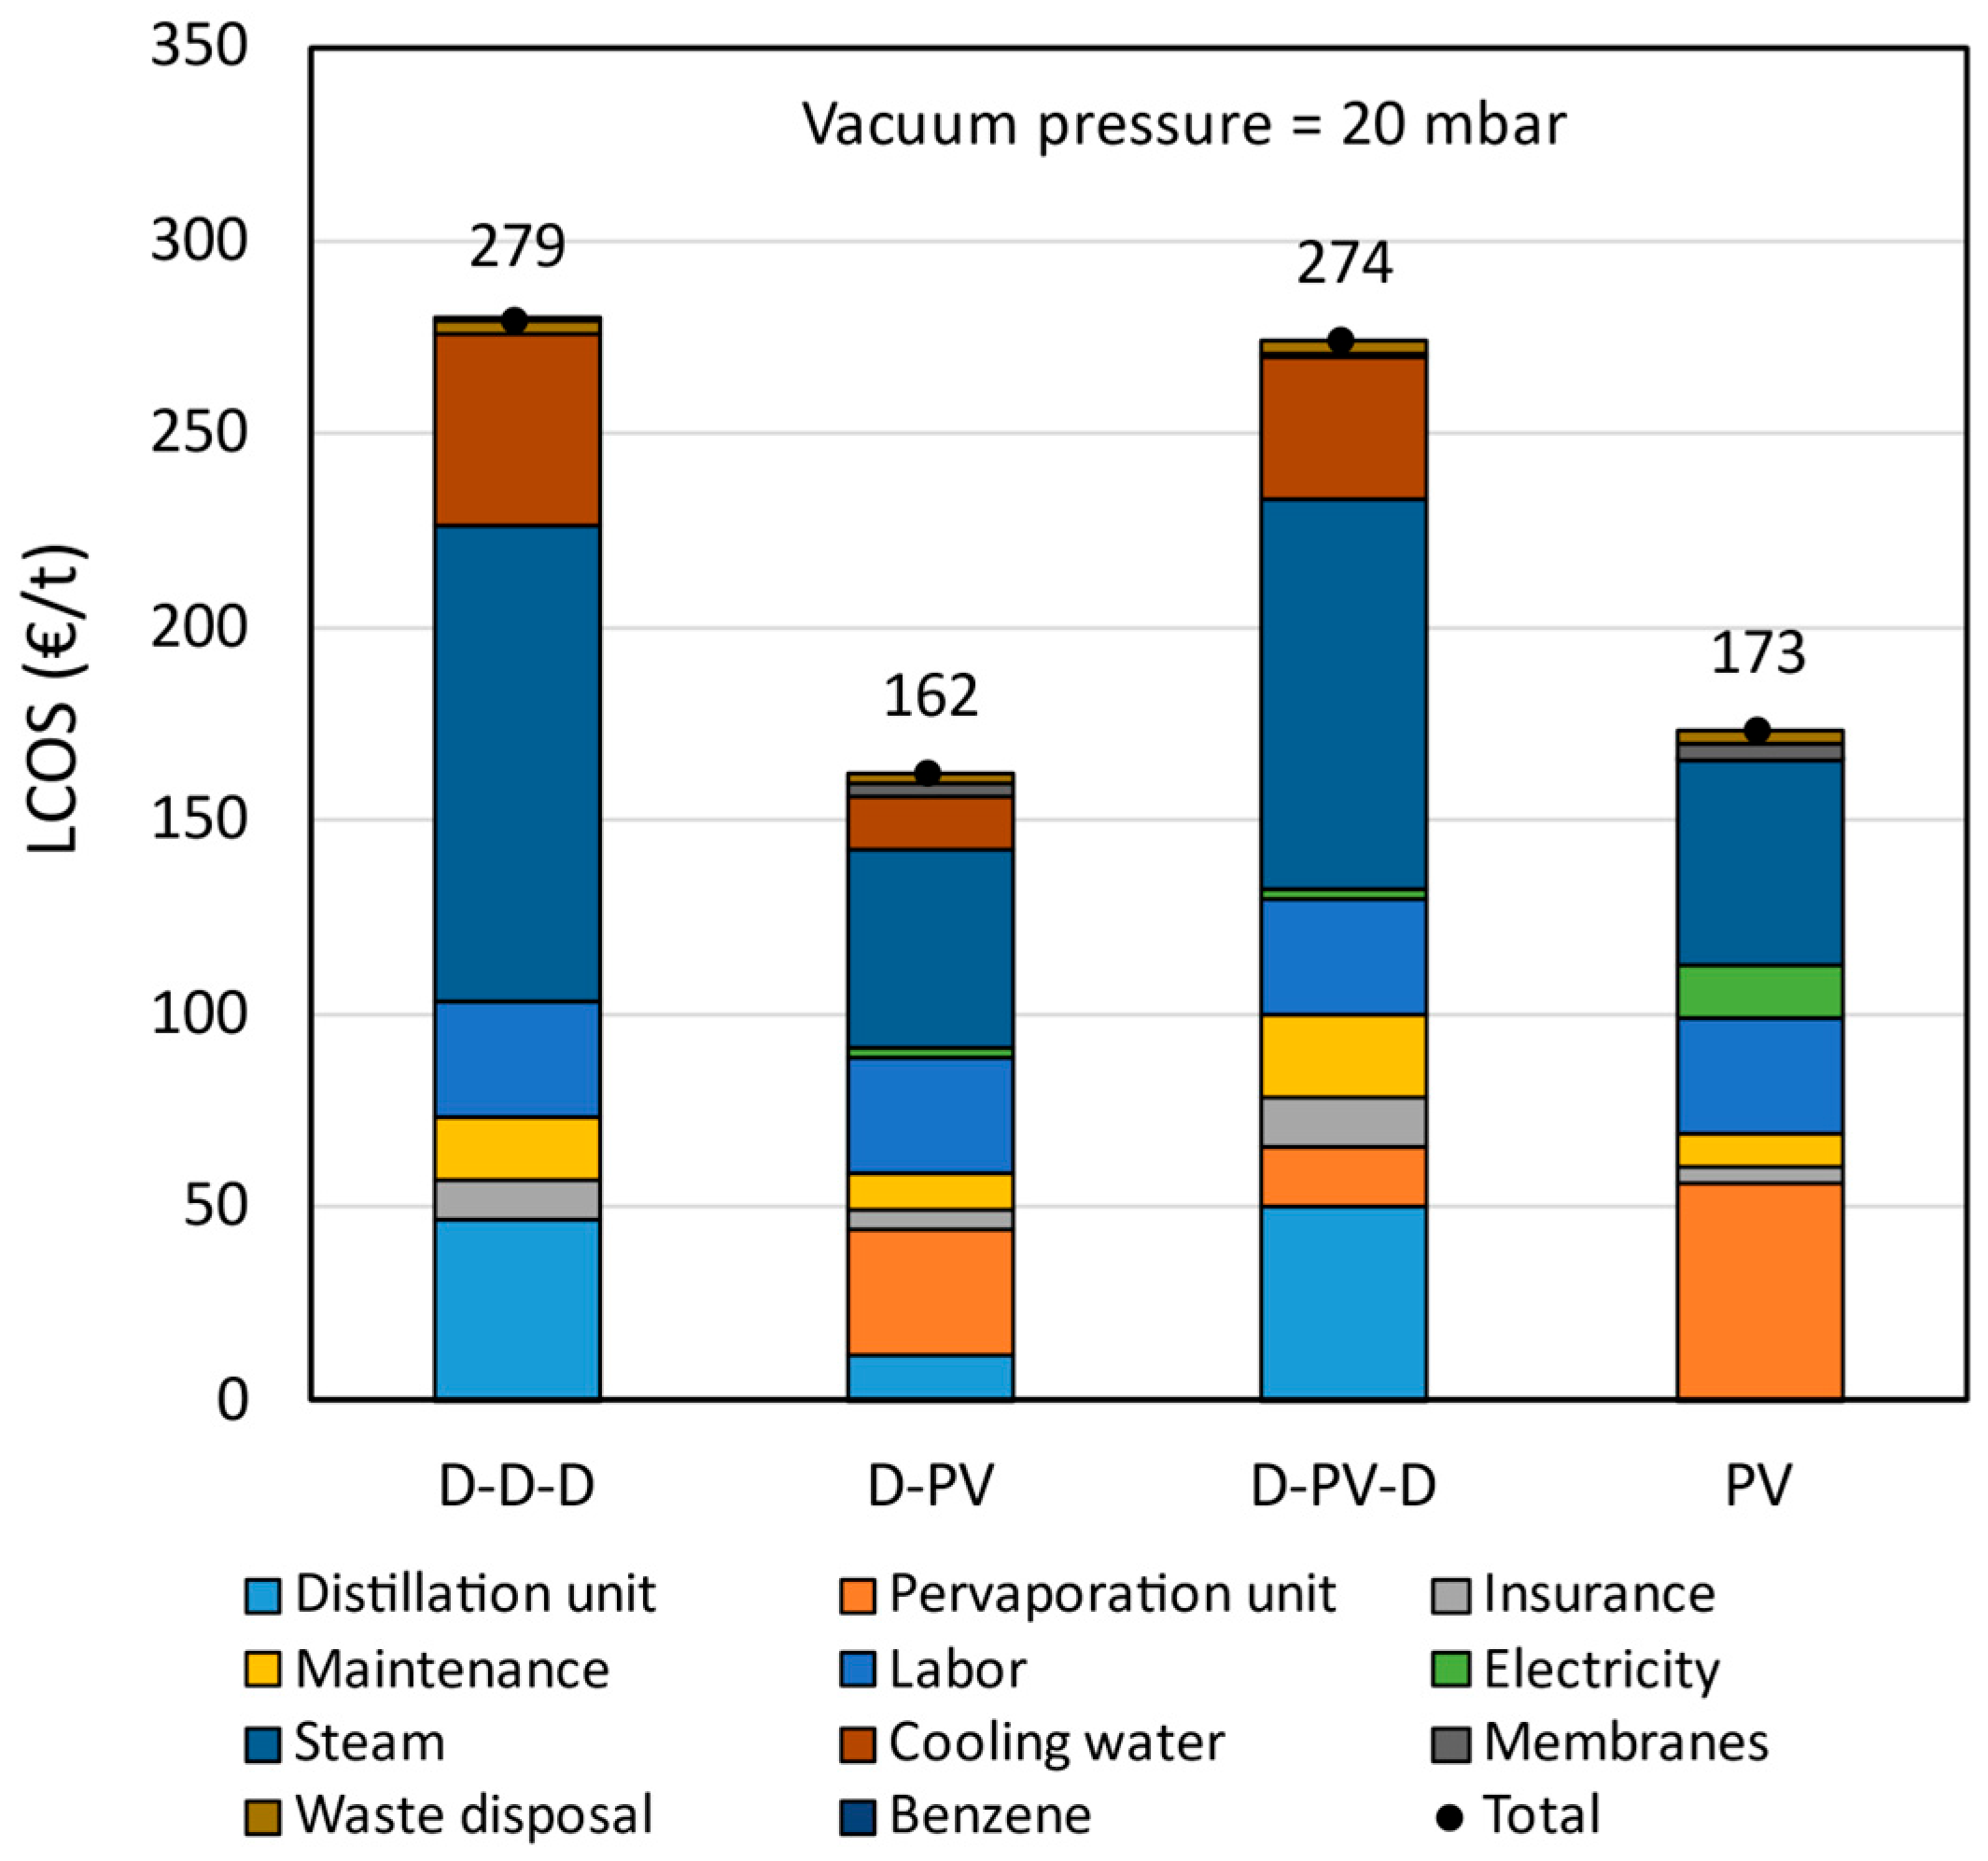
The LCOS breakdown of the pervaporation-based processes compared to the benchmark is shown in
Figure 9. The capital costs are represented by the distillation and pervaporation units, while all the other cost elements represent operating costs. The fixed operating costs (insurance and maintenance) are dependent on the capital costs, and hence, the higher the capital cost, the higher the fixed operating costs. The labor costs are the same in all cases, as it was assumed that two persons are required to operate and monitor the plants. The energy (steam and electricity) accounts for the largest share of the levelized costs. The cooling water costs are also significant in cases where more distillation columns are present, such as the benchmark, followed by D-PV-D and D-PV processes.
The LCOS calculated for the benchmark azeotropic distillation is € 279/t, which is 53.4% more than that reported by Van Hoof et al. [
11]. The current energy prices, equipment costs, and additional but essential cost elements, such as insurance, labor, waste disposal, etc., contributed to such an increase in LCOS. The hybrid D-PV process has an LCOS of € 162/t, which is 41.8% less than the benchmark. This is mainly due to a reduction in steam and cooling water consumption, and partly due to a reduction in capital costs. The LCOS of the hybrid D-PV-D process is € 274/t, almost the same as the benchmark. In this process, there is a reduction in operating costs by 10% due to lower steam and cooling water consumption. However, the presence of two distillation columns and a pervaporation unit increases the capital costs by 29% which is also reflected in fixed operating costs. For the standalone PV process, the LCOS is € 106/t (or 37.8%) lower than the benchmark. It only consists of the pervaporation unit, and due to large membrane area requirements, the capital costs are 17% higher than the benchmark. However, there is a significant reduction in steam and cooling water consumption, resulting in lower LCOS. Based on the LCOS, the hybrid D-PV and standalone PV are better options for a greenfield plant and better alternatives for an azeotropic distillation plant.
If the distillation columns are already available, then the D-PV process would be better suited since the existing distillation column can be reused after modifications, and the pervaporation unit can be retrofitted without any difficulty. In this case, the LCOS would be € 144/t (after removing column capital cost) as opposed to € 162/t when all the equipment is accounted for. On the contrary, if a new installation is being planned, then the standalone PV is the better option since it requires less space and is well-suited to be a greenfield plant. The D-PV-D process is useful when retrofitting an existing distillation plant (brownfield) where the columns can be repurposed to the required specifications. Only a smaller pervaporation unit is required as a replacement for the azeotropic column (column 2) of the benchmark. Here, the LCOS would be € 196/t when the capital cost of two columns is excluded.
Significance analysis was conducted by comparing key performance metrics across configurations, with maximum percentage differences calculated to highlight meaningful gaps. As shown in
Table S14, LCOS varied by up to 69% and CO
2 emissions by 489%, indicating substantial differences in economic and environmental performance.
3.4. Sensitivity Analysis
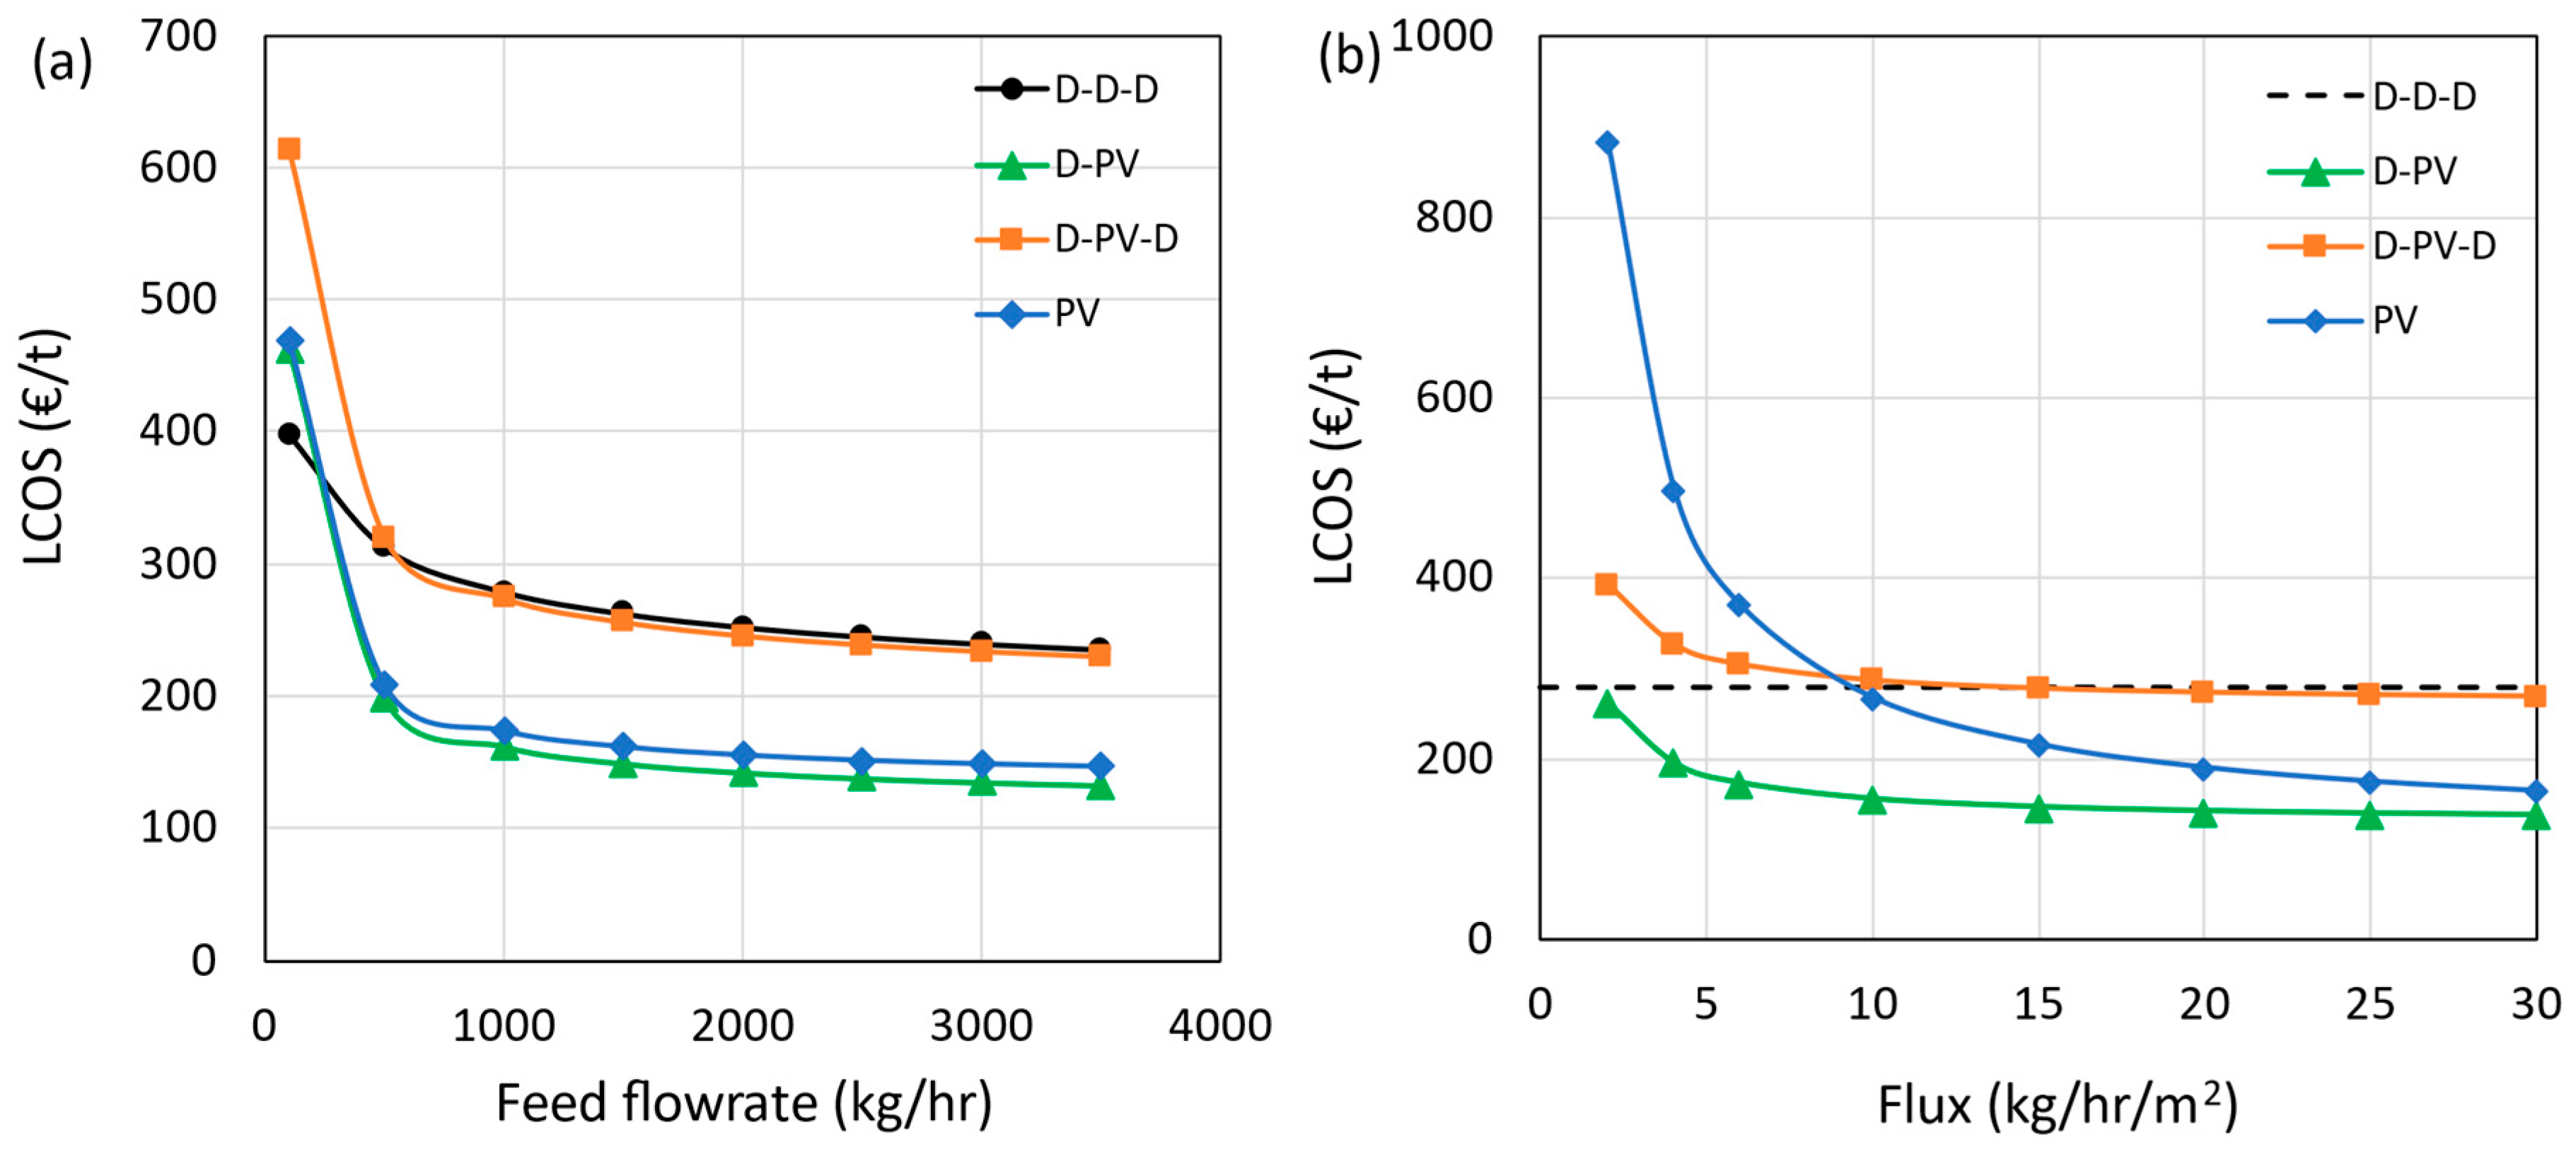
The sensitivity of the LCOS to two key technical and four key economic parameters is presented in this section. The results are presented only for greenfield plants, and no retrofitting or use of existing distillation columns was considered. The technical parameters selected are the feed flow rate (kg/h), representing the plant capacity to separate IPA and water, and the average water flux (kg/h/m
2), representing the removal of water as a permeate per unit time and membrane area. The economic parameters selected are the membrane module price (% increase or decrease), membrane life (yr), steam (€/t), and cooling water prices (€/m
3). The feed flow rate was varied from 100 to 3500 kg/h, with 1000 kg/h as the base value, and the results are presented in
Figure 10a. Generally, the higher the feed flow rate, the lower the LCOS due to economies of scale. However, beyond 3000 kg/h, the effect of economies of scale diminishes for all cases. It is important to note that the pervaporation modules are assumed as modular and were scaled linearly. The hybrid D-PV and standalone PV processes perform better than the benchmark at all feed flow rates, indicating the cost advantage of having larger pervaporation units. On the contrary, the D-PV-D process with a smaller pervaporation unit has a similar LCOS as the benchmark. However, this trend changes at lower flow rates, as shown in the figure. At a flow rate of 100 kg/h, the benchmark case performs better than the hybrid D-PV and PV processes, followed by the D-PV-D. However, at such flow rates, operating a distillation column may pose challenges such as heat losses due to a high surface area to volume ratio, control and stability issues, etc. Therefore, a standalone PV is the best option at low flow rates. Scaling up from a lab-scale membrane to industrial-scale modules introduces several technical challenges. The key issues include maintaining uniform flux and membrane integrity over larger areas, ensuring equal flow distribution and manageable pressure drops across modules, and implementing effective interstage heat recovery. Long-term membrane stability, fouling control, and sustaining low vacuum over large permeate volumes are also critical. While HybSi
® AR membranes benefit from modular scalability, industrial packaging formats (e.g., spiral-wound, multi-channel ceramics) may influence transport performance. These considerations are essential for future pilot-scale implementation.
Figure 10b shows the sensitivity results when the average permeate flux was varied from 2 to 30 kg/h∙m
2 with different base values for different processes (see
Table 9). As no membranes are involved in azeotropic distillation, the LCOS is shown as a dotted line in the figure. The flux values were used to calculate the required membrane area, which is reflected in the capital and operating costs. The D-PV process has the cost advantage at all considered flux values, whereas the D-PV-D process shows no benefit even at higher flux values. The processes with a higher membrane area requirement are more sensitive to flux values, which is evident from the standalone PV results. The LCOS crosses the benchmark limit at a flux below 10 kg/h∙m
2, indicating the advantage of membranes with a high permeate flux. The fluxes reported by Van Hoof et al., especially for Mitsui membranes, were below 5 kg/h∙m
2. Using this flux value and an assumed current price of €10,000/m
2, only the D-PV case emerged as the better option with an LCOS of € 155/t (D-PV-D = € 287/t and PV = € 263/t). Furthermore, the spatial footprint is also based on the required membrane area, which is, in turn, dependent on membrane flux. Higher fluxes are desired to have a compact pervaporation unit, resulting in a reduction in LCOS.
The impact of the membrane module price on the LCOS is shown in
Figure 11a, in which the membrane module price is varied from 20% to 160% of the base value. The effect of price is more pronounced in processes with larger membrane area requirements (D-PV and PV). The results show that the standalone PV process becomes more expensive than the D-PV process at a 60% or more reduction in membrane price. At this point, the plant could be modified to a D-PV process by retrofitting it with a distillation column. For the D-PV-D process, the LCOS was reduced by just 5% even when the membrane module price was reduced by 80%.
The membrane lifetime was varied from 1 to 10 years with a base value of 5 years, and the effect on LCOS is shown in
Figure 11b. The HybSi
® AR membranes were reported to perform well even after 3 years when tested at a temperature of 150 °C [
45]. Considering the lower operating temperature of 130 °C in the current study and with proper maintenance, the membrane lifetime could extend beyond 5 years, which has been corroborated by the experts at Pervatech. The hybrid D-PV process performs better even at a very low membrane lifetime of 1 year, while the standalone PV process needs membranes with a lifetime longer than 1.5 years for it to be competitive with the benchmark. At a hypothetical membrane lifetime of 10 years, both D-PV and PV processes converged to a common LCOS. Having a longer membrane lifetime does not have a significant impact on the LCOS of the D-PV-D process due to the lower contribution from the pervaporation membrane costs.
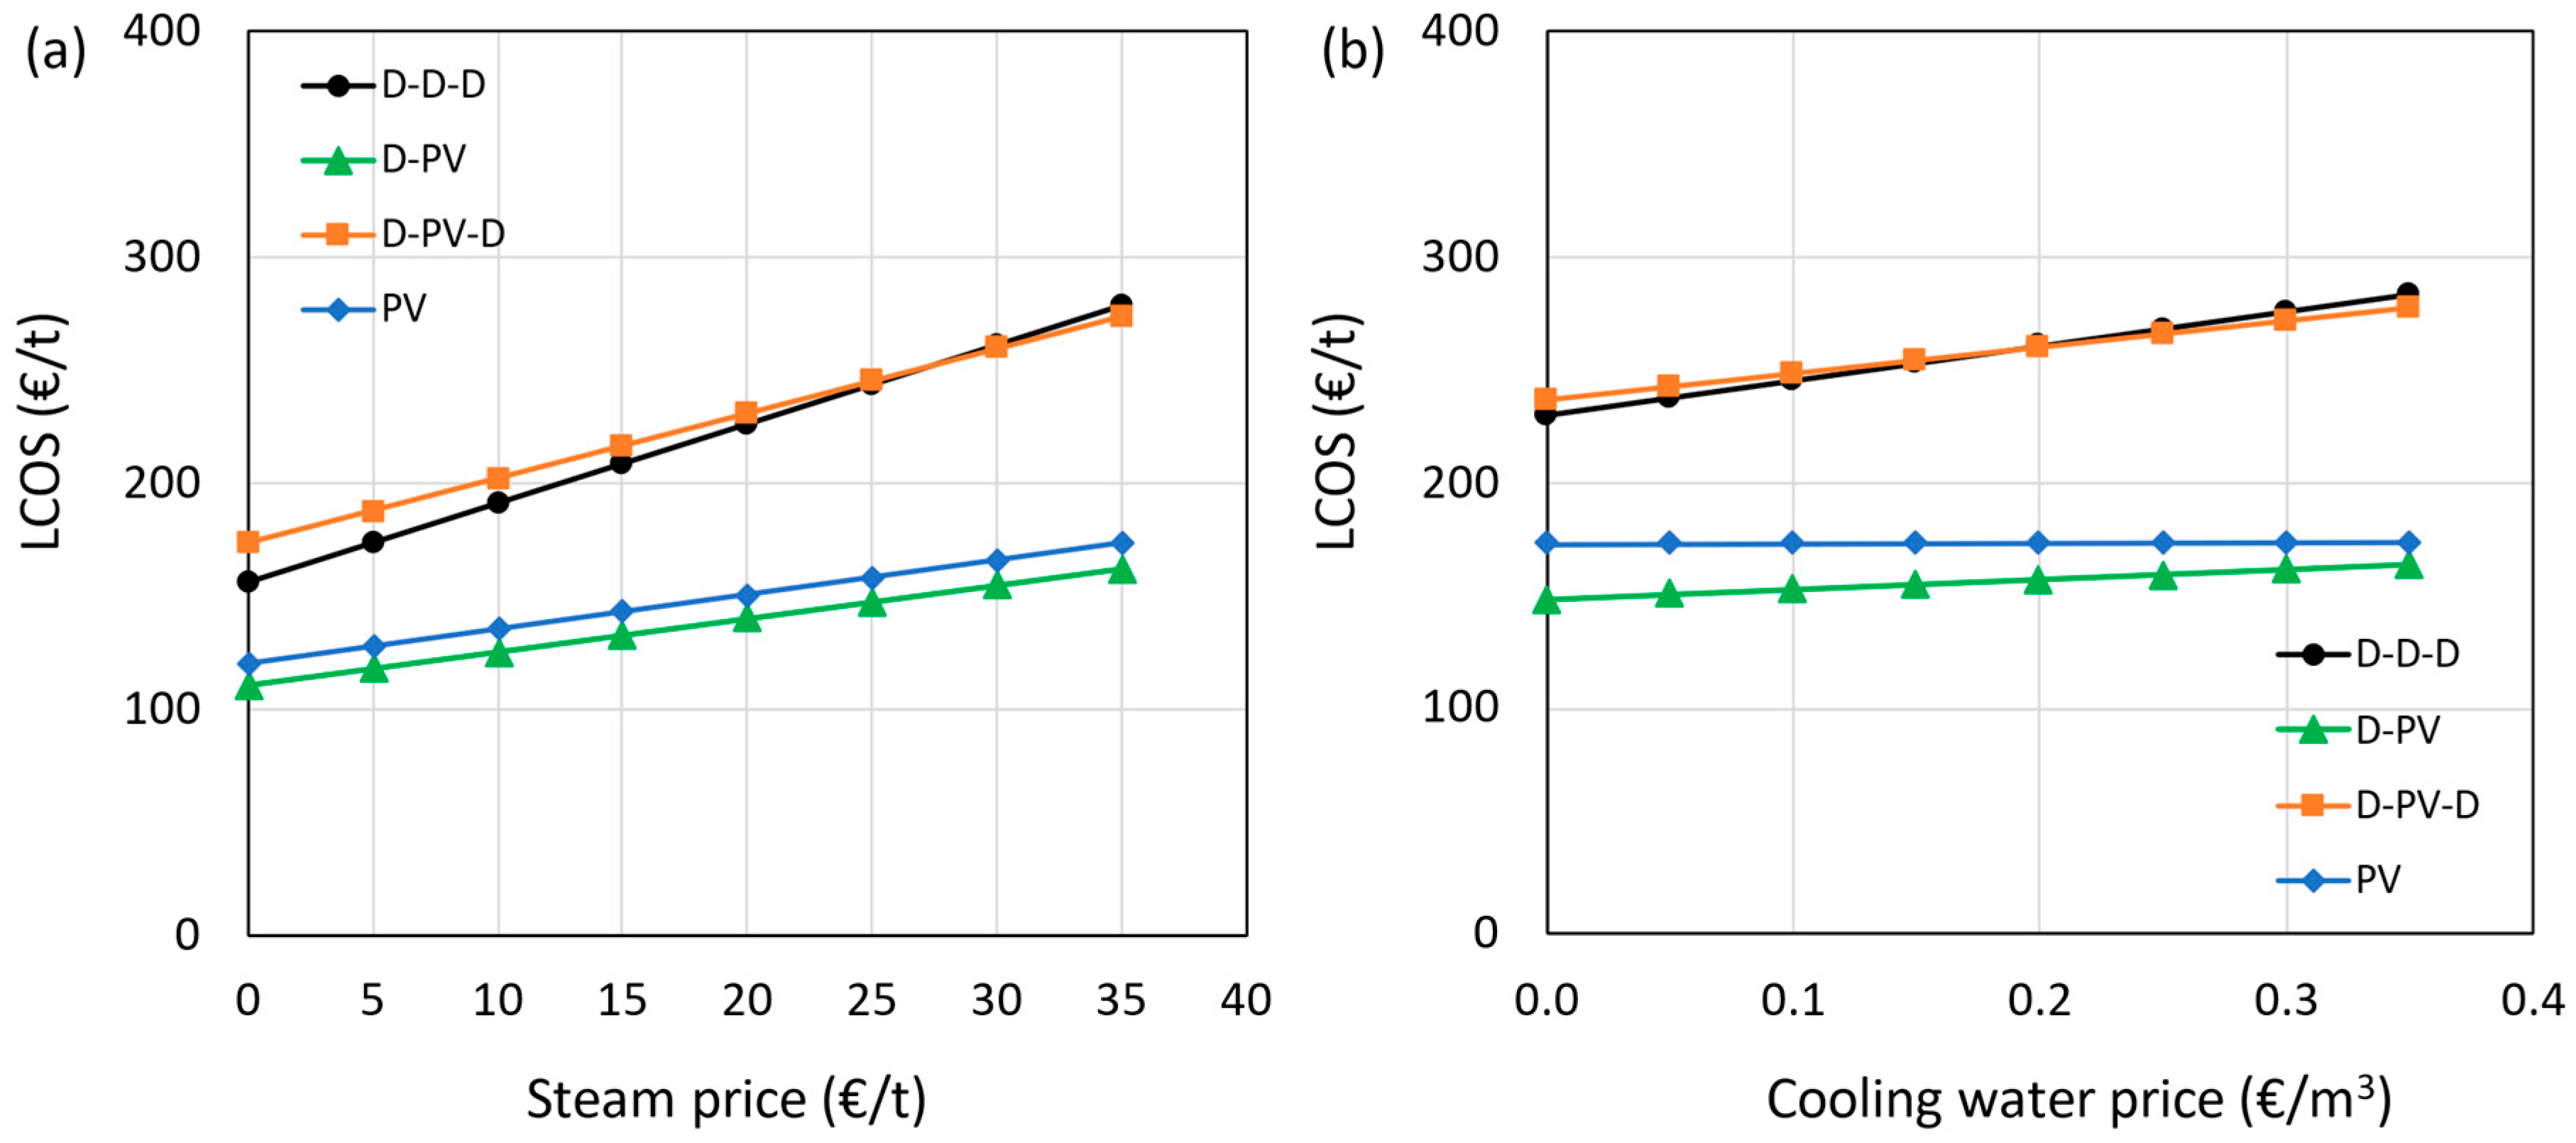
The effect of steam and cooling water prices on the LCOS is shown in
Figure 12a,b, respectively. The steam was assumed to be produced by a gas-fired boiler and is dependent on the natural gas (NG) market price, which is highly uncertain. The distillation-heavy configurations (e.g., D–PV, D–PV–D) are more affected by natural gas price fluctuations due to higher reboiler duty. In contrast, membrane-dominant systems like PV only exhibit greater resilience due to their lower heat requirement. Therefore, adopting processes that run more on electricity and less on thermal energy is desired, which is evident from the results shown in the figure. The hybrid D-PV and standalone PV processes are less sensitive to steam and cooling water prices due to their lower consumption. The cases with two or more distillation columns, such as the benchmark D-D-D and the hybrid D-PV-D processes, consume more steam and cooling water, and are thus more sensitive to their prices. Even considering zero cost for steam, such as in the case of utilizing waste heat, the hybrid D-PV and standalone PV show lower LCOS than the benchmark.
3.5. Environmental Performance
The annual CO
2 emissions, emission intensity, and
COPCO index for all cases are shown in
Table 11. The benchmark D-D-D has the highest CO
2 emissions, followed by hybrid D-PV-D (22.5% less) and D-PV (67.5% less) processes. The lowest CO
2 emissions were from standalone PV, which were 86% less than the benchmark due to a relatively lower energy consumption. The benchmark process emits 6.8 t-CO
2/t-IPA, whereas the standalone PV has the lowest emission intensity of 0.9 t-CO
2/t-IPA. If retrofitting of existing distillation columns is considered, then the hybrid D-PV process is the best option compared to the hybrid D-PV-D. The optimal choice among the three pervaporation-based processes becomes clearer when the environmental performance is combined with the cost reductions using the
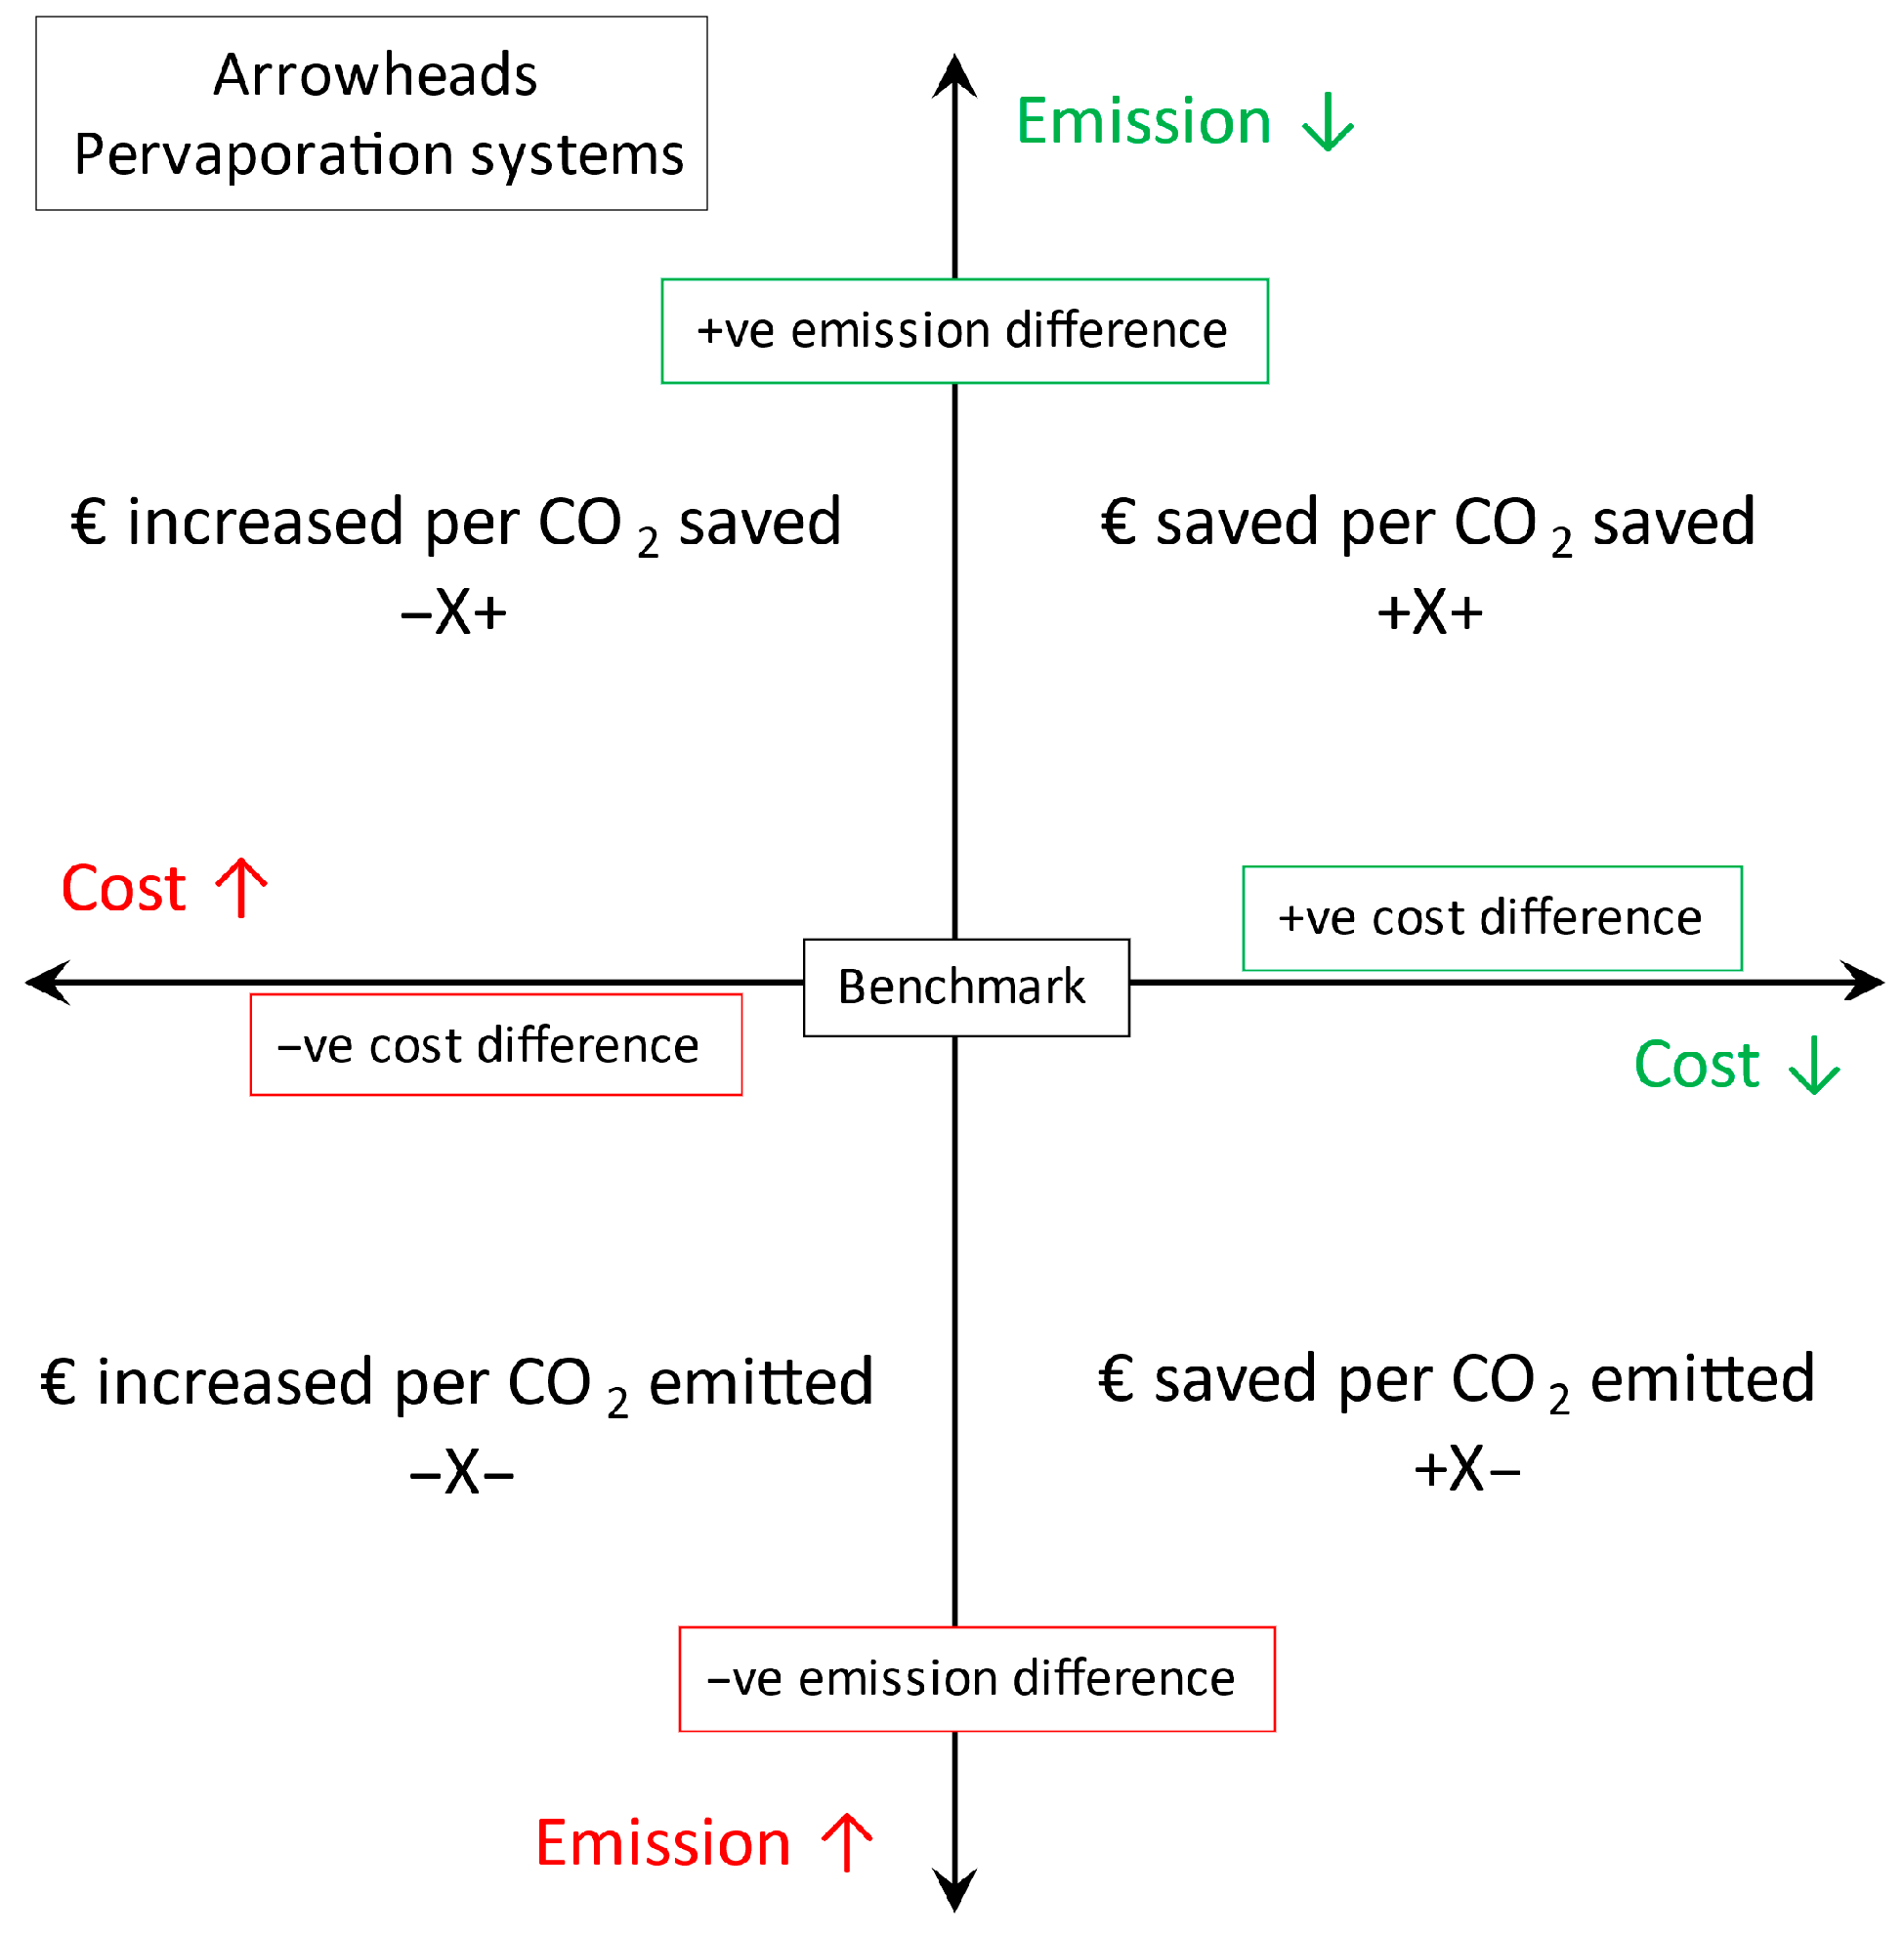
COPCO index. According to the convention discussed in
Section 2.5, all three processes result in savings in both expenses and CO
2 emissions. The processes D-PV, D-PV-D, and PV save € 25, € 3, and € 18, respectively, for every tonne of CO
2 saved. The hybrid D-PV process is the best option both as a greenfield plant and as a retrofit.
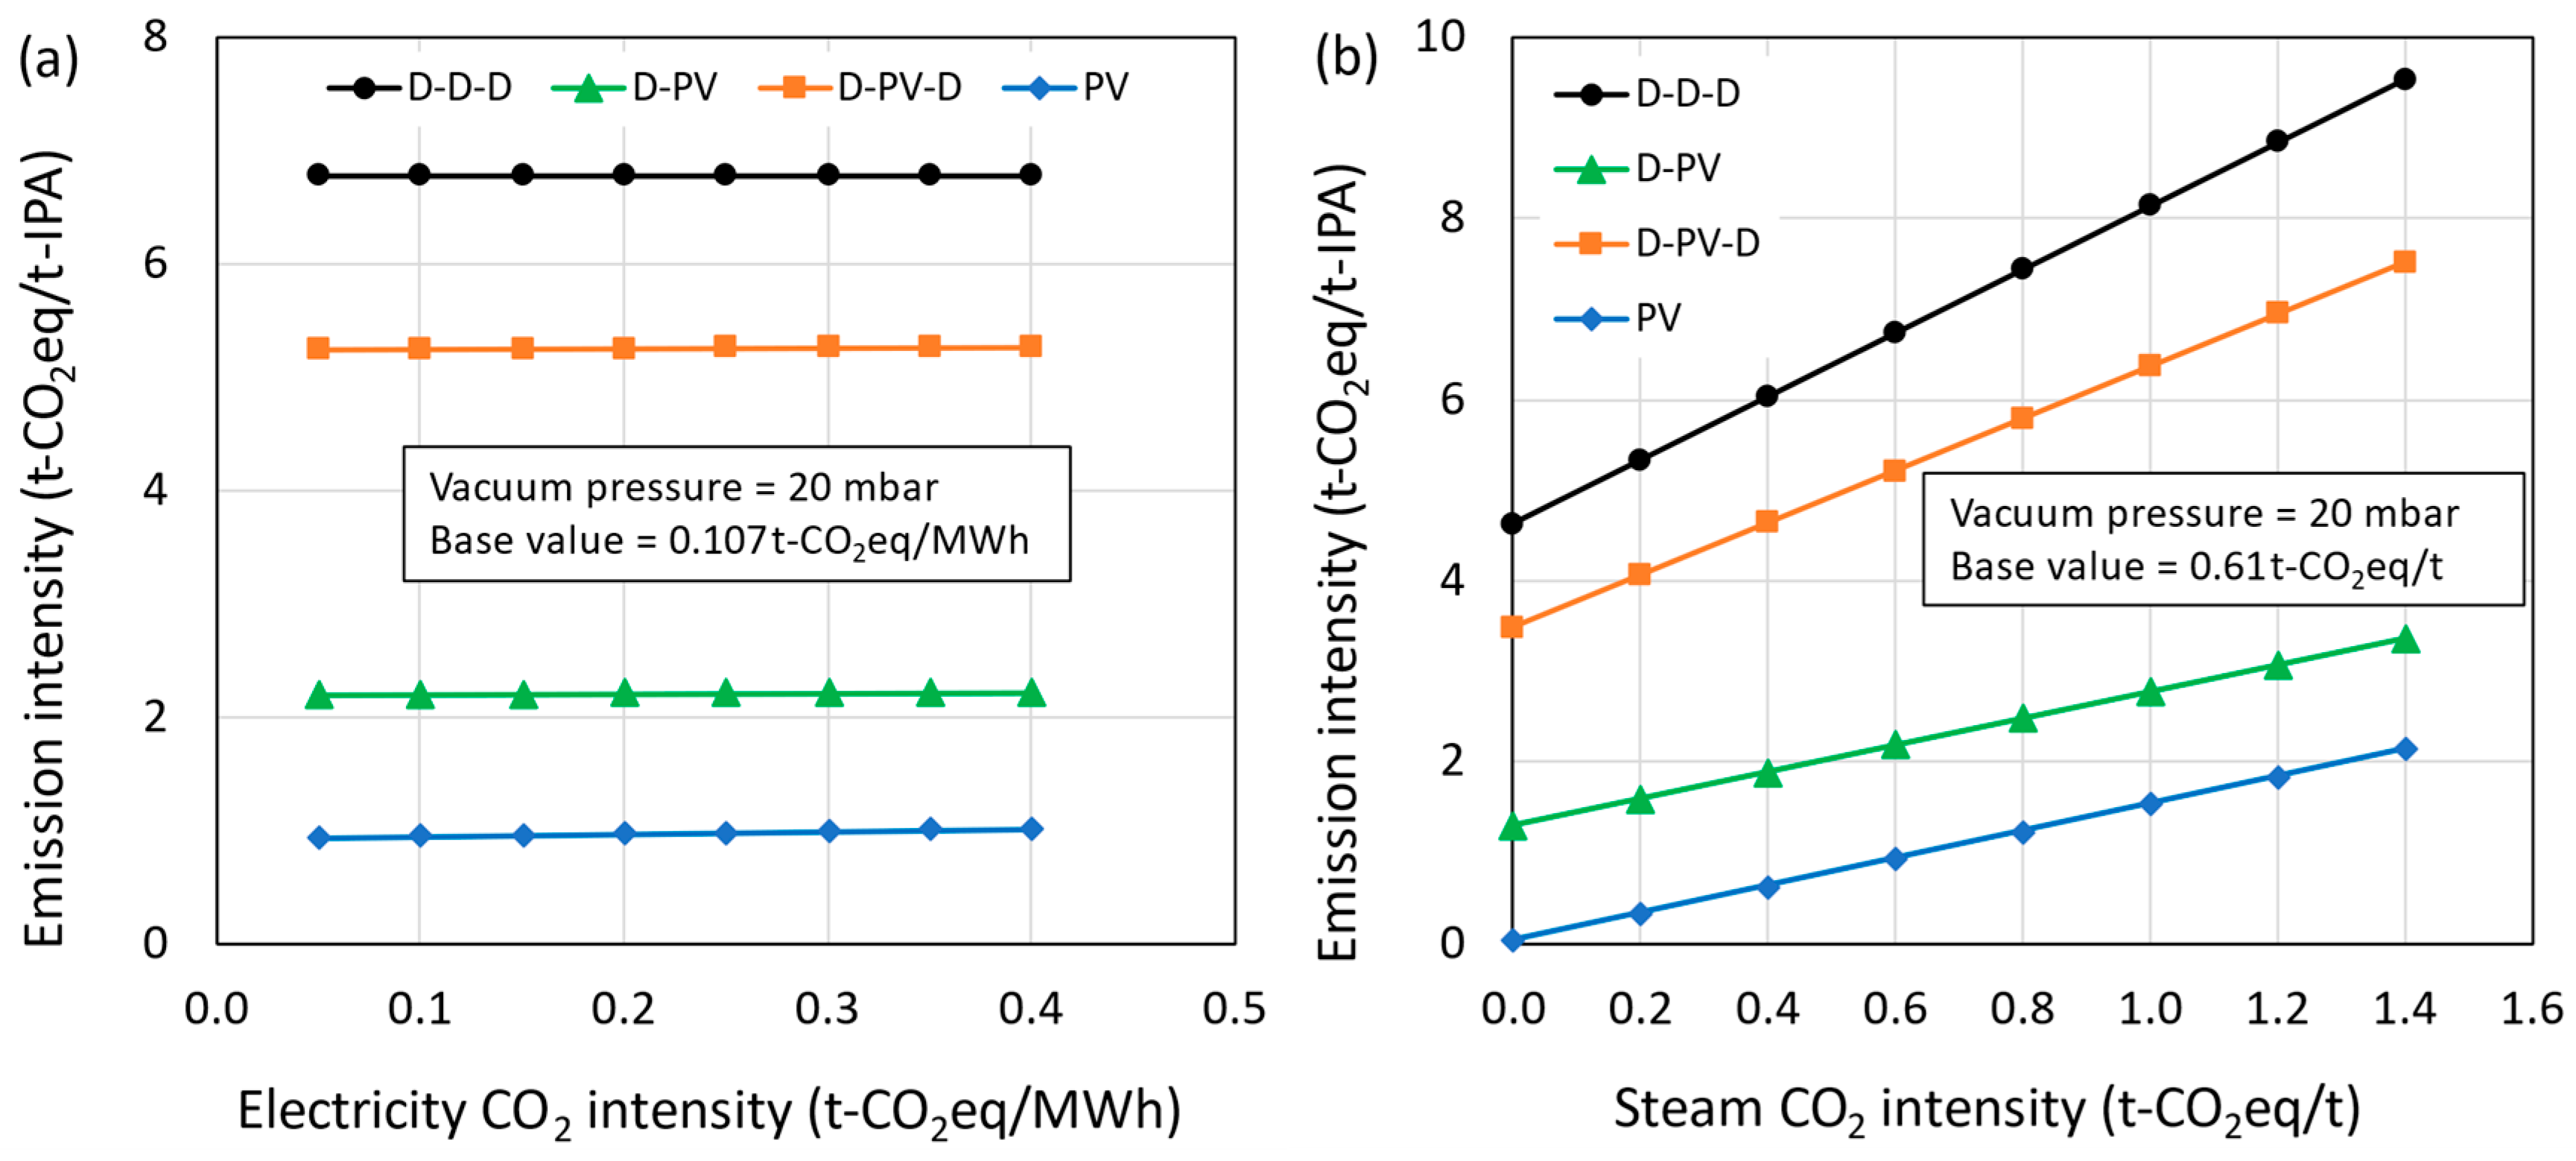
Considering the uncertainty in the CO
2 emission intensities of electricity and steam based on location and energy mix, a sensitivity analysis was performed, and their effect on CO
2 emissions is presented in
Figure 13a,b, respectively. The results show that the effect of CO
2 intensity of electricity is negligible on the overall CO
2 emissions, as the contribution from electricity is very small (D-D-D = 0%; D-PV = 0.2%; D-PV-D = 0.1%; PV = 2.5%). The majority of energy requirement was fulfilled by steam, having a significant effect on the overall CO
2 emissions and representing 32%, 41%, 33%, and 97% share of total CO
2 emissions in D-D-D, D-PV, D-PV-D, and PV processes, respectively. The rest of the emissions were from cooling water usage. Different fuels such as natural gas, coal, biogas, etc., can be used to generate steam. More often, natural gas is used as a fuel since it is cleaner than other fossil fuels. The natural gas composition, plant location, and boiler efficiency may differ and affect the CO
2 emission intensity significantly. Also, when waste heat is recovered and utilized for steam generation, the emission intensity could be different.
3.6. Impact of Vacuum Pressure and Feed Water Content
Table 12 presents how different operating conditions and processes affect the performance of the pervaporation systems. The effect of higher vacuum pressure (50 mbar) was investigated for all pervaporation-based systems, while the feed water content (15 wt.% to 30 wt.%) was tested only for the hybrid D-PV process. Here, the feed water content is associated with the pervaporation system, which is the same as the top stream water content of column 1 in the hybrid D-PV and D-PV-D processes. The permeate saturation temperature in the condenser was 32 °C at 50 mbar, indicating the feasibility of using cooling water instead of a chiller. The results obtained at 50 mbar can be compared with the results obtained at 20 mbar using
Table 10,
Figure 9, and
Table 11. At higher vacuum pressures, the required membrane area increases due to a decrease in average flux. This, in turn, is due to a decrease in the driving force, which is the difference in partial vapor pressures across the membrane. A larger membrane area would increase the capital and operating cost of the pervaporation unit. Similarly, the permeate quality (selectivity) also decreases (see
Table 9), which is also reflected in the recovery efficiencies. The electricity consumption was significantly lower due to the use of cooling water instead of a chiller, while the steam consumption remained almost the same at 50 mbar (see
Table S10). There is also a slight reduction in product output due to relatively more IPA losses in the permeate. However, the significant reductions in electricity consumption due to the omission of a chiller improve the energy intensities at 50 mbar. Lowering permeate pressure to 20 mbar enhances selectivity and flux but increases cooling energy. Operating at 50 mbar allows for passive condensation but reduces separation efficiency.
When LCOS is compared, there is an increase of 8.4%, 0.5%, and 8.7% for D-PV, D-PV-D, and PV processes, respectively. The breakdown of LCOS is shown in
Figure S1 of the Supplementary Material. The increase was primarily due to the high cost of the pervaporation unit, caused by the need for a larger membrane area due to lower flux at 50 mbar. The reduction in electricity consumption did not positively impact the LCOS. The emission intensities were higher than at 20 mbar pressure because of increased cooling water consumption, which is the main driver of emissions. Another advantage of having 50 mbar vacuum pressure is the reduction in spatial footprint associated with a chiller, which was not considered in the current assessment. The
COPCO index shows that all the processes still save money per tonne of CO
2 saved, where D-PV emerged as the best option again.
The impact of varying the feed water content in the D-PV process was investigated, and the results obtained are shown in
Table 12. An increase in feed water content results in an increase in average water flux (see
Table 9). Due to an increase in the flow rate to the pervaporation system, several changes were observed. The required membrane area increased slightly, and electricity consumption by the feed pump, chiller, and vacuum pump also increased. Additionally, steam consumption in the feed and interstage heating increased, leading to higher energy intensity. The capital cost of the distillation unit went up due to the need for a larger column to obtain more water at the top. The capital cost of the pervaporation unit also increased. Consequently, both capital and operating costs increased, resulting in a higher LCOS. Increased steam and cooling water consumption led to higher emission intensity, ultimately resulting in a decrease in the
COPCO index. It is evident from the results that the feed water content should be close to the azeotropic point for a process to be the best option economically and environmentally.
4. Conclusions
This study presents the first combined techno-economic and environmental analysis of IPA dehydration using HybSi® membranes across three configurations. A new cost-efficiency metric, COPCO, is introduced, alongside updated modeling under 2024 market conditions. These processes showed a substantial reduction in the levelized cost of separation and CO2 emissions when compared to traditional azeotropic distillation. For the pervaporation processes, HybSi® AR membranes were used, which showed exceptional solvent recovery and selectivity. The hybrid distillation-pervaporation (D-PV) process with just one distillation column achieved the highest cost reduction of 42% along with a CO2 emission reduction of 68%. This was followed by the standalone pervaporation (PV), which showed a cost reduction of 38% and a CO2 emission reduction of 86%. The hybrid distillation-pervaporation-distillation (D-PV-D) process, combining pervaporation with two distillation columns, showed minor savings in cost (<2%) while the savings in CO2 emissions were 22%. The COPCO analysis revealed that the D–PV configuration offers the highest cost-efficiency among the evaluated systems, outperforming PV-only and D-PV-D configurations by effectively balancing membrane cost, energy demand, and recovery performance. The hybrid D-PV process emerged as the best alternative to the azeotropic distillation process, offering several technical, economic, and environmental advantages. The cost savings are substantial when compared to purchasing virgin IPA at the market price of € 1730 per tonne. The sensitivity analysis showed that lowering permeate pressure to 20 mbar enhances selectivity and flux but increases cooling energy. Operating at 50 mbar allows for passive condensation but reduces separation efficiency. The results of this study are expected to address the need to replace, debottleneck, or intensify traditional distillation-based processes for solvent recovery within the chemical, pharmaceutical, and related industries. Preliminary data suggest that HybSi® membranes also hold promise for other solvent mixtures such as tetrahydrofuran–water, acetonitrile–water, etc., with ongoing studies focused on optimizing conditions. Results will be reported in future work. Expanding the use of pervaporation in these markets will benefit both these industries and society by reducing energy consumption and, consequently, lowering the industry’s carbon footprint.


 ,
, 
