

Inducing Deep Sweeps and Vortex Ejections on Patterned Membrane Surfaces to Mitigate Surface Fouling


Abstract
1. Introduction
1.1. Challenges to Membrane Operation
1.2. Hydrodynamic Solutions
1.2.1. Manipulation of the Feed Flow
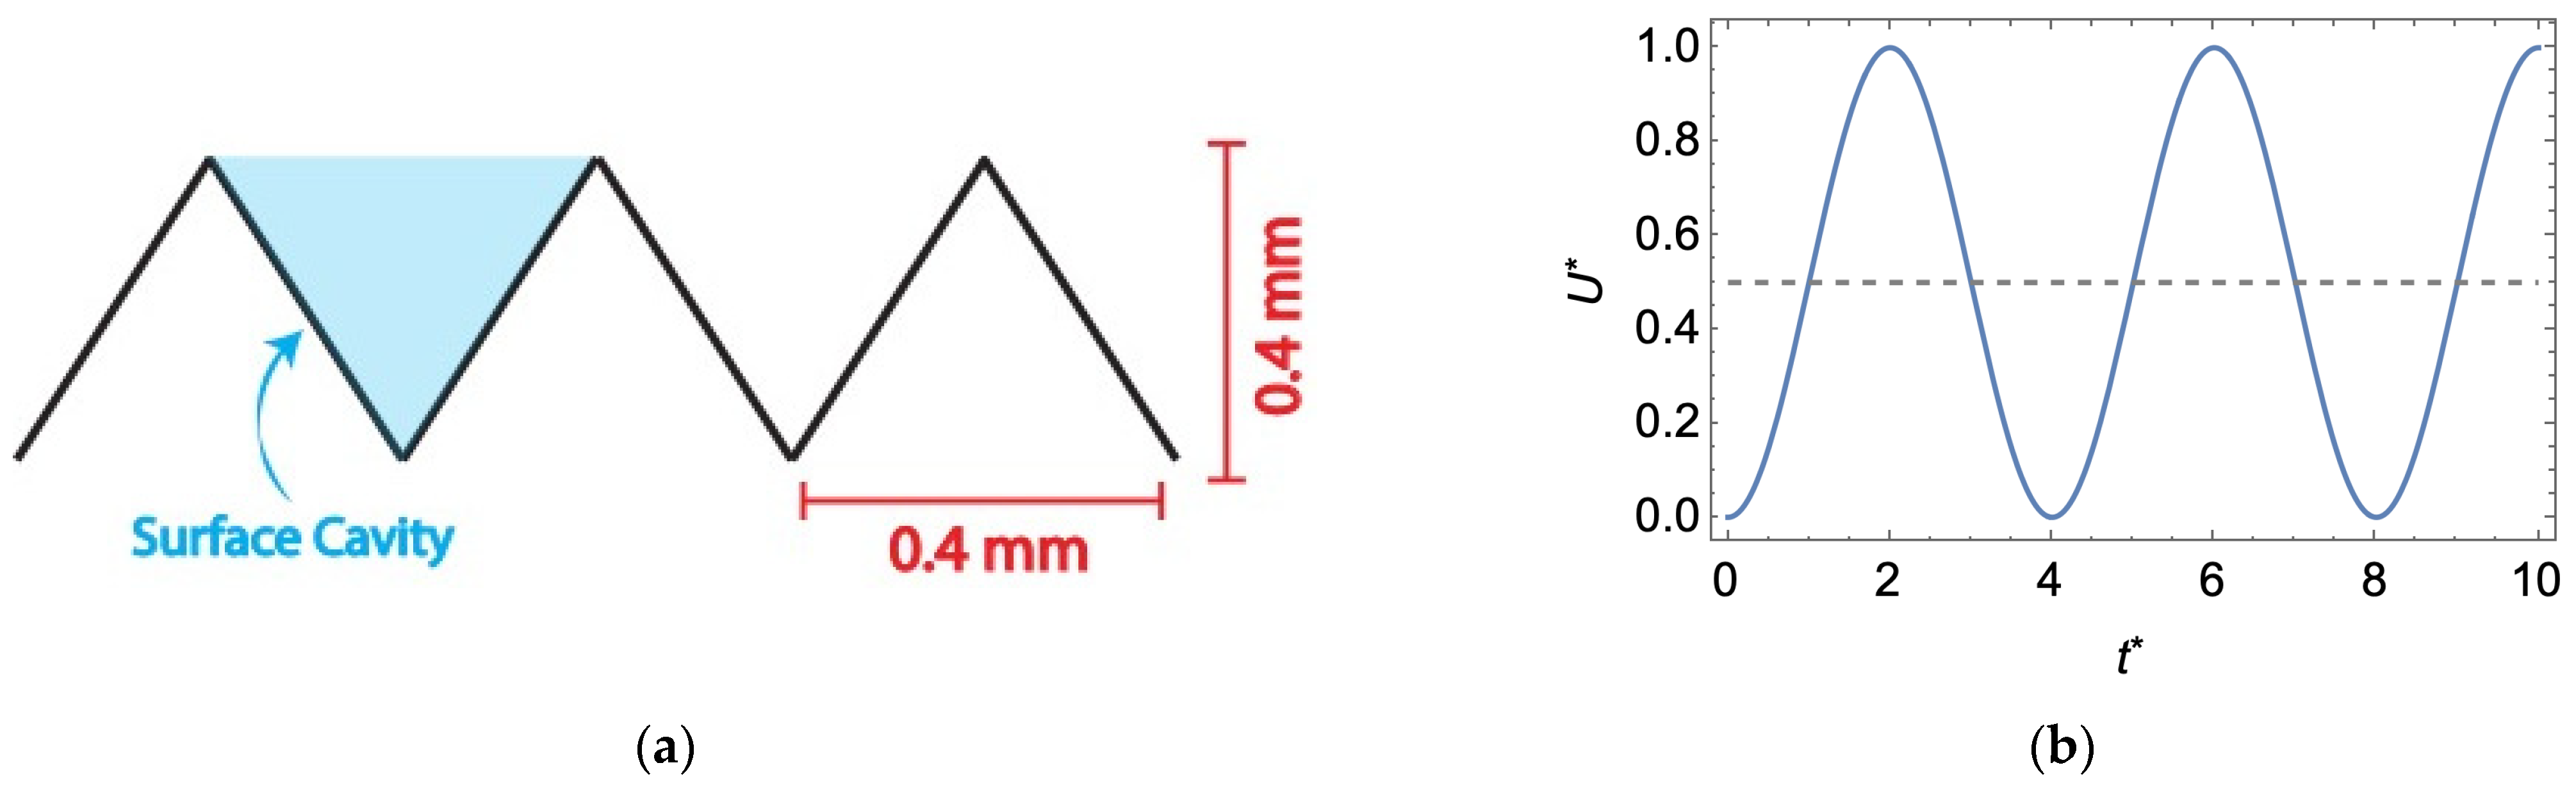
1.2.2. Manipulation of the Membrane Surface
1.3. Research Opportunity
2. Materials and Methods
2.1. Numerical Solver
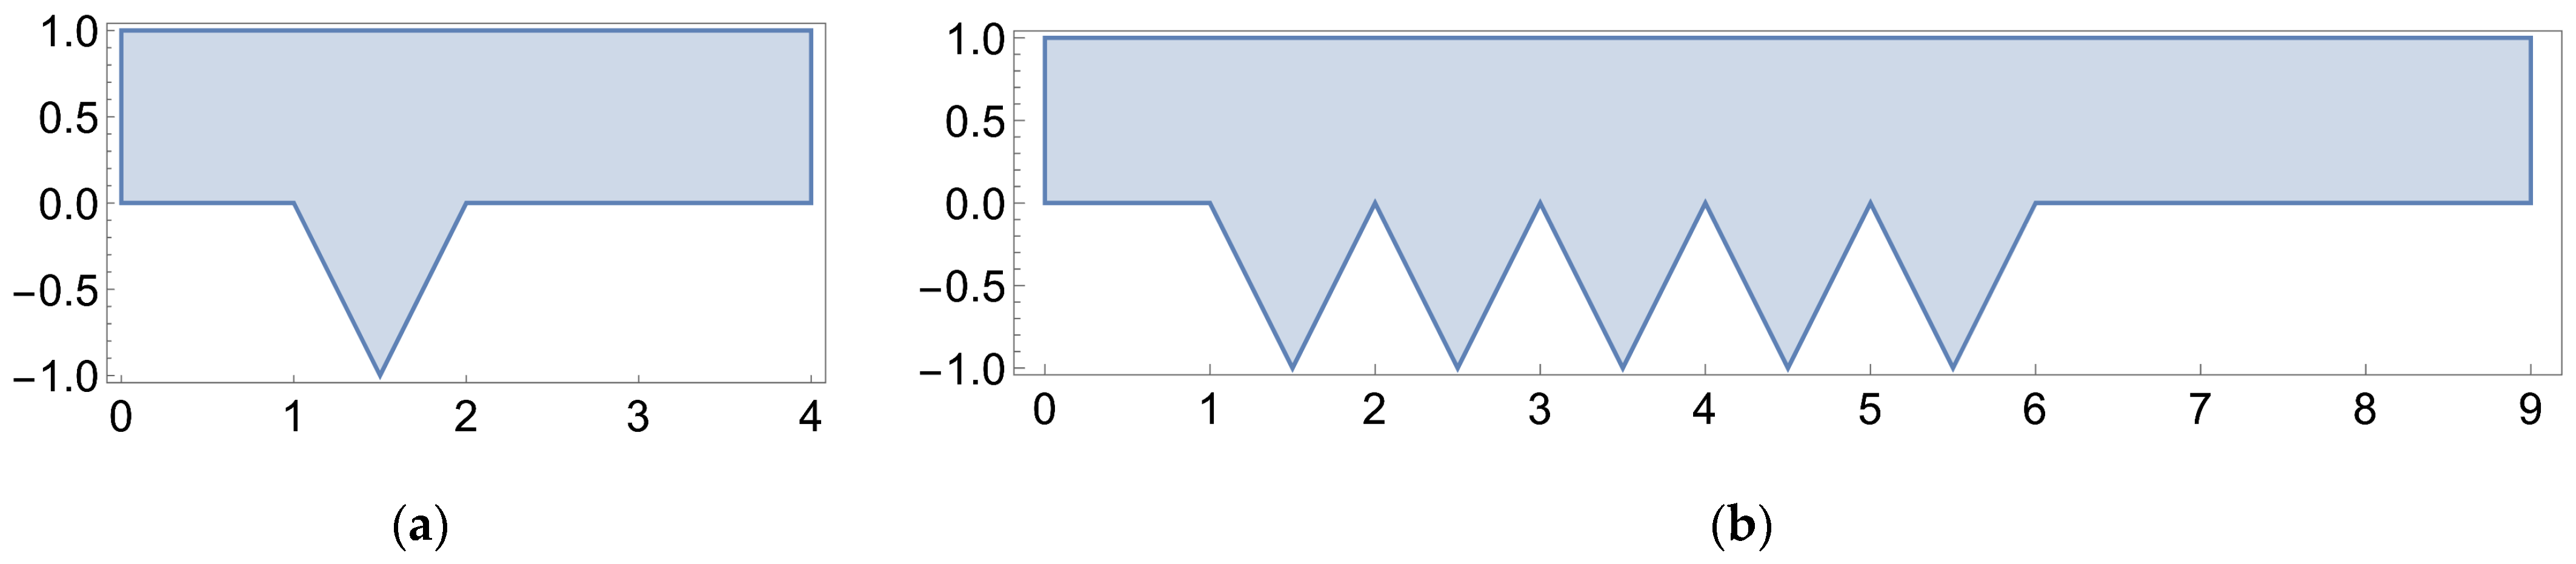
2.2. Solver Domain
3. Results
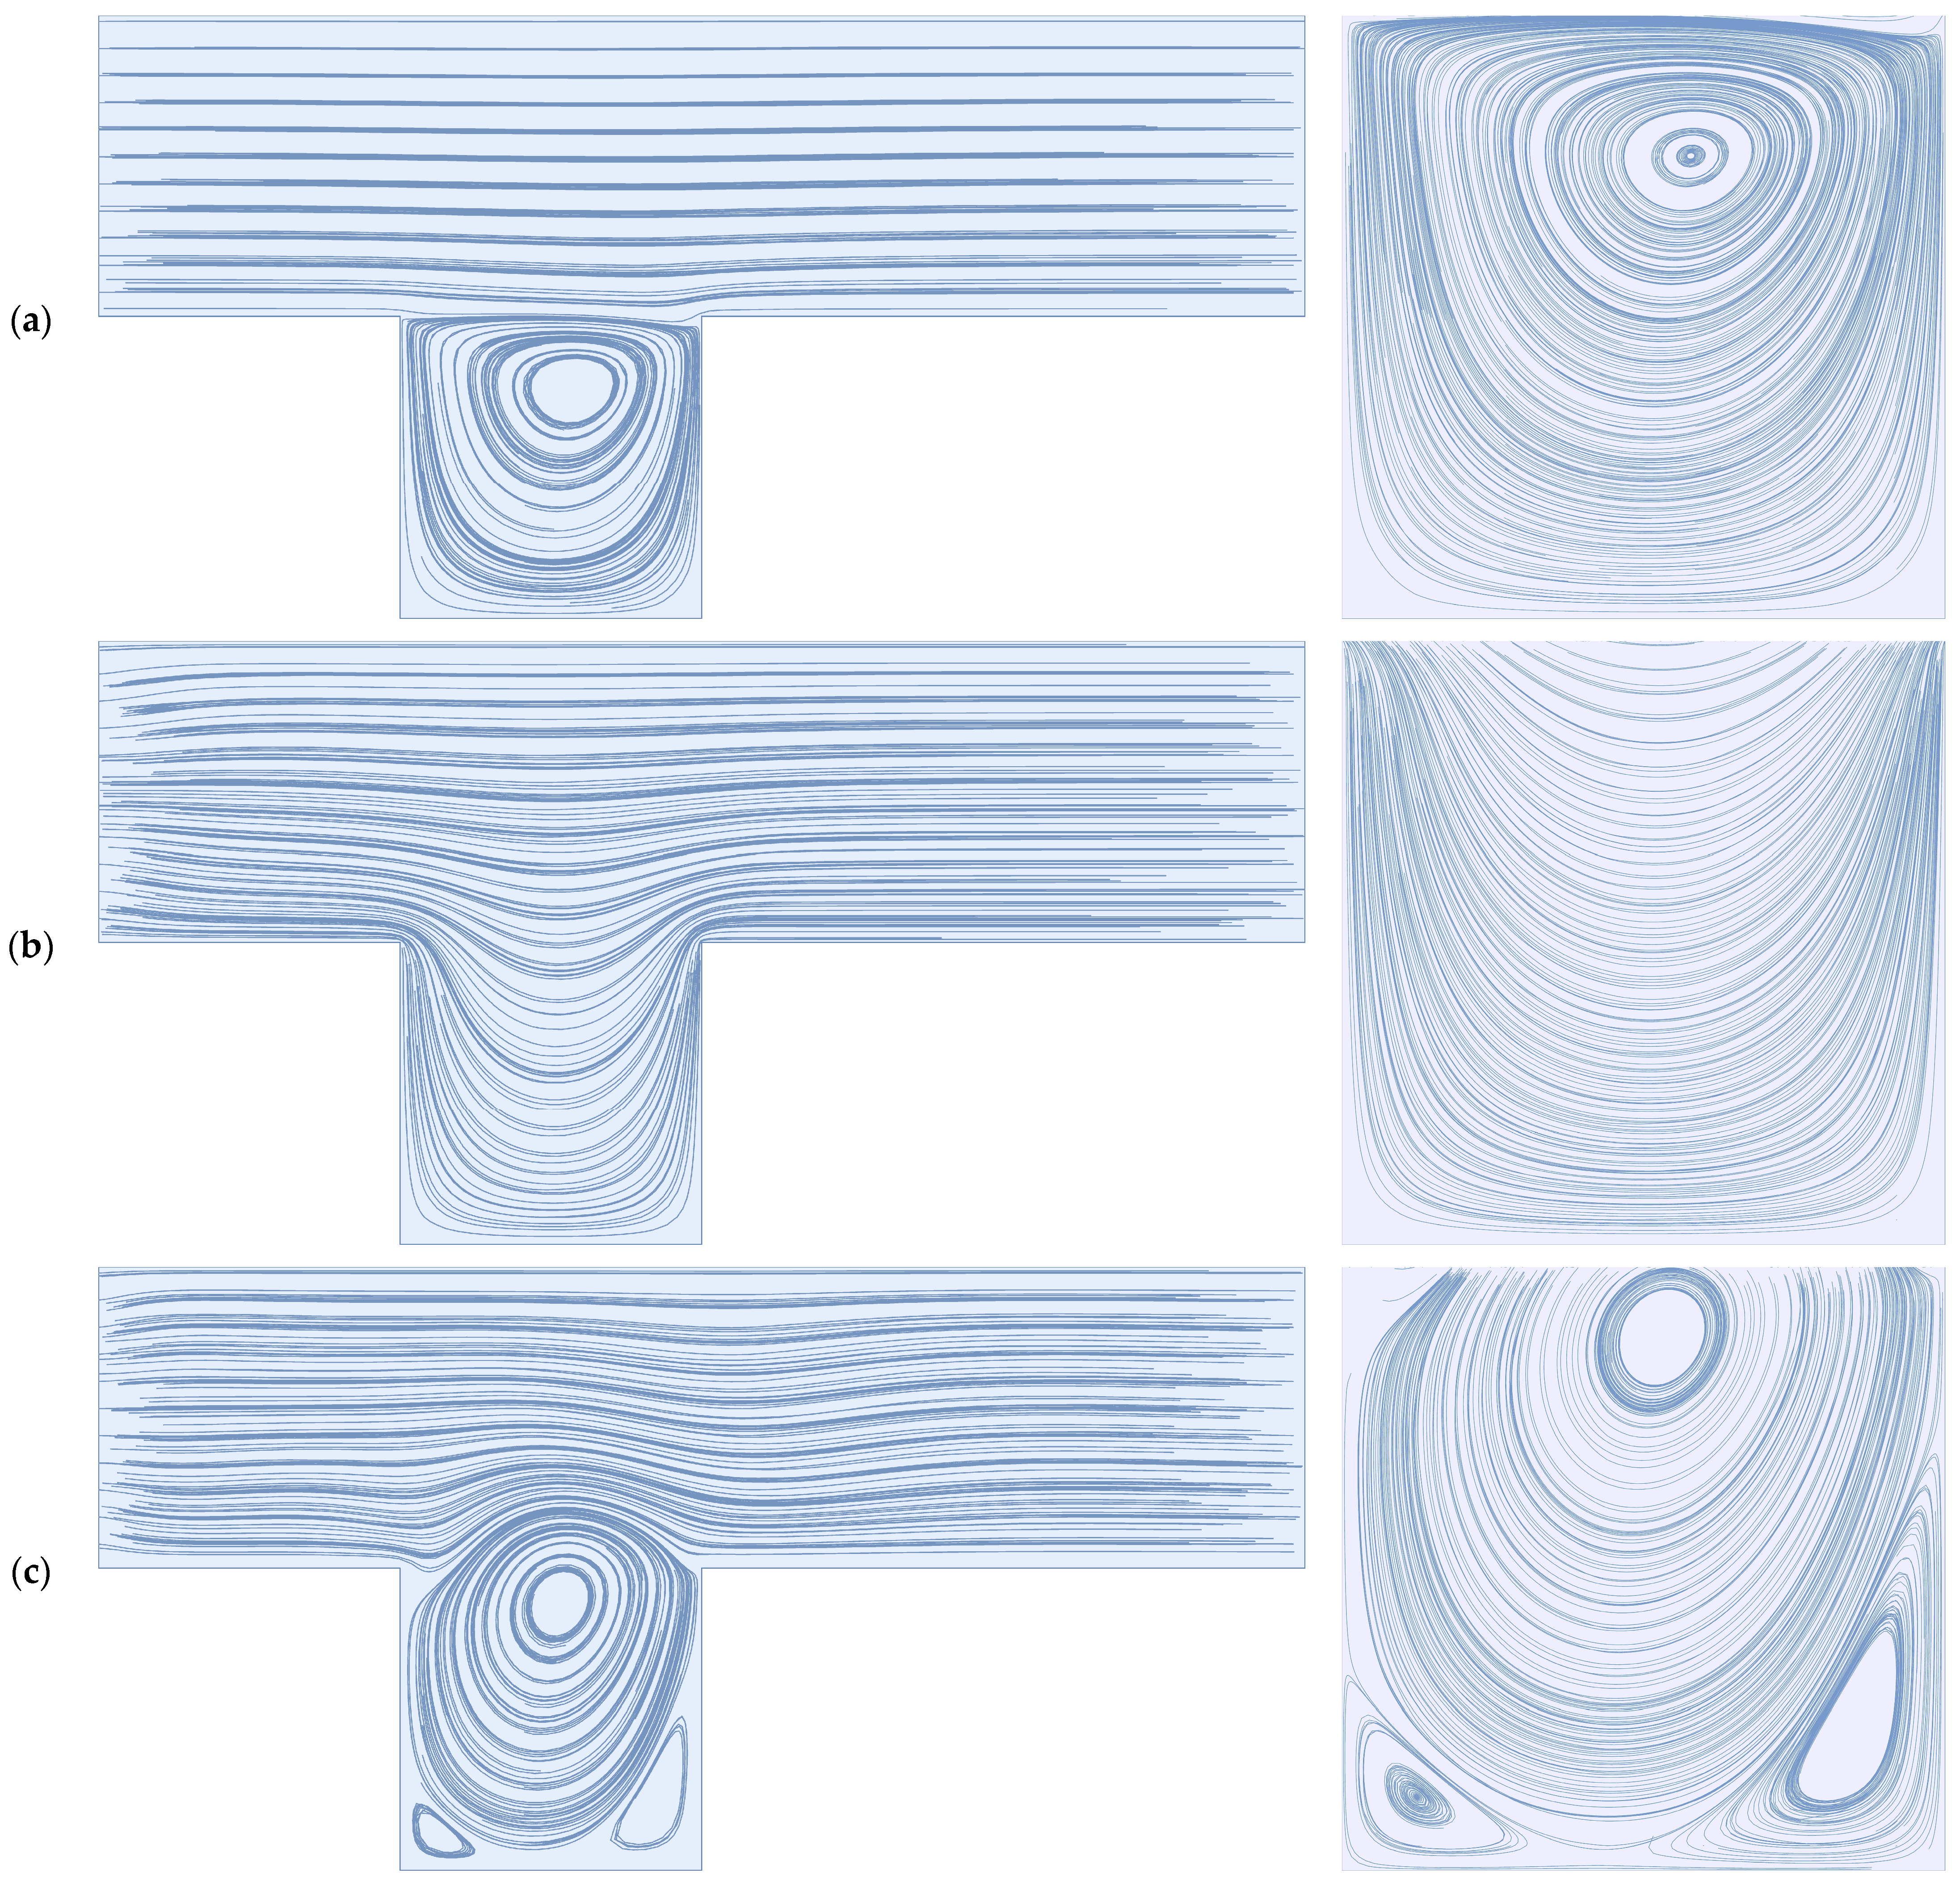
3.1. Flow Visualization
3.1.1. Steady Flow
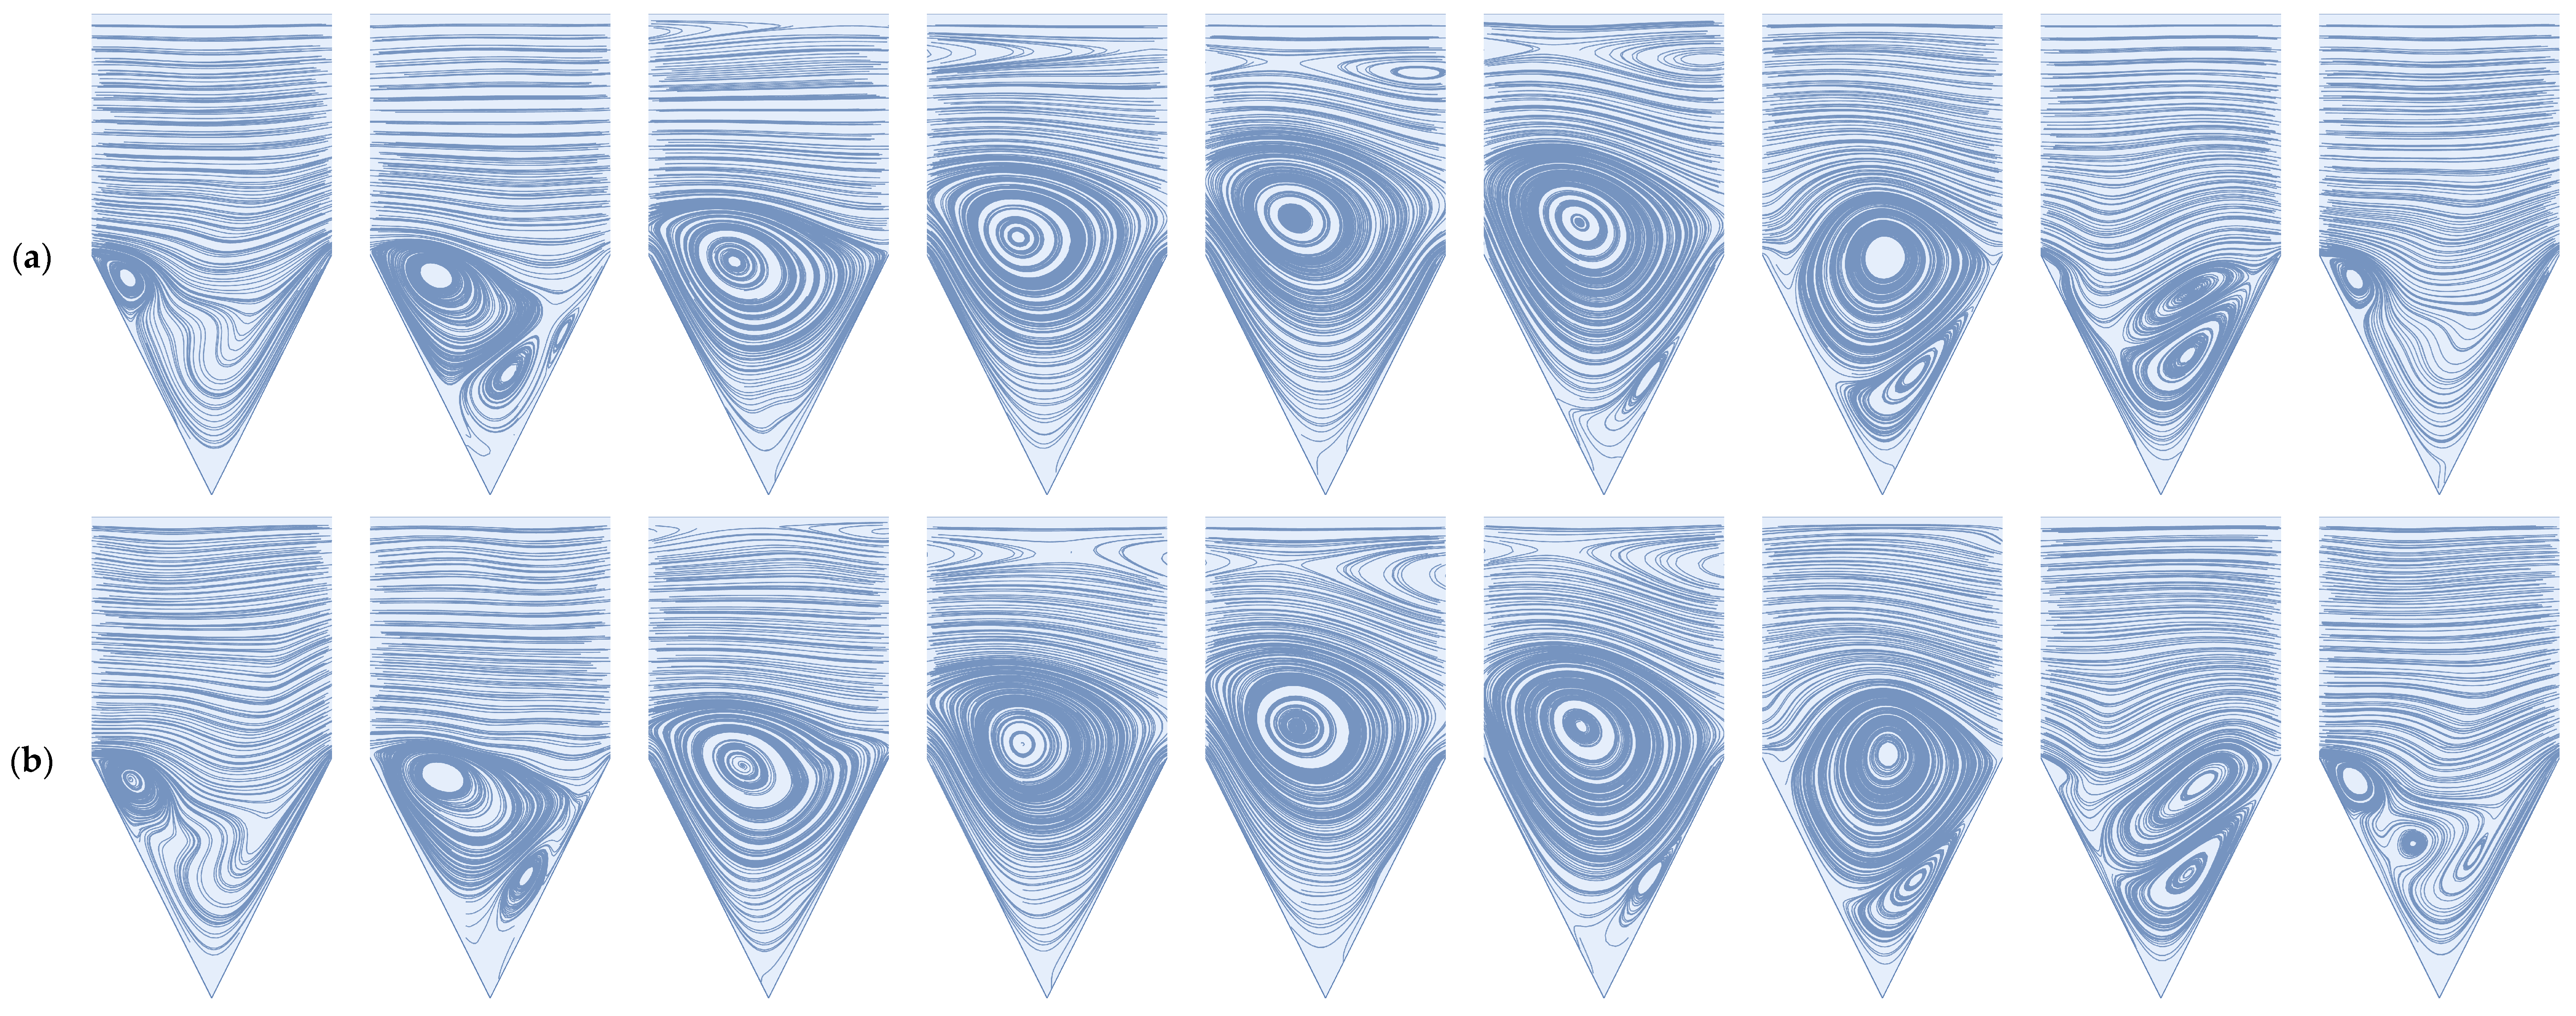
3.1.2. Pulsed Flow
3.2. Particle Tracking
3.2.1. Steady Flow
3.2.2. Pulsed Flow
4. Discussion
5. Conclusions
Supplementary Materials
Author Contributions
Funding
Institutional Review Board Statement
Data Availability Statement
Acknowledgments
Conflicts of Interest
References
- Obotey Ezugbe, E.; Rathilal, S. Membrane Technologies in Wastewater Treatment: A Review. Membranes 2020, 10, 89. [Google Scholar] [CrossRef] [PubMed]
- Rather, A.M.; Xu, Y.; Dupont, R.L.; Wang, X. Polymeric Membranes in Wastewater Treatment. In Nanoscale Engineering of Biomaterials: Properties and Applications; Lalit, M., Ed.; Pandey and Abshar Hasan, 487–515; Springer Nature: Singapore, 2022. [Google Scholar]
- Hidalgo, A.M.; Murcia, M.D. Membranes for Water and Wastewater Treatment. Membranes 2021, 11, 295. [Google Scholar] [CrossRef] [PubMed]
- Baker, R.W. Membrane Technology and Applications, 3rd ed.; Wiley: Hoboken, NJ, USA, 2012. [Google Scholar]
- Giacobbo, A.; Moura Bernardes, A.; Filipe Rosa, M.J.; de Pinho, M.N. Concentration Polarization in Ultrafiltration/Nanofiltration for the Recovery of Polyphenols from Winery Wastewaters. Membranes 2018, 8, 46. [Google Scholar] [CrossRef] [PubMed]
- Matthiasson, E.; Sivik, B. Concentration Polarization and Fouling. Desalination 1980, 35, 59–103. [Google Scholar] [CrossRef]
- Shang, W.; Li, X.; Liu, W.; Yue, S.; Li, M.; von Eiff, D.; Sun, F.; An, A.K. Effective Suppression of Concentration Polarization by Nanofiltration Membrane Surface Pattern Manipulation: Numerical Modeling Based on Lif Visualization. J. Membr. Sci. 2021, 622, 119021. [Google Scholar] [CrossRef]
- Gençal, Y.; Durmaz, E.N.; Çulfaz-Emecen, P.Z. Preparation of Patterned Microfiltration Membranes and Their Performance in Crossflow Yeast Filtration. J. Membr. Sci. 2015, 476, 224–233. [Google Scholar] [CrossRef]
- Gohari, J.R.; Lau, W.J.; Matsuura, T.; Ismail, A.F. Effect of Surface Pattern Formation on Membrane Fouling and Its Control in Phase Inversion Process. J. Membr. Sci. 2013, 446, 326–331. [Google Scholar] [CrossRef]
- Maruf, S.H.; Wang, L.; Greenberg, A.R.; Pellegrino, J.; Ding, Y. Use of Nanoimprinted Surface Patterns to Mitigate Colloidal Deposition on Ultrafiltration Membranes. J. Membr. Sci. 2013, 428, 598–607. [Google Scholar] [CrossRef]
- Çulfaz, P.Z.; Haddad, M.; Wessling, M.; Lammertink, R.G.H. Fouling Behavior of Microstructured Hollow Fibers in Cross-Flow Filtrations: Critical Flux Determination and Direct Visual Observation of Particle Deposition. J. Membr. Sci. 2011, 372, 210–218. [Google Scholar] [CrossRef]
- Zare, S.; Kargari, A. State-of-the-Art Surface Patterned Membranes Fabrication and Applications: A Review of the Current Status and Future Directions. Chem. Eng. Res. Des. 2023, 196, 495–525. [Google Scholar] [CrossRef]
- Upadhyaya, L.; Qian, X.; Ranil Wickramasinghe, S. Chemical Modification of Membrane Surface—Overview. Curr. Opin. Chem. Eng. 2018, 20, 13–18. [Google Scholar] [CrossRef]
- Choi, W.; Shin, M.G.; Lee, G.W.; Kim, D.; Yoo, C.H.; Lee, J.S.; Jung, H.W.; Lee, J.-H. Anisotropic Biofouling Behavior of Sharkskin-Patterned Desalination Membranes. J. Membr. Sci. 2023, 683, 121814. [Google Scholar] [CrossRef]
- Gul, A.; Hruza, J.; Dvorak, L.; Yalcinkaya, F. Chemical Cleaning Process of Polymeric Nanofibrous Membranes. Polymers 2022, 14, 1102. [Google Scholar] [CrossRef] [PubMed]
- Chheang, M.; Hongprasith, N.; Ratanatawanate, C.; Lohwacharin, J. Effects of Chemical Cleaning on the Ageing of Polyvinylidene Fluoride Microfiltration and Ultrafiltration Membranes Fouled with Organic and Inorganic Matter. Membranes 2022, 12, 280. [Google Scholar] [CrossRef]
- Huang, J.; Luo, J.; Chen, X.; Feng, S.; Wan, Y. How Do Chemical Cleaning Agents Act on Polyamide Nanofiltration Membrane and Fouling Layer? Ind. Eng. Chem. Res. 2020, 59, 17653–17670. [Google Scholar] [CrossRef]
- Gul, A.; Hruza, J.; Yalcinkaya, F. Fouling and Chemical Cleaning of Microfiltration Membranes: A Mini-Review. Polymers 2021, 13, 846. [Google Scholar] [CrossRef] [PubMed]
- Ang, W.S.; Yip, N.Y.; Tiraferri, A.; Elimelech, M. Chemical Cleaning of Ro Membranes Fouled by Wastewater Effluent: Achieving Higher Efficiency with Dual-Step Cleaning. J. Membr. Sci. 2011, 382, 100–106. [Google Scholar] [CrossRef]
- Zhou, Z.; Ling, B.; Battiato, I.; Husson, S.M.; Ladner, D.A. Concentration Polarization over Reverse Osmosis Membranes with Engineered Surface Features. J. Membr. Sci. 2021, 617, 118199. [Google Scholar] [CrossRef]
- Hartinger, M.; Schiffer, S.; Heidebrecht, H.-J.; Dumpler, J.; Kulozik, U. Milk Protein Fractionation by Custom-Made Prototypes of Spiral-Wound Microfiltration Membranes Operated at Extreme Crossflow Velocities. J. Membr. Sci. 2020, 605, 118110. [Google Scholar] [CrossRef]
- Belfort, G. Fluid Mechanics in Membrane Filtration: Recent Developments. J. Membr. Sci. 1989, 40, 123–147. [Google Scholar] [CrossRef]
- Jaffrin, M.Y. Hydrodynamic Techniques to Enhance Membrane Filtration. Annu. Rev. Fluid Mech. 2012, 44, 77–96. [Google Scholar] [CrossRef]
- Kürzl, C.; Kulozik, U. Influence of Pulsed and Alternating Flow on the Filtration Performance During Skim Milk Microfiltration with Flat-Sheet Membranes. Sep. Purif. Technol. 2023, 321, 124234. [Google Scholar] [CrossRef]
- Liu, L.; He, H.; Wang, Y.; Tong, T.; Li, X.; Zhang, Y.; He, T. Mitigation of Gypsum and Silica Scaling in Membrane Distillation by Pulse Flow Operation. J. Membr. Sci. 2021, 624, 119107. [Google Scholar] [CrossRef]
- Wang, J.M.; Jin, Q.Q.; Zhang, Y.Y.; Fang, H.C.; Xia, H.M. Reducing the Membrane Fouling in Cross-Flow Filtration Using a Facile Fluidic Oscillator. Sep. Purif. Technol. 2021, 272, 118854. [Google Scholar] [CrossRef]
- Echakouri, M.; Salama, A.; Henni, A. Experimental Investigation of the Novel Periodic Feed Pressure Technique in Minimizing Fouling During the Filtration of Oily Water Systems Using Ceramic Membranes. Membranes 2022, 12, 868. [Google Scholar] [CrossRef]
- García-Picazo, F.J.; Fletcher, D.F.; Fimbres-Weihs, G.A. Mass Transfer Enhancement in Spacer-Filled Membrane Channels by Flow Oscillation Induced Vortex Shedding: Numerical Study of the Effect of Amplitude. Int. J. Heat Mass Transf. 2023, 209, 124054. [Google Scholar] [CrossRef]
- Schwinge, J.; Wiley, D.E.; Fletcher, D.F. Simulation of Unsteady Flow and Vortex Shedding for Narrow Spacer-Filled Channels. Ind. Eng. Chem. Res. 2003, 42, 4962–4977. [Google Scholar] [CrossRef]
- Howell, J.A.; Field, R.W.; Wu, D. Yeast Cell Microfiltration: Flux Enhancement in Baffled and Pulsatile Flow Systems. J. Membr. Sci. 1993, 80, 59–71. [Google Scholar] [CrossRef]
- Won, Y.-J.; Choi, D.-C.; Jang, J.H.; Lee, J.-W.; Chae, H.R.; Kim, I.; Ahn, K.H.; Lee, C.-H.; Kim, I.-C. Factors Affecting Pattern Fidelity and Performance of a Patterned Membrane. J. Membr. Sci. 2014, 462, 1–8. [Google Scholar] [CrossRef]
- Won, Y.-J.; Jung, S.-Y.; Jang, J.-H.; Lee, J.-W.; Chae, H.-R.; Choi, D.-C.; Hyun Ahn, K.; Lee, C.-H.; Park, P.-K. Correlation of Membrane Fouling with Topography of Patterned Membranes for Water Treatment. J. Membr. Sci. 2016, 498, 14–19. [Google Scholar] [CrossRef]
- Won, Y.-J.; Lee, J.; Choi, D.-C.; Chae, H.R.; Kim, I.; Lee, C.-H.; Kim, I.-C. Preparation and Application of Patterned Membranes for Wastewater Treatment. Environ. Sci. Technol. 2012, 46, 11021–11027. [Google Scholar] [CrossRef]
- Heinz, O.; Aghajani, M.; Greenberg, A.R.; Ding, Y. Surface-Patterning of Polymeric Membranes: Fabrication and Performance. Curr. Opin. Chem. Eng. 2018, 20, 1–12. [Google Scholar] [CrossRef]
- Barambu, N.U.; Bilad, M.R.; Wibisono, Y.; Jaafar, J.; Mahlia, T.M.I.; Khan, A.L. Membrane Surface Patterning as a Fouling Mitigation Strategy in Liquid Filtration: A Review. Polymers 2019, 11, 1687. [Google Scholar] [CrossRef]
- Chauhan, D.; Nagar, P.K.; Pandey, K.; Awasthi, K.; Pandey, H. Simulations of Physically Surface-Patterned Membranes for Water Treatment: Recent Advances. Sep. Purif. Rev. 2023, 1–26. [Google Scholar] [CrossRef]
- Ibrahim, Y.; Hilal, N. A Critical Assessment of Surface-Patterned Membranes and Their Role in Advancing Membrane Technologies. ACS EST Water 2023, 3, 3807–3834. [Google Scholar] [CrossRef]
- Ward, L.M.; Fickling, B.G.; Weinman, S.T. Effect of Nanopatterning on Concentration Polarization During Nanofiltration. Membranes 2021, 11, 961. [Google Scholar] [CrossRef] [PubMed]
- Ma, S.; Song, L. Numerical Study on Permeate Flux Enhancement by Spacers in a Crossflow Reverse Osmosis Channel. J. Membr. Sci. 2006, 284, 102–109. [Google Scholar] [CrossRef]
- Çulfaz, P.Z.; Buetehorn, S.; Utiu, L.; Kueppers, M.; Bluemich, B.; Melin, T.; Wessling, M.; Lammertink, R.G.H. Fouling Behavior of Microstructured Hollow Fiber Membranes in Dead-End Filtrations: Critical Flux Determination and Nmr Imaging of Particle Deposition. Langmuir 2011, 27, 1643–1652. [Google Scholar] [CrossRef]
- Rickman, M.; Maruf, S.; Kujundzic, E.; Davis, R.H.; Greenberg, A.; Ding, Y.; Pellegrino, J. Fractionation and Flux Decline Studies of Surface-Patterned Nanofiltration Membranes Using Nacl-Glycerol-Bsa Solutions. J. Membr. Sci. 2017, 527, 102–110. [Google Scholar] [CrossRef]
- Ward, L.M.; Shah, R.M.; Schiffman, J.D.; Weinman, S.T. Nanopatterning Reduces Bacteria Fouling in Ultrafiltration. ACS EST Water 2022, 2, 1593–1601. [Google Scholar] [CrossRef]
- Lee, Y.K.; Won, Y.-J.; Yoo, J.H.; Ahn, K.H.; Lee, C.-H. Flow Analysis and Fouling on the Patterned Membrane Surface. J. Membr. Sci. 2013, 427, 320–325. [Google Scholar] [CrossRef]
- Choi, D.-C.; Jung, S.-Y.; Won, Y.-J.; Jang, J.H.; Lee, J.; Chae, H.-R.; Ahn, K.H.; Lee, S.; Park, P.-K.; Lee, C.-H. Three-Dimensional Hydraulic Modeling of Particle Deposition on the Patterned Isopore Membrane in Crossflow Microfiltration. J. Membr. Sci. 2015, 492, 156–163. [Google Scholar] [CrossRef]
- Malakian, A.; Husson, S.M. Evaluating Protein Fouling on Membranes Patterned by Woven Mesh Fabrics. Membranes 2021, 11, 730. [Google Scholar] [CrossRef]
- Jung, S.Y.; Won, Y.-J.; Jang, J.H.; Yoo, J.H.; Ahn, K.H.; Lee, C.-H. Particle Deposition on the Patterned Membrane Surface: Simulation and Experiments. Desalination 2015, 370, 17–24. [Google Scholar] [CrossRef]
- Jung, S.Y.; Ahn, K.H. Transport and Deposition of Colloidal Particles on a Patterned Membrane Surface: Effect of Cross-Flow Velocity and the Size Ratio of Particle to Surface Pattern. J. Membr. Sci. 2019, 572, 309–319. [Google Scholar] [CrossRef]
- Kim, K.T.; Park, J.E.; Jung, S.Y.; Kang, T.G. Fouling Mitigation Via Chaotic Advection in a Flat Membrane Module with a Patterned Surface. Membranes 2021, 11, 724. [Google Scholar] [CrossRef] [PubMed]
- Malakian, A.; Zhou, Z.; Messick, L.; Spitzer, T.N.; Ladner, D.A.; Husson, S.M. Understanding the Role of Pattern Geometry on Nanofiltration Threshold Flux. Membranes 2020, 10, 445. [Google Scholar] [CrossRef]
- Choi, W.; Lee, C.; Lee, D.; Won, Y.J.; Lee, G.W.; Shin, M.G.; Chun, B.; Kim, T.-S.; Park, H.-D.; Jung, H.W.; et al. Sharkskin-Mimetic Desalination Membranes with Ultralow Biofouling. J. Mater. Chem. A 2018, 6, 23034–23045. [Google Scholar] [CrossRef]
- Wang, Q.; Lin, W.; Chou, S.; Dai, P.; Huang, X. Patterned Membranes for Improving Hydrodynamic Properties and Mitigating Membrane Fouling in Water Treatment: A Review. Water Res. 2023, 236, 119943. [Google Scholar] [CrossRef]
- Ilyas, A.; Mertens, M.; Oyaert, S.; Vankelecom, I.F.J. Anti-Fouling Behavior of Micro-Patterned Pvdf Membranes Prepared Via Spray-Assisted Phase Inversion: Influence of Pattern Shapes and Flow Configuration. Sep. Purif. Technol. 2021, 259, 118041. [Google Scholar] [CrossRef]
- Young, A.H.; Kabala, Z.J. Hydrodynamic Porosity: A Paradigm Shift in Flow and Contaminant Transport through Porous Media, Part I. Hydrol. Earth Syst. Sci. Discuss. 2023, 2023, 1–36. [Google Scholar] [CrossRef]
- Shen, C.; Floryan, J.M. Low Reynolds Number Flow over Cavities. Phys. Fluids 1985, 28, 3191–3202. [Google Scholar] [CrossRef]
- Fang, L.C.; Cleaver, J.W.; Nicolaou, D. Hydrodynamic Cleansing of Cavities. In Proceedings of the 8th International Conference on Computational Methods and Experimental Measurements (CMEM 97), Rhodes, Greece, 21–23 May 1997. [Google Scholar]
- Kahler, D.M.; Kabala, Z.J. Acceleration of Groundwater Remediation by Deep Sweeps and Vortex Ejections Induced by Rapidly Pulsed Pumping. Water Resour. Res. 2016, 52, 3930–3940. [Google Scholar] [CrossRef]
- Kahler, D.M.; Kabala, Z.J. Rapidly Pulsed Pumping Accelerates Remediation in a Vertical Circulation Well Model. Water 2018, 10, 1423. [Google Scholar] [CrossRef]
- Kahler, D.M.; Kabala, Z.J. Acceleration of Groundwater Remediation by Rapidly Pulsed Pumping: Laboratory Column Tests. J. Environ. Eng. 2019, 145, 06018009. [Google Scholar] [CrossRef]
- Sobey, I.J. On Flow through Furrowed Channels. Part 1. Calculated Flow Patterns. J. Fluid Mech. 1980, 96, 1–26. [Google Scholar] [CrossRef]
- Bellhouse, B.J.; Bellhouse, F.H.; Curl, C.M.; MacMillan, T.I.; Gunning, A.J.; Spratt, E.H.; MacMurray, S.B.; Nelems, J.M. A High Efficiency Membrane Oxygenator and Pulsatile Pumping System, and Its Application to Animal Trials. Trans. Am. Soc. Artif. Intern. Organs 1973, 19, 72–79. [Google Scholar] [CrossRef]
- Li, C.; Zhang, D.; Liu, J.; Xiong, H.; Sun, T.; Wu, X.; Shi, Z.; Lin, Q. Study on the Control of Membrane Fouling by Pulse Function Feed and Cfd Simulation Verification. Membranes 2022, 12, 362. [Google Scholar] [CrossRef]
- Young, A.H.; Kabala, Z.J. Hydrodynamic Porosity: A Paradigm Shift in Flow and Contaminant Transport through Porous Media, Part II. Hydrol. Earth Syst. Sci. Discuss. 2023, 2023, 1–21. [Google Scholar] [CrossRef]
- Moffatt, H.K. Viscous and Resistive Eddies near a Sharp Corner. J. Fluid Mech. 1963, 18, 1–18. [Google Scholar] [CrossRef]
- Jagannathan, A.; Mohan, R.; Dhanak, M. A Spectral Method for the Triangular Cavity Flow. Comput. Fluids 2014, 95, 40–48. [Google Scholar] [CrossRef]
- Ribbens, C.J.; Watson, L.T.; Wang, C.-Y. Steady Viscous Flow in a Triangular Cavity. J. Comput. Phys. 1994, 112, 173–181. [Google Scholar] [CrossRef]
- Jyotsna, R.; Vanka, S.P. Multigrid Calculation of Steady, Viscous Flow in a Triangular Cavity. J. Comput. Phys. 1995, 122, 107–117. [Google Scholar] [CrossRef]
- Nishimura, T.; Kunitsugu, K.; Morega, A.M. Fluid Mixing and Mass Transfer Enhancement in Grooved Channels for Pulsatile Flow. J. Enhanc. Heat Transf. 1998, 5, 23–37. [Google Scholar] [CrossRef]
- Greiner, M. An Experimental Investigation of Resonant Heat Transfer Enhancement in Grooved Channels. Int. J. Heat Mass Transf. 1991, 34, 1383–1391. [Google Scholar] [CrossRef]
- Nishimura, T.; Morega, A.M.; Kunitsugu, K. Vortex Structure and Fluid Mixing in Pulsatile Flow through Periodically Grooved Channels at Low Reynolds Numbers. JSME Int. J. Ser. B Fluids Therm. Eng. 1997, 40, 377–385. [Google Scholar] [CrossRef]
- Aloulou, W.; Aloulou, H.; Attia, A.; Chakraborty, S.; Ben Amar, R. Treatment of Tuna Cooking Juice Via Ceramic Ultrafiltration Membrane: Optimization Using Response Surface Methodology. Membranes 2022, 12, 813. [Google Scholar] [CrossRef]
- Saffman, P.G. On the Boundary Condition at the Surface of a Porous Medium. Stud. Appl. Math. 1971, 50, 93–101. [Google Scholar] [CrossRef]
- Beavers, G.S.; Joseph, D.D. Boundary Conditions at a Naturally Permeable Wall. J. Fluid Mech. 1967, 30, 197–207. [Google Scholar] [CrossRef]
- Belfort, G.; Nagata, N. Fluid Mechanics and Cross-Flow Filtration: Some Thoughts. Desalination 1985, 53, 57–79. [Google Scholar] [CrossRef]


Disclaimer/Publisher’s Note: The statements, opinions and data contained in all publications are solely those of the individual author(s) and contributor(s) and not of MDPI and/or the editor(s). MDPI and/or the editor(s) disclaim responsibility for any injury to people or property resulting from any ideas, methods, instructions or products referred to in the content. |
© 2024 by the authors. Licensee MDPI, Basel, Switzerland. This article is an open access article distributed under the terms and conditions of the Creative Commons Attribution (CC BY) license (https://creativecommons.org/licenses/by/4.0/).
Share and Cite
Young, A.H.; Hotz, N.; Hawkins, B.T.; Kabala, Z.J. Inducing Deep Sweeps and Vortex Ejections on Patterned Membrane Surfaces to Mitigate Surface Fouling. Membranes 2024, 14, 21. https://doi.org/10.3390/membranes14010021
Young AH, Hotz N, Hawkins BT, Kabala ZJ. Inducing Deep Sweeps and Vortex Ejections on Patterned Membrane Surfaces to Mitigate Surface Fouling. Membranes. 2024; 14(1):21. https://doi.org/10.3390/membranes14010021
Chicago/Turabian StyleYoung, August H., Nico Hotz, Brian T. Hawkins, and Zbigniew J. Kabala. 2024. "Inducing Deep Sweeps and Vortex Ejections on Patterned Membrane Surfaces to Mitigate Surface Fouling" Membranes 14, no. 1: 21. https://doi.org/10.3390/membranes14010021
APA StyleYoung, A. H., Hotz, N., Hawkins, B. T., & Kabala, Z. J. (2024). Inducing Deep Sweeps and Vortex Ejections on Patterned Membrane Surfaces to Mitigate Surface Fouling. Membranes, 14(1), 21. https://doi.org/10.3390/membranes14010021