1. Introduction
Biogas is a valuable renewable energy source that can help mitigate greenhouse gas emissions and contribute to climate neutrality [
1]. Biogas has been mainly used for combined production of heat and power. It satisfies energy needs in areas not covered by the national grid and provides a clean cooking fuel, preventing the use of solid biomass [
2]. In 2020, the global biogas market was valued at around USD 24.03 billion, with the European market representing the major share [
3]. Moreover, it is expected that the global market will be valued at around USD 37.02 billion by 2028 [
3].
Biomethane results from the upgrading process of biogas, and its production volumes are increasing rapidly [
4]. It is expected that its production volumes increase from 3 to 35 bcm by 2030 in the EU as a part of the RePowerEU plan [
5,
6]. Biomethane is an alternative to natural gas for heat and power generation and as a feedstock to produce high-value chemicals. Furthermore, it allows the reduction in emissions in sectors that are hard to decarbonize like heavy industry and freight transport [
2]. It is envisioned that biomethane and hydrogen will contribute to achieving the sub-target of a 14% renewable energy consumption in road and rail transport by 2030, as stipulated in RED II [
7].
In the Power-to-Gas (PtG) concept, CO
2 contained in biogas and previously separated during upgrading can be further valorized into more biomethane, using green hydrogen obtained from water electrolysis [
8]. Thus, PtG allows the conversion of electrical energy into chemical energy while boosting biomethane production and avoiding CO
2 emissions [
9].
With the subsidies for electricity production from biogas running out in many countries, including Portugal [
10,
11], along with the need to adopt sustainable solutions and mitigate the current energy crisis [
6], other routes for biogas valorisation are required. Among them, biogas upgrading is a mature option allowing to produce biomethane that can replace natural gas, especially in hard-to-decarbonize sectors. Complementarily, with the growing demand for renewable hydrogen worldwide, dry reforming of methane (DRM) contained in biogas (Equation (1)) [
12] is also an interesting valorisation pathway that can unlock biogas potential and create new business models [
13]. Alternative renewable hydrogen production routes are increasingly important to fulfil demand, considering that current green hydrogen share is still very low (i.e., 4% of total hydrogen produced worldwide) [
14]. Besides injection in the gas grids, several other applications for renewable hydrogen implementation are being considered in the refining, chemical sector and in shipping [
4].
The DRM offers the advantage of using two main greenhouse gases, CO
2 and CH
4, to produce hydrogen. Furthermore, it provides a route for direct biogas utilization since its main constituents are CO
2 and CH
4. Nickel-based catalysts are the most used for DRM because they are the cheapest and offer relatively good activity and selectivity [
15]. However, these conventional catalysts usually deactivate due to coke formation [
12]. Noble metal catalysts are more resistant to coke formation but are too expensive to be used industrially [
15]. In addition, the reverse water gas shift (RWSG) reaction (Equation (2)) can occur in parallel with DRM, which is undesirable because it consumes the hydrogen produced [
16]. DRM occurs typically at temperatures between 700 °C and 950 °C because high temperatures lessen the side reactions and coke formation [
12]. However, high temperatures can cause catalyst sintering and lead to high operational costs [
12].
To avoid/minimize these adverse effects, the use of a hydrogen-selective membrane reactor (MR) is envisaged to shift the reaction equilibrium of the DRM reaction (and disfavor the RWGS reaction) through the removal of a product (i.e., H
2) and to operate at lower temperatures (while obtaining the same conversion as that attained in a fixed-bed reactor at a higher temperature) [
16,
17]. However, coke formation is still an issue, and new catalysts are still under development [
15]. The implementation of MRs contributes to process intensification [
18] and provides several advantages such as reduced capital costs (by using smaller devices), improved yield and selectivity and reduced downstream separation costs [
19].
Thus, the objective of this work is to assess the advantages of using MRs for this application through computational simulation. To this end, a non-isothermal, one-dimensional, steady-state and pseudo-homogeneous plug flow model with axial dispersion is proposed and loaded with suitable reaction kinetics and membrane properties obtained after a literature survey.
3. Results and Discussion
3.1. Kinetic Model Validation
The results obtained experimentally by [
22] were compared with simulated results to validate the kinetic model. The fixed-bed dimensions, catalyst parameters and experimental conditions used by those authors to determine the kinetic model are shown in
Table 4.
The reactor used by such authors was simulated using the same operating conditions and the TR model described in
Section 2.1.
Figure 2 shows the parity plot comparing CH
4 and CO
2 conversions obtained in simulations with those obtained experimentally by the authors. The figure shows that the maximum difference between the experimental and simulated conversions is approximately 10%, which means that this kinetic model was satisfactorily validated.
3.2. Membrane Reactor Simulations
Simulations of an MR were performed using the properties of Pd-Ag membranes presented in
Section 2.3. Different operating conditions were used to study the influence of temperature, pressure, biogas composition and CO inhibition on the MR performance (
cf.
Table 3).
3.2.1. Effect of Temperature
The temperature and H
2 permeation flux profiles for the three simulations performed using feed temperatures of 450, 500 and 550 °C are represented in
Figure 3. Additional mole fraction plots are available in
Supporting Information (Figures S1 and S2).
Figure 3a shows temperature profiles on permeate and retentate zones for the three simulations. As previously mentioned, reactions occur in the retentate chamber. The temperature in the retentate chamber initially drops because all the reactions are endothermic. However, the heat transferred from the permeate zone surpasses the heat consumed by the reactions around
z = 0.6 for the simulation employing a feed temperature of 450 °C. Consequently, the retentate zone temperature increases for
z > 0.6. The temperature in the permeate zone also decreases initially due to the heat transferred to the retentate zone and to the cooler H
2 that permeates through the membrane. However, the temperature in the permeate zone increases for z > 0.6 as well, for the simulation at 450 °C. Therefore, the heat transferred by the reactor wall to the permeate zone is higher than the heat transferred to the retentate zone and to the permeated H
2. For higher feed temperatures, the profiles are more pronounced, and the reactor temperature starts decreasing steadily closer to the reactor inlet before increasing again around
z = 0.5 and
z = 0.4 for a 500 °C and 550 °C feed temperature, respectively.
Figure 3b shows that the H
2 molar flux through the membrane increases sharply and reaches a maximum near the reactor inlet for all simulations. Afterwards, the H
2 flux decreases mainly because of the lower driving force. Still, the flux is always positive, which means that H
2 is always permeating from the retentate to the permeate chamber along the entire reactor length.
Figure 3b also shows that the H
2 permeation molar flux increases with the feed temperature, because it is an activated process and because more hydrogen is formed. The permeation molar flux of hydrogen for a feed temperature of 550 °C is threefold higher than that for a feed temperature of 450 °C.
CH
4 and CO
2 conversions, H
2 yield, and total H
2/CO ratio profiles for a feed temperature of 450 °C are presented in
Figure 4a, while H
2 recovery and mole fraction of H
2 in the permeate zone are shown in
Figure 4b.
Figure 4a shows that conversions and H
2 yield continuously increase along the reactor length. However, the increase in these performance indicators is more noticeable closer to the reactor inlet due to the thermodynamic equilibrium of all the reactions (with higher concentrations of reactants and smaller concentrations of products), and because of the higher temperatures in the first fraction of the reactor, closer to its inlet (
Figure 3). The H
2/CO ratio increases considerably close to the reactor inlet since initially the fraction of these components is zero. Then, the ratio declines along the reactor length, reaching a value of 1.9 at the reactor end.
H
2 is the only species that permeates through the membrane and is diluted due to the use of N
2 as sweep gas, as seen in
Figure 4b. The hydrogen mole fraction in the permeate is quite small (i.e., 4.6%), although the H
2 recovery achieved is 66%.
Table 5 lists the performance indicators obtained in the simulations performed to study the effect of the feed temperature.
Table 5 shows that CH
4 conversion and H
2 yield increase significantly with the temperature due to the improved kinetics and the removal of H
2 by permeation (i.e., a product of DRM and MD reactions). The H
2/CO ratio is very high for all simulations, because the average rate of Reaction 3 (MD) is higher than the average rate of Reaction 2 (RWGS) (
cf.
Table 6). The H
2 recovery remains nearly constant for the different temperatures (
Table 5); however, due to the higher H
2 yields (the amount of H
2 that permeated increased nearly threefold in the range of 450–550 °C), a higher amount of H
2 is recovered at higher temperatures.
Table 6 shows that average rate of the DRM reaction (R1) is the lowest among the three reactions, which is undesirable since it is the main reaction.
3.2.2. Effect of Pressure
The pressure effect on MR performance was studied by changing the feed pressure while keeping all the other operating conditions constant. The operating conditions considered are listed in
Table 3.
Five simulations were performed to evaluate the effect of the feed pressure on MR performance. The figures obtained in all simulations showed similar patterns as those shown in the previous section and are available in
Supporting Information (Figures S3–S6), while the performance indicators are summarized in
Table 7.
The H
2 recovery increases substantially with the total pressure due to the higher driving force for permeation (
cf. Equation (30)).
Table 7 also shows that the conversion of CH
4 increases with pressure, while the conversion of CO
2 decreases. Hence, the higher H
2 yields and H
2/CO ratios for higher feed pressures (
Table 7) are a consequence of the promotion of Reaction 3 (MD), evidencing that coke formation increases with pressure, as commonly observed for Ni-based catalysts. This is supported by the average rates of reactions listed in
Table 8, where is shown that the average reaction rate of MD (R3) is superior to that of the DRM (R1) and RWGS (R2).
Usually, DRM only allows the production of syngas with low H
2/CO ratios (close to 1) which is preferred for oxygenated chemicals and liquid hydrocarbons production through the Fischer–Tropsch synthesis [
27,
28]. However, with the use of an MR, it is possible to obtain high-grade syngas with a H
2/CO ratio close to two that can be used to produce methanol and has potential applications in Fischer–Tropsch operations for the production of long hydrocarbons [
29,
30]. Syngas with higher H
2/CO ratios can be used in single-step production of dimethyl ether [
31].
The increase in rate of Reaction 3 (MD) combined with the decrease in rate of Reaction 2 (RWGS) by increasing the total pressure explains the H2/CO ratios reported above. It is also possible to observe that the average rate of Reaction 2 (RWGS) is significantly lower than the average rate of Reaction 1 (DRM) for higher pressures because more H2 permeates through the membrane, thus limiting the extension of the RWGS reaction.
3.2.3. Effect of Biogas Composition
The effect of biogas composition on the MR performance was studied by changing the CH
4/CO
2 inlet molar ratio. In these simulations, the mass of catalyst and, consequently, the gas hourly space velocity (
GHSV) were changed while keeping the ratio between the catalyst mass and the inlet CH
4 molar flowrate equal to 1.08 g
cat·h·mol
CH4−1 in all simulations. The reactor dimensions, catalyst parameters and operating conditions employed are presented in
Table 3 (except
W). A total pressure of 2 bar was chosen in these simulations because the difference between CH
4 and CO
2 conversions is the smallest (
cf.
Table 7), which means that the occurrence of Reaction 3 (MD) is minimized.
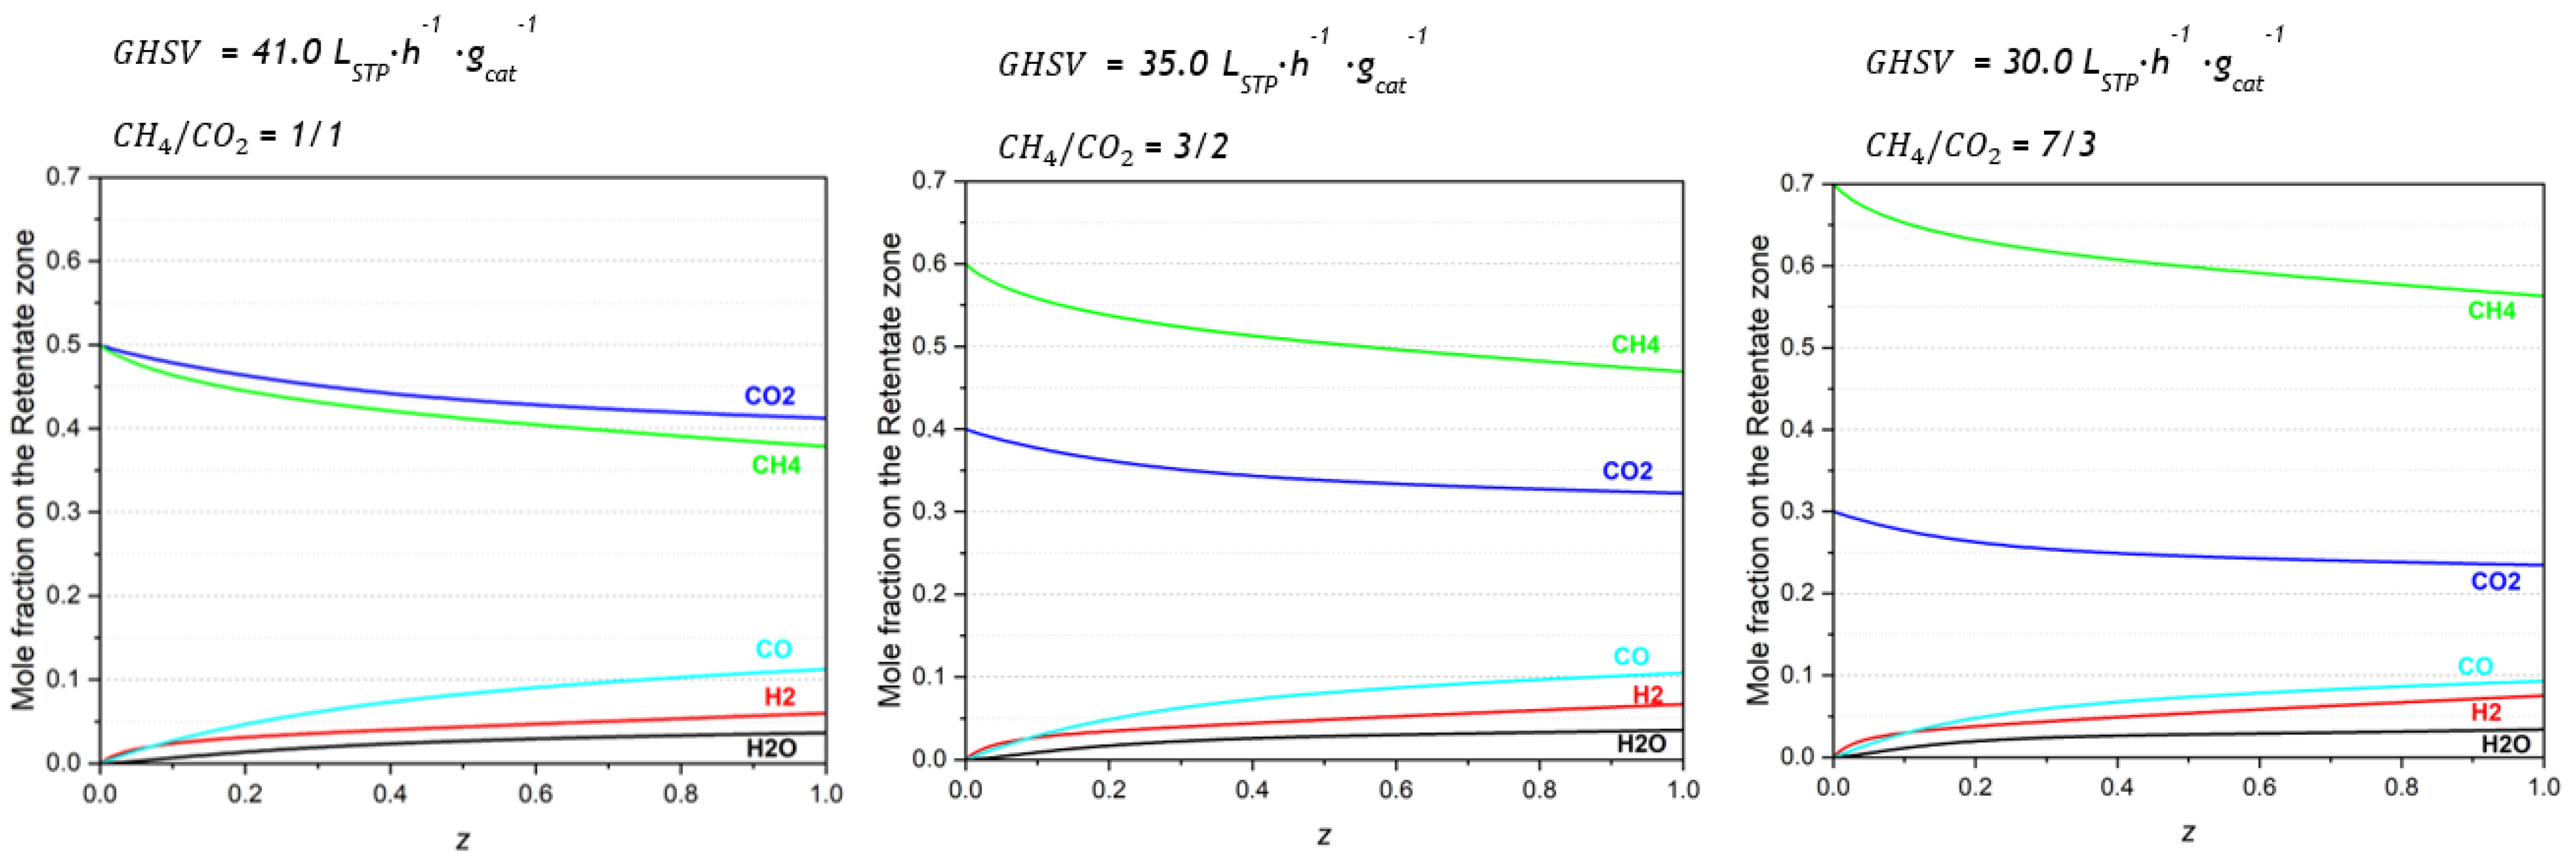
Three simulations were performed to evaluate the effect of biogas composition in the MR performance. The mole fraction profiles in the retentate zone are presented in
Figure 5. Additional figures are available in
Supporting Information (Figures S7 and S8).
The mole fraction profiles along the retentate length show that the outlet mole fraction of CO decreases while the H2 fraction increases with the increase in the CH4 fraction in the feed stream. For a 1/1 CH4/CO2 inlet molar ratio, the CO and H2 outlet mole fractions are approximately 11% and 6%, respectively, while for a 7/3 CH4/CO2 inlet, they are approximately 9% and 8%.
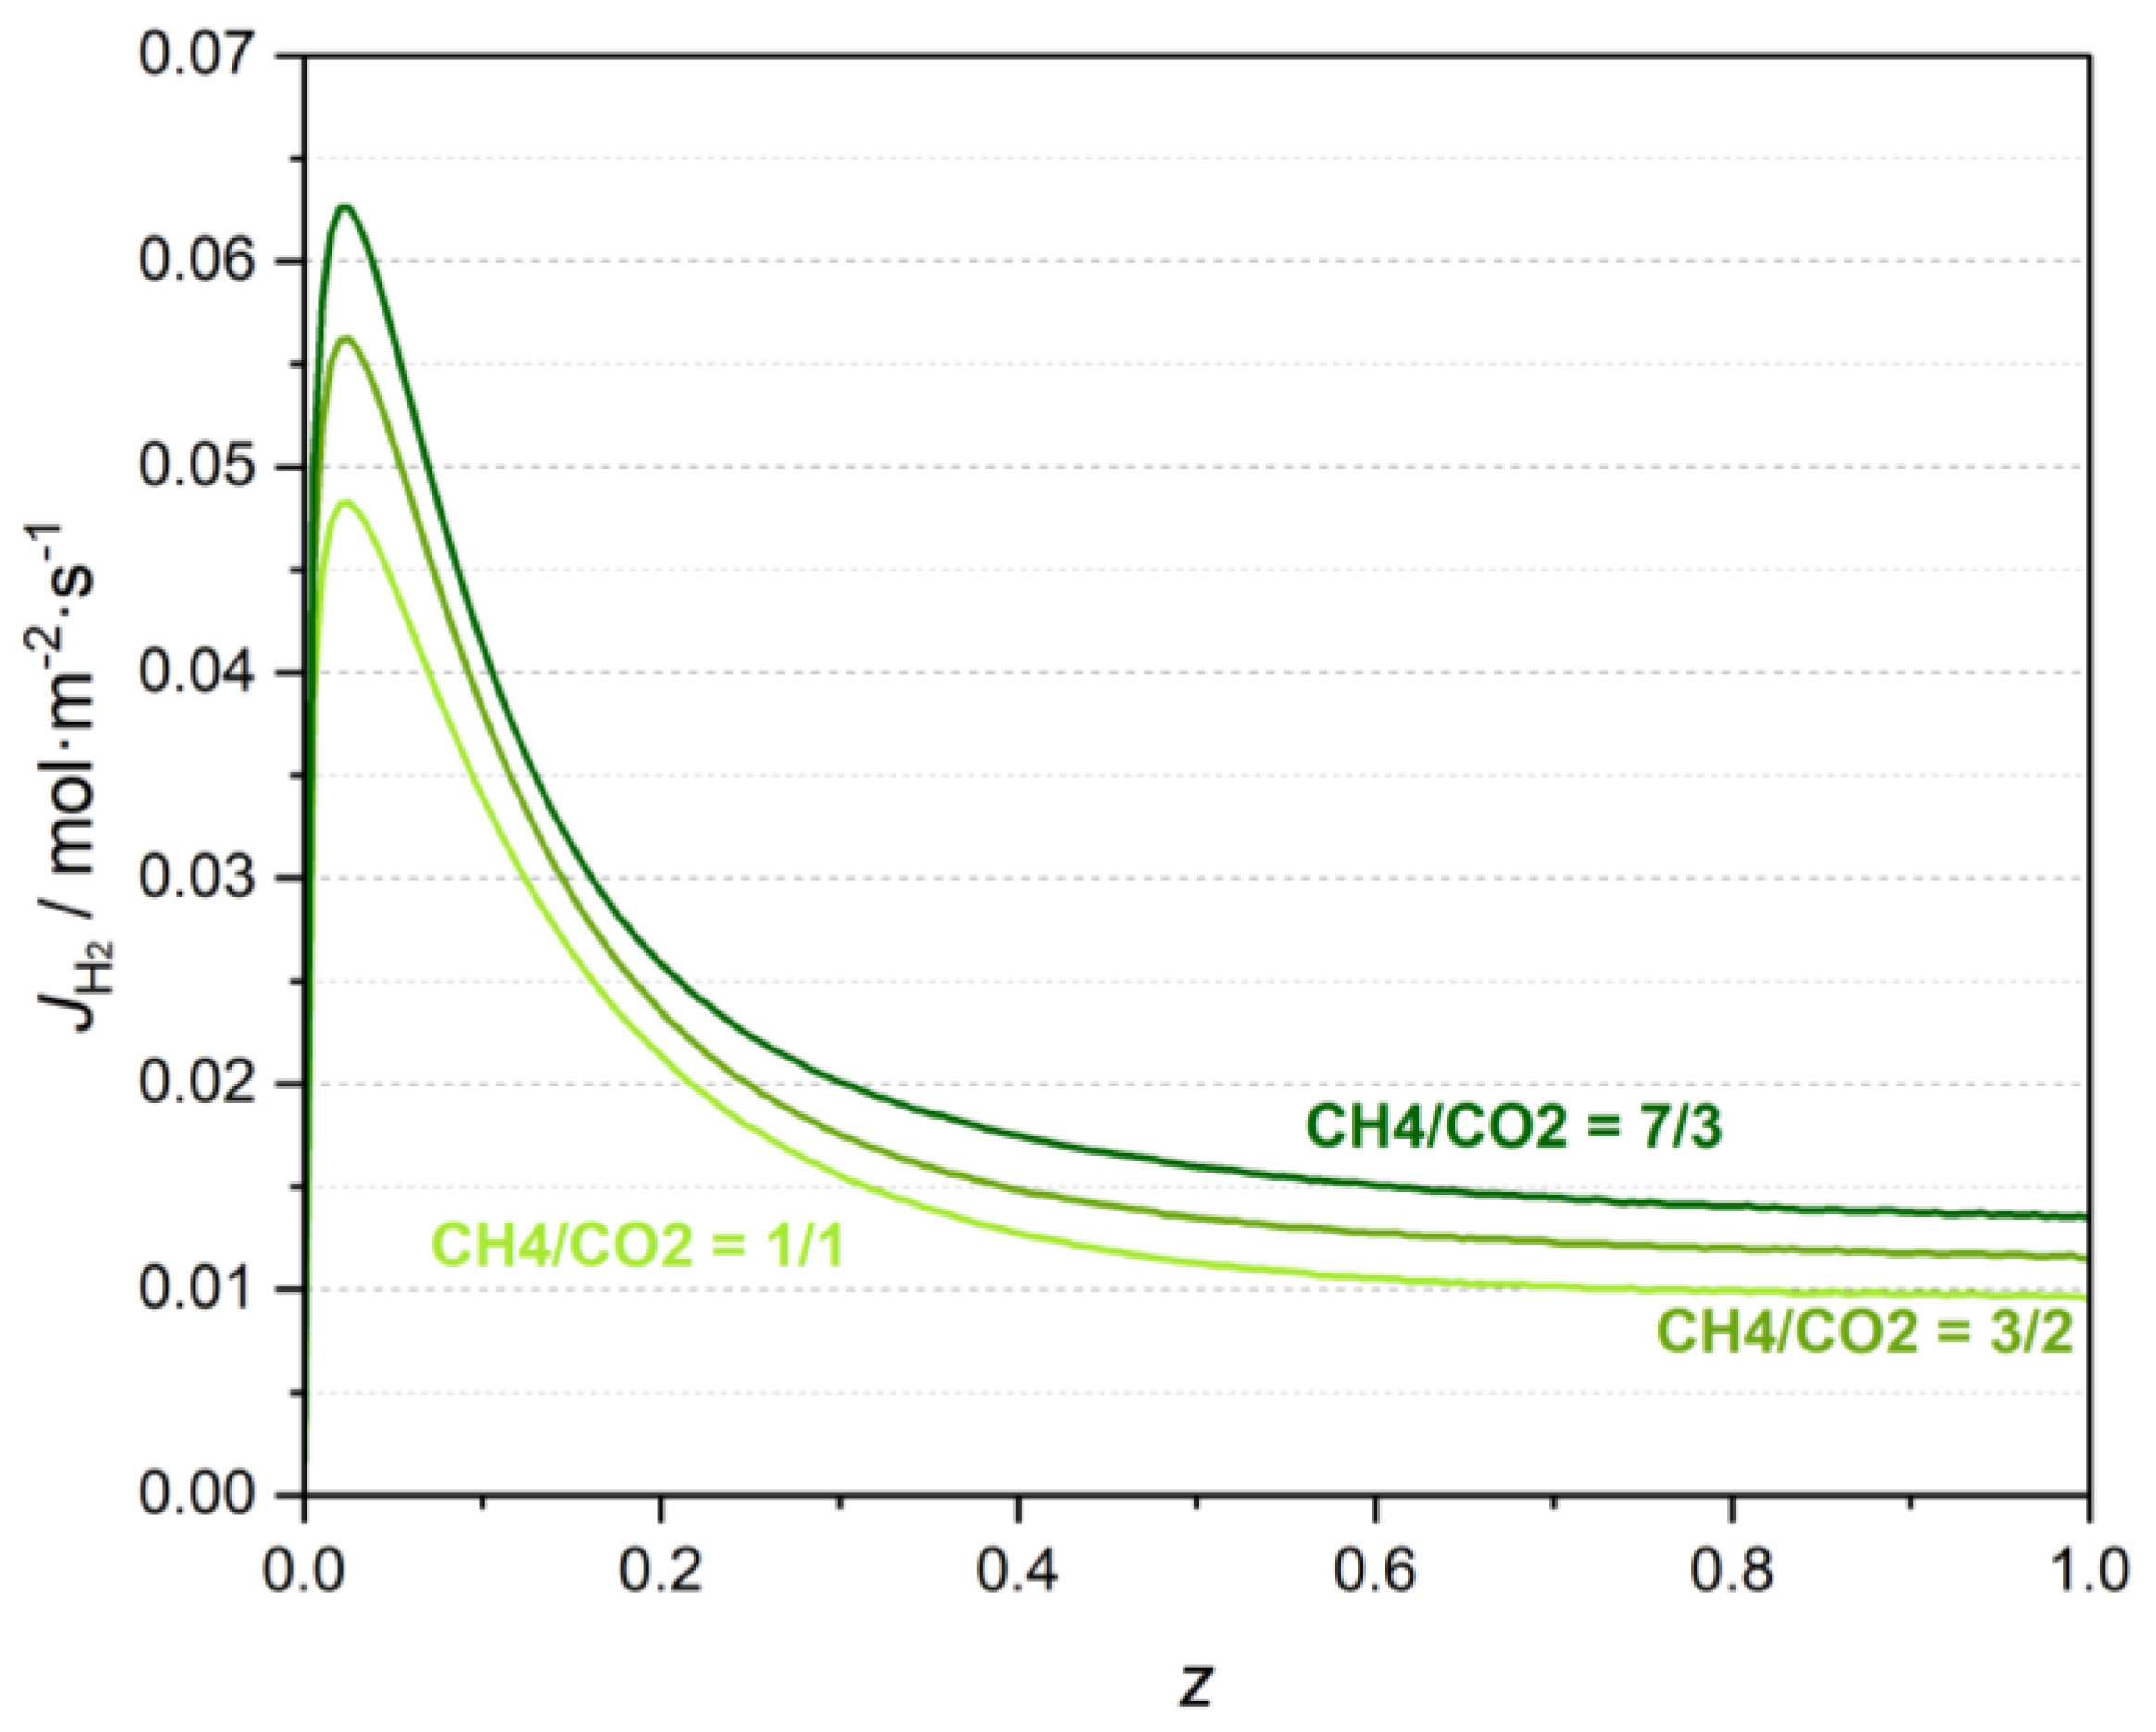
Figure 6 presents the H
2 molar flux profiles obtained considering different biogas compositions. It shows that the permeated H
2 molar flux also increases with the CH
4/CO
2 inlet molar ratio.
To evaluate the effect of biogas feed composition, the performance indicators were calculated for the three compositions, and the results are presented in
Table 9. It shows that the H
2/CO ratio increases and the H
2 yield slightly decreases for biogas feeds richer in CH
4. The H
2/CO ratio increased
ca. 56% from the feed CH
4/CO
2 ratio of 1/1 to the 7/3 feed ratio, while the H
2 yield only decreased
ca. 11%. The reason for increasing CO
2 conversions is the higher
W/
FCO2 ratio for feeds richer in CH
4. In addition, the recovery remained constant, which means that the CH
4/CO
2 inlet ratio does not affect the efficiency of the separation. Still, the permeate H
2 flowrate increased
ca. 30% (from the feed CH
4/CO
2 ratio of 1/1 to the 7/3 feed ratio) due to the increase in the total amount of H
2 produced.
3.2.4. Effect of CO and Membrane Thickness
Simulations of the MR were also performed using a thick Pd-Ag dense membrane presented in
Section 2.3. The advantage of simulating such an MR is the availability of the Sieverts–Langmuir equation parameters in the literature, which allows the study of the CO inhibiting effect on the H
2 permeation. Such data are not available for the thin membrane, wherein the CO inhibiting effect was discarded.
The MR was simulated using a feed temperature of 450 °C and 550 °C with and without considering the CO effect on the H
2 molar flux (i.e., considering the Sieverts–Langmuir or the Sieverts equation, respectively). The H
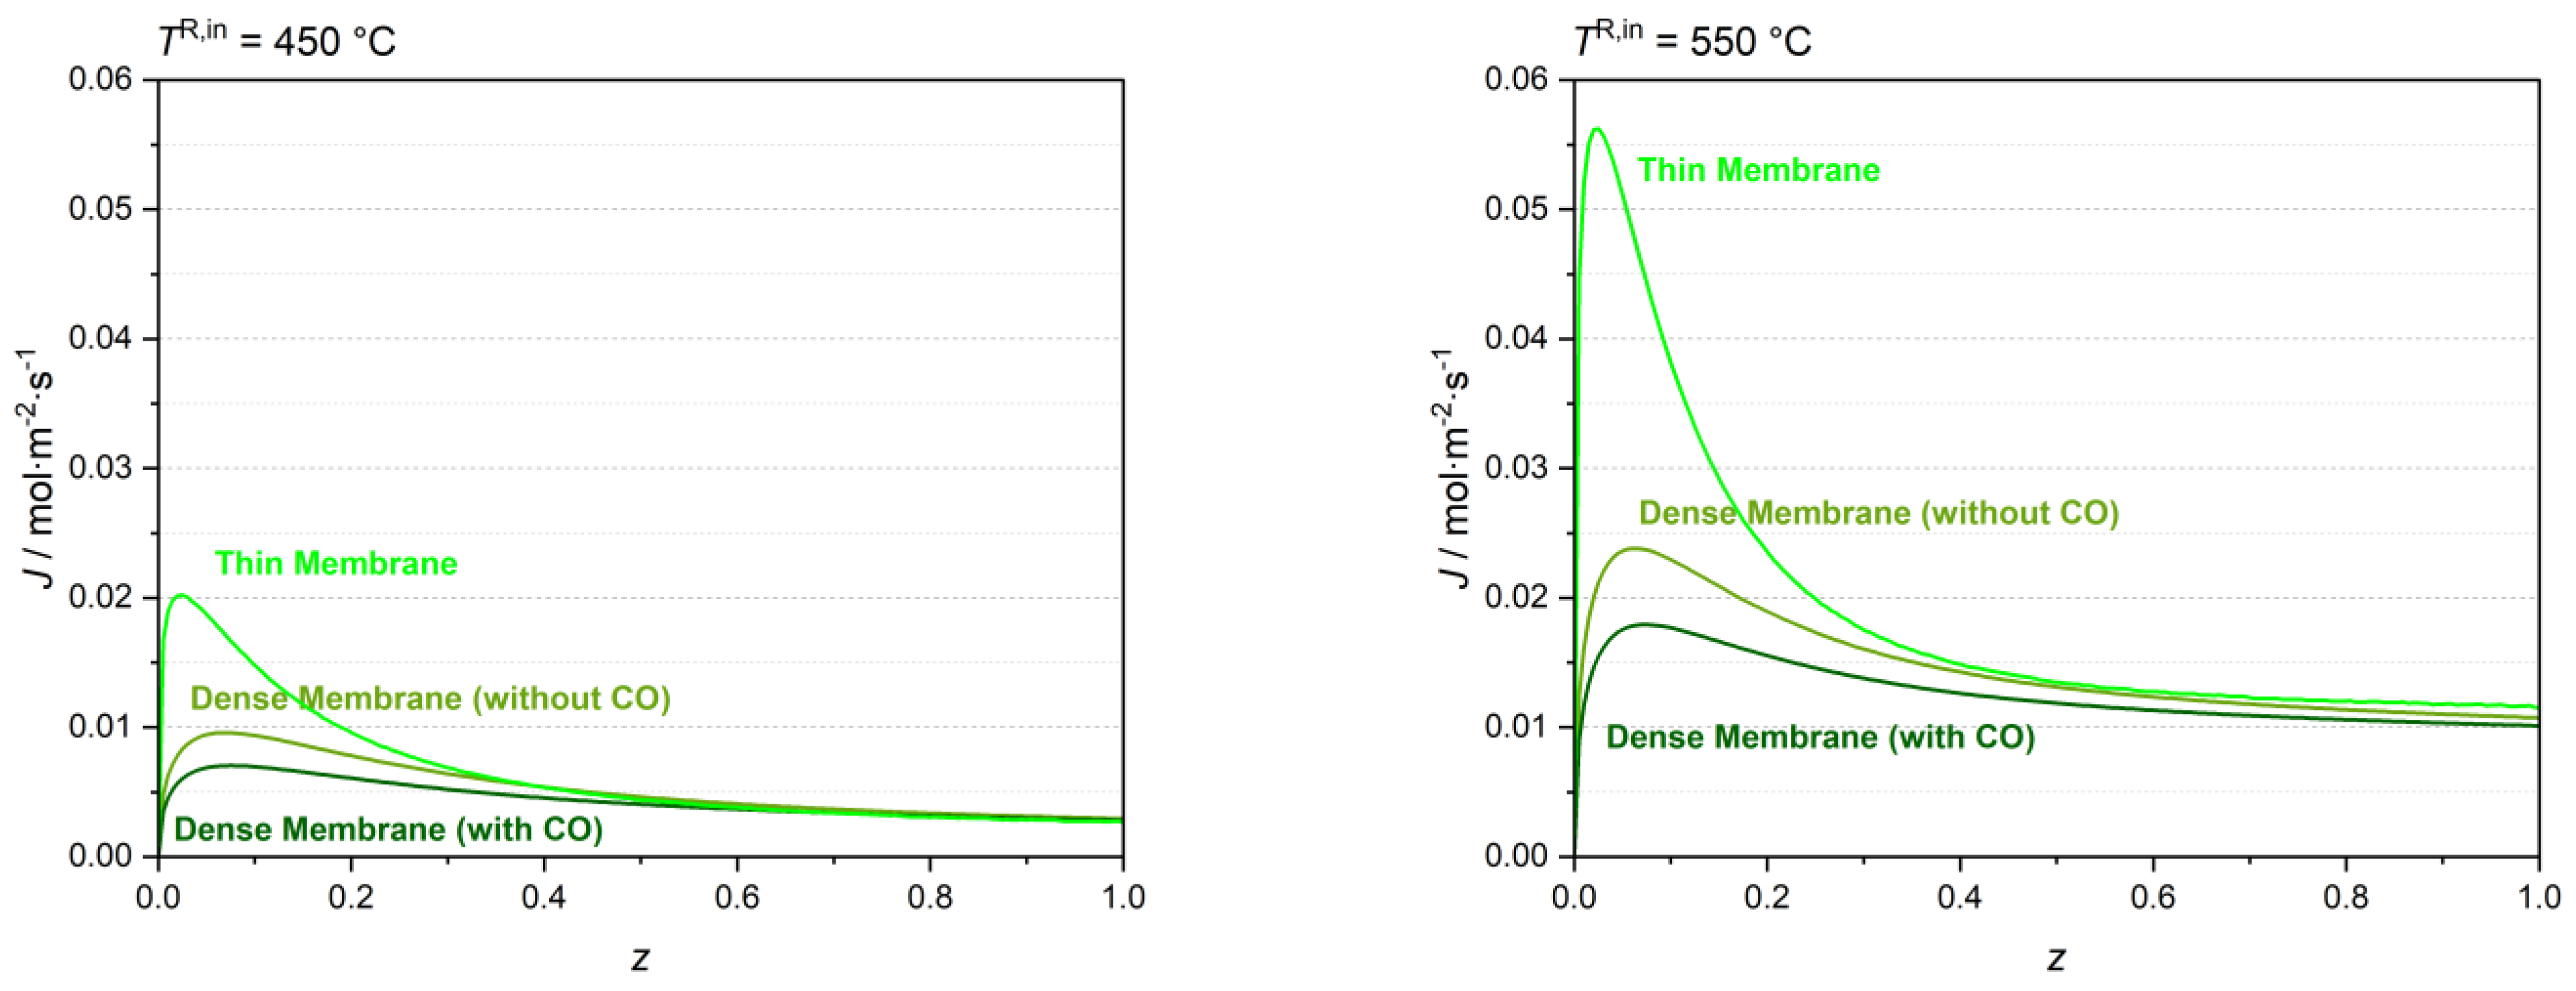
2 molar flux profiles obtained with both dense and thin Pd-Ag membranes at 450 °C and 550 °C are presented in
Figure 7.
The average molar flux reduction (i.e., calculated using the average H2 permeation fluxes along the membrane) for the MR with the dense Pd-Ag membrane considering the CO adsorption on the membrane surface is approximately 17% for a 450 °C feed temperature, and 14% for a 550 °C feed temperature. Thus, the inhibiting effect of CO on the membrane flux is significant at the temperature range considered, particularly at 450 °C where CO adsorption on the metallic membrane is more significant. The figure shows that the H2 molar flux is, however, two times higher for a feed temperature of 550 °C when considering the denser membrane. The H2 molar flux is considerably higher for the thin membrane.
To evaluate the effect of the CO inhibiting effect on the MR operation, the performance indicators were calculated and the results for the 550 °C feed temperature are presented in
Table 10. The table shows that when accounting for the CO inhibiting effect, the H
2 recovery decreases slightly (3%, absolute variation). In addition, the H
2 yield also slightly decreases because the shift in the forward direction of Reactions 1 (DRM) and 3 (MD) due to H
2 permeation is less pronounced. For the same reason, with the CO effect on the membrane properties, the equilibrium of the forward Reaction 2 (RWGS) should not be inhibited so extensively, increasing CO
2 conversion.
3.3. Comparison between Pd-Ag Thin Membrane Reactor and Traditional Reactor
In this section, TR and MR with a Pd-Ag thin membrane are compared at similar operating conditions. The selected feed temperature was 550 °C because the advantage of adding the membrane is more noticeable at this temperature as shown previously. The feed pressure of 2 bar was chosen because the CH4 and CO2 conversions are closest at this pressure, minimizing side reactions; finally, the chosen CH4/CO2 inlet ratio molar ratio was 3/2, which is a compromise between the highest H2 yield and the highest H2/CO ratio.
To compare the TR and MR operations, performance indicators were calculated for both simulations; they are presented in
Table 11. The detailed figures for the MR and TR simulations considered are presented in
Supporting Information (Figures S2 and S9).
Table 11 shows that CH
4 and CO
2 conversions are closer for the MR, which indicates that the side reactions are minimized. Although the CO
2 conversion is lower for the MR, the H
2 yield is significantly higher (increase of 66%). The H
2/CO ratio is also quite higher for the membrane device (increase of 83%). This indicates that Reaction 3 (MD) is favored in this reactor (
cf.
Table 12), which is, however, undesired due to coke formation. The use of other catalysts could solve this problem, but they are still under development [
15]. Another option would be to add steam to the feed stream since it mitigates coke formation [
12].
3.4. Membrane Reactor Design Considerations—Perspectives for Future Work
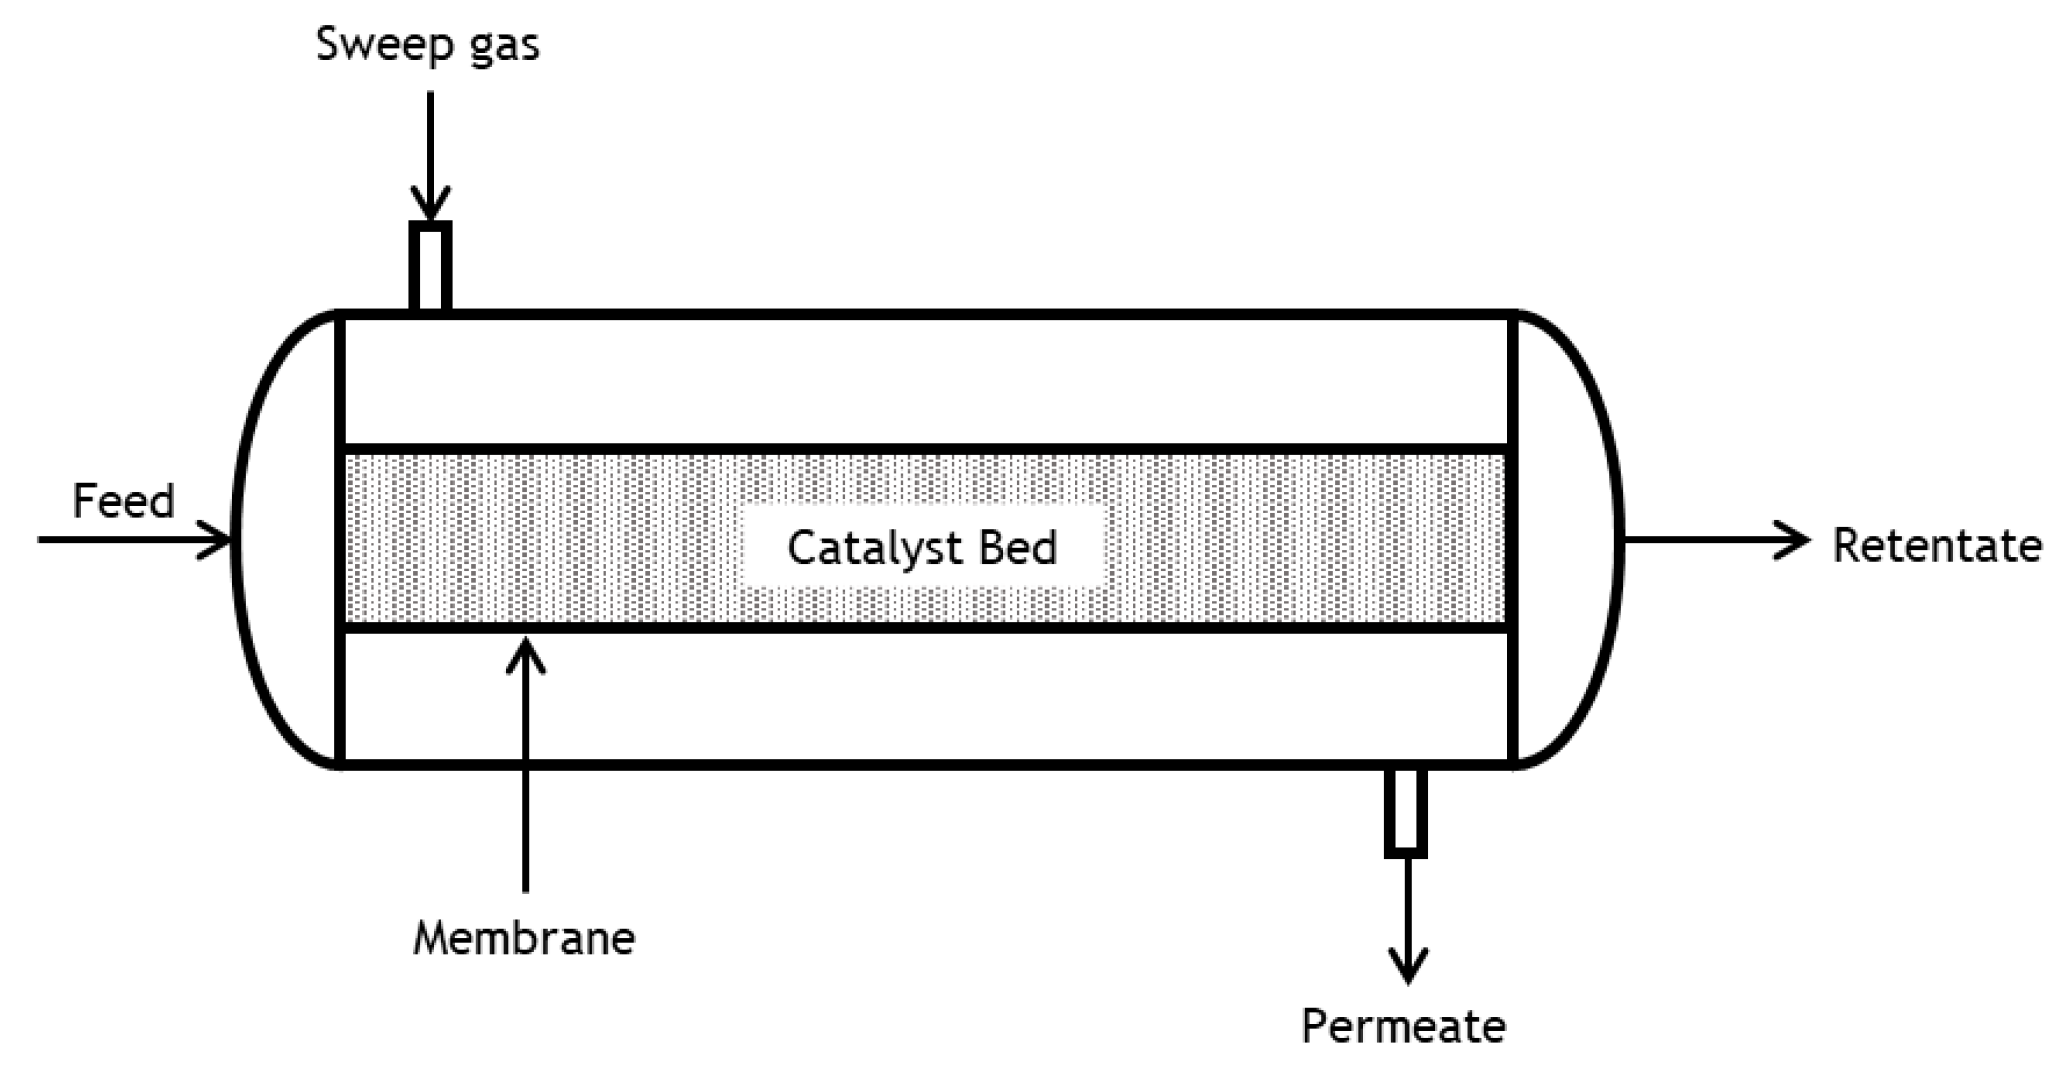
In this work, it was assumed that the feed and sweep gas streams delivered to the MR were at the same temperature and flow rate. However, it could also be interesting to study the effect of the sweep gas temperature. Indeed, since the DRM is an endothermic reaction, it may be beneficial to deliver the sweep gas at a temperature above that of the feed stream when considering a catalyst packing in the lumen of the membrane. Alternatively, one can consider placing the catalyst in the annular section and collecting the permeate in the lumen side, although catalyst loading/unloading in such configuration would be more challenging in practice.
The use of sweep gas aims to hold the H2 partial pressure in the permeate chamber low (ideally zero) along the MR length, basically to counterbalance the enrichment due to its permeation, which is particularly relevant for thin membranes (i.e., for higher permeation fluxes). However, the use of a sweep gas dilutes H2 and so an additional separation step is required. Therefore, the sweep gas type, its flow rate and feed mode (co-current or counter-current) should be carefully selected so that the sweep does not poison nor permeate through the membrane, nor the subsequent H2 purification step is difficult. Alternatively, vacuum can be used to increase the driving force for permeation without diluting H2, or the use of a sweep gas/vacuum be discarded for techno-economic reasons.
Finally, in this work, it was considered that H2 permeation was controlled by hydrogen bulk diffusion (i.e., following Sieverts’ law (n = 0.5)) based on data collected from the literature for both membranes. However, the occurrence of deviations to Sieverts’ law is also frequently reported in the literature due to additional mass transport resistances, for instance, in the porous support or due to the occurrence of concentration polarization (especially in the case of thin membranes). Hence, to conclude the discussion about the true potential of using Pd-Ag MRs for low-temperature dry reforming, all the considerations mentioned above should be further addressed, as well as the membrane and catalyst deactivation by coke and possible regeneration strategies.
4. Conclusions
The results for the MR simulated with a thin Pd-Ag membrane showed that CO2 and CH4 conversions and H2 yield notably increased with the feed temperature, while H2 recovery was somewhat constant (ca. 67%) in the temperature range studied (450–550 °C). With the feed pressure increase, in the range of 2–20 bar, the CH4 conversion increases from 20.3% to 25.8%, and the CO2 conversion decreases from 17.9% to 9.5%, enlarging the gap between them. Therefore, the reaction rate of MD was higher for higher pressures, increasing coke production. Higher H2 recoveries were achieved for higher feed pressures (up to 96% at 20 bar) due to the increasing driving force, while increasing the CH4/CO2 feed molar ratio led to higher H2/CO ratios (up to 2.49 for CH4/CO2 = 7/3) but slightly lower H2 yields (minimum of 16.5 % for CH4/CO2 = 7/3).
The simulation of an MR with a dense Pd-Ag membrane allowed the study of the CO inhibiting effect on the H2 molar flux through the membrane. The results for this reactor show that the average H2 molar flux significantly decreases (i.e., ca. 15%) in the temperature range considered.
Finally, the results obtained for the comparison of the TR and MR performance show that the RWGS can be inhibited and that the H2 yield and the H2/CO ratio increase in the MR. However, the average rate of coke formation is also higher for the MR, particularly at high pressure, which can in practice be minimized with the appropriate choice of a catalyst to employ and/or by conjugating dry with steam reforming.


