Article

Resistance of Ion Exchange Membranes in Aqueous Mixtures of Monovalent and Divalent Ions and the Effect on Reverse Electrodialysis

1
REDstack BV, Graaf Adolfstraat 35-G, 8606 BT Sneek, The Netherlands
2
Departmento de Ingenierías Químicas y Biomolecular, Universidad de Cantabria, Av. Los Castros 46, 39005 Santander, Spain
*
Author to whom correspondence should be addressed.
Membranes 2023, 13(3), 322; https://doi.org/10.3390/membranes13030322
Submission received: 16 January 2023 / Revised: 1 March 2023 / Accepted: 6 March 2023 / Published: 10 March 2023
(This article belongs to the Special Issue Honorary Issue for Prof João G. Crespo)

Abstract

:
Salinity gradient energy has gained attention in recent years as a renewable energy source, especially employing reverse electrodialysis technology (RED), which is based on the role of ion exchange membranes. In this context, many efforts have been developed by researchers from all over the world to advance the knowledge of this green source of energy. However, the influence of divalent ions on the performance of the technology has not been deeply studied. Basically, divalent ions are responsible for an increased membrane resistance and, therefore, for a decrease in voltage. This work focuses on the estimation of the resistance of the RED membrane working with water flows containing divalent ions, both theoretically by combining the one-thread model with the Donnan exclusion theory for the gel phase, as well as the experimental evaluation with Fumatech membranes FAS-50, FKS-50, FAS-PET-75, and FKS-PET-75. Furthermore, simulated results have been compared to data recently reported with different membranes. Besides, the influence of membrane resistance on the overall performance of reverse electrodialysis technology is evaluated to understand the impact of divalent ions in energy generation. Results reflect a minor effect of sulfate on the gross power in comparison to the effect of calcium and magnesium ions. Thus, this work takes a step forward in the knowledge of reverse electrodialysis technology and the extraction of salinity gradient energy by advancing the influence of divalent ions on energy recovery.

1. Introduction

Ion exchange membranes (IEMs) are of major importance in a huge variety of technologies, with their most important properties being permselectivity and resistance. These membranes are divided into heterogeneous membranes, which are made by mixing an ion exchange resin and a thermoplastic polymer, and homogeneous membranes, which have the ion exchange groups chemically bonded to a cross-linked backbone. Both heterogeneous and homogeneous membranes are not homogeneous at the micro-level: the charged groups form small vesicles of gel with water, and in the other places, it is the organic chains that stick together. These two phases are interspersed by an aqueous phase whose composition is reasonably believed to reflect the composition of the bulk in which the membrane is contained (Figure 1).
Initially, it was assumed that homogeneous membranes were also homogeneous at the micro-level. The membrane properties could then be reasonably predicted with the theory of the Donnan equilibrium. However, it was Gierke et al. [1] who conducted in-depth studies on perfluorinated Nafion membranes. Using X-ray studies, these authors proposed a model consisting of adjacent vesicles covered on the inside with a gel layer and an aqueous solution in the center. In 2001, Kreuer [2] published an article comparing Nafion membranes with sulfonated polyketone-based CEMs and concluded that the structure of both types was broadly similar.
In 1993, Zabolotsky and Nikonenko introduced a micro-heterogeneous model to describe the properties of these membranes, in which they concluded that ion transport through the membrane alternately takes place via the gel phase and the solution phase [3]. With this model, Berezina et al. were able to model and measure the electrotransport of water [4]. Extensive measurements were then performed by Sarapulova et al. on a variety of homogeneous as well as heterogeneous membranes involving divalent ions [5,6,7]. A wide range of measurement methods were used for this characterization.
Applications that use IEMs, cation, or anion exchange membranes (CEMs and AEMs, respectively) are strongly affected by the properties of membranes, particularly counter/co-permselectivity and resistance. Especially for energy harvesting from different salinity gradients with reverse electrodialysis (RED) technology, membrane resistance is a key factor [9]. If an IEM is immersed in water, the fixed groups are counterbalanced by oppositely charged ions with the same concentration. These counter-ions are more or less trapped by the fixed groups. In this sense, Imai and Onishi introduced the term counter-ion condensation for this process [10]. Fixed groups and counter-ions are surrounded by water and form the gel phase of the membrane. If the IEM is in equilibrium with a NaCl solution, a small amount of co-ions (ions with the same charge sign as the fixed ions) penetrate into the gel phase. Since electroneutrality is required, these ions are also accompanied be an equal number of counter-ions. Thus, conduction in the gel phase is facilitated by the transport of: (i) condensed counter-ions, (ii) excess (or ‘free’) counter-ions, and (iii) co-ions. Kamcev et al. calculated, for the diffusion constant of condensed counter-ions, a value of about 2–2.5 times higher than for the excess counter-ions [11]. Assuming that the theory about the condensed ions is not purely hypothetical and that there is a real difference between the two types of counter-ions, it is still difficult to distinguish between them in practice. Moreover, the concentration of the excess ions is much lower than that of the condensed ions, so that their possible influence on the conductivity is marginal.
When treating natural water sources, Mg2+, Ca2+, and SO42−, among other ions, may be present. In this context, previous works focused on the effect of divalent ions on the stack resistance and stack power density [12,13,14,15,16,17,18,19,20,21]. However, from measurements of stack resistance, it is difficult to discriminate the contribution of each of the four basic components of the stack, i.e., a CEM, an AEM, and the two feed water compartments, to the overall resistance. In contrast to this, the number of papers that focus on the effect of divalent ions on individual membranes is still very limited [6,7,15,18,22].
Nevertheless, to understand the principles of ion transport in an IEM, it is necessary to determine the molecular structure of such a membrane. It is striking that much research has been carried out on cation exchange resins and cation exchange membranes while significantly less work has been performed on anion exchange systems. Many efforts in the field have been performed to explain the structure of exchangers [23,24,25,26,27]. In this sense, these works performed ab initio calculations of systems of various monovalent and divalent cations together with fixed anions and determined the spatial structure of fragments around these ions. Soldatov et al. [27] reported calculations of the interactions between the counter-ions Na+ and K+ and the fixed groups of the carboxylate group (~COO) and the sulfonate group (~SO3).
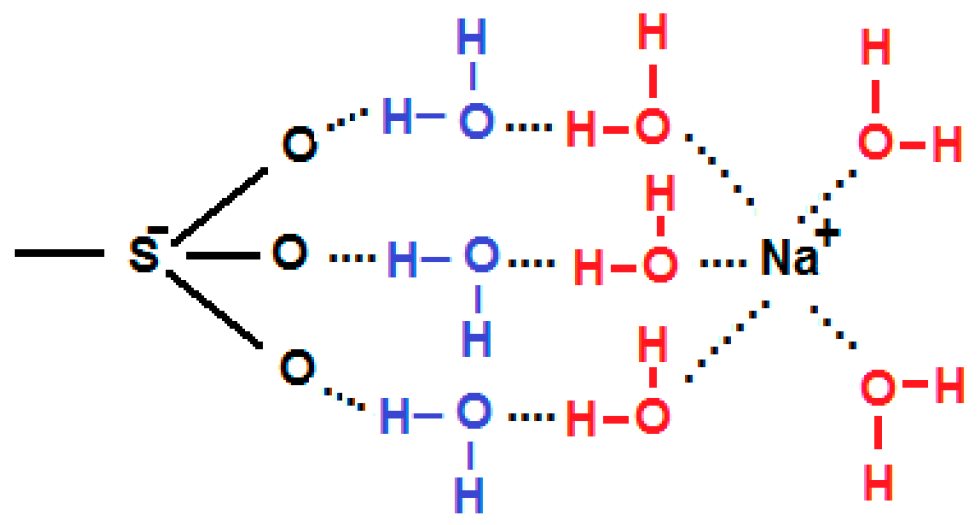
The nonexistence of a direct bond between a fixed sulfonate group and a sodium ion due to the strong hydration of the ion described by Soldatov et al. [27] agrees with the ab initio calculations of Shaposhnik and E. V. Butyrskaya [28]. These researchers found structures in which the sodium ion is connected to the sulfonate group through two intermediate water molecules. Both the sulfonate ion and the sodium ion are large enough to accommodate three adjacent bonds of this type, as seen in Figure 2.
Soldatov et al. [29] also performed ab initio calculations and arrived at roughly similar structures as Badessa and Shaposhnik [27]. In all these cases, the counter-ions are directly or indirectly bonded to the fixed groups. In the case of the trivalent ions, the bond distance is very short due to the large electrostatic action and the system can be compared with that in ion pairs.
In another publication, Badessa et al. [30] elaborated in more detail on the effect of the ion charge on the ion transport. The exchanging groups of conventional CEMs are in most cases singly charged. A monovalent counter-ion such as Na+ only needs to jump from one energy pit to another; in contrast, a divalent ion cannot jump in this way because it is forced to remain connected to one of the fixed groups throughout the transition.
The contribution to the conduction of each type of ion is the product of its concentration and mobility in the gel phase [3,4,31]. Mobilities of ions in aqueous solutions are well-known, but there is much uncertainty about the mobility in membranes. For lack of better results, some authors estimate these by a factor of 10 lower than in water [32].
In almost all published resistance measurements, the concentrations of the bulk solutions on each side of the membrane are equal, and only a few papers describe experiments with different concentrations [33,34]. Thus, in this work, we assume equal concentrations on both sides. Furthermore, most investigated divalent ions are Mg2+ and SO42−; unfortunately, less research has been carried out on the influence of Ca2+. It appeared that Mg2+ has more negative influence on the power density in a RED stack than SO42− [18]. This effect is probably attributed to differences in: (i) the electrical interaction between the ion and the fixed groups, (ii) the steric hindrance of the ion in the membrane matrix (iii), the transport mechanisms of the ion, or (iv) the hydrophobicity of the ion. Another reason could be assumed due to the properties of the fixed groups. In functionalized membranes with ~SO3 ions, most of the charge is located in the outer layer of the oxygen atoms, while in the case of functionalized membranes with ~NR3+, most of the charge is situated on the central nitrogen atom. This has consequences for coulombic interactions (ion–ion and ion-induced dipole).
In this context, this work first aims at advancing the knowledge of the contribution of divalent ions to membrane resistance, proposing different correlations as a function of the membrane nature, and second, at the quantification of the impact in salinity energy extraction, setting the basis for the future scale-up of the technology. It is important to mention that in this paper, we limit ourselves to resistance measurements regarding the individual membranes and power measurements in the complete RED stack. The ultimate goal is to gain insight into the entire behavior of the membrane under various conditions by means of a limited number of resistance measurements.

2. Materials and Methods

Model waters of different compositions were employed to prepare high- and low-concentration solutions, HCS and LCS, respectively [35,36]. For this purpose, sodium chloride (NaCl, assay > 99.5%) was acquired from Fisher Chemicals, magnesium chloride and calcium chloride were provided by Panreac (MgCl2·6H2O, assay > 98%), and sodium sulfate (Na2SO4, assay > 99%) was delivered by Scharlau. The divalent ions included were the typical ones presented in seawater (HCS) and wastewater treatment effluents (LCS).
In this work, 75 µm-thick and multivalent permeable membranes were employed (supplied by Fumatech, Bietigheim-Bissingen, Germany), which are exceptional to avoid fouling phenomena. Specifically, anion exchange membranes were based on bromide as the counter-ion and reinforced with polyethylene terephthalate, PET (FAS-75), and cation exchange membranes were developed with H+ as the counter-ion and were also supported with PET (FKS-75). All the tests were carried out, at least in triplicate, at 297 ± 1 K at 1 cm·s−1 as linear velocity. The experimental setup was described in detail in recent works [37,38].
The membrane resistance, one of the most critical parameters when divalent ions are present in water streams, was carefully determined through electrochemical impedance measurements (EIS). These trials were performed with the electrochemical workstation Zennium (Zahner, Kansas City, MO, USA) in potentiostatic mode. The system has six connectors: a counter electrode, a working electrode, a reference electrode, a working electrode sense point, and two probes. Before electrochemical measurements, the membranes were equilibrated in salt solutions for at least 24 h at 297 ± 1 K. EIS experiments were carried out following a direct-contact method, using an electrode surface area of 1.306 cm2 and generating an electric current in a frequency range of 100 Hz to 4 MHz, with a signal amplitude of 10 mV. For each solution, the experiment was replicated at least three times, changing the membrane sample. After each experiment, the electrode surface was properly cleaned with deionized water to remove the salt remnants.
Besides, the membranes were tested in a RED module (provided by Fumatech), assembled with 20 cell pairs (FAS-75 and FKS-75), using woven spacers of 270 µm with a porosity of 92.5% to demonstrate the membrane impact into salinity gradient energy extraction. The experimental setup used for this purpose has been described in detail in previous works [22,36,37,38].
In addition to the above experiments, other data have been collected from relevant publications dedicated to testing the resistance model (as described in Section 3) and have been used to validate the model. These data (concentrations and area resistances) are included in the Supplementary Materials.

3. Model of Ion Transport in Ion Exchange Membranes

The model developed in this paper describes the membrane resistance in terms of ionic concentrations and mobilities in the gel phase. A resistance measurement of a membrane with area A (cm2) and thickness d (cm) resulted in a resistance value R, measured in ohm (Ω). From these values, the specific resistance (Rspec) and the area resistance (Rarea) can be estimated as:
R s p e c = R A d   Ω · m   ;   R a r e a = R · A   Ω · m 2
The specific resistance, Rspec, is a material property, independent of the membrane thickness, whereas the area resistance, Rarea, is a measure for the membrane performance. In membrane literature, Rarea is usually expressed in Ω∙cm2.
To quantify the effect of the salt mixtures (with n different ions) on the membrane resistance, measurements for any given membrane should be performed at least with an n + 1 different bulk composition, and preferably much more. For simplicity, we expressed all concentrations in equivalents per liter (eq/L).
With the model, the relative mobilities of ions in a given membrane can be determined. The procedure presented here for a specific dataset involves the following steps:
i.
Calculation of the concentrations of the ions in the gel from the known bulk concentrations using the Donnan theory.
ii.
Assignment of known mobilities to the ions in the solution phase and provisional values to the ions in the gel phase.
iii.
Assignment of provisional factors (‘phase factors’) to the conductivity of the gel part and the solution part.
iv.
Estimation of the membrane resistance using the one-thread model [8].
v.
Fitting the calculated resistances to the experimental values by adjusting the gel phase mobilities and the phase factors.
Assuming that the composition of the internal solution phase is the same as that of the bulk solution, the ion concentrations in the gel phase are obtained from the Donnan equilibrium:
C i g e l C i s o l = K i z i
where Cisol corresponds to the different ion concentrations in the solution phase (and equal to the concentrations in the bulk solution) and Cigel corresponds to the concentration of these ions in the gel phase. K is the Donnan equilibrium constant and the exponent zi is the charge of ion i. For example, with a mixture of NaCl and MgCl2, there are three such relations with four unknowns: three ion concentrations and the value of K. To be able to solve this system, a fourth relation is needed, and for this purpose, the electroneutrality equation is used:
C D + i C i g e l z i = 0
with CD being the charge density of the membrane (in eq/L) and zi the charge of species i (in this case, +1 or −1 because C is expressed in eq/L). The charge density can be achieved from the published membrane properties: swelling degree (SD), the ion exchange capacity (IEC), and the density of the dry membrane (ρ):
C D = ρ I E C S D
For practical use, ρ = 1 kg/L can used. According to Figure 1b, the total membrane resistance (Rmem) is the sum of the gel contribution (Rgel) and the solution contribution (Rsol):
R m e m = R g e l + R s o l
The resistance can be expressed in Ω (resistance), Ω∙m (specific resistance), or Ω∙m2 (area resistance). The conductivity, κ (S/m), of an ionic solution can be calculated as:
κ = F i C i λ i
where F is the Faraday constant (96,485 C/mol), Ci is the concentration of the ionic particle i (eq/m3), and λ i is its ionic mobility (m2∙s−1∙V−1). Ionic mobilities in aqueous solution are well-known and summarized in Table 1.
It should be noted that the mobility, λi, and the diffusion constant, Di, of ions are closely related [40]:
D i = k T Q i λ i
where k (J∙K−1) stands for the Boltzmann constant, Q (C) for the charge, and T (K) for the temperature. For a sodium ion at 298 K, this expression yields D = 1.33∙10−9 m2/s. The resistance, Rsol (Ω), of the solution part of a membrane is then:
R s o l = R f s o l i C i s o l μ i s o l
The values of the fitting factors Rfsol and Rfgel depend on the structural characteristics of the membrane (fraction of solution and gel phases, tortuosity, membrane thickness, etc.), and Cisol stands for the concentration of ion i in the gel phase. A similar expression can be derived for the gel part of the resistance, resulting in the following expression for the total membrane resistance, Rmem:
R m e m = R f g e l i C i g e l μ i g e l   + R f s o l i C i s o l μ i s o l
Following this procedure, it is not possible to determine the individual value of Rfgel together with the ion mobilities in the gel phase of the membrane. However, the relative value of these mobilities, φigel, can be calculated by setting Rfgel = 1. Thus, the following expression is used to determine the relative values of the ion mobilities in the gel phase:
R m e m = 1 i C i g e l φ i g e l   + R f s o l i C i s o l μ i s o l   with   φ i g e l = μ i g e l R f g e l
The φigel values and Rfsol are found by fitting the calculated Rgel values to the experimental resistances. From the membrane mobilities and membrane concentration, it is now possible to determine the transport numbers in the gel phase for ED or RED applications:
t i = C i g e l φ i g e l i C i g e l φ i g e l
Some restrictions of the former procedure are as follows: (i) the concentrations of the co-ions in the gel phase are very low due to the Donnan exclusion, and therefore, the influence of co-ions on the total conductivity of the membrane is marginal and the values obtained for the mobilities are of little validity, and (ii) the same applies to the transport numbers, as calculated with these mobilities. However, the fitting process provides a good insight of the relationship of the mobilities of the counter-ions in the gel phase.

4. Results

This section presents and discusses the main results obtained in the application of the ion transport model to describe the influence of divalent ions on membrane resistance.

4.1. Estimation of Membrane Resistance

Different membrane resistance measurements were developed according to Table 2 using the EIS method described previously. Equal concentrations on both sides of the membrane were applied. The values with only NaCl salt in the HCS were 5.09 Ω·cm2 and 3.20 Ω·cm2 for FKS and FAS, respectively, and therefore, cations have more influence in the overall membrane resistance. In this regard, when MgCl2 or CaCl2 were included in the HCS, the values increased to 10.58 Ω·cm2 and 7.97 Ω·cm2, respectively. The main reason resides in the fact that when a cation exchange membrane is exposed to a solution containing divalent cations such as Mg2+ or Ca2+, these cations can bind to the negatively charged functional groups on the membrane, reducing the number of available exchange sites for monovalent cations such as Na+. This reduces the number of ions that can pass through the membrane and, therefore, increases the membrane resistance. The reason for this effect is that divalent cations have a higher charge density than monovalent cations, which means they can attract and bind to a larger number of negatively charged functional groups on the membrane. This reduces the number of available exchange sites for monovalent cations, leading to a decrease in the exchange rate and an increase in the membrane resistance. However, including Na2SO4 does not reflect remarkable changes in the FAS membrane due to the fact that the charge density of SO42− is similar to that of Cl, and both anions can be exchanged by the positively charged functional groups on the membrane.
In the case of including high concentrations of divalent ions in the HCS, in terms of primary divalent ions, the final values were 11.69 Ω·cm2 and 3.25 Ω·cm2 for FKS and FAS, respectively. In the case of LCS, the values measured were 6.33 Ω·cm2 and 3.76 Ω·cm2. The upper values of LCS were in accordance with previous values reported in the literature, where membrane resistance increased with the decreasing NaCl concentration [3,4,5,6,7,17,22,41]. Besides, in the case of LCS, when divalent cations were added, 0.0024 M of MgCl2 and 0.002 M of CaCl2, the membrane resistance sharply increased until 29.39 Ω·cm2. In the case of FAS, the membrane resistance grew slightly when 0.0014 M of sodium sulfate was introduced in 0.0186 M of NaCl, but as in the case of HCS, the variation could be considered negligible. The values presented in this work were higher than previous values reported in the literature [22], especially for the cationic exchange membrane, probably due to the reinforcement applied to obtain better stability. However, according to the supplier information, PET promotes more stability at longer periods (years) than other membranes and facilitates the stacking of more membrane pairs. This point is crucial to the system scale-up and to achieve a higher technology readiness level. Moreover, it is important to highlight that the membrane resistance, to extrapolate to salinity gradient extraction, should be calculated as the mean value of high- and low-concentration solutions for each type of membrane, cationic exchange membrane, and anionic exchange membrane, respectively.

4.2. Application of the Ion Transport Model

Publications about membrane resistance in solutions containing mixtures of mono- and di-valent ions are very scarce, but the model developed throughout this work has been validated with previously reported data. In Table 3, the main results of the fitting procedure are listed. Normalized mobilities are relative mobilities and are calculated as fractions of all mobilities together. It should be emphasized that the values of the normalized mobilities of the co-ions in the membrane are unreliable, due to their low concentrations, as explained before. The fitting procedure is performed with a number of normalized mobilities and a phase factor; in the case of experiments c and d in Table 3, the total adjustable parameters (k) are 6. Also shown are the coefficients of determination (R2). With a restricted number of experiments, the adjusted coefficient of determination (R2adj) is a better indicator of the performance of the method. It is calculated according to the next equation [42]:
R adj 2 = 1 1 R 2 n 1 n k 1
Here, n is the number of data points and k is the number of adjustable parameters. An in-depth discussion regarding the main findings is presented below.
Table 3 presents the normalized mobilities of various ions in the gel phase of the membranes under consideration. The use of normalized values allows for better comparison with data from other publications using the mobility ratios of mono- and di-valent counter-ions. Co-ions were not considered due to their low reliability in the fitting procedure as a result of their low concentration in the gel phase. The diffusion constant ratios of the gel phase were obtained using Equation (7) and are presented in Table 3.
Since the ionic mobilities in aqueous solution are comparable (Table 1), the mono/di-valent ratio of diffusion constants in water is approximately 2. For cations, the ratios in the gel phase are expected to be higher due to the larger radius of divalent ions, which restricts their movement. With anions, the difference in the ionic radius is smaller, and the divalent co-ions are more strongly repelled by the fixed charges, leading to less hindered movement. In some cases, this effect can even result in a higher mobility of divalent co-ions than monovalent co-ions. Table 3 also shows values of the diffusion constant ratios.
Although no direct comparison material was found in the literature, Sarapulova et al.’s excellent work [42] provides ĐNa+/ĐCa2+ values of 17, 6, and 2 for the homogeneous membranes CMX, CJMC-3, and CJMC-5, respectively. The Neosepta CXM (Astom Corporation, Japan) can be considered a standard CEM, while both CJMC membranes are relatively new membranes from Hefei Chemjoy Polymer Material Co. Haidian in China.
Data from another paper by Sarapulova et al. [6] were used to obtain the gel diffusion ratios of anions. The values of ĐCl/ĐSO42− for the membranes AMX, AMH-PES, CJMA-3, CJMA-6, and CJMA-7 are 3.3, 2.5, 2.5, 1.4, and 1.7, respectively. The well-known Neosepta AXM (Astom Corporation, Shunan, Japan) and the CJMA membranes (Hefei Chemjoy Pololymer Material Co., Hefei, China) are homogeneous AEMs, while the AMH-PES (Mega a.s., Stráž pod Ralskem, Czech Republic) is a heterogeneous AEM. The diffusion ratios of our studied membranes, FAS-PET-75 and FAS-50 (ĐCl/ĐSO42− is 2.6 and 3.3), fell within this range. However, the value of the AMX membrane (ĐCl−/ĐSO42− = infinity) seems to be an outlier.
Table 3. Results of the fitting procedure. Values of the normalized mobility of counter-ions in the gel phase of the membrane are shown in blue. Values of co-ions (in red) are less reliable. Also listed are the charge density (CD), the number of data points (n), and the number of adjustable parameters. R2 is the coefficient of determination and R2adj is the adjusted coefficient of determination. N.R. = not reported. Also shown are the ratios of the mobilities of mono- and di-valent ions in the gel phase and the ratios of the concerning gel diffusion constants.
Exp.MembraneTypeCD (eq./L)Ref.MethodSalts Employed nkR2R2adj.Normalizad Mobility in the Gel PhaseRatio Counter-Ion Mobility in the Gel PhaseRatio Diffusion Constants in the Gel Phase
NaClMgCl2CaCl2Na2SO4MgSO4Na+Mg2+Ca2+ClSO42−Na+/Mg2+Na+/Ca2+Cl/SO42−Na+/Ca2+Cl/SO42−Na+/Ca2+
aCMXCEM9[33]AC+730.9990.9990.9760.024---
bCMXCEM9[33]DC+730.9990.99910---
cFKS-PET-75CEM5.5This workEIS++++1060.9970.990.7710.0850.1160.02909.16.718.213.4
dFAS-PET-75AEM9This workEIS++++1060.9530.8590.220.75400.0140.011--1.32.6
eFKS-50CEM8.7[22]EIS+++1850.92330.8910.6790.1510.170-4.54-98
fFAS-50AEM10.3[22]EIS++1040.9640.9350.8440.0980.0591.73.3
gFuji-CEM-80050CEM2.4[15]EIS++740.9220.7670.63500.365-
hCMXCEM9[18]NR++650.9980.3150.03300.6529.519
iAMXAEM7.8[18]NR++650.950.99400.0060

4.2.1. Fumatech Membranes

Two types of membranes with different thicknesses from the same manufacturer, Fumatech, were evaluated following the model procedure. In the first case, the fitting was employed to predict the values obtained experimentally using FKS-PET-75 and FAS-PET-75.
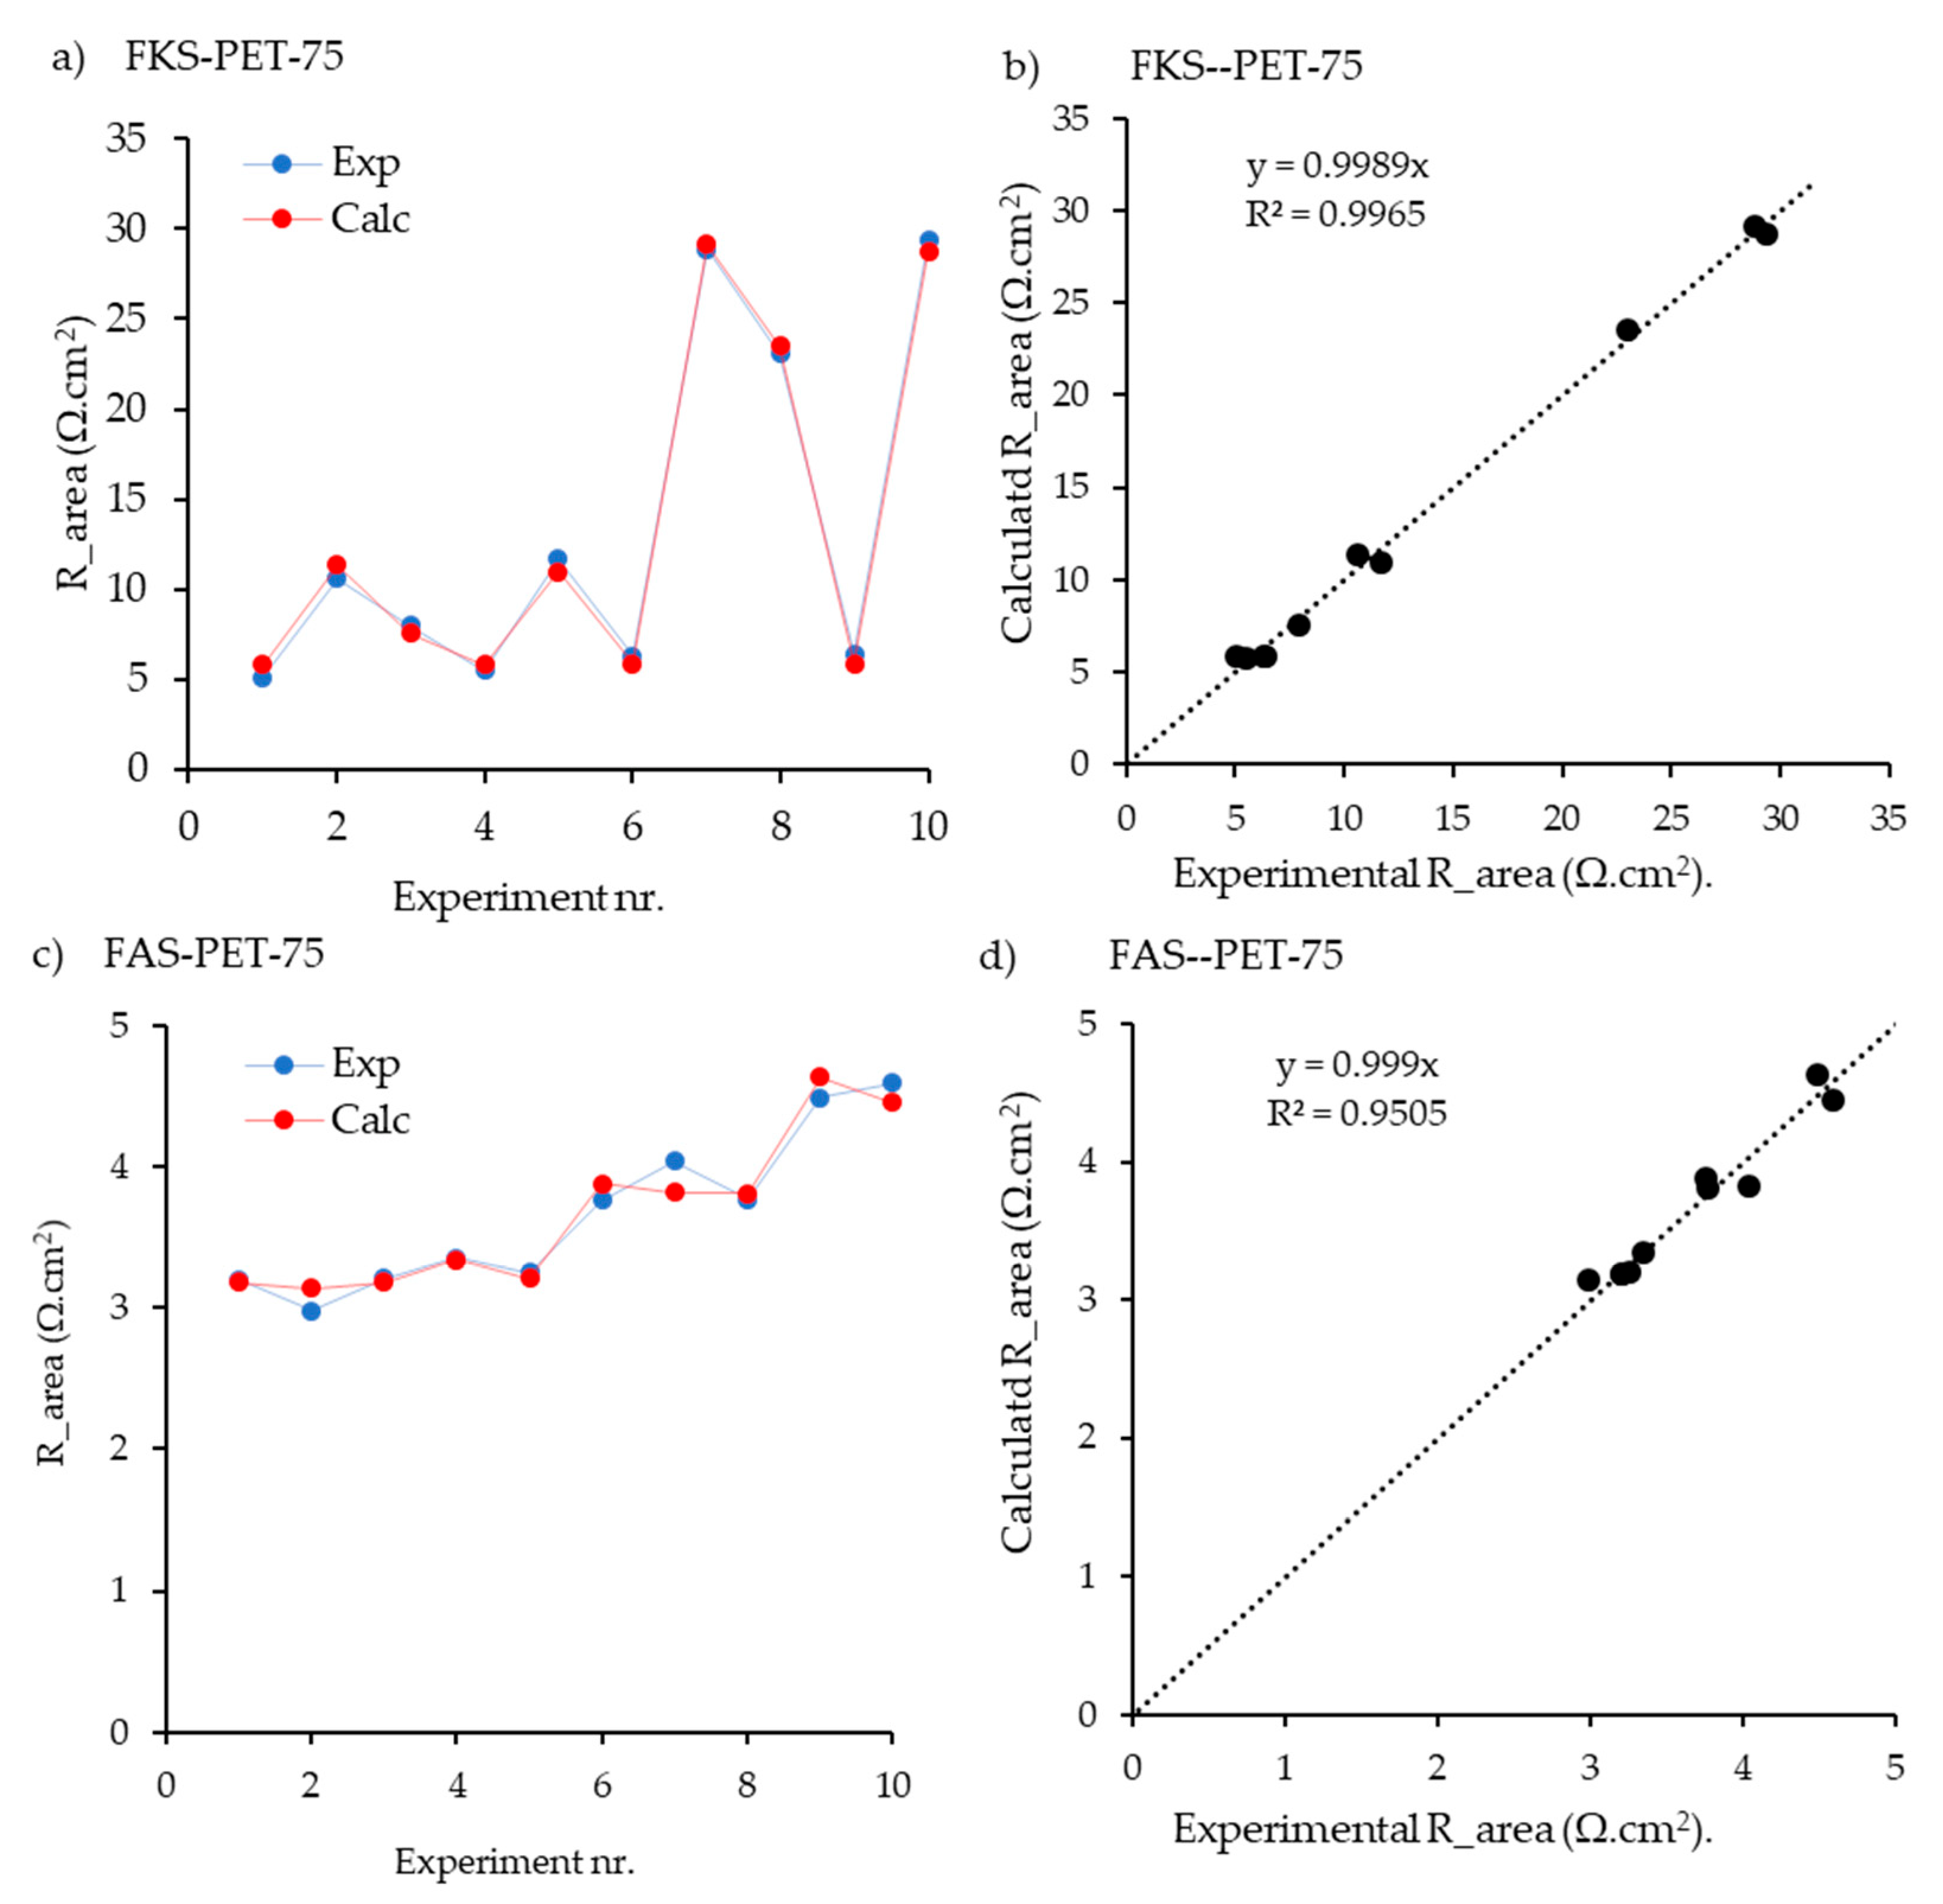
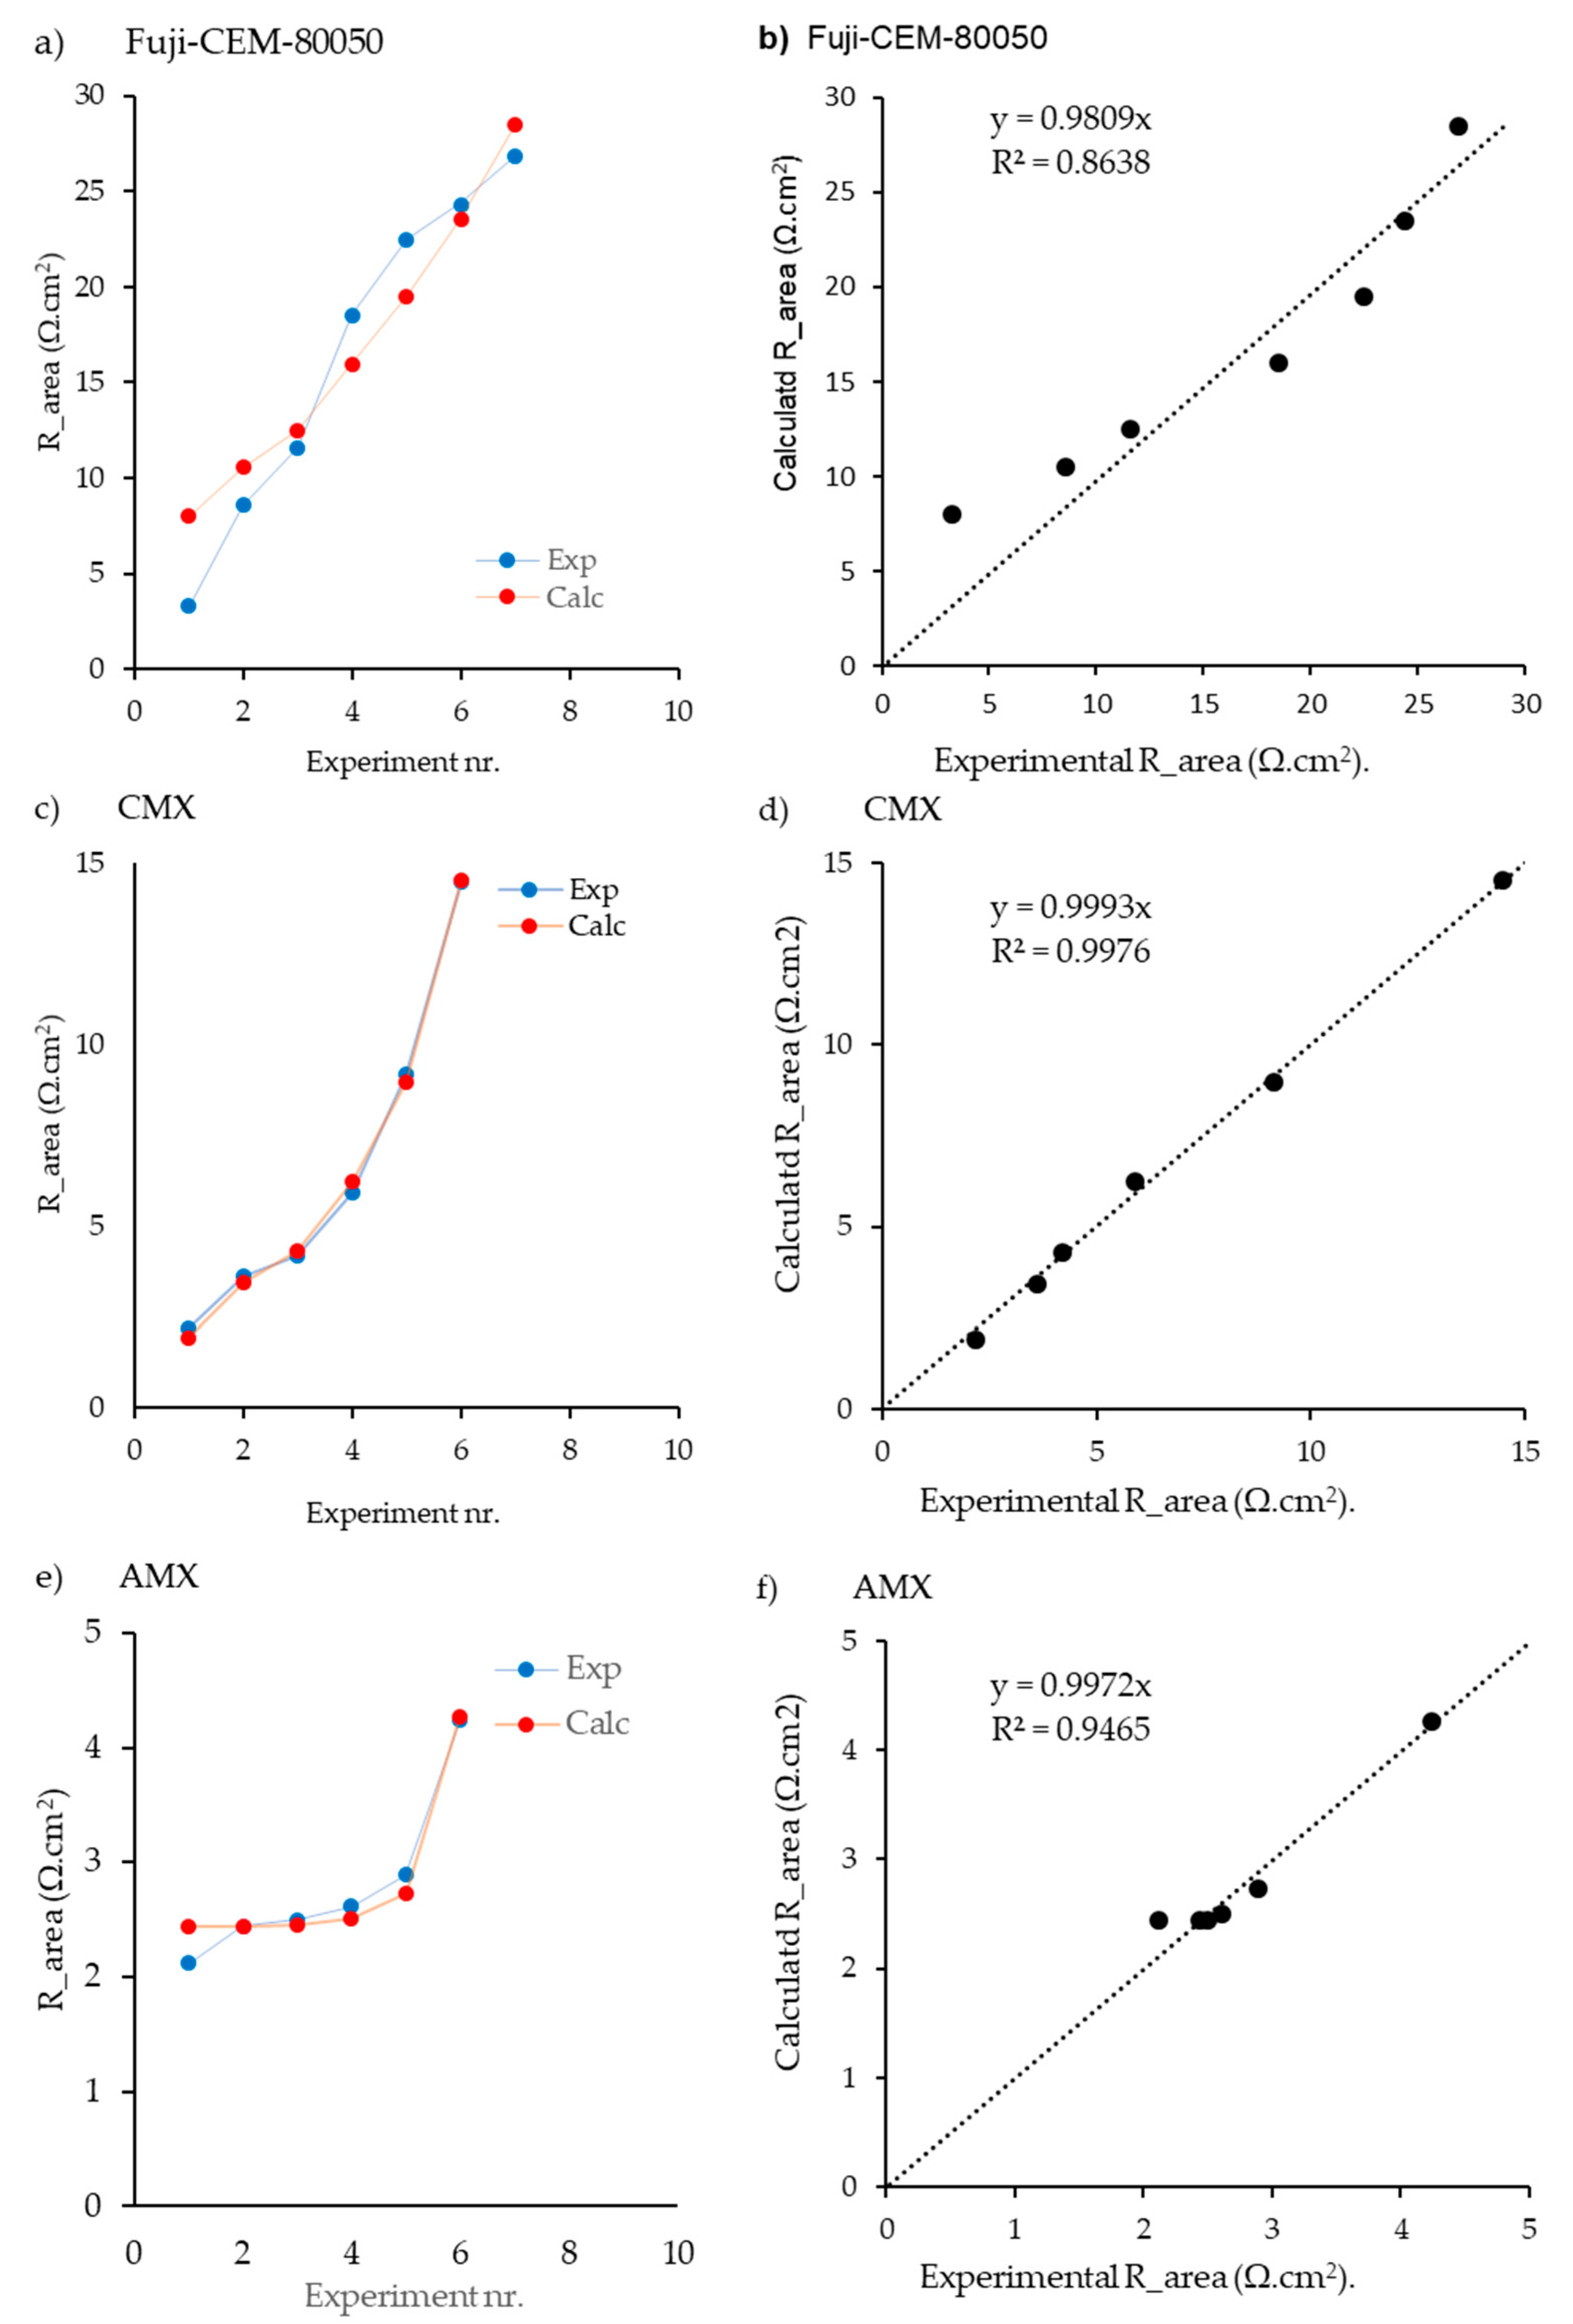
The input data used for the model development are collected in Table 2. Different combinations of NaCl, MgCl2, CaCl2, and Na2SO4 were prepared for the estimation. In Figure 3a,b, the experimental and calculated values of Rarea are plotted for the various experiments, as tabulated in Table 2, whereas in Figure 3b,d, the correlations between the calculated and experimental values are shown. The figures show that the calculated values practically overlap the experimental values. However, despite the fitting being adequate, the relatively limited number of measurements (7) compared to the parameters to be adjusted (5 ion mobilities plus a phase factor) require future work to support model predictions. Besides, it is essential to remark that the parity plot demonstrates the high R2 obtained for both AEM and CEM.
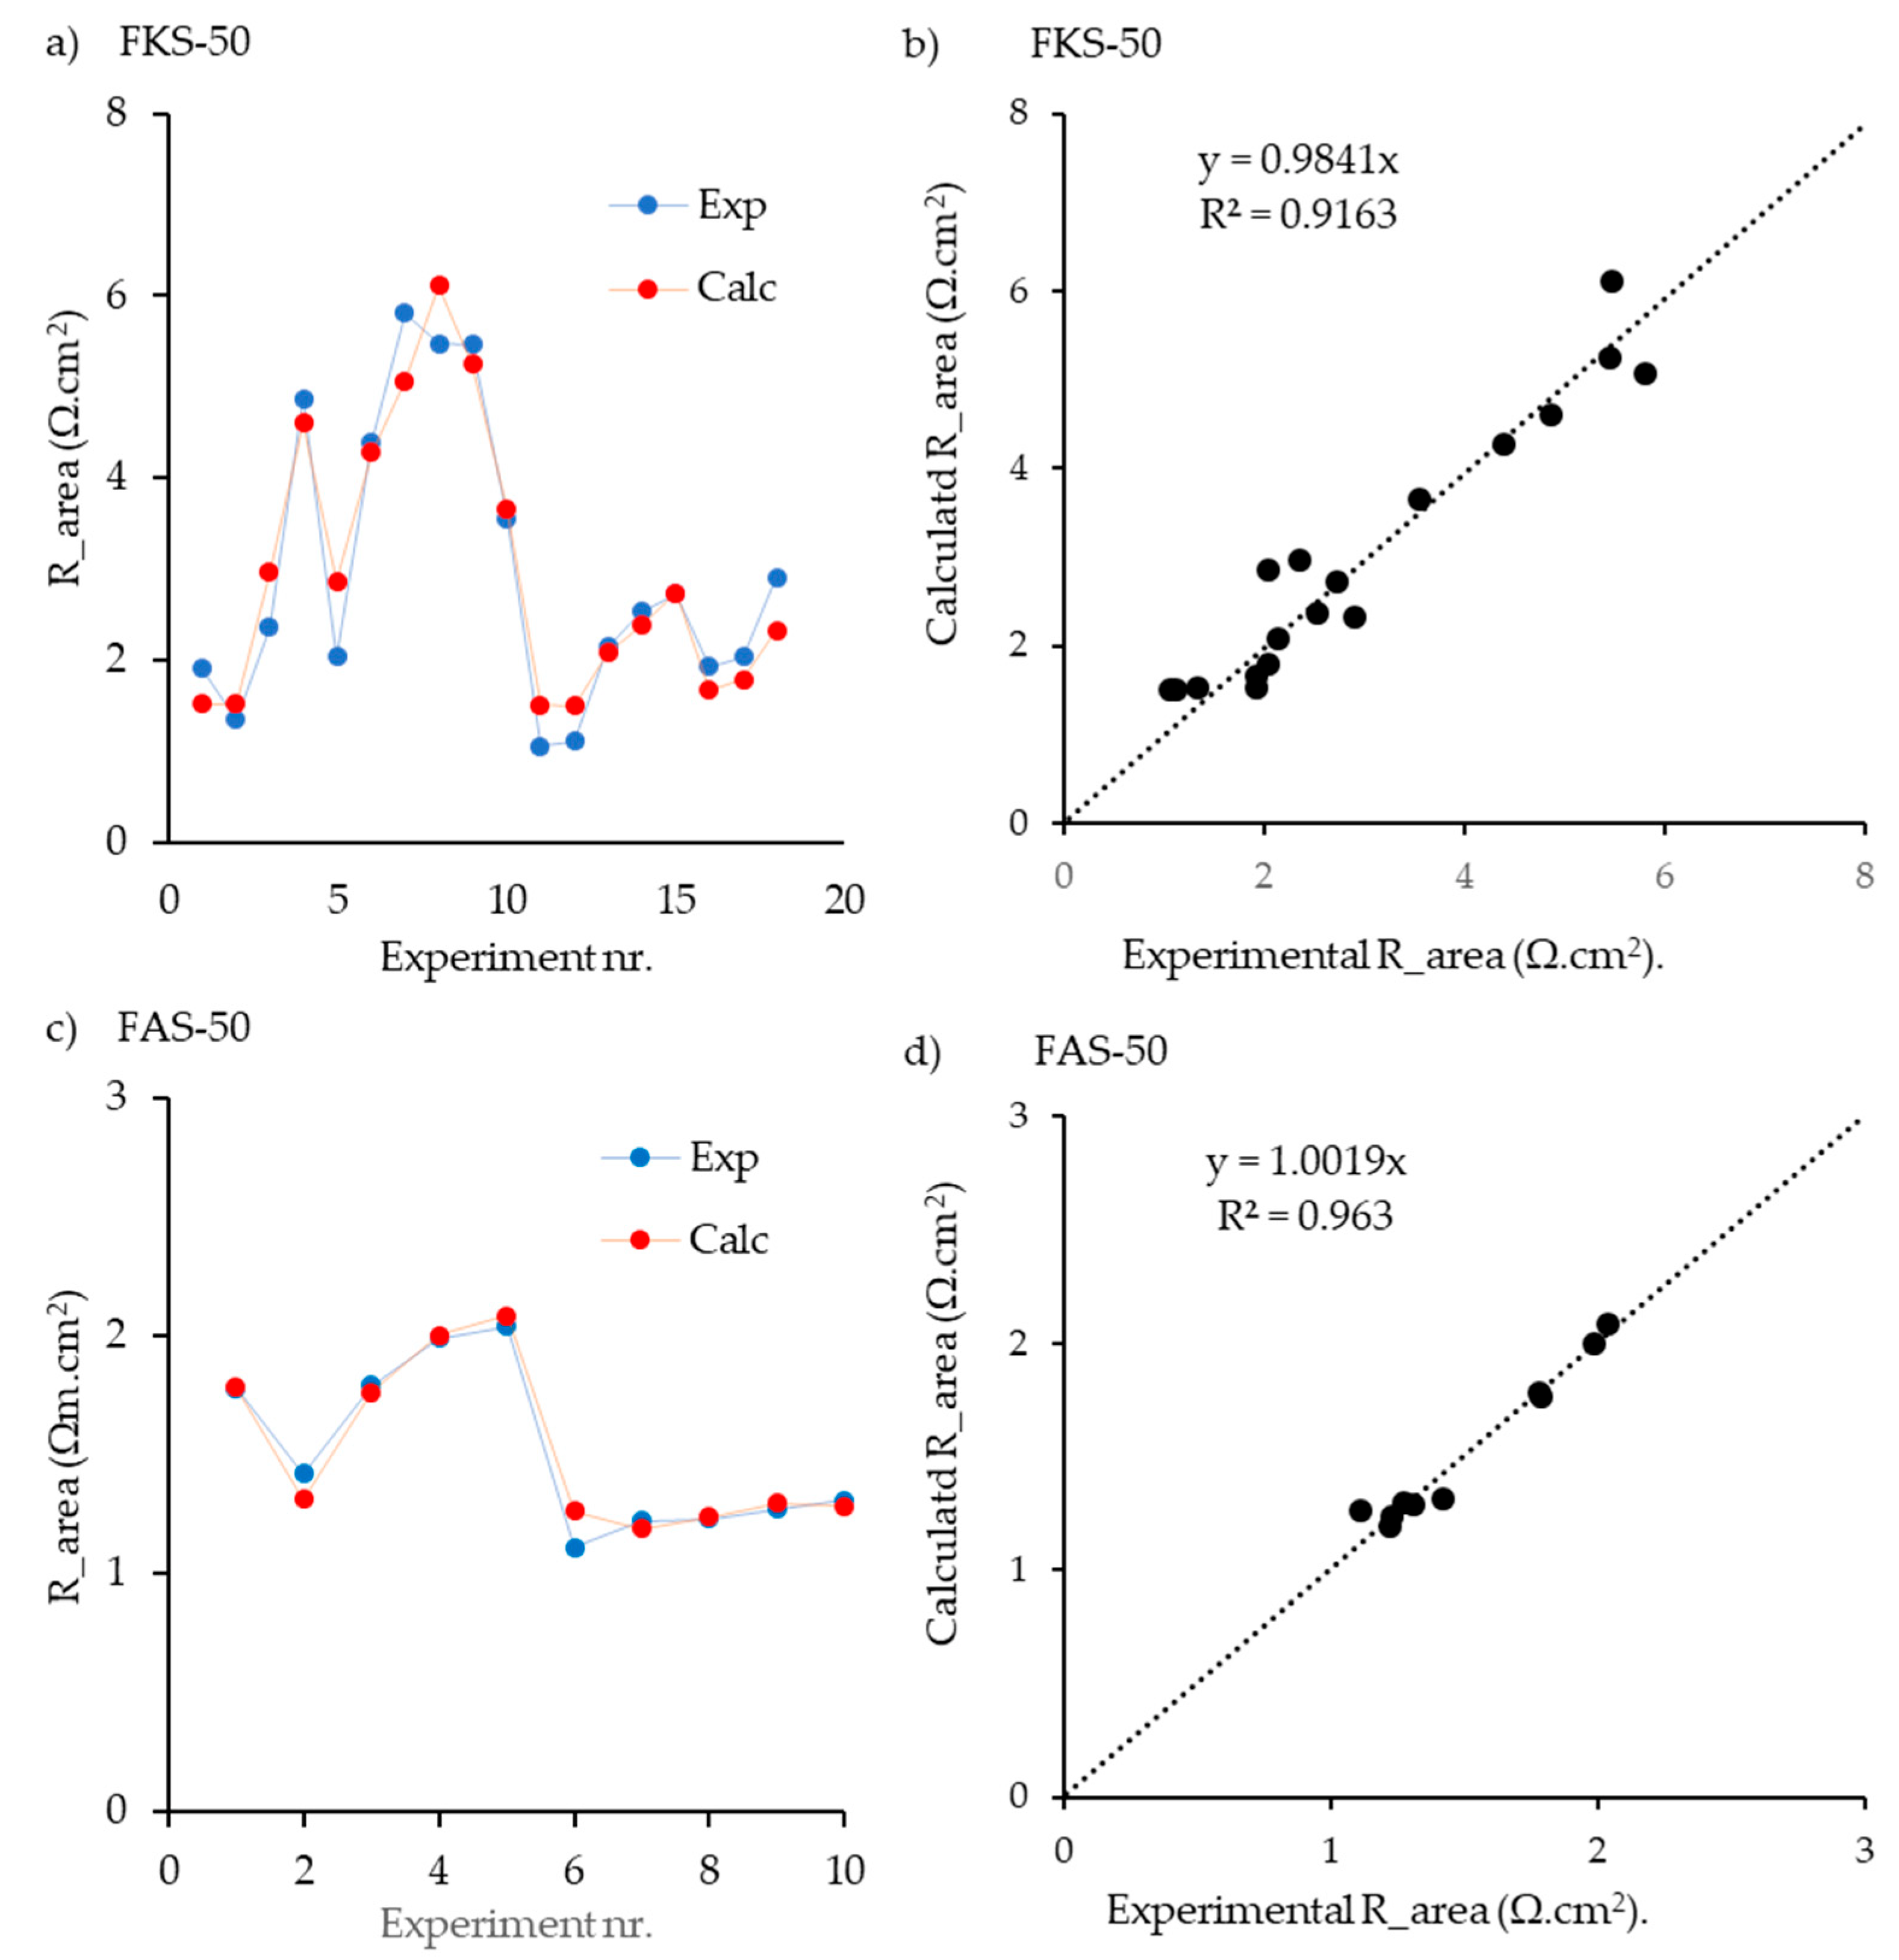
On the other hand, membranes with a thickness of 50 µm, FKS-50 and FAS-50 without reinforcement, were evaluated, taking the data from Gómez-Coma et al. [22]. In this previous work, the resistance of FKS-50 and FAS-50 membranes (Fumatech) was determined by EIS measurements between mercury electrodes with a measuring cell equipped with a system to completely remove air bubbles between the membrane and the electrode. The ions evaluated were the same as for the membranes of 75 µm: NaCl, MgCl2, CaCl2, and Na2SO4. From the reported data, IEC = 1.2–1.4 meq/g and SD = 10–10% [43], a CD = 8.67 eq/L was achieved from the mean values.
As Figure 4 shows, there was a good correlation between the model and the experiment, especially in the case of anionic membranes. In this sense, 10 independent tests were analyzed, obtaining errors lower than 15% in all scenarios. Besides, FKS membranes also demonstrated high accuracy in a series of 19 experiments. Another key point is the difference in membrane resistance when a 75 µm thickness with reinforcement was used. Using 50 µm, all the values were under 6 Ω·cm2 in the case of cationic membranes and below 2 Ω·cm2 for the anionic membranes. However, in the case of 75 µm, all the values were above 5 Ω·cm2 and 3 Ω·cm2 for cationic and anionic membranes, respectively.

4.2.2. Results with Neosepta CMX with AC and DC

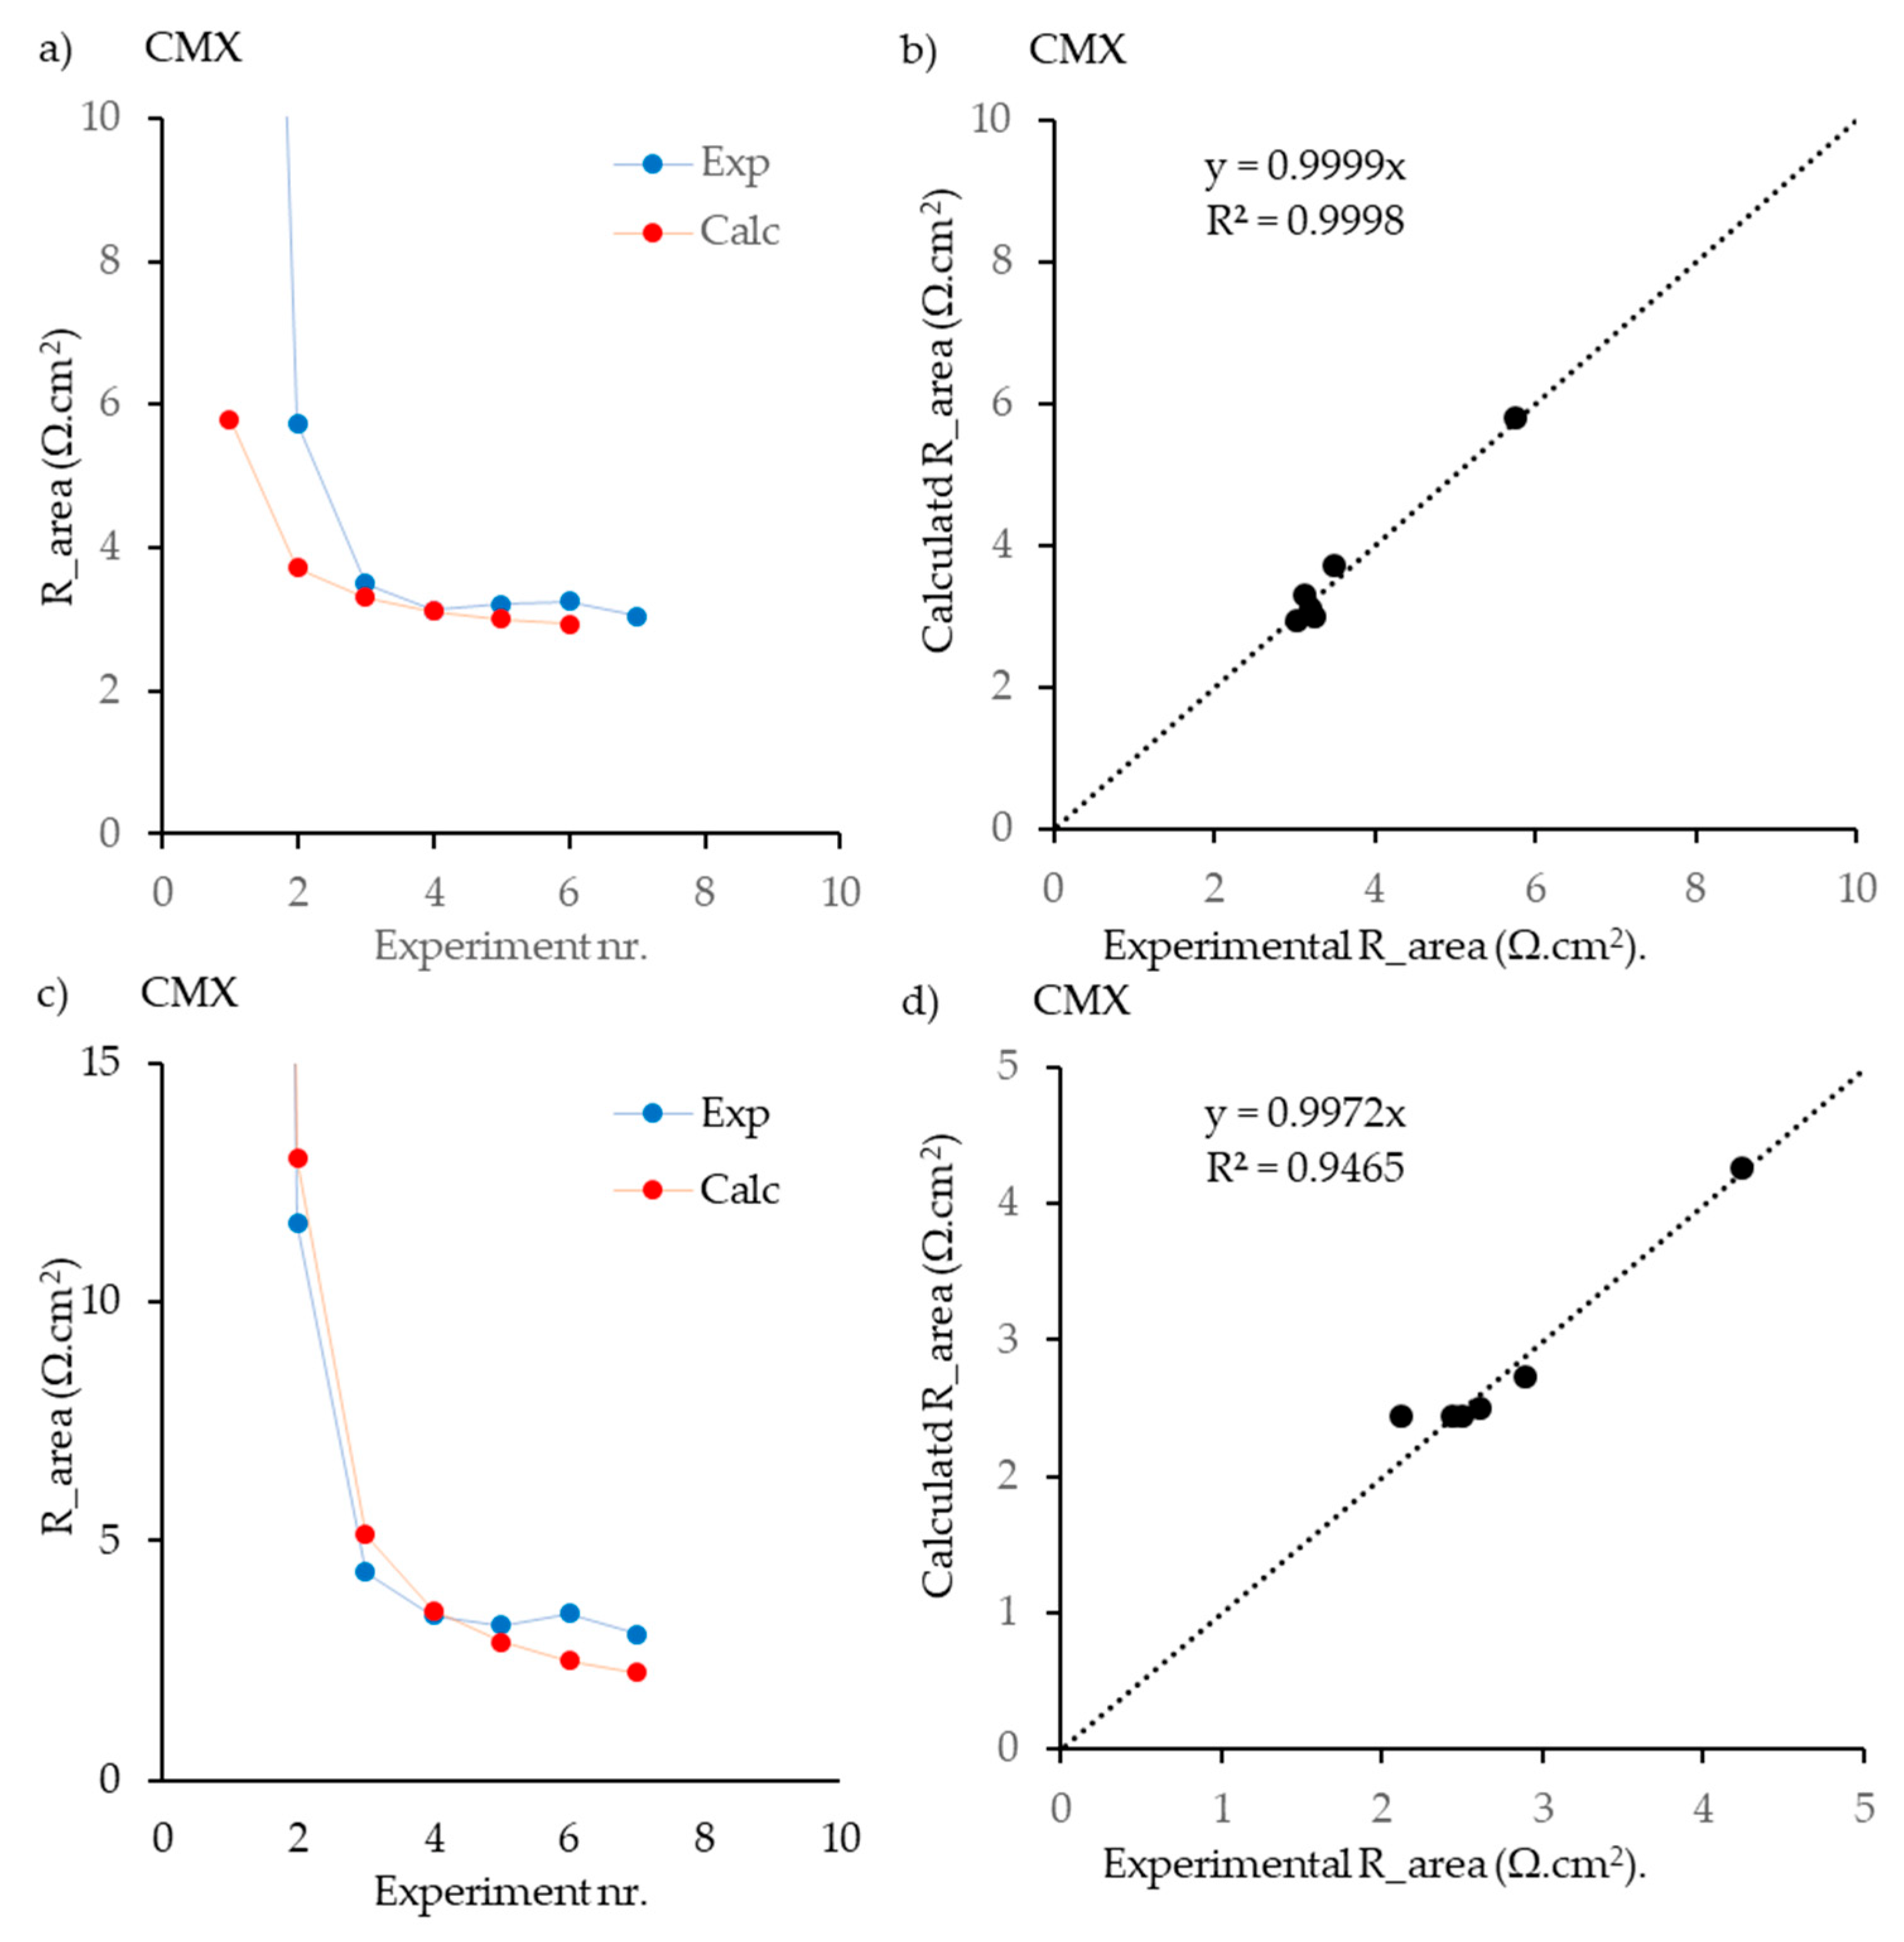
In this section, the model proposed to calculate the membrane resistance was first compared to the data provided by Galama et al. [33]. The resistance of a Neosepta CMX membrane (Tokuyama, Chiyoda City, Japan) was determined in a six-compartment cell with EIS (Figure 5a,b) and with a direct current (DC) (Figure 5c,d). Experiments were performed with pure NaCl solutions. These data were used to check predicted data with the model reported here. According to Długołęcki et al. [44], the IEC is 1.62 meq/g and SD = 18%, resulting in a CD = 1.62/0.18 = 9.00. Following the procedure in the Section 1, a good fitting with a coefficient of determination of R2 = 0.999 for the alternating current (AC) was obtained, taking into consideration the last five values since the first two showed a high difference, probably due to the low concentration of salt employed. However, experiments from 3 to 7 were practically overlapped, as Figure 5 confirms. On the other hand, the DC experiments matched in all the cases with high precision, achieving an R2 = 0.997.

4.2.3. Results with Fuji-CEM-80050, Neasepta CMX, and Neosepta AMX

In contrast, the data for the Fuji-CEM-80050, provided by Fujifilm, were obtained from Avci et al. [15] using the total resistance (the resistance of the membrane, diffusion boundary layer, and electric double layer, together). The resistances were determined using EIS in a four-electrode cell configuration. In this case, the results exhibited a reasonably good agreement in the comparison of 7 different concentrations. On the other hand, and as it can be confirmed through Figure 6b, in the case of cationic membranes of Fuji-CEM-80050, the model fit better to higher values of membrane resistance, which implies lower values of NaCl and higher values of MgCl2 (Table S4).
Finally, CMX and AMX membranes from Neosepta were studied, in this case working with data reported by Kuno et al. [18], which demonstrated the best level of prediction, between the experimental and simulated values fitting with an R2 value higher than 0.99 for both types of membranes (Figure 6). As in the previous cases, cation exchange membranes showed higher resistance values than anionic membranes, probably due to the high selectivity of AMX [42].

4.3. Gross Power Density

To better understand the impact of the membrane resistance, different trials in a RED module for salinity gradient energy extraction (which is highly dependent on IEMs’ contribution) have been performed. Regarding the gross power obtained per membrane pair, Figure 7 depicts the results of working with 20 membrane pairs of FKS-75 and FAS-75. As observed, when only sodium chloride was included in the feed streams in the typical composition of seawater (0.5 M) and wastewater treatment plants (0.02 M), the gross power density (GPD) achieved values as high as 1.46 W·m−2. This value concurs with previous works reported in the recent literature for similar membranes based on the same polymer but with different membrane thicknesses [38]. This is because of a positive impact in the membrane’s thickness but a negative impact in the increment of the membrane resistance [32,36,43]. Moreover, the presence of Na2SO4 in the sample did not reflect changes in the GPD since the value was practically the same (1.42 W·m−2) as when only NaCl flowed through the compartments. This point is probably related to the fact that the conductivity of a Na2SO4 solution drops sharply with the increasing salt concentration [44]. On the other hand, the inclusion of MgCl2 impacted the salinity power density, which decreased to 1.08 W·m−2. The reason for the increase in resistance was previously attributed to the lower mobility (due to a higher hydrated radius) of Mg2+ than Na+, which contributed to the loss of permselectivity [45]. In addition, the effect of CaCl2 was very high since with the inclusion of 0.011 and 0.002 M in the high and low concentrations, respectively, the total gross power decay was 16%. This point matches with previous results reported in the literature, where the effective order of coexisting ions on the energy generation performance was Ca2+ > Mg2+ > SO42− [46]. On the other hand, it is important to remark that Mg2+ and Ca2+ displayed a negligible effect on the resistance of AEM due to the Donnan exclusion [45,47]. However, as expected, and according to the membrane resistance, when all the typical divalent ions were included, the gross power density was 1.02 W·m−2. Despite the strong decay with respect to the use of NaCl, these values were higher or in the same range as previous works reported in the literature [48,49,50].
In all the cases, after the experiments, the RED module was opened to check the membranes and spacers, ensuring no fouling marks. Moreover, the NaCl test was replicated after each divalent trial to confirm the stability of the GPD.

5. Conclusions

This work reported an in-depth analysis of the impact of divalent ions on ion exchange membranes, in terms of membrane resistance, to better understand the influence in reverse electrodialysis technology. In this sense, the results demonstrated the high impact on the resistance values of the presence of cations, and the quite negligible influence of anions. While the anionic exchange membrane exhibited values of 3.25 and 4.59 Ω·cm2 for HCS and LCS, respectively, the cation exchange membrane displayed values of 11.69 and 29.39 Ω·cm2. In a second step, a model to predict the membrane resistance has been developed, considering the transport phenomena of ions in complex mixtures, achieving high correlations between simulation and experimental values. However, this work also demonstrated the difficulty to standardize the determination of the membrane resistance and membrane potential for different water compositions. Furthermore, this work showed that even in the case of pure NaCl, there were large differences in the measured resistance [4] due to major variations in pre-treatment methods, in the equipment employed, and in the method chosen for the measures. Thus, despite the strong contribution of membrane resistance in different sectors, such as renewable energies, for example, salinity gradient energy extraction, the development of a universal method for all the market membranes is far from being possible. Additionally, this work presented an evaluation of the extraction of the salinity gradient power using RED technology, using 20 membrane cell pairs and woven spacers at different water compositions, and therefore different membrane resistances. Specifically, the value reported for power density was 1.02 W·m−2, when a certain not insignificant number of divalent ions were added, which was one of the highest values found for waters in the presence of divalent ions in the recent literature. The results presented and discussed here constitute a step forward for the scale-up of the process and the understanding of the contribution of ion exchange membrane resistance to the overall process performance.

Supplementary Materials

The following supporting information can be downloaded at: https://www.mdpi.com/article/10.3390/membranes13030322/s1. Table S1. Resistances of FKS-50 measured at 297 ± 1 K. Table S2. Resistances of FAS-50 measured at 297 ± 1 K. Table S3. Resistances of CMX measured at 298 K with direct current (DC) and with alternating current (AC). Table S4. Resistances of Fuji-CEM-80050 CMX measured at 298 K. Table S5. Resistances of AMX and CMX [5,15,18,22,33,44,51].

Author Contributions

Conceptualization, J.V. and I.O.; methodology, J.V. and L.G.-C.; formal analysis, J.V. and L.G.-C.; investigation, All; resources, J.V., A.O. and I.O.; data curation, J.V. and L.G.-C.; writing—original draft preparation, All; writing—review and editing; supervision, J.V., A.O. and I.O.; project administration, J.V. and I.O.; funding acquisition, J.V., A.O. and I.O. All authors have read and agreed to the published version of the manuscript.

Funding

This research received the financial support from the LIFE program (LIFE19 ENV/ES/000143).

Acknowledgments

The authors of this work would like to acknowledge the financial support from the LIFE program (LIFE19 ENV/ES/000143). The UC team wants to thank J.A. Abarca and F.J. Rodríguez-Oria for their help in impedance measurements and SGP-RED experiences. This work was also facilitated by REDstack BV in the Netherlands. REDstack BV aims to develop and market the ED and the RED technology. J.V. would like to thank his colleagues from the REDstack company for the fruitful discussions.

Conflicts of Interest

The authors declare no conflict of interest.

Nomenclature

Roman
AMembrane areas (cm2)
C Concentration (eq/L)
CDMembrane charge density (eq/L)
D Diffusion constant in H2O (m2/s)
ĐDiffusion constant in gel phase (m2/s)
dMembrane thickness (cm)
FFaraday constant (96,485 C∙mol−1)
IECIon exchange capacity (meq/g dry membrane)
SDMembrane swelling degree (−)
kBoltzmann constant (1.381 × 10⁻²³ J/K)
KDonnan equilibrium constant (−)
RareaMembrane area resistance (Ω∙m2)
RfgelResistance factor of the gel part
RfsolResistance factor of the solution part
RgelResistance of the gel part (Ω)
RmemResistance of the membrane (Ω)
RsolResistance of the solution part (Ω)
RspecSpecific resistance (Ω∙m)
QIon charge (C)
TTemperature (K)
zIonic valence
Greek
φRelative ionic mobility (−)
κConductivity (S/m)
λ Ionic mobility (m2∙s−1∙V−1)
ρDensity of the dry membrane (kg/L)
Sub- and super-scripts
gelGel phase
solSolution phase
iIonic species i
coCo-ions
ctCounter-ions
Acronyms
AEMAnion exchange membrane
ACAlternating current
CEMCation exchange membrane
DCDirect current
EISElectrochemical impedance spectrometry
GPDGross power density
HCSHigh-concentration solution
IEMIon exchange membranes
LCSLow-concentration solution
REDReverse electrodialysis

References

  1. Gierke, T.D.; Munn, G.E.; Wilson, F.C. The morphology in Nafion perfluorinated membrane products, as determined by wide-and small-angle X-ray studies. J. Polym. Sci. 1981, 19, 1687–1704. [Google Scholar] [CrossRef]
  2. Kreuer, K. On the development of proton conducting polymer membranes for hydrogen and methanol fuel cells. J. Membr. Sci. 2001, 185, 29–39. [Google Scholar] [CrossRef]
  3. Zabolotsky, V.I.; Nikonenko, V.V. Effect of structural membrane inhomogeneity on transport properties. J. Membr. Sci. 1933, 79, 181–198. [Google Scholar] [CrossRef]
  4. Berezina, N.; Gnusin, N.; Dyomina, O.; Timofeyev, S. Water electrotransport in membrane systems. Experiment and model description. J. Membr. Sci. 1994, 86, 207–229. [Google Scholar] [CrossRef]
  5. Sarapulova, V.; Shkorkina, I.; Mareev, S.; Pismenskaya, N.; Kononenko, N.; Larchet, C.; Dammak, L.; Nikonenko, V. Transport Characteristics of Fujifilm Ion-Exchange Membranes as Compared to Homogeneous Membranes AMX and CMX and to Heterogeneous Membranes MK-40 and MA-41. Membranes 2019, 9, 84. [Google Scholar] [CrossRef] [Green Version]
  6. Sarapulova, V.; Pismenskaya, N.; Titorova, V.; Sharafan, M.; Wang, Y.; Xu, T.; Zhang, Y.; Nikonenko, V. Transport characteristics of CJMAED homogeneous anion exchange membranes in sodium chloride and sodium sulfate solutions. Int. J. Mol. Sci. 2021, 22, 1415. [Google Scholar] [CrossRef]
  7. Sarapulova, V.V.; Titorova, V.D.; Nikonenko, V.V.; Pismenskaya, N.D. Transport Characteristics of Homogeneous and Heterogeneous Ion-Exchange Membranes in Sodium Chloride, Calcium Chloride, and Sodium Sulfate Solutions. Membr. Membr. Technol. 2019, 1, 168–182. [Google Scholar] [CrossRef]
  8. Veerman, J. The Effect of the NaCl bulk concentration on the resistance of ion exchange membranes—Measuring and modeling. Energies 2020, 13, 1946. [Google Scholar] [CrossRef] [Green Version]
  9. Abidin, M.N.Z.; Nasef, M.M.; Veerman, J. Towards the development of new generation of ion exchange mem-branes for reverse electrodialysis: A review. Desalination 2022, 537, 115854. [Google Scholar] [CrossRef]
  10. Imai, N.; Onishi, T. Analytical solution of Poisson-Boltzmann equation for two-dimensional nany-center problem. J. Chem. Phys. 1958, 30, 1115–1116. [Google Scholar] [CrossRef]
  11. Kamcev, J.; Paul, D.R.; Manning, G.S.; Freeman, B.D. Ion diffusion coefficients in ion exchange membranes: Significance of counterion condensation. Macromolecules 2018, 51, 5519–5529. [Google Scholar] [CrossRef]
  12. Oh, Y.; Jeong, Y.; Han, S.-J.; Kim, C.S.; Kim, H.; Han, J.-H.; Hwang, K.-S.; Jeong, N.; Park, J.S.; Chae, S.C. Effects of divalent cations on electrical membrane resistance in reverse electrodialysis for salinity power generation. Ind. Eng. Chem. Res. 2018, 57, 15803–15810. [Google Scholar] [CrossRef]
  13. Post, J.W.; Hamelers, H.V.M.; Buisman, C.J.N. Influence of multivalent ions on power production from mixing salt and fresh water with a reverse electrodialysis system. J. Membr. Sci. 2009, 330, 65–72. [Google Scholar] [CrossRef]
  14. Vermaas, D.A.; Veerman, J.; Saakes, M.; Nijmeijer, K. Influence of multivalent ions on renewable energy generation in reverse electrodialysis. Energy Environ. Sci. 2014, 7, 1434–1445. [Google Scholar] [CrossRef] [Green Version]
  15. Avci, A.H.; Sarkar, P.; Tufa, R.A.; Messana, D.; Argurio, P.; Fontananova, E.; Di Profio, G.; Curcio, E. Effect of Mg2+ ions on energy generation by reverse electrodialysis. J. Membr. Sci. 2016, 520, 499–506. [Google Scholar] [CrossRef]
  16. Moreno, J.; Díez, V.; Saakes, M.; Nijmeijer, K. Mitigation of the effects of multivalent ion transport in reverse electrodialysis. J. Membr. Sci. 2018, 550, 155–162. [Google Scholar] [CrossRef]
  17. Rijnaarts, H.H.M.; Huerta, T.E.; Van Baak, W.; Nijmeijer, K. Effect of divalent cations on RED performance and cation exchange membrane selection to enhance power densities. Environ. Sci. Technol. 2017, 51, 13028–13035. [Google Scholar] [CrossRef]
  18. Kuno, M.; Yasukawa, M.; Kakihana, Y.; Higa, M. The effect of divalent ions on reverse electrodialysis power generation system. Bull. Soc. Sea Water Sci. Jpn. 2017, 71, 350–351. [Google Scholar]
  19. Pintossi, D.; Chen, C.; Saakes, M.; Nijmeijer, K.; Borneman, Z. Influence of sulfate on anion exchange membranes in reverse electrodialysis. NPJ Clean Water 2020, 3, 29. [Google Scholar] [CrossRef]
  20. Pintossi, D.; Simoes, C.; Saakes, M.; Borneman, Z.; Nijmeijer, K. Predicting reverse electrodialysis performance in the presence of divalent ions for renewable energy generation. Energy Convers. Manag. 2021, 243, 114369. [Google Scholar] [CrossRef]
  21. Veerman, J. Concepts and misconceptions concerning the influence of divalent ions on the performance of reverse electrodialysis using natural waters. Membranes 2023, 13, 69. [Google Scholar] [CrossRef] [PubMed]
  22. Gómez-Coma, L.; Ortiz-Martínez, V.M.; Carmona, J.; Palacio, L.; Prádanos, P.; Fallanza, M.; Ortiz, A.; Ibañez, R.; Ortiz, I. Modeling the influence of divalent ions on membrane resistance and electric power in reverse electrodialysis. J. Membr. Sci. 2019, 592, 117385. [Google Scholar] [CrossRef]
  23. Soldatov, V.; Pristavko, S.; Zelenkovskii, V.; Kosandrovich, E. Hydration of ion exchangers: Thermodynamics and quantum chemistry calculations. React. Funct. Polym. 2013, 73, 737–744. [Google Scholar] [CrossRef]
  24. Soldatov, V.; Zelenkovskii, V.; Kosandrovich, E. Hydration of ion exchangers: Thermodynamics and quantum chemistry calculations. II an improved variant of the predominant hydrates model. React. Funct. Polym. 2016, 102, 147–155. [Google Scholar] [CrossRef]
  25. Soldatov, V.; Zelenkovskii, V.; Kosandrovich, E. Hydration of ion exchangers: Thermodynamics and quantum chemistry calculations. III. The state of the proton and water molecules in hydrogen form of sulfostyrene ion exchangers. React. Funct. Polym. 2016, 102, 156–164. [Google Scholar] [CrossRef]
  26. Helfferich, F.G. Ion Exchange; McGraw-Hill: New York, NY, USA, 1962; ASIN B0000CLGWI. [Google Scholar]
  27. Soldatov, V.S.; Kosandrovich, E.G.; Bezyazychnaya, T.V. Quantum chemical evidence of a fundamental difference between hydrations and ion exchange selectivities of sodium and potassium ions on carboxylic and sulfonic acid cation exchangers. J. Struct. Chem. 2020, 61, 1898–1909. [Google Scholar] [CrossRef]
  28. Shaposhnik, V.A.; Butyrskaya, E.V. Computer simulation of cation-exchange membrane structure: An elementary act of hydrated ion transport. Russ. J. Electrochem. 2004, 40, 767–770. [Google Scholar] [CrossRef]
  29. Badessa, T.; Shaposhnik, V. The electrodialysis of electrolyte solutions of multi-charged cations. J. Membr. Sci. 2016, 498, 86–93. [Google Scholar] [CrossRef]
  30. Badessa, T.S.; Shaposhnik, V.A.; Nartova, M.R. Transport of multi-charged cations through cation exchange membrane by electrodialysis. Сoрбциoнные И Хрoматoграфические Прoцессы (Sorpt. Chromatogr. Process.) 2015, 15, 450–455. [Google Scholar]
  31. Luo, T.; Roghmans, F.; Wessling, M. Ion mobility and partition determine the counter-ion selectivity of ion exchange membranes. J. Membr. Sci. 2020, 597, 117645. [Google Scholar] [CrossRef] [Green Version]
  32. Tedesco, M.; Hamelers, H.V.M.; Biesheuvel, P.M. Nernst-Planck transport theory for (reverse) electrodialysis: I. Effect of co-ion transport through the membranes. J. Membr. Sci. 2016, 510, 370–381. [Google Scholar] [CrossRef]
  33. Galama, A.H.; Vermaas, D.A.; Veerman, J.; Saakes, M.; Rijnaarts, H.H.M.; Post, J.W.; Nijmeijer, K. Membrane resistance: The effect of salinity gradients over a cation exchange membrane. J. Membr. Sci. 2014, 467, 279–291. [Google Scholar] [CrossRef]
  34. Geise, G.M.; Curtis, A.J.; Hatzell, M.C.; Hickner, M.A.; Logan, B.E. Salt concentration differences alter membrane resistance in reverse electrodialysis stacks. Environ. Sci. Technol. Lett. 2014, 1, 36–39. [Google Scholar] [CrossRef]
  35. Ortiz-Martínez, V.M.; Gómez-Coma, L.; Tristán, C.; Pérez, G.; Fallanza, M.; Ortiz, A.; Ibañez, R.; Ortiz, I. A comprehensive study on the effects of operation variables on reverse electrodialysis performance. Desalination 2020, 482, 114389. [Google Scholar] [CrossRef]
  36. Ortiz-Imedio, R.; Gómez-Coma, L.; Fallanza, M.; Ortiz, A.; Ibañez, R.; Ortiz, I. Comparative performance of salinity gradient power-reverse electrodialysis under different operating conditions. Desalination 2019, 457, 8–21. [Google Scholar] [CrossRef]
  37. Gómez-Coma, L.; Ortiz-Martínez, V.M.; Fallanza, M.; Ortiz, A.; Ibañez, R.; Ortiz, I. Blue energy for sustainable water reclamation in WWTPs. J. Water Process. Eng. 2020, 33, 101020. [Google Scholar] [CrossRef]
  38. Gómez-Coma, L.; Abarca, J.A.; Fallanza, M.; Ortiz, A.; Ibañez, R.; Ortiz, I. Optimum recovery of saline gradient power using reversal electrodialysis: Influence of the stack components. J. Water Process. Eng. 2022, 48, 102816. [Google Scholar] [CrossRef]
  39. Available online: https://www.priyamstudycentre.com/2021/07/ionic-mobility.html (accessed on 15 July 2022).
  40. Moore, W.J. Physical Chemistry; Prentice-Hall, Inc.: Hoboken, NJ, USA, 1974; ISBN 0-582-44234-6. [Google Scholar]
  41. Available online: https://www.statisticshowto.com/probability-and-statistics/statistics-definitions/adjusted-r2/ (accessed on 15 July 2022).
  42. Sarapulova, V.; Pismenskaya, N.; Butylskii, D.; Titorova, V.; Wang, Y.; Xu, T.; Zhang, Y.; Nikonenko, V. Transport and Electrochemical Characteristics of CJMCED Homogeneous Cation Exchange Membranes in Sodium Chloride, Calcium Chloride, and Sodium Sulfate Solutions. Membranes 2020, 10, 165. [Google Scholar] [CrossRef]
  43. Technical Data Sheet Fumasep FKS-50. Available online: https://www.fuelcellstore.com/spec-sheets/fumasep-fks-50-technical-specifications.pdf (accessed on 15 July 2022).
  44. Długołęcki, P.; Nymeijer, K.; Metz, S.; Wessling, M. Current status of ion exchange membranes for power generation from salinity gradients. J. Membr. Sci. 2008, 319, 214–222. [Google Scholar] [CrossRef]
  45. Luo, T.; Abdu, S.; Wessling, M. Selectivity of ion exchange membranes: A review. J. Membr. Sci. 2018, 555, 429–454. [Google Scholar] [CrossRef]
  46. Hong, J.G.; Zhang, W.; Luo, J.; Chen, Y. Modeling of power generation from the mixing of simulated saline and freshwater with a reverse electrodialysis system: The effect of monovalent and multivalent ions. Appl. Energy 2013, 110, 244–251. [Google Scholar] [CrossRef]
  47. Besha, A.T.; Tsehaye, M.T.; Aili, D.; Zhang, W.; Tufa, R.A. Design of Monovalent Ion Selective Membranes for Reducing the Impacts of Multivalent Ions in Reverse Electrodialysis. Membranes 2020, 10, 7. [Google Scholar] [CrossRef] [PubMed] [Green Version]
  48. Luque Di Salvo, J.; Cosenza, A.; Tamburini, A.; Micale, G.; Cipollina, A. Long-run operation of a reverse electrodialysis system fed with wastewaters. J. Environ. Manag. 2018, 217, 871–887. [Google Scholar] [CrossRef] [PubMed]
  49. Vanoppen, M.; Gutierrez, V.V.T.L.; Roman, M.; Croué, L.J.P.; Verbeken, K.; Philips, J.; Verliefde, A.R.D. Secondary treated domestic wastewater in reverse electrodialysis: What is the best pre-treatment? Sep. Purif. Technol. 2019, 218, 25–42. [Google Scholar] [CrossRef] [Green Version]
  50. Kingsbury, R.S.; Liu, F.; Zhu, S.; Boggs, C.; Armstrong, M.D.; Call, D.F.; Coronell, O. Impact of natural organic matter and inorganic solutes on energy recovery from five real salinity gradients using reverse electrodialysis. J. Membr. Sci. 2017, 541, 621–632. [Google Scholar] [CrossRef]
  51. Available online: https://www.fuelcellstore.com/fuel-cell-components/membranes (accessed on 24 January 2023).
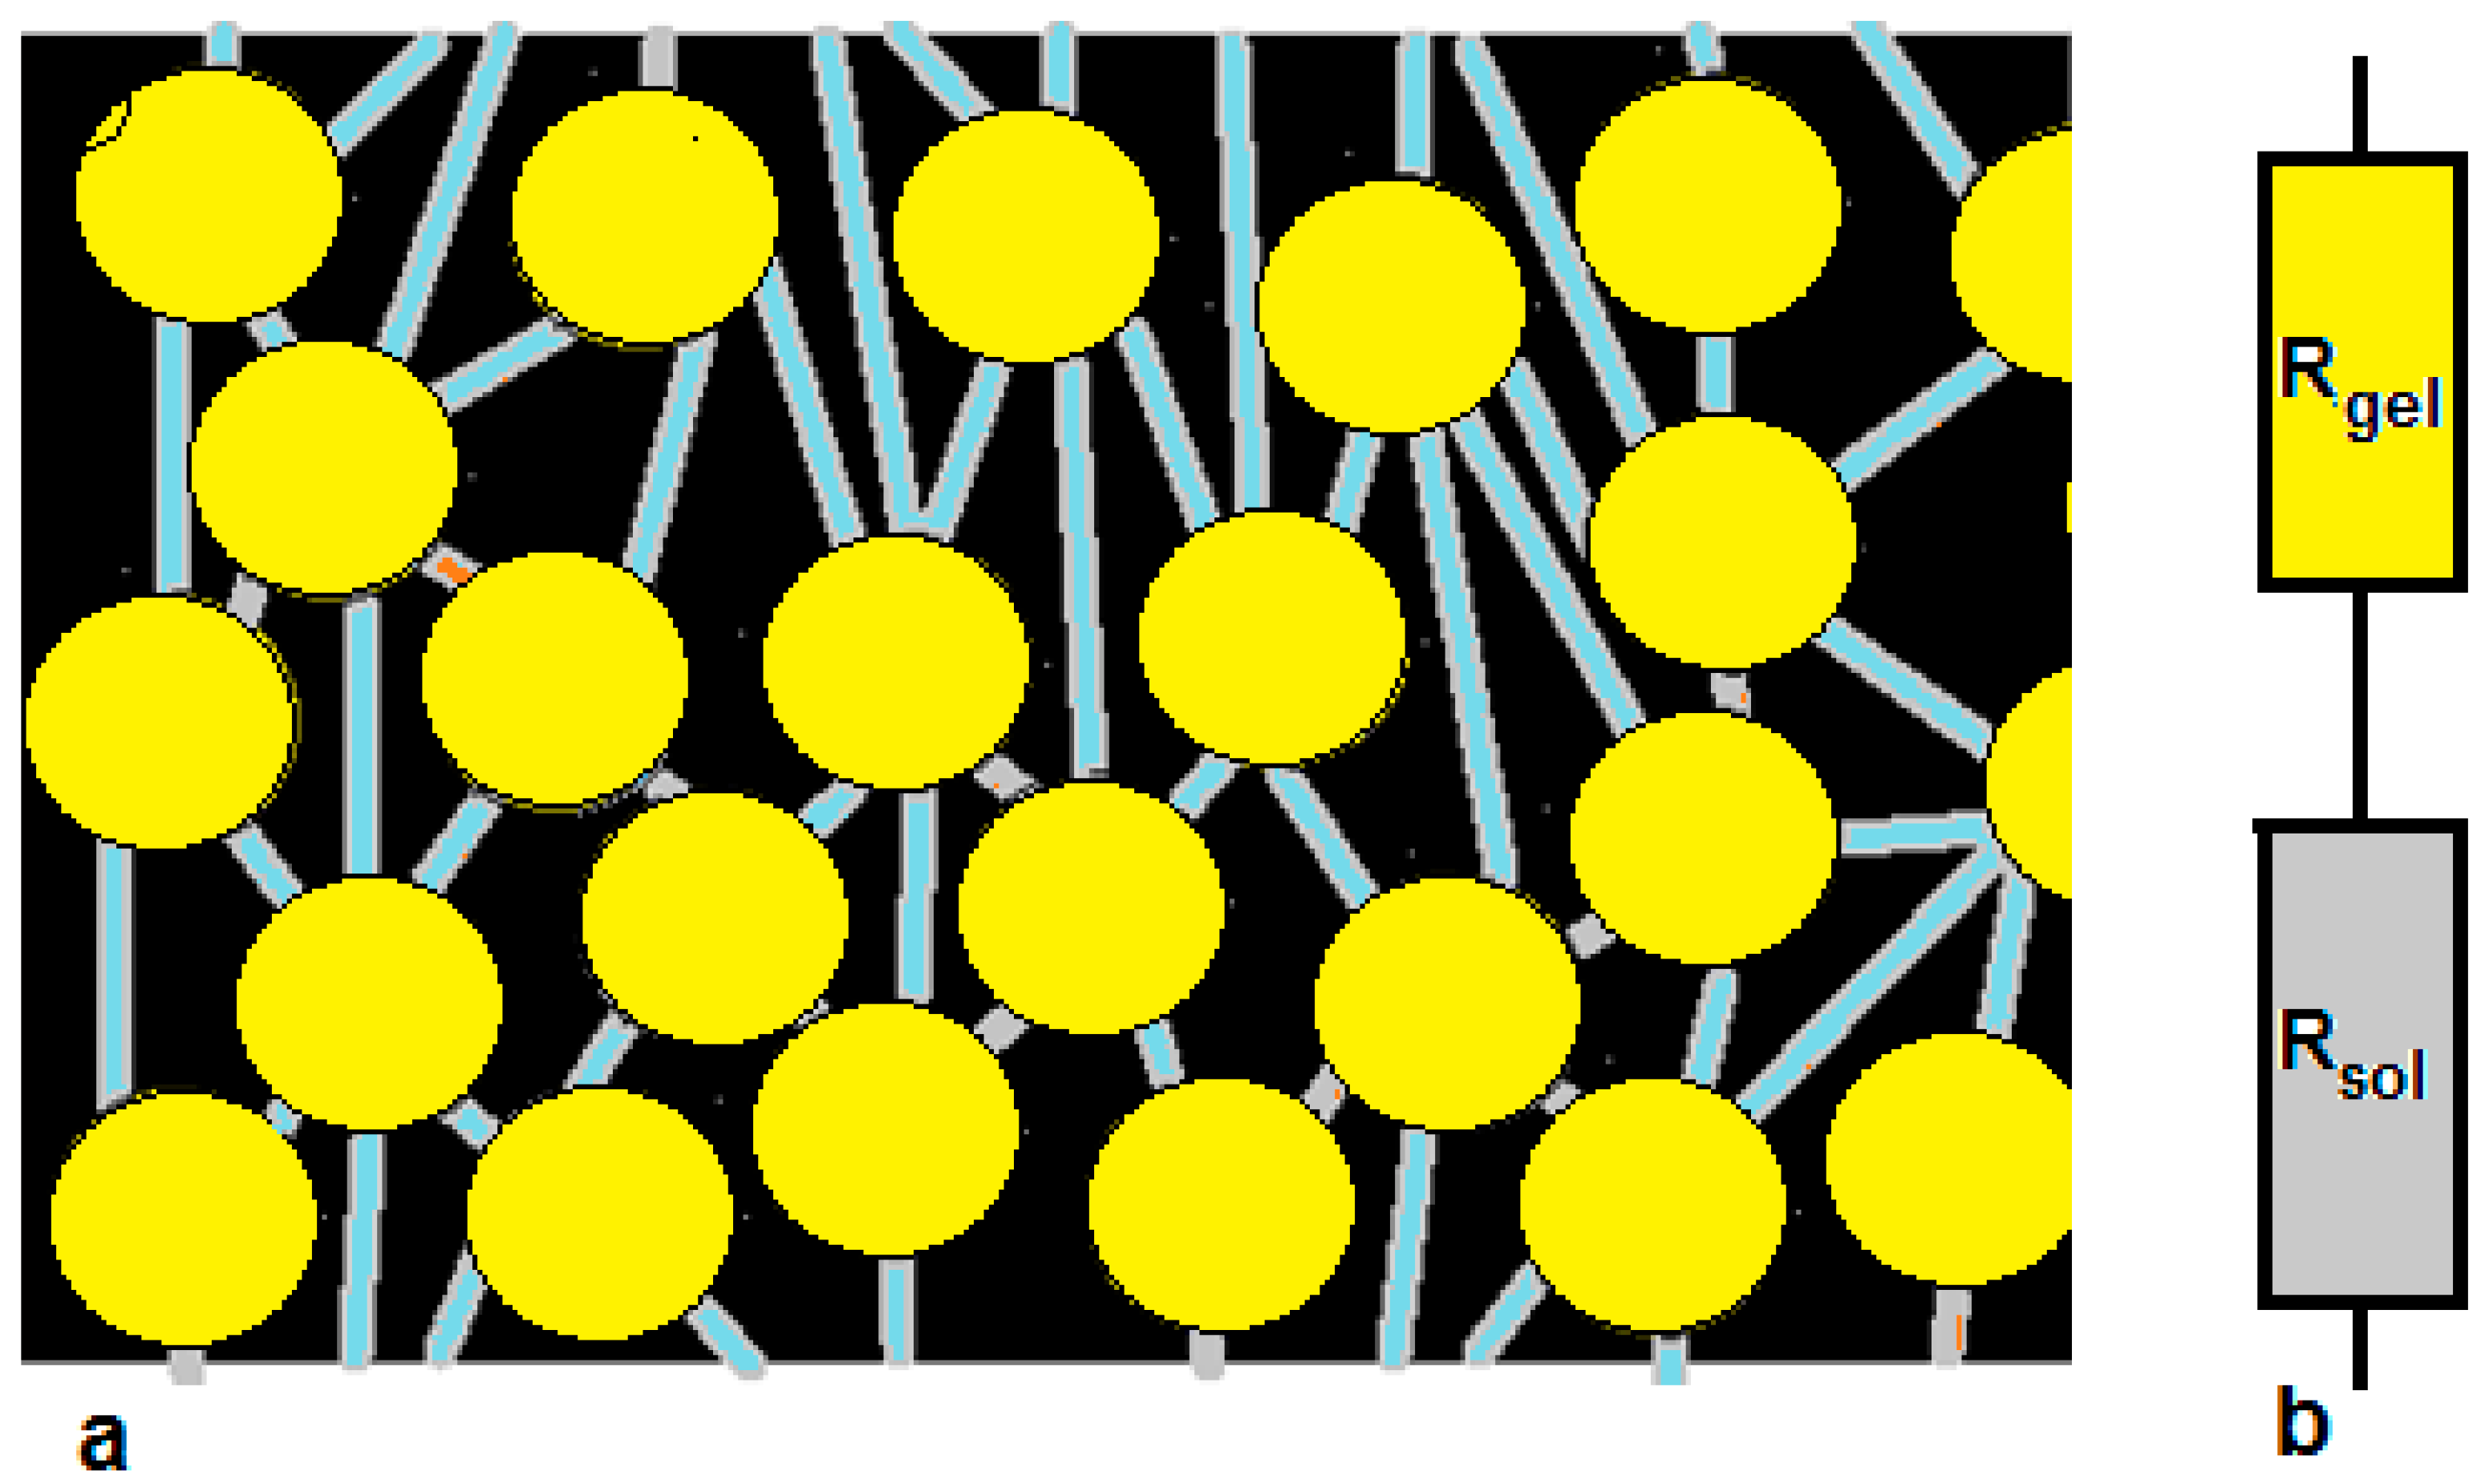
Figure 1. (a) Homogeneous ion exchange membrane. The small vesicles are filled with gel phase (yellow) containing fixed groups, water, and counter-ions, and a small amount of co-ions. The vesicles are interconnected by pores filled with water and dissolved ions (blue). (b) The one-thread model consisting of two resistances: Rgel with a constant resistance and Rsol with a concentration-dependent resistance [8].
Membranes 13 00322 g001
Figure 2. Interaction of the sodium and the sulfonate group, from Shaposhnik and Butyrkaya [24].
Membranes 13 00322 g002
Figure 3. Results of the fitting procedure for the Fumatech membranes FKS-PET-75 (a,b) and FAS-PET-75 (c,d), with solutions containing NaCl, MgCl2, CaCl2, and Na2SO4. The composition of the various solutions is indicated with “Experiment nr.” and refers to Table 2 (data from this publication). In (a,c), lines are added to guide the eye; in (b,d) the regression lines are shown.
Membranes 13 00322 g003
Figure 4. Results of the fitting procedure for the Fumatech membranes FKS-50 (a,b) and FAS-50 (c,d). Used were solutions containing NaCl, MgCl2, CaCl2, NaCl, and Na2SO4. Data are from Gόmez-Coma et al. [22]. In (a,c), lines are added to guide the eye; in (b,d) the regression lines are shown.
Membranes 13 00322 g004
Figure 5. Results of the fitting procedure for the CMX membrane in pure NaCl solutions. (a,b) Derived from AC measured resistances and (c,d) from DC measurements from Galama et al. [33]. In (a,c), lines are added to guide the eye; in (b,d) the regression lines are shown.
Membranes 13 00322 g005
Figure 6. Results of the fitting procedure for Fuji-CEM-80050 (Fujifilm), CMX (Neosepta), and AMX (Neosepta). In (a,c,e), lines are added to guide the eye; in (b,d,f) the regression lines are shown.
Membranes 13 00322 g006
Figure 7. Gross power density achieved with NaCl and divalent ions.
Membranes 13 00322 g007
Table 1. Equivalent mobilities in water at 298.15 K [39].
Cationλ (m2∙s−1∙V−1)Anionλ (m2∙s−1∙V−1)
Na+5.20 × 10⁻⁸Cl7.90 × 10−8
Mg2+5.50 × 10⁻⁸SO42−8.27 × 10⁻⁸
Ca2+6.16 × 10⁻⁸
Table 2. Membrane resistance values (Ω·cm2) for FKS and FAS in high- and low-concentration solutions (M).
ExperimentMMembrane Resistance (Ω·cm2)
No.NaClMgCl2CaCl2Na2SO4FKS-PET-75FAS-PET-75
HCS10.50005.093.20
20.490.060010.582.98
30.4900.01107.973.21
40.49000.0325.493.35
50.490.060.0110.03211.693.25
LCS60.020006.333.76
70.01760.00240028.864.04
80.018500.002023.053.77
90.0186000.00146.404.49
100.01720.00240.0020.001429.394.59
Disclaimer/Publisher’s Note: The statements, opinions and data contained in all publications are solely those of the individual author(s) and contributor(s) and not of MDPI and/or the editor(s). MDPI and/or the editor(s) disclaim responsibility for any injury to people or property resulting from any ideas, methods, instructions or products referred to in the content.