2. Materials and Methods
High molecular weight poly(vinyl chloride) (PVC), plasticizers bis(1-butylphenyl)adipate (BBPA) and 2-nitrophenyl octyl ether (oNPOE), potassium tetrakis(4-chlorophenyl)borate (KTpClPB), tetradodecylammonium tetrakis(4-chlorophenyl)borate (ETH500), tetrabutylammonium tetrabutylborate (TBATBB), tetrahydrofuran (THF) and cyclohexanone (CH) (all Selectophore grade) were from Fluka (Buchs, Switzerland). Analytical grade inorganic salts were from Reakhim (St. Petersburg, Russia). Aqueous solutions were prepared with deionized water (18.2 MOhm∙cm, Milli-Q Reference, Merck KGaA, Darmstadt, Germany).
Two series of the membrane cocktails were prepared as described elsewhere [
19] by dissolving appropriate amounts of PVC and plasticizer (mass ratio 1:2) in THF. After that, the salts (KT
pClPB and ETH500; or TBATBB and KCl if necessary) were added to the cocktails. To avoid weighing small amounts and ensure high accuracy of the membrane compositions, some of the components were added as appropriate aliquots of stock solutions in CH. To obtain the membranes, the cocktails were stirred with roller mixer (J.P. Spectra Movil-Rod, Barcelona, Spain) for 10 min and then casted on a Petri dish and closed with filter paper to slow down the evaporation of THF. In the case of KCl-containing membranes, the cocktail was sonicated for 5 min at 30 °C prior to casting. After 2 days THF and CH completely evaporated and master membranes were obtained. The thickness of TBATBB-based membranes was about 1.7 mm, with TBATBB content of 12.6 wt.% (
Table 1). This composition was chosen based on the data in ref. [
15] where it was found optimal for creating LJF REs. The amount of KCl added to composition
b (314 mg, see
Table 1) was in a mass ratio of 1:1 to the oNPOE plasticizer. The thickness of the membranes
I–X was 1 mm, and the total amount of the organic electrolytes (KT
pClPB and ETH500) in these compositions was kept constant, 10 mmol/kg BBPA; the mole fraction of ETH500 was varied from 0.0 to 0.9 (see
Table 1).
The electrodes were prepared by cutting disks with diameter of 12 mm from the master membrane and gluing them to PVC bodies with the outer diameter of 12 mm and the inner diameter of 10 mm. A solution of PVC in CH was used as glue. The electrodes from the series
I–X were filled with 10
−2 M KCl, NH
4Cl, CsCl or NaCl and conditioned in the same solution for 2 days. The conditioning protocols of the membranes of series
a,
b will be discussed below. The photographs of the fresh and conditioned membranes containing TBATBB and KCl are shown in
Figure S1.
The inner reference was Ag/AgCl wire. Potentiometric measurements were performed versus saturated Ag/AgCl electrode with Ecotest-120 potentiometer (Econics, Moscow, Russia) at 23 ± 1 °C.
For data processing, OriginPro 9.0 software (OriginLab Corporation, Northampton, MA, USA) was used. Numerical simulations of the phase boundary potential were performed with Maple 2016 (Maplesoft, Waterloo, ON, Canada).
3. Result and Discussion
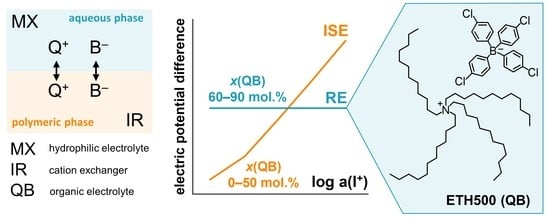
As a characteristic example, let us consider the following case: hydrophilic 1:1-electrolyte M+X− dominates in the solution; polymeric phase contains organic electrolyte Q+B− and/or cation exchanger I+R−.
The proposed model is based on the equality of the electrochemical potentials of the charged species in the two phases (
aq—aqueous phase,
m—polymeric phase):
were
—standard chemical potential of the
-th ion in the
phase,
—Galvani potential of
phase,
—activity of the
-th ion in the
phase,
—charge of the
-th ion. Applying the generally accepted approach, one can approximate activities in the polymeric phase with the respective concentrations (
) [
20], and the activity coefficients for all ions in all solutions are equal to 1. Let us introduce the following notation:
and
.
Thus, the boundary potential can be written as follows:
with
:
where
—Eisenman ionic partition coefficient of ion
[
21]. Thus, for the partitioning species:
The mass balance is expressed in terms of the total quantity of substances (
) added into each phase [
11] with volumes of the aqueous and the polymeric phase be
and
, respectively. Then for MX mass balance:
Q
+B
− electrolyte mass balance:
IR electrolyte mass balance:
Electroneutrality needs to be considered only for one of the phases since by introducing the mass balance equation, the electroneutrality condition for another phase would be automatically fulfilled. Then for the polymeric phase one can write:
In computer simulations, unless otherwise indicated, the following fixed parameters close to those found in the literature were used [
7,
19]:
,
,
;
,
;
,
.
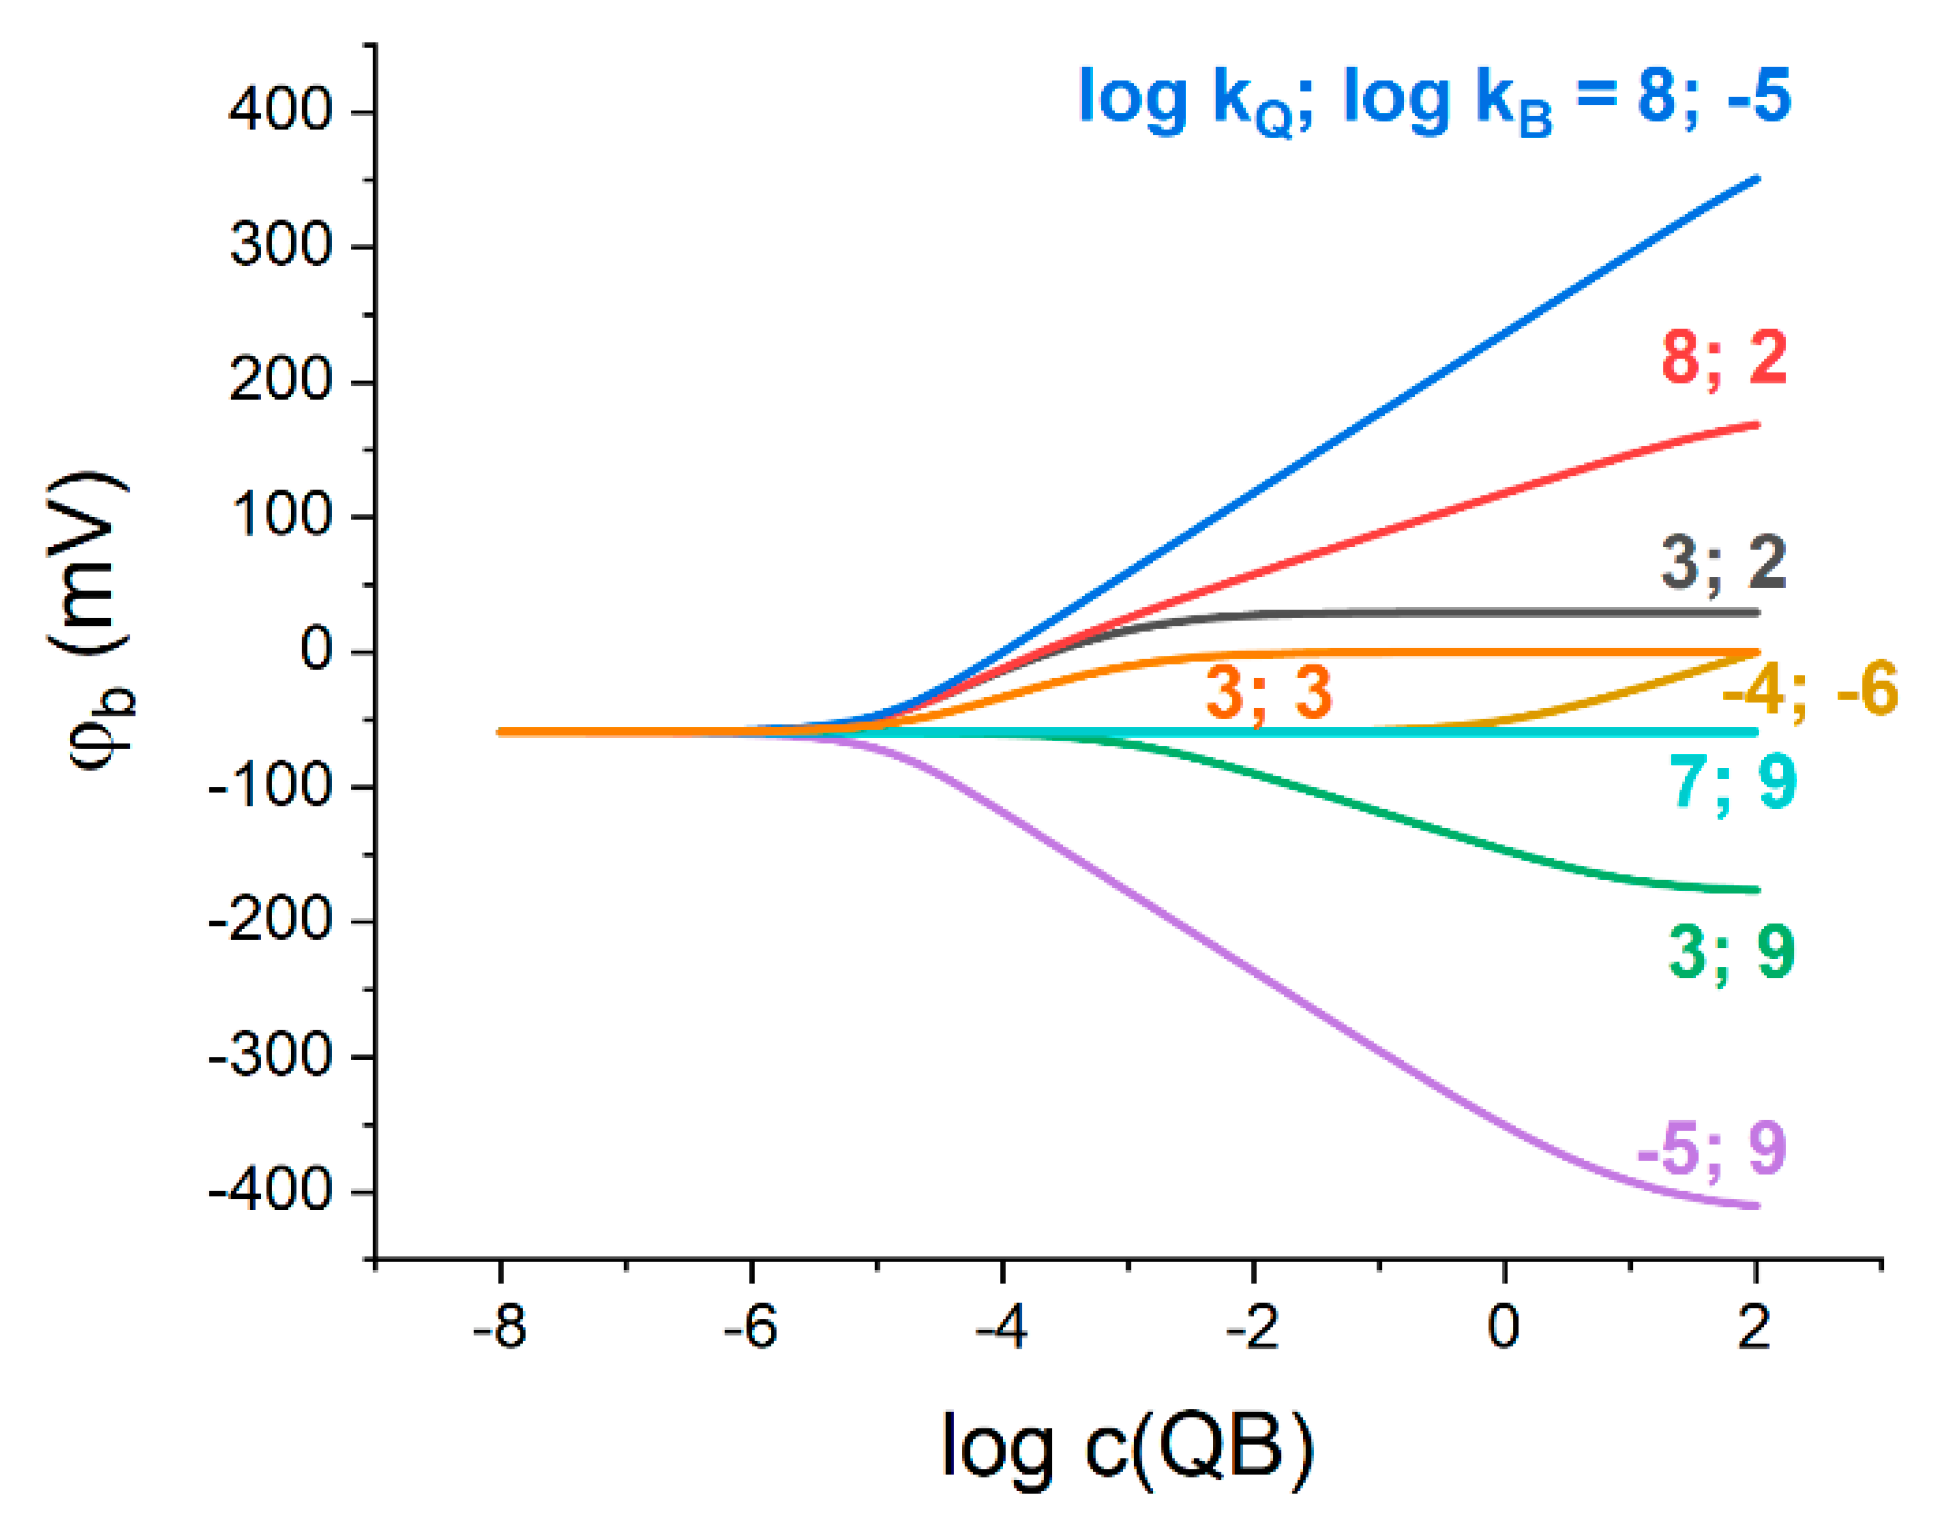
Figure 1 shows the results of simulation of the phase boundary potential,
, as a function of Q
+B
− concentration in the membrane phase with varied ionic partition coefficients of Q
+ and B
−. We note that the initial concentration of Q
+B
− is considered without taking into account its leaching to the aqueous phase.
According to
Figure 1, in a wide range of Q
+B
− concentrations below ca. 10
−5 M, the potential does not depend on the ratio of Q
+ and B
− ionic partition coefficients, nor on their absolute values. Thus, in the case of a low concentration of the organic electrolyte in the membrane, the phase boundary potential is determined exclusively by the hydrophilic salt partitioning into the membrane phase.
In order to develop a reference electrode, the phase boundary potential should be maintained constant. The proposed model suggests that the limiting values of
in
Figure 1 depend on the ratios of the partition coefficients of both hydrophilic and lipophilic electrolytes:
Figure 1 indicates that a necessary condition for the curves to reduce to horizontal lines, which is equivalent to
to be constant at any concentration of Q
+B
−, is that the two limits are equal:
An example can be observed for
(see turquoise line in
Figure 1, note that
,
, see above) that expands the previously adopted concept of the partitioning electrolyte [
11] to the non-zero values of the stabilized boundary potential. The latter also confirms the qualitative conclusion of ref. [
7]: the equality of the Q
+ and B
− ionic partition coefficients in Q
+B
− electrolyte is not obligatory for this electrolyte to stabilize the interfacial potential.
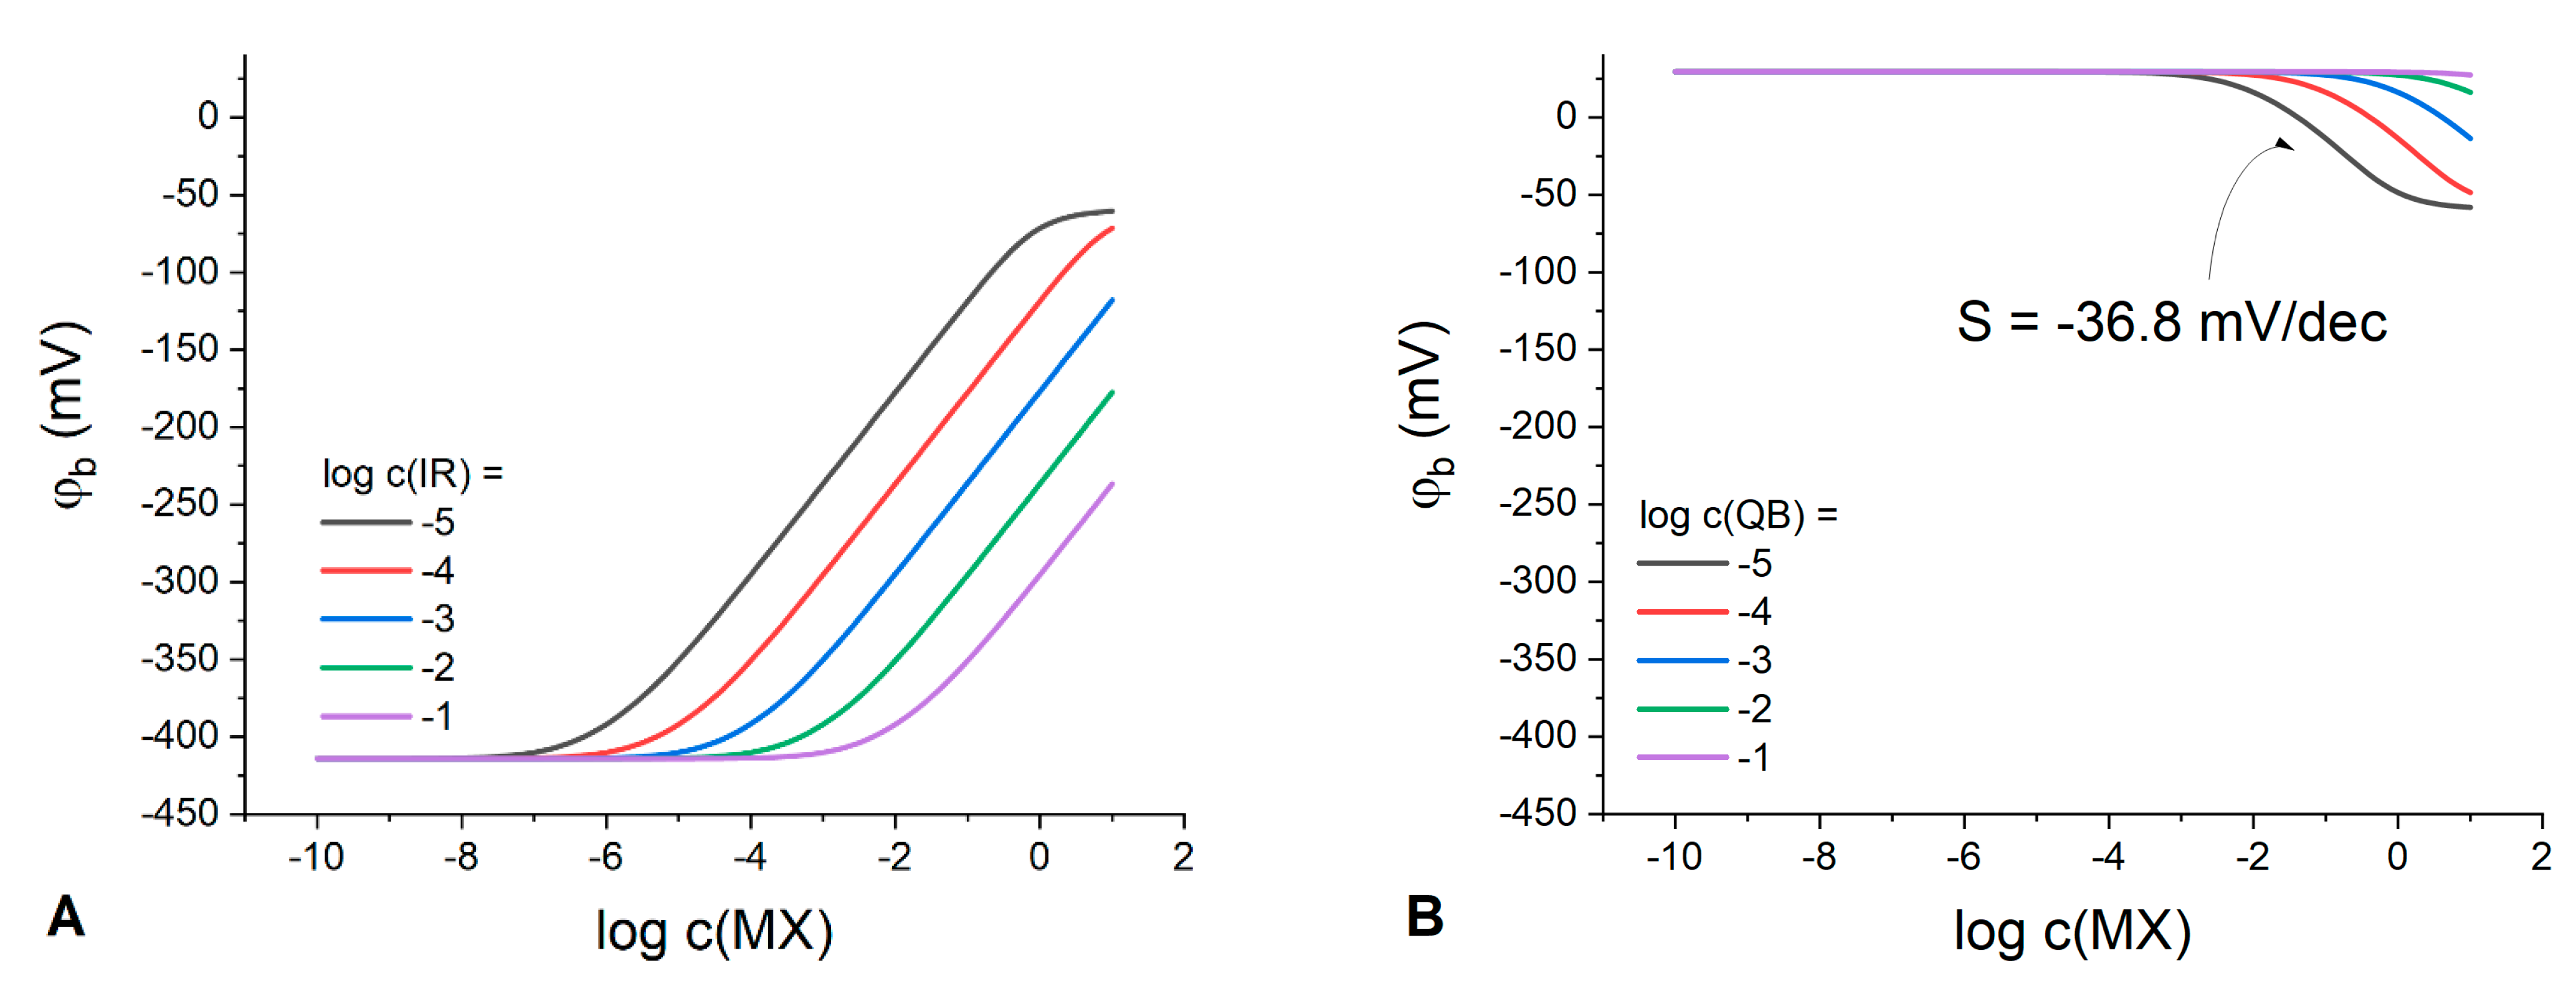
The dependence of the phase boundary potential on the IR or Q
+B
− electrolyte total concentration at varied MX concentration is shown in
Figure 2.
Expectedly, the classic Nernstian behavior of the boundary potential with a slope of 59.1 mV/dec can be observed at any IR concentration in membranes containing solely an ion exchanger (
Figure 2A). Interestingly, at any IR concentration in the polymeric phase, there is a domain in the response curve where the boundary potential remains stable. For example, at IR concentration 10
−1 M the membrane demonstrates stable interfacial potential up to 10
−3 M MX in the solution. Thus, in principle, any organic electrolyte can be used to stabilize the phase boundary potential with respect to variations of the aqueous electrolyte; the latter being consistent with the results obtained in ref. [
10].
Meanwhile, for membranes containing only the Q
+B
− electrolyte (
Figure 2B), the response to the solution concentration is substantially suppressed and the interfacial potential is stable up to 10
−3 M of MX the aqueous electrolyte already at a Q
+B
− content as low as 10
−5 M. The higher the Q
+B
− concentration in the membrane, the wider the range of MX concentrations where the potential remains stable. The membranes with low content of Q
+B
− exhibit a sub-Nernstian response with a slope of −36.8 mV/dec over a relatively narrow concentration range (
Figure 2B), with the response becoming anionic as compared to IR-containing membranes. The nature of this response can be explained by the process of anions coextraction due to the absence or deficiency of uncompensated anionic sites and, accordingly, of the cation-exchange capacity. This explanation is confirmed by the species concentration profiles (
Figure S2) simulated for the two different values of partition coefficient for the aqueous anion X
−. One can see that in the case of Q
+B
− electrolyte, the electrode response to MX concentration (
Figure 2B) appears due to the anion X
− interference caused by the effect of coextraction. Thus, to optimize the RE composition, it appears logical to ensure Donnan exclusion in the polymeric phase by introducing some amount of a cation exchanger (IR) into the membrane phase containing Q
+B
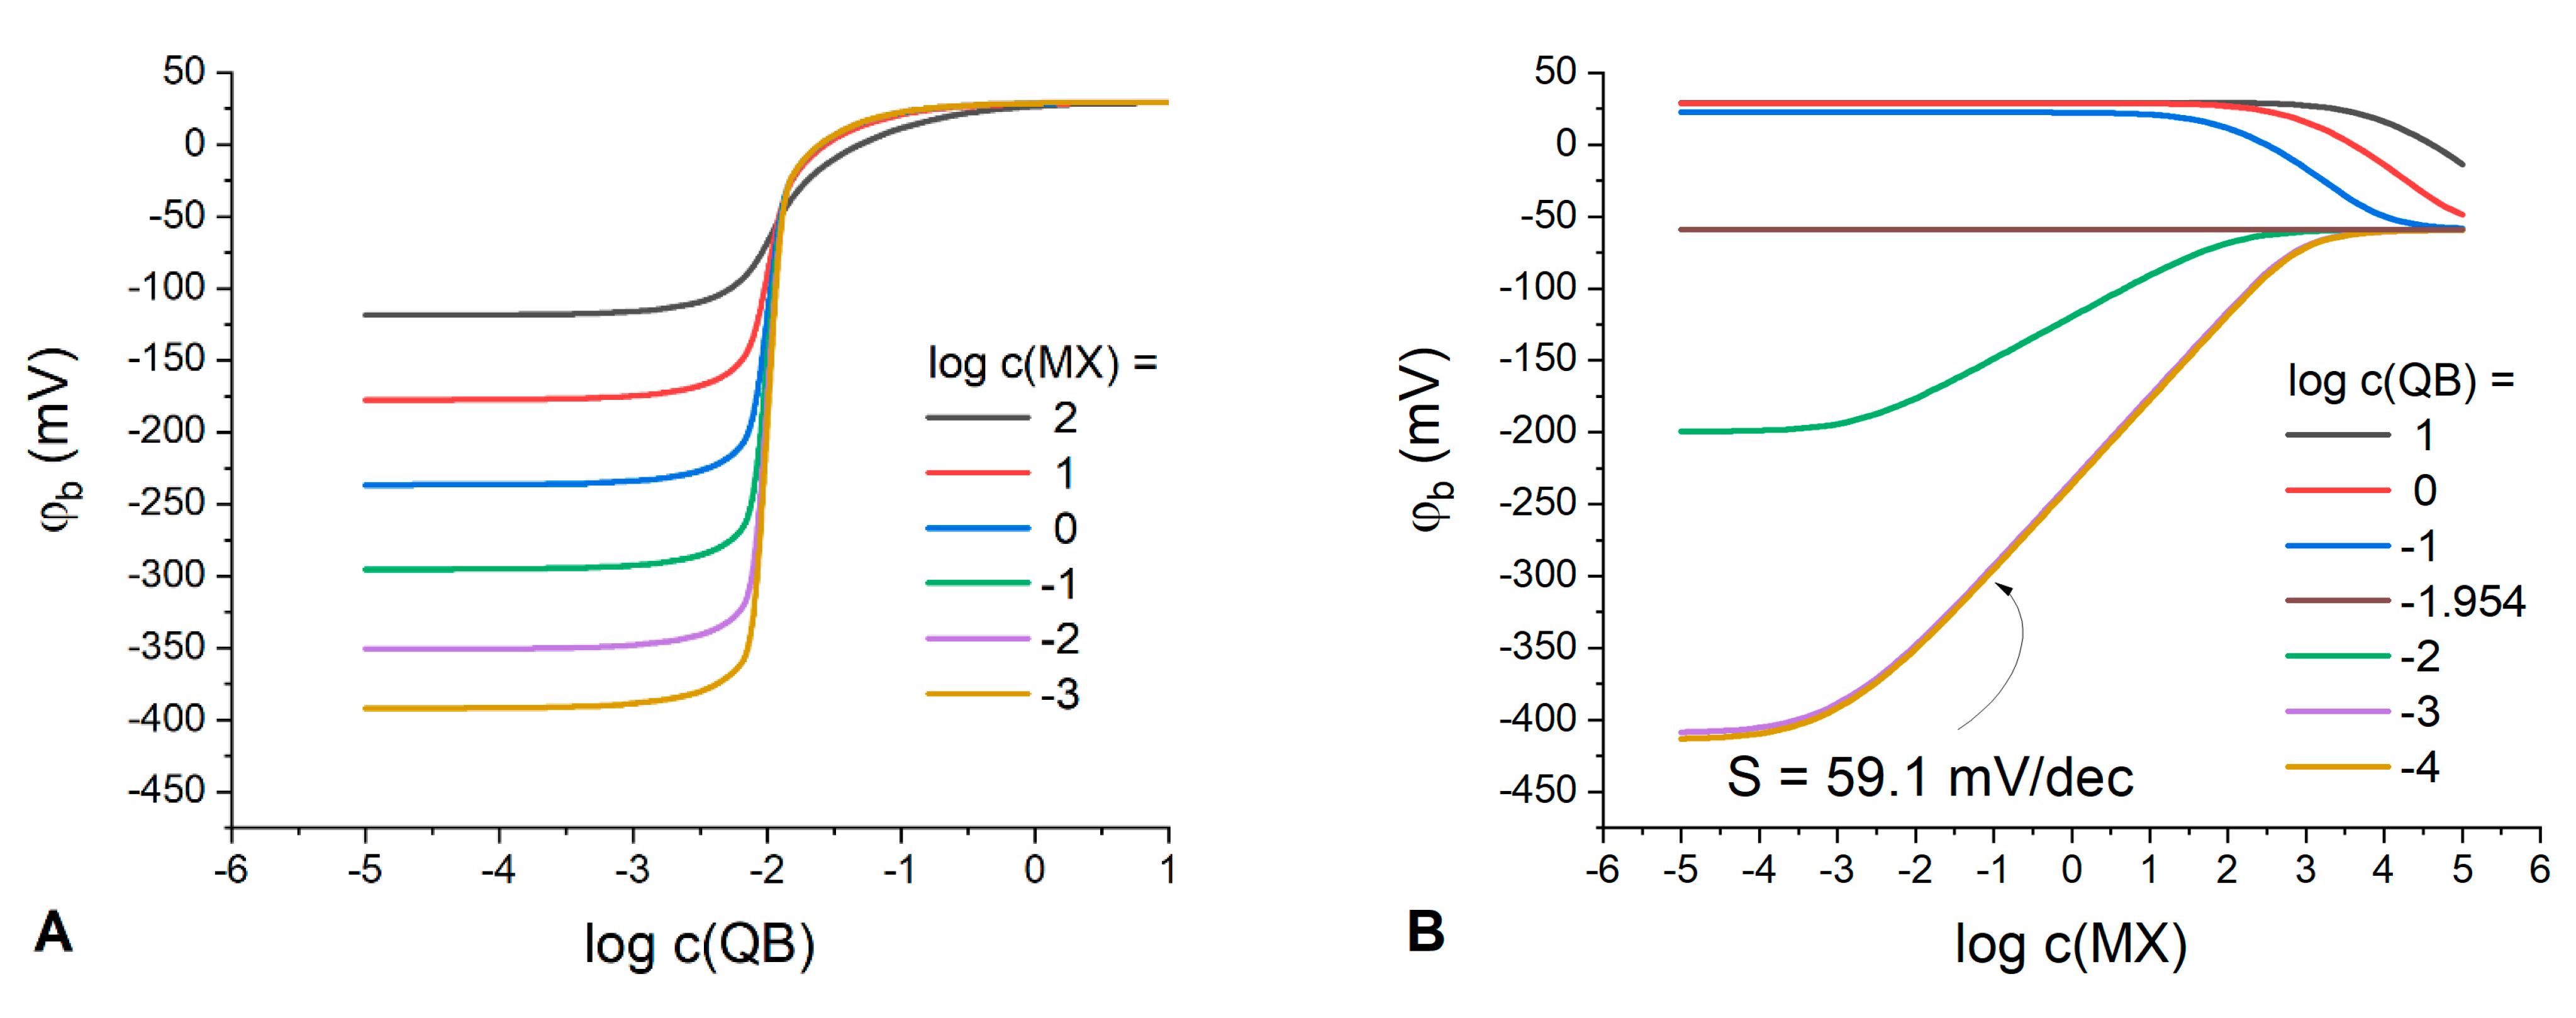
−. The phase boundary potential was simulated at various molar ratios of Q
+B
− to IR electrolytes added simultaneously to the membrane (
Figure 3).
Figure 3A shows that the combination of Q
+B
− and IR in the polymeric phase leads to a new shape of the dependences
as compared to
Figure 1, with a drastic potential jump at nearly equimolar IR to Q
+B
− ratio, followed by a plateau, with the location of the latter being independent on MX concentration. One can see from
Figure 3 that at
, the phase boundary potential curve demonstrates a Nernstian slope within its linear range (see
Figure 3B), whereas at
, a potential stabilization is observed in a wide range of MX concentrations (up to 10 M).
To qualitatively illustrate a drastic change of the boundary potential curves, the electrode membranes containing both IR (KT
pClPB) and Q
+B
− (ETH500) were prepared and their calibrations in KCl, NH
4Cl, CsCl and NaCl solutions were performed (
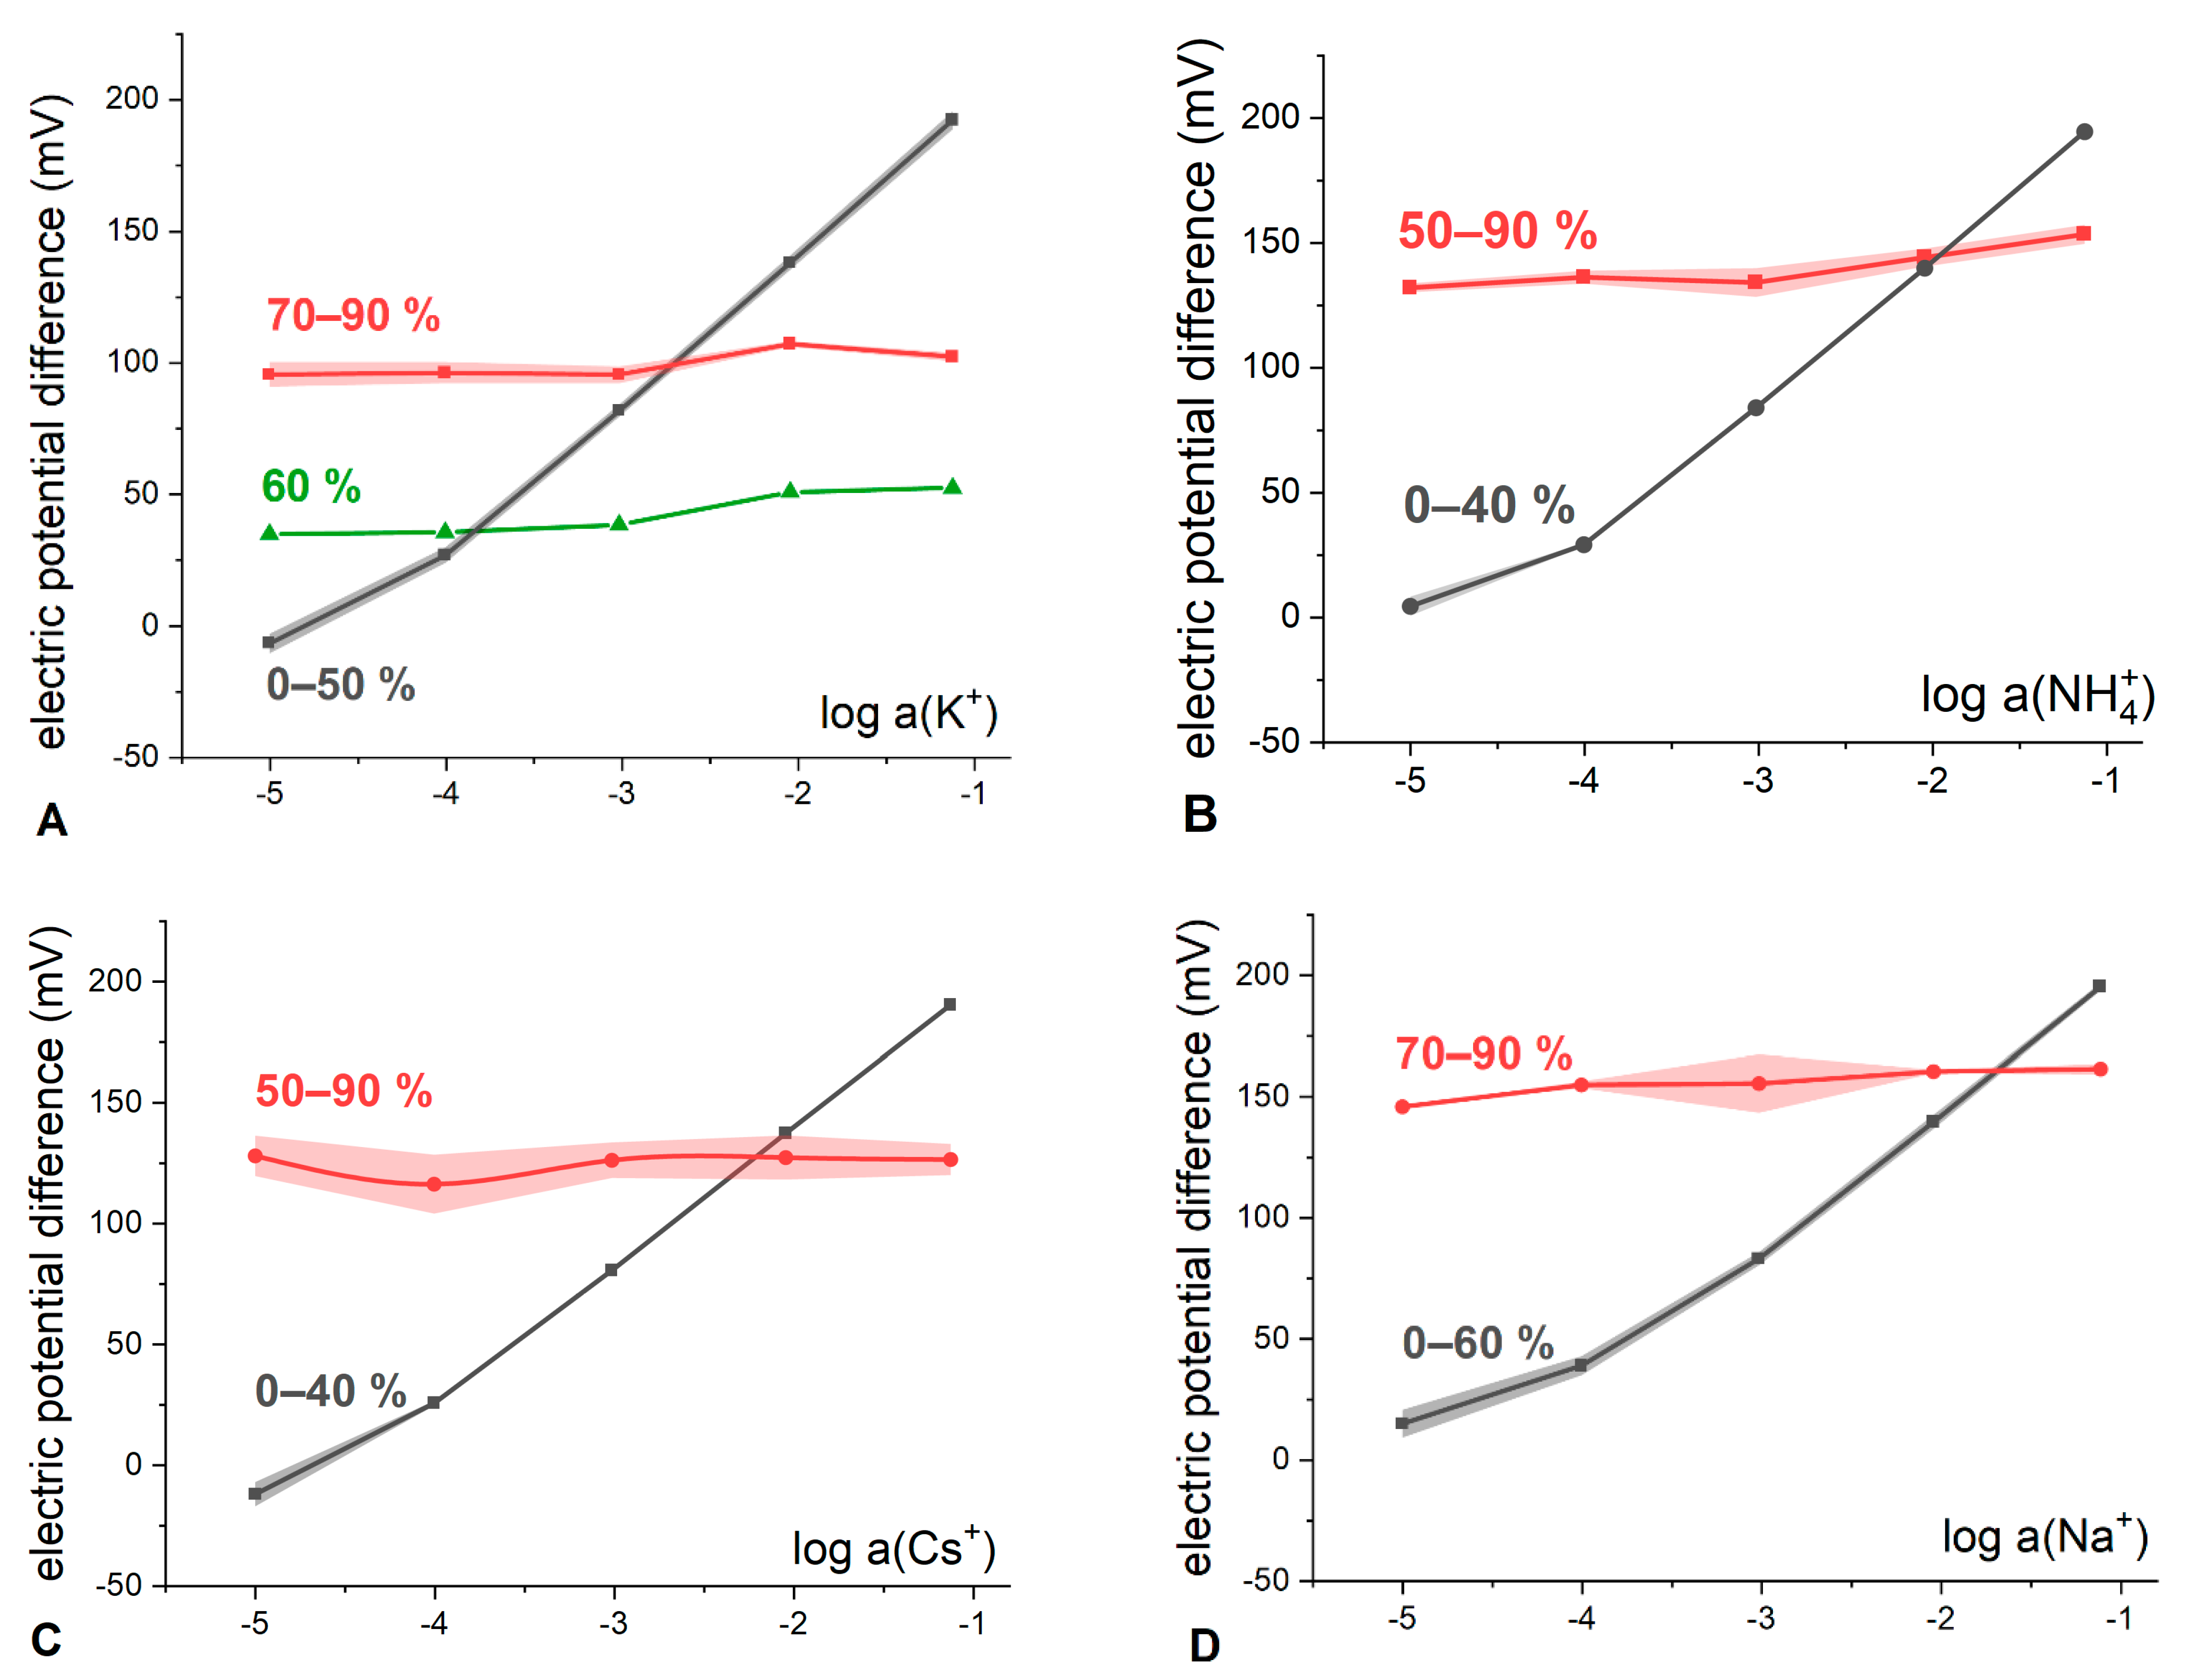
Figure 4).
Indeed, it can be observed that at sub-stoichiometric ratios of ETH500 to KT
pClPB content (black curves in
Figure 4) the measured electric potential difference (E) exhibits near-Nernstian dependence on the hydrophilic electrolyte activity with the slopes from 57 to 59 mV/dec (see
Table S1) in the solutions of KCl, NH
4Cl, CsCl and NaCl. At ETH500 to KT
pClPB ratios above equimolar (red curves in
Figure 4), the cationic function is lost, and the electrode begins to behave as a RE with the slopes as low as 1–5 mV/dec and average potential differences ranging from 100 to 155 mV. The values of E practically do not depend on the further increase in the ETH500 content, as predicted by the developed theoretical formalism.
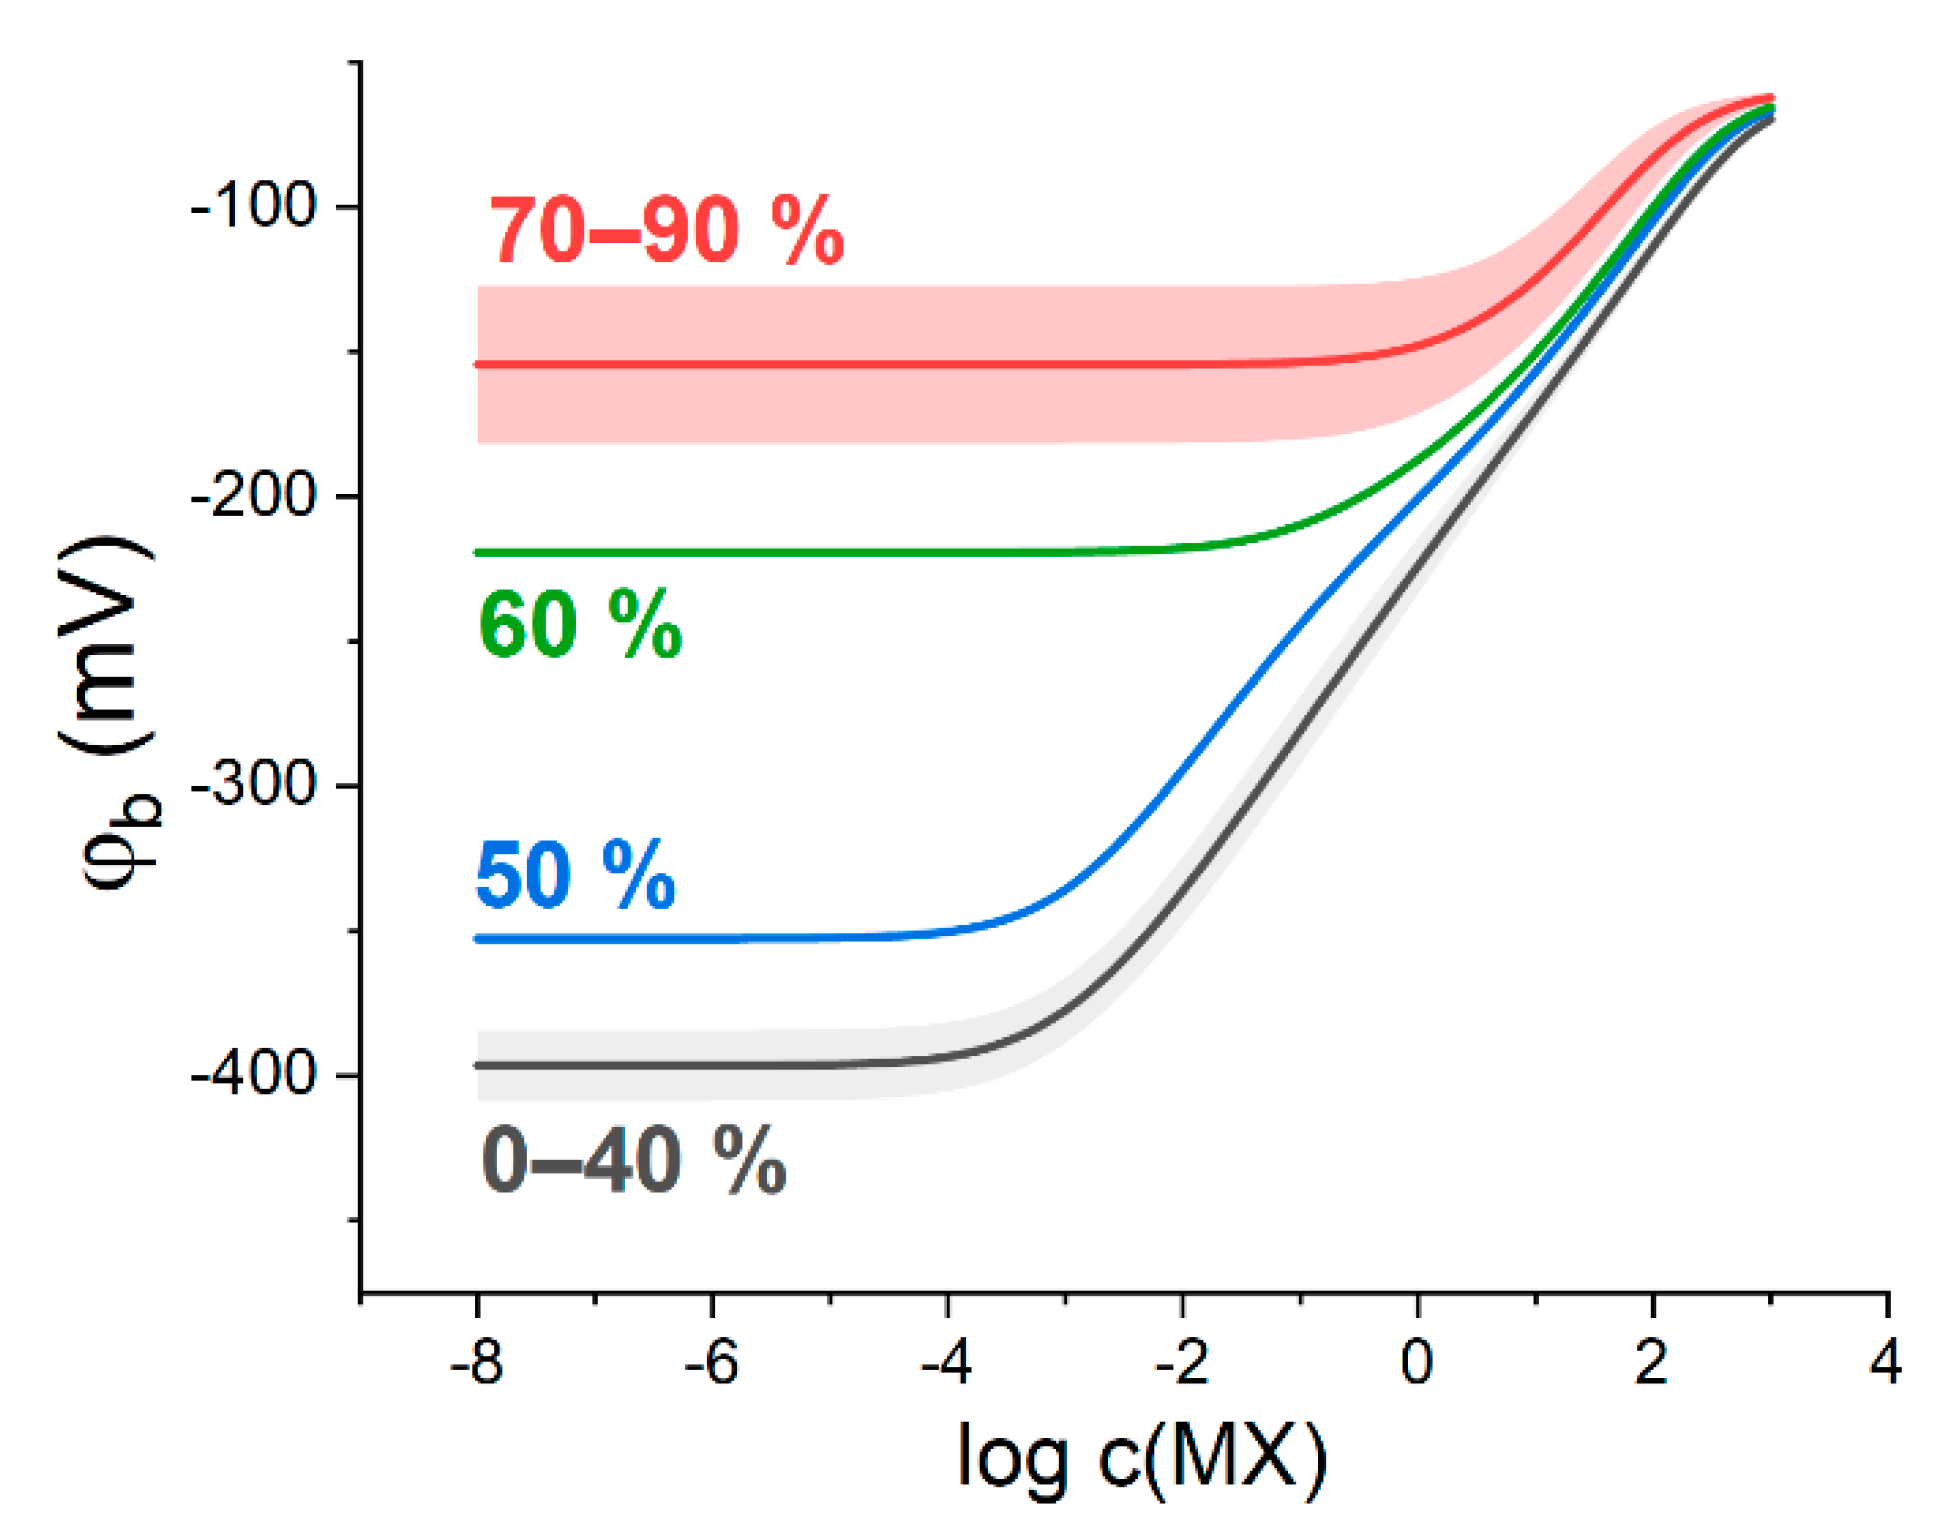
In parallel with the experiment, the response of membranes of the same composition was simulated at parameter values close to the experimental ones (
Figure 5).
Comparison of
Figure 4 and
Figure 5 suggests a good qualitative correspondence between experimental and simulated behavior of the membranes containing both salts. Experimental results do not contain a domain with cationic response in the most concentrated solutions, as opposed to the simulation. Meanwhile, in the case of KCl solutions (
Figure 4A) it was possible to register a response curve (60% of ETH500, green curve in
Figure 4A) which demonstrates a transition from the conventional cation-selective response (0 to 40% in
Figure 4A) to the RE-like behavior (70 to 90% in
Figure 4A). The slope of the response is already negligible (5.2 ± 1.2 mV/dec), but the mean value of potential difference is only 42.5 ± 8.6 mV which is much lower than the respective values for the membranes with higher ETH500 content. This type of “transitional” curves was obtained numerically as well (50 and 60%, blue and green lines in
Figure 5).
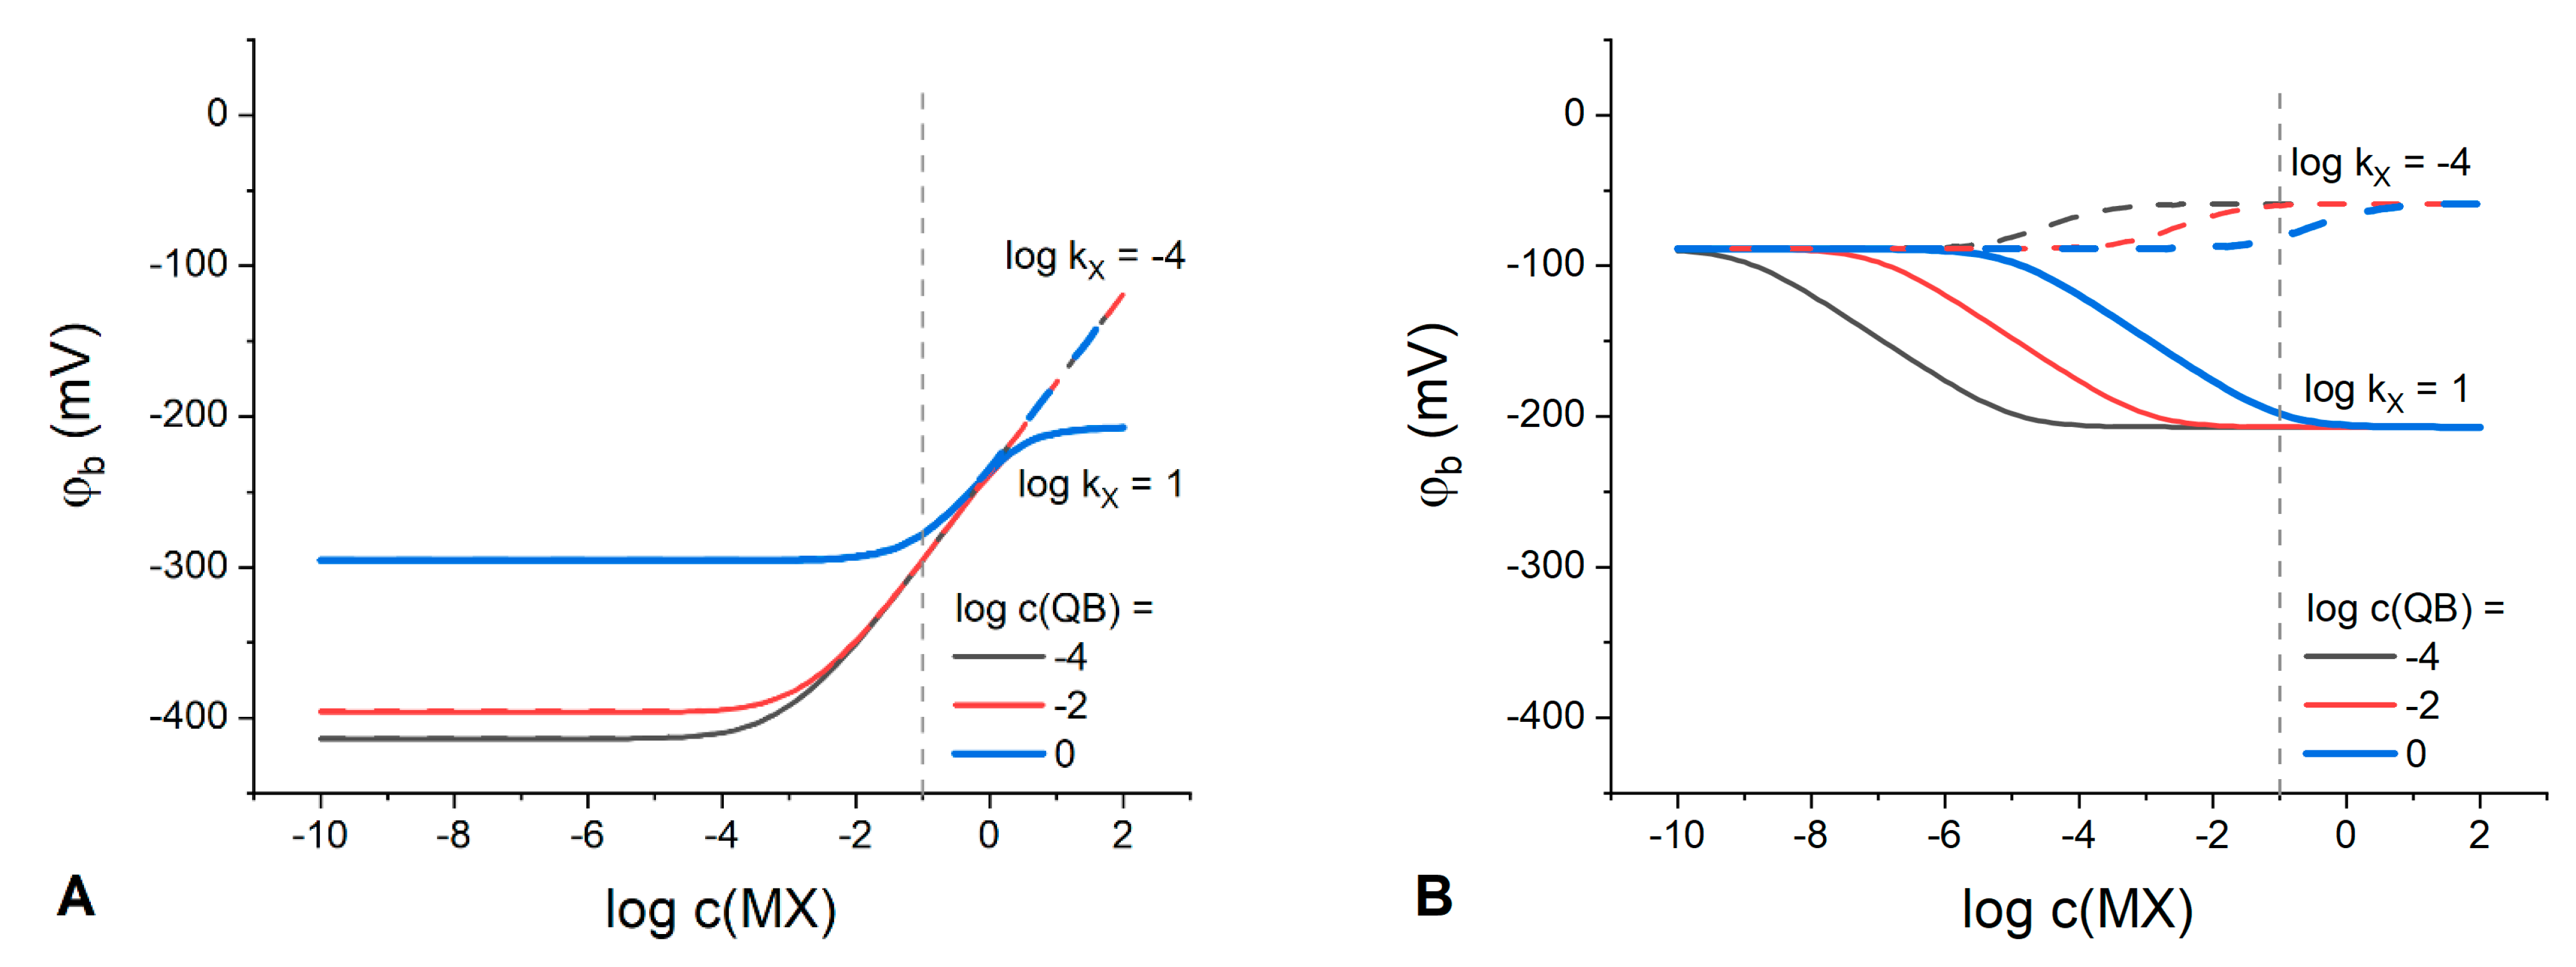
The influence of anion X
− lipophilicity on the interfacial potential of the membranes containing highly lipophilic organic electrolyte Q
+B
− (
,
) and cation exchanger IR (
,
) to MX concentration in the solution is demonstrated in
Figure 6A. For comparison,
Figure 6B shows anion effect in the response of Q
+B
−-containing but IR-free membranes.
Based on the comparison of
Figure 6A and 6B, one can observe that the addition of IR to the Q
+B
−-containing membranes crucially affects their response patterns with respect to anion interference. In the case of the membranes additionally doped with IR, the lipophilicity of the solution anion has almost no effect on the values of interfacial potential and its stability up to as high as 1 M MX solution (
Figure 6A). Moreover, in the presence of the IR electrolyte, the phase boundary potential is effectively stabilized with 1 M Q
+B
− in the membrane up to 10
−1 M MX solution regardless
value (blue line in
Figure 6A). Oppositely, the behavior of the membranes containing only the Q
+B
− salt strongly depends on the lipophilicity of the solution anion X
− (
Figure 6B). At the absence of the IR electrolyte, the phase boundary potential is nearly constant up to 10
−1 M MX at
, while for
it is stable only up to 10
−5 M MX, for the same concentration of Q
+B
−, 1 M. In addition, the span of the coextraction-induced anionic response is much larger in the case of a more lipophilic solution anion. Thus, to create polymeric REs based on lipophilic salts, it is beneficial to add a cation exchanger to the membrane along with the Q
+B
− but in the concentrations lower than those of organic electrolyte.
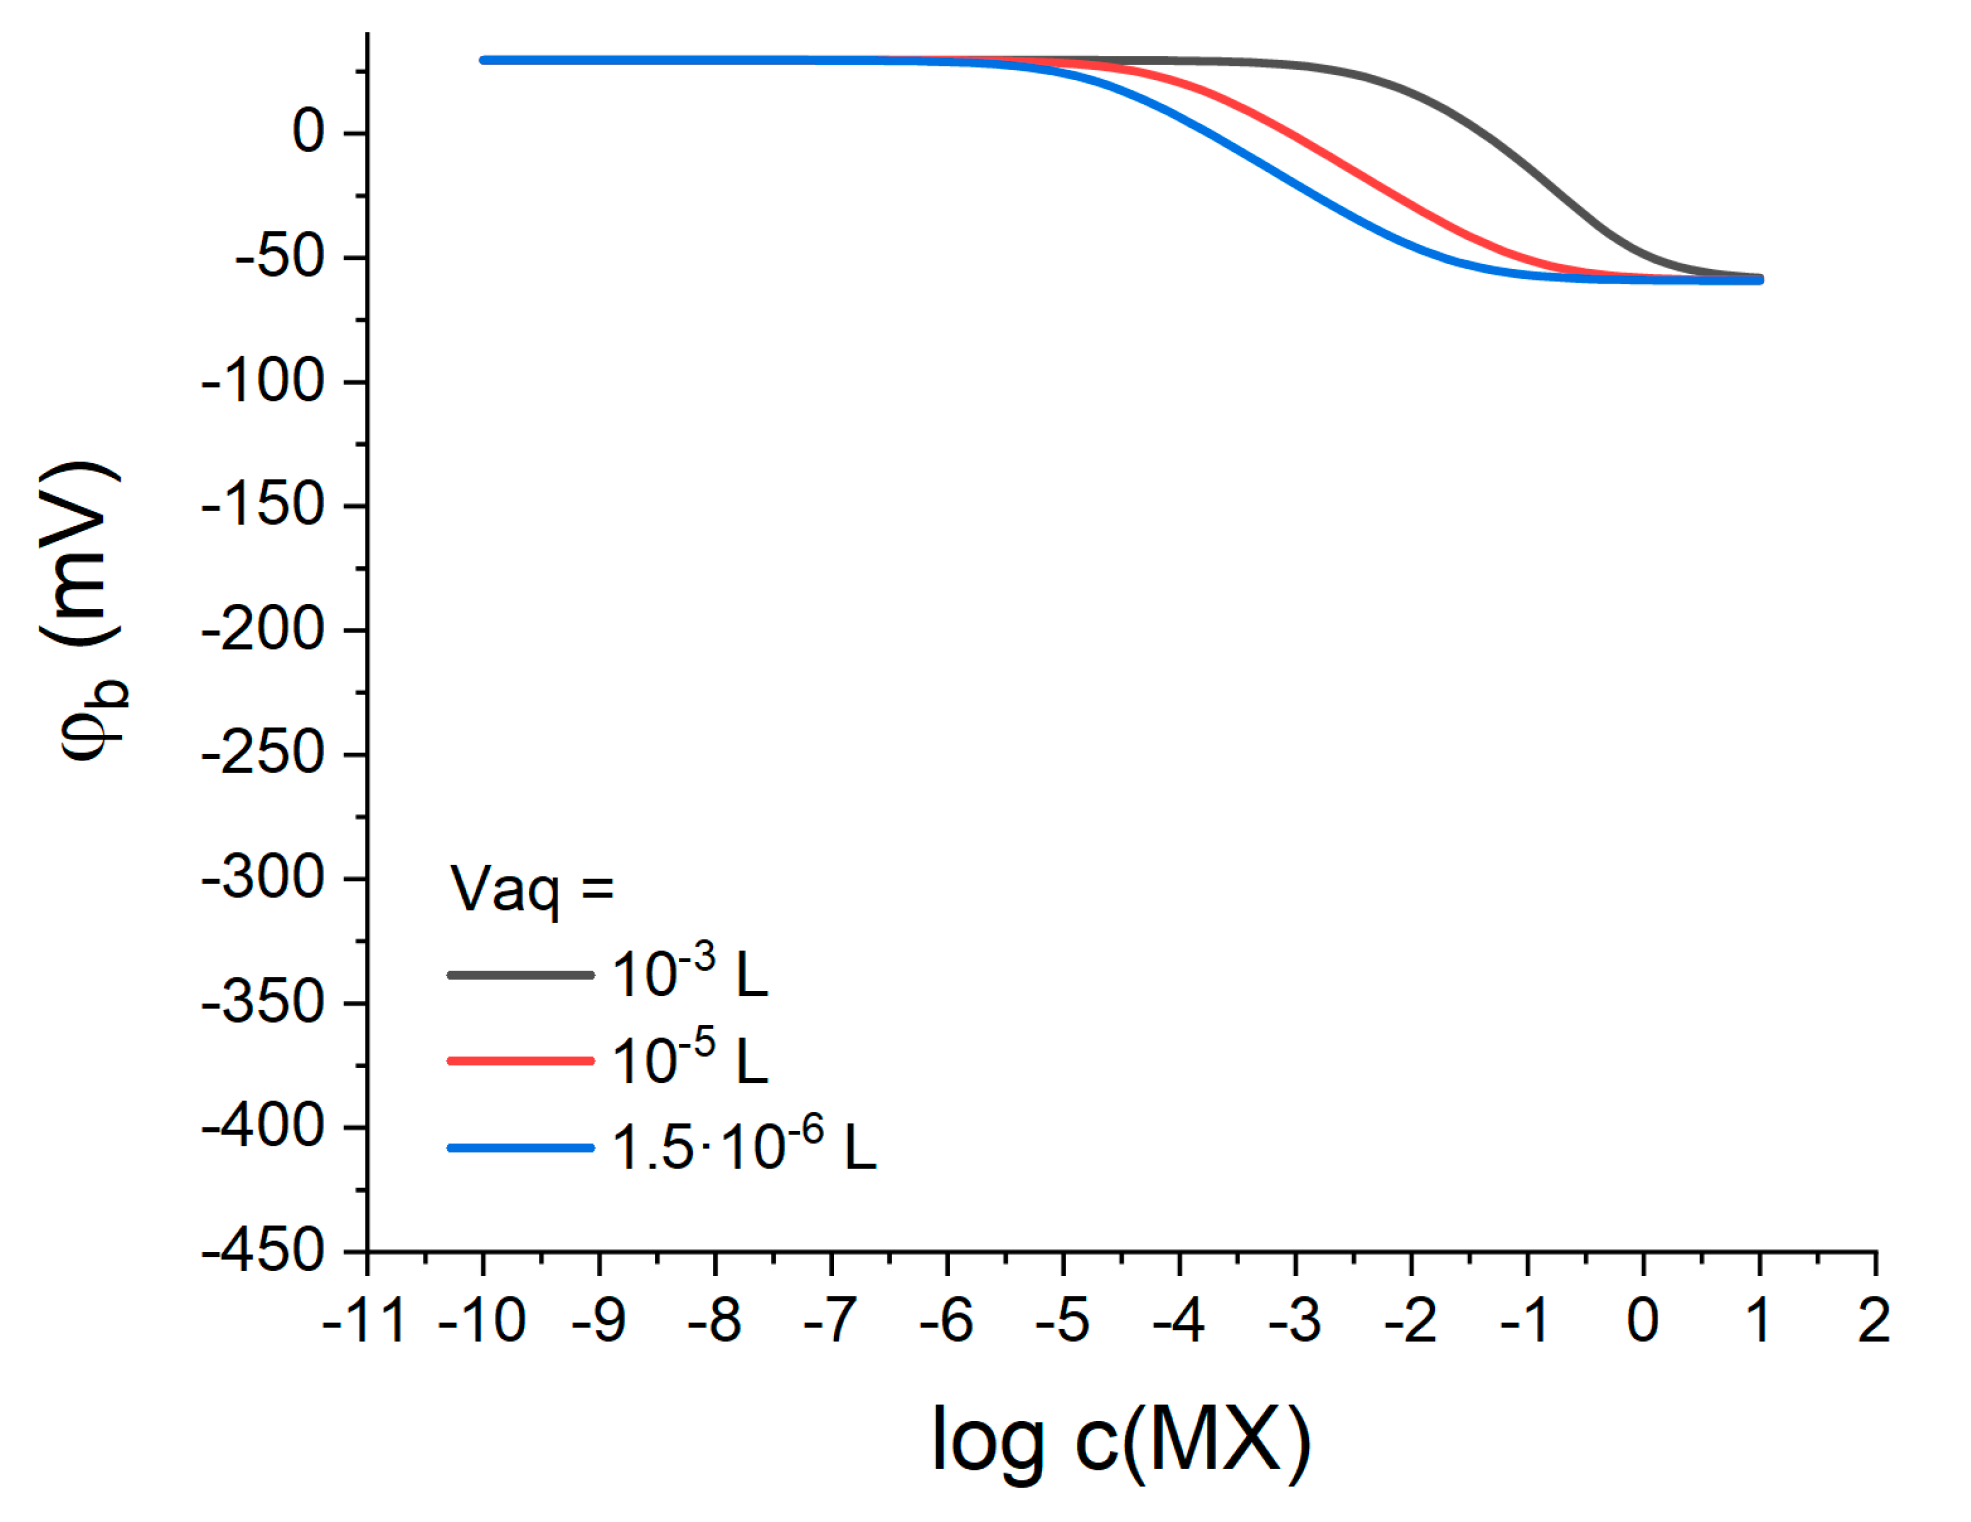
Following [
11], our model also suggests that the response of Q
+B
−-containing membranes should depend on the volumes of both polymeric and aqueous phases. To track this dependence, the response was simulated for various volumes of the aqueous phase at otherwise constant parameters (see above). The volume of the membrane phase was
, which is a typical value for an ion-selective electrode membrane (diameter 8 mm, thickness 0.2 mm). The volume of the aqueous phase was
, as in all previous simulations; or
, which is equal to the volume of the polymeric phase; or
, which is close to the volume of an aqueous diffusion layer 30 μm thick [
22] for a membrane with a diameter of 8 mm. The simulation results are shown in
Figure 7.
One can see from
Figure 7 that; indeed, the stability of the interfacial potential depends significantly on the volume of the aqueous phase. A decrease in the solution volume narrows the range of potential stability along the MX concentration axis and shifts it towards more dilute solutions. Compare the blue curve for the volume
and the black curve for
: the potential is stable up to
MX for a smaller solution volume, and up to
in the case of a larger volume. Meanwhile, the range of the anionic response in the first case is wider: ca. 10
−6–10
−1 M MX for
solution volume and from 10
−3 to 1 M for volume of
. Thus, in order to optimize the behavior of LJF reference electrodes based on lipophilic salts it is necessary to take into account the volume ratio of the membrane and the solution and ensure a sufficient excess of the latter.
It is generally accepted that the addition of the salt bridge electrolyte, e.g., KCl, to the Q
+B
−-based membranes enhance the characteristics of the resulting LJF reference electrodes. It was experimentally confirmed in [
15,
23,
24], but has never been discussed theoretically. We performed numerical simulation of the boundary potential according to the proposed model, taking into account the partition of a hydrophilic electrolyte between the polymeric phase and the diffusion layer of the aqueous phase, see
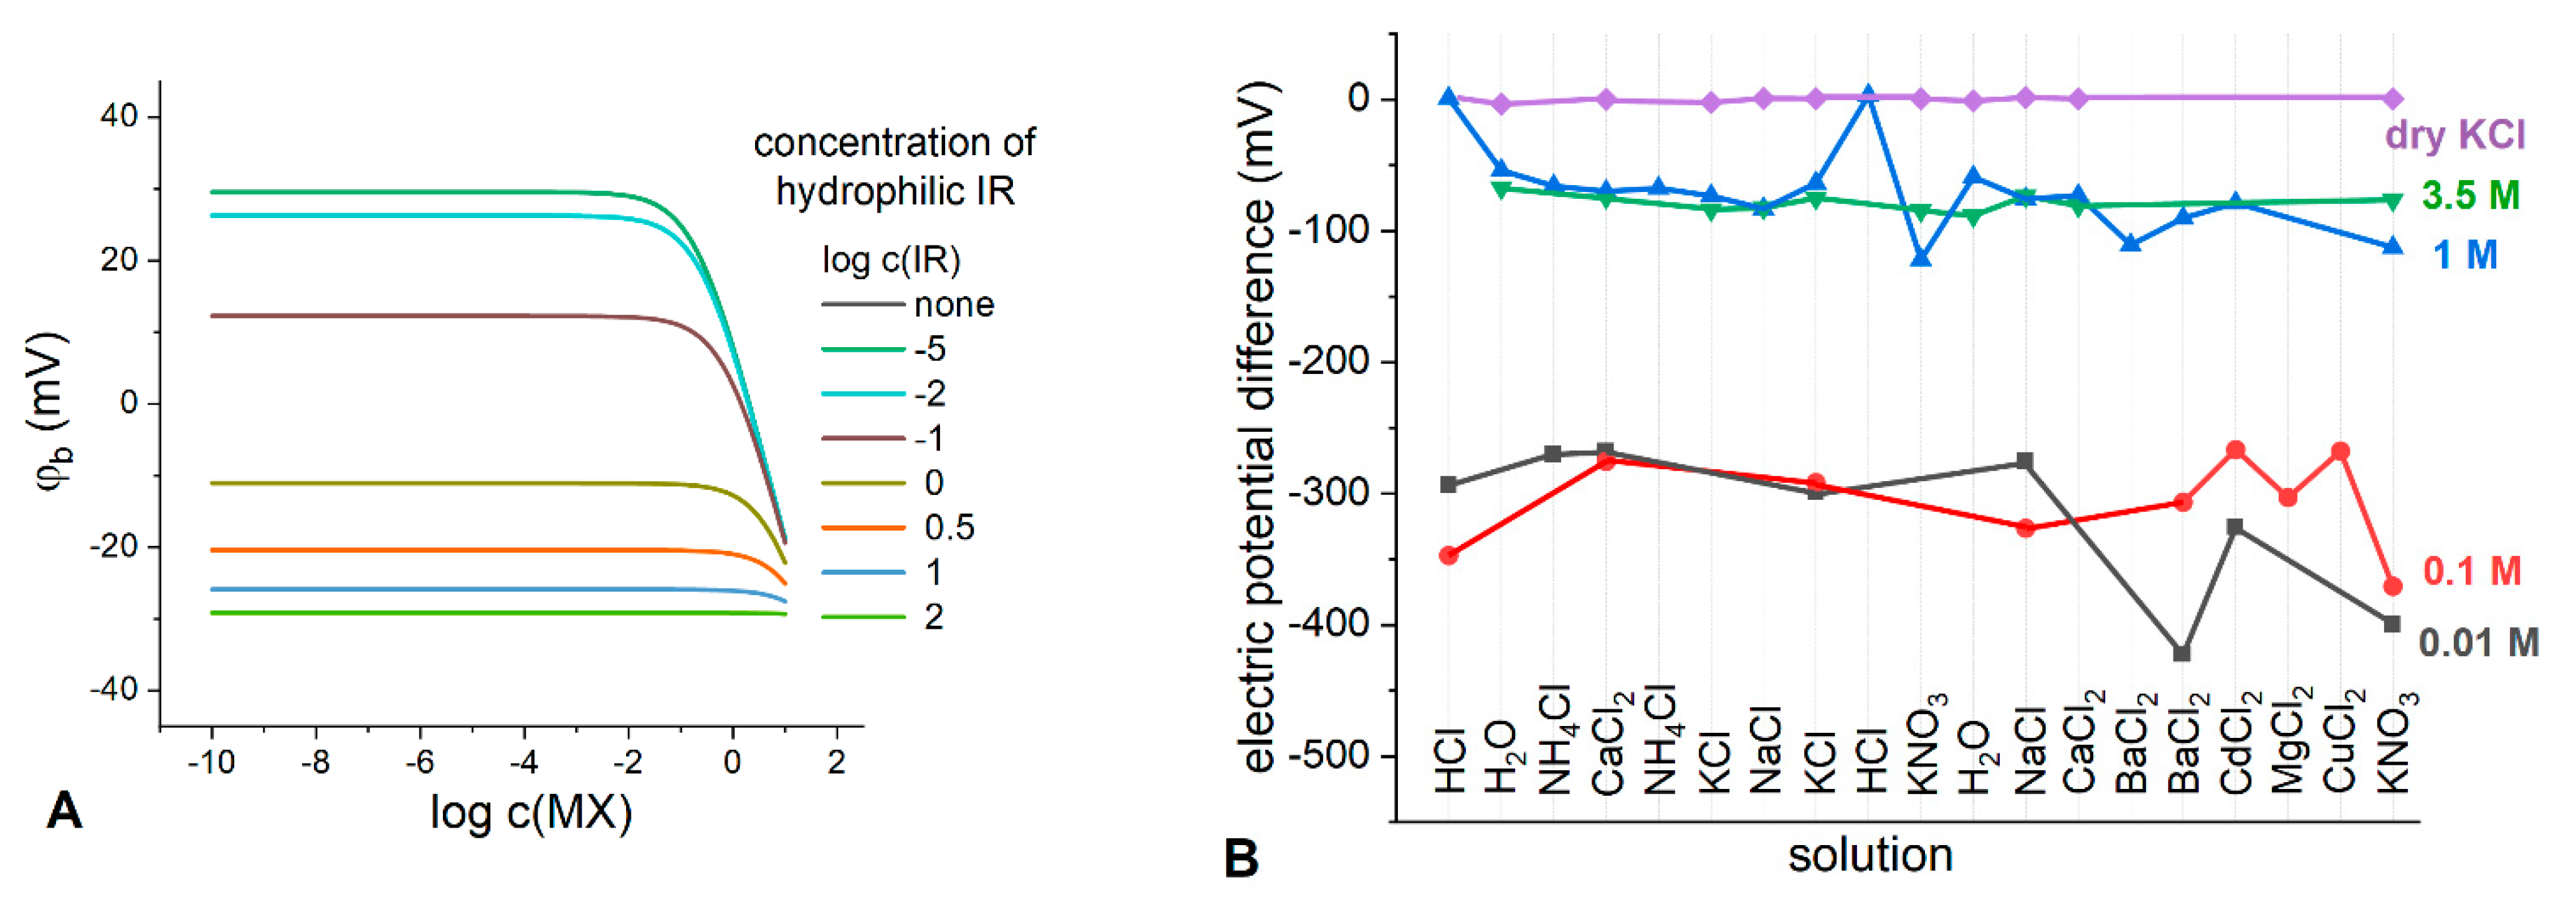
Figure 8A. Now, IR is a hydrophilic electrolyte added to the membrane, MX is a solution electrolyte.
As can be seen from
Figure 8A, even at relatively high concentrations of lipophilic electrolyte Q
+B
−, the addition of a hydrophilic electrolyte to the membrane affects the stability of the phase boundary potential: the higher the concentration of hydrophilic IR, the wider is the range of potential stability. Apparently, partition of the hydrophilic ions contributes to the overall effect of potential stabilization.
To experimentally track the effect of hydrophilic electrolyte content in the membranes containing Q
+B
−, we prepared the membranes containing TBATBB salt which was found earlier to be optimal for developing LJF REs [
15]. The electrodes were prepared, and their TBATBB-based membranes were loaded with KCl in different ways: by soaking the membranes in the solution of KCl with concentrations of 0.01 M, 0.1 M, 1 M and 3.5 M (saturated), and, finally, by introducing dry KCl into the membrane during its fabrication. The electric potential difference was measured against saturated Ag/AgCl electrode in the solutions of different nature and concentration. The results are shown in
Figure 8B. As expected, the membranes soaked in the least concentrated 0.01 M KCl solution showed the least stable potential in the entire range of the studied electrolytes with an average potential difference of −319.5 ± 60.0 mV. Increasing the concentration of the soaking solution leads to more stable potential differences, meanwhile their average values increase: −306.1 ± 36.2 mV, −70.3 ± 33.3 mV, and −78.6 ± 6.5 mV for 0.1 M, 1 M and 3.5 M (saturated) soaking solutions, respectively. The membranes containing dry KCl along with TBATBB demonstrated an extremely stable potential of 0 ± 1.6 mV for the entire range of the studied electrolytes. This finding is consistent with the results of the simulation performed in this work, as well as with the experimental data obtained earlier [
15,
23,
24].


