Article

Analysis of Calcium Sulfate Scaling Phenomena on Reverse Osmosis Membranes by Scaling-Based Flux Model

by
Fumio Yokoyama
1,2,
Mitsutoshi Nakajima
1,2 and
Sosaku Ichikawa
1,*
1
Faculty of Life and Environmental Sciences, University of Tsukuba, Tsukuba 305-8572, Japan
2
Alliance for Research on Mediterranean and North Africa, University of Tsukuba, Tsukuba 305-8572, Japan
*
Author to whom correspondence should be addressed.
Membranes 2022, 12(9), 894; https://doi.org/10.3390/membranes12090894
Submission received: 4 August 2022 / Revised: 2 September 2022 / Accepted: 8 September 2022 / Published: 17 September 2022

Abstract

:
In this study, the behavior of permeate flux decline due to scale precipitation of calcium sulfate on reverse osmosis membranes was investigated. The proposed scaling-based flux model is able to explain that permeate fluxes attributed to three mechanisms of scale precipitation—cake formation, surface blockage, and mixed crystallization—converge to the same newly defined scaling-based critical flux. In addition, a scaling index is defined, which determines whether scale precipitates on the membrane. The experimental results were analyzed based on this index. The mass-transfer coefficients of flat membrane cells used in the experiments were measured and, although the coefficients differed, they could be summarized in the same form as the Leveque equation. Considering the results of the scale precipitation experiments, where the operating conditions of pressure, solute concentration, temperature, and Reynolds number were varied, the convergent values of the permeate fluxes are explained by the scaling-based critical fluxes and the scale precipitation zones by the scaling indexes.

1. Introduction

Since Loab and Sourirajan developed a workable reverse osmosis (RO) membrane of cellulose acetate in 1960 [1], the development of the RO process over the past six decades has been remarkable. A major application of the RO process is the production of drinking water by seawater desalination, including the Ashkelon desalination plant that processes 330,000 m3/d, equivalent to about 15% of the domestic water consumption in Israel, and desalination applications for drinking water and industrial water production by brackish water desalination [2]. The RO process is an indispensable technology for the production of ultrapure water for the cleaning of semiconductors and liquid crystals. In regions that have domestic water shortage areas, such as the U.S., China, India, the Middle East, and Singapore, the RO process is used to produce drinking water, industrial water, and agricultural water using municipal sewage as raw water. Factory wastewater is treated by the RO process and reused as industrial water. In the food industry, the RO process is widely used for the concentration and recovery of valuable materials, such as the concentration of juice from oranges and tomatoes, and recovery of whey in the dairy industry [3,4].
The main problem in the practical operation of RO plants is the prevention and prediction of RO membrane performance degradation. The causes of performance degradation of RO membranes can be divided into two categories: degradation of the RO membrane itself, including chemical degradation due to oxidation and hydrolysis, biological, and physical degradation; and fouling of the RO membrane, which includes the adsorption of dissolved substances, deposition of organic and colloidal materials, and precipitation of sparingly soluble inorganic substances (scale) on the membrane. Of these, the precipitation of sparingly soluble inorganic substances, such as calcium, magnesium, and silica compounds, on RO membranes is a problem in brackish water desalination, causing restriction of the recovery ratio of product water. In seawater desalination, the problem is the increasing risk of precipitation of calcium and magnesium compounds in the concentrated brine due to the increasing recovery ratio of the produced water [5].
Okazaki and Kimura [6] were the first to analyze scale precipitation phenomena on RO membranes from a chemical engineering point of view. They proposed the ‘cake formation’ mechanism, in which precipitated scale forms a cake layer, to explain the permeate flux decline due to scale precipitation and investigated the transient state of permeate flux decline in detail, including a study of the waiting period for scale precipitation to start from the supersaturated state of solute concentration. However, in the convergent stage of permeate flux decline, they only stated that the solute concentration at the membrane surface became equal to the saturated concentration and the permeate flux converged to a constant value. Regarding analyses of scale precipitation phenomena on RO membranes, many reports have been presented on experiments related to the transient state, in which scale precipitation occurred and the permeate flux decreased rapidly [7,8,9,10,11,12,13,14,15,16]. Experiments and analyses of the transient state of scale precipitation on RO membranes based on the cake formation mechanism were conducted by Okazaki and Kimura [6] and other researchers [8,17].
In contrast, a surface blockage mechanism was proposed by Gilron et al. [18] and was later followed by supporting reports [7,19,20,21,22,23,24,25]. Experiments and analyses based on this mechanism were performed by Gilron et al. and others [18,20,21,22,23,26]. In response to these competing theories, Lee et al. reported that precipitation was due to both surface blockage and cake formation occurring during precipitation, based on experimental data [27]. Their view was subsequently supported by experimental observation and analyses by other researchers [9,10,28,29,30,31,32,33,34,35,36,37].
The convergent stage of permeate flux decline due to fouling on the membranes in RO, nanofiltration, ultrafiltration, and microfiltration was intensively investigated based on three indices regarding the deposition of organic and colloidal suspended materials on the membranes: critical flux, below which no fouling occurs and a decline of flux with time does not occur [38,39,40,41,42,43,44,45,46,47,48,49,50,51,52,53,54,55,56]; threshold flux, at or below which a low or nearly constant rate of fouling occurs and above which the rate of fouling increases markedly [44,46,49,50,52,53,54,55,56,57,58,59]; and limiting flux, which represents the maximum stationary permeate flux that can be reached by increasing the transmembrane pressure [42,44,46,49,55,60,61].
In contrast, there are only a few reports on the convergent stage of permeate flux decline during scale precipitation on RO membranes. Critical flux detection in a silica scaling RO system was studied by Lisitsin et al. [19]. The application of an equation for determining the critical flux of colloidal fouling due to scale precipitation was studied by Shirazi et al. [30]. These reports studied only the transient state of permeate flux decline or the proposed application of an analytical model of colloidal fouling (deposition) to scale precipitation on the membrane surface, so further studies are needed.
In this study, we focused on the convergent stage of the permeate flux decline at the time of precipitation of sparingly soluble inorganic substances (scale) on the RO membrane and investigated the operating conditions in the scaling (scale precipitation) zone, which is an important factor for RO membrane performance degradation in practical operation.
Here, deposition and precipitation are defined as follows: deposition is a phenomenon in which insoluble suspended materials in water adhere to the membrane surface; precipitation is a phenomenon in which solute dissolved in water is concentrated to become insoluble material that adheres to the membrane surface.

2. Materials and Methods

2.1. Reagents and Concentration Measurement Methods

The sodium chloride (NaCl) and calcium sulfate dihydrate (CaSO4·2H2O) used in this experiment were special-grade reagents from Fujifilm Wako Pure Chemical Corp., Osaka, Japan. Pure water (electrical conductivity less than 1.0 × 10⁻⁴ S/m) was obtained from tap water treated with an ion-exchange resin cartridge supplied by Nomura Micro Science Co., Ltd., Atsugi, Japan.
The solutions of NaCl and CaSO4 were prepared by dissolving NaCl and CaSO4 · 2H2O of the reagents in pure water. The solute concentrations of NaCl and CaSO4 were measured according to the following relationship between electrical conductivity and concentration, which was determined at 25 °C by preliminary investigation:
Y = 1522X2 + 4720X,
where X is electrical conductivity (S/m), and Y is NaCl concentration (mg/L) within the range of less than 1000 mg/L.
The formula for the relationship between electrical conductivity and CaSO4 concentration at 25 °C is as follows:
Y = 15,200X2 + 6150X,
where X is electrical conductivity (S/m), and Y is CaSO4 concentration (mg/L).

2.2. Reverse Osmosis Membranes

The four types of RO membranes used in the experiments were made of cross-linked fully aromatic polyamide composites and were manufactured by Toray Industries, Inc., Tokyo, Japan. Table 1 shows the performance datasheet information supplied by the membrane manufacturer.

2.3. Flat Membrane Cells

Cells A and B used in the experiments were Membrane Master CT-10 lamellar flow-type flat membrane test cells of transparent acrylic resin made by Nitto Denko Corp., Osaka, Japan. The effective membrane area was 58.4 cm2 and the cross-sectional area of the feed channel was a rectangle with a length of 0.75 mm and width of 36.0 mm. External and internal views of the cell are shown in Figure 1a,b, respectively.

2.4. Experimental Equipment

A flow diagram of the experimental equipment used for the mass-transfer coefficient measurement and scale precipitation experiments is shown in Figure 2. In the mass-transfer coefficient measurement, NaCl and CaSO4 were used as solutes; in the precipitation experiments, CaSO4 was used as the solute. The concentration of NaCl or CaSO4 was adjusted in the raw water reserve tank (capacity: 1000 L). Raw water was supplied to a feed tank with a capacity of 30 L by a circulation pump. Some of the raw water that overflowed the feed tank was returned to the raw water reserve tank. A polysulfone hollow fiber filter (Toraycube, manufactured by Toray Industries, Inc.) with a nominal pore size of 0.3 μm was installed in the circulation line to prevent inflow of suspended particles to the feed tank. The temperature of the feed solution in the feed tank was controlled to maintain a set value by a heater in the tank and a heat exchanger installed in the circulation line. The feed solution in the feed tank was fed in series to Cells A and B, which were equipped with RO membranes, by a high-pressure pump. By adjusting three valves, namely, (1) the inlet valve to Cell A at the outlet of the high-pressure pump, (2) the bypass valve that returns the feed water from the high-pressure pump to the feed tank, and (3) the outlet valve of Cell B, the feed water to Cell A was set to the desired pressure and flow rate (i.e., Re). The pressure at the inlet and outlet of Cells A and B was continuously recorded using a sensor installed in the pressure gauge. The permeate through the RO membranes in Cells A and B was collected in a beaker with a siphon, and the permeate flow rate was measured by weighing the unit time mass with an electronic balance (model CG-300, Shinko Denshi Co., Ltd., Tokyo, Japan) and automatically recorded by a personal computer. The concentrate from Cell B was measured by a rotameter flowmeter and the concentrate flow rate was measured by weighing the unit time mass in a beaker with a siphon using an electronic balance (model CG-1500, Shinko Denshi Co., Ltd.). To exclude the effect of seed crystals that may have been present due to precipitation, the experiment was conducted using a one-pass method, in which the feed solution was not circulated, and the concentrate was discharged outside the system.

2.5. Mass-Transfer Coefficient Measurement

2.5.1. Previous Studies

Transport phenomena of the solute near the RO membrane surface are shown in Figure 3. To model these phenomena, the permeate flux equation based on concentration polarization is expressed as follows [62]:
Jv = k ln{(CmCp)/(CbCp)},
where Jv: permeate flux; k: mass-transfer coefficient; Cb: bulk feed concentration; Cp: permeate concentration; and Cm: concentration at membrane surface.
From a chemical engineering point of view, the value of k is usually calculated using dimensionless correlation equations, such as the Sherwood (Sh), Reynolds (Re), or Schmidt (Sc) numbers, which are respectively expressed by the following equations:
Sh = kdh/D;
Re = ρudh/μ;
Sc = μ/(ρD),
where dh: hydraulic diameter; D: diffusion coefficient; ρ: density of solution; u: feed flow velocity; and μ: viscosity of solution. The Leveque equation provides a dimensionless correlation for laminar flow in a channel [62]:
Sh = 1.86(Re·Sc·dh/L)0.33,
where L: length of channel. The value of k is obtained using the Leveque equation for laminar flow in a channel (Equation (7)) and the Sherwood number (Equation (4)).

2.5.2. Measurement of Mass-Transfer Coefficient by Velocity Variation Method

The flat membrane cell used in this work had a complicated shape in which the feed inlet and concentrate outlet were not at the edge of the cell, so the mass-transfer coefficient was directly measured using the velocity variation method [63,64]. The observed rejection (Robs) by actual measurement of the RO membrane is given by the following equation:
Robs = 1 − Cp/Cb.
The real rejection (R) of the RO membrane is given by:
R = 1 − Cp/Cm.
Substituting Equations (8) and (9) into Equation (3) and transforming it yields:
ln{(1 − Robs)/Robs} = ln{(1 − R)/R} + Jv/k.
In general, k is a function of the feed flow velocity (u) and the following equation can be applied, where a and b are constants:
k = bua.
Substituting Equation (11) into Equation (10) gives:
ln{(1 − Robs)/Robs} = ln{(1 − R)/R} + (Jv/bua).
This means that a linear plot of ln{(1 − Robs)/Robs} against Jv/ua is obtained and the real rejection R is given by extrapolation to the ordinate. Using this value of R, k is calculated by Equation (10).

2.6. Scale Precipitation Experiments

Experiments were conducted to investigate the precipitation of CaSO4 on the RO membrane. The effects of feed pressure, solute CaSO4 concentration, temperature, and Re on scale precipitation and membrane performance were investigated. Three types of RO membranes were used: UTC-70UL, UTC-70, and UTC-80, which had high, medium, and low permeate fluxes, respectively.

3. Results and Discussion

3.1. Mass-Transfer Coefficient

3.1.1. Experimental Measurement of Mass-Transfer Coefficient by Velocity Variation Method

Cells A and B were loaded with the UTC-60 low-rejection membrane. The results of measurements of k at 20 °C, 30 °C, and 35 °C as a function of Reynolds number are shown in Figure 4. The hydraulic diameter dh was calculated according to the method reported by Shock and Miquel [65]. Figure 4a shows the relationship between Re and Jv, in which Jv was constant and independent of Re, indicating that the experiment was conducted within the range where the velocity variation method can be applied. Figure 4b shows the relationship between Jv/u0.33 and (1 − Robs)/Robs. The relationship between Re and k is shown in Figure 4c. The results agree well with those of Kimura and Sourirajan, who stated that k is proportional to Re to the power of 0.33 in the laminar region, confirming that the experiments were conducted in the laminar region [66]. Identical values of k were obtained for Cells A and B.

3.1.2. Determination of Mass-Transfer Coefficient in Flat Membrane Cell

As described in Section 2.5.1, the Leveque equation, shown in Equation (7), is a dimensionless correlation equation for the mass-transfer coefficient in regions of laminar and channel flows. These experiments were conducted in the laminar and channel flow regions, as described in Section 3.1.1, so the experimental results for the CaSO4 and NaCl solutes at temperatures of 20 °C, 30 °C, and 35 °C were summarized in the form of the Leveque equation and plotted as shown in Figure 5a. Because the real rejection of CaSO4 was high in these experiments (approximately 98%), NaCl, which has a lower rejection of approximately 70%, was also examined. The concentrations of NaCl and CaSO4 in the feed solution were sufficiently low (100–160 mg/L) to assume that the physical properties of the feed solution, ρ and μ, were same as those of pure water. The values of ρ and μ of pure water at different temperatures are given by the Chemical Engineers’ Handbook [67]. The values of D of NaCl in water at different temperatures were given by their measured values and the equation for temperature dependence of the diffusion coefficient by Olson et al. [68]. The values of D of CaSO4 in water at different temperatures were given by Haskell’s equation [69] and the Chemical Engineers’ Handbook [67]. The results could be summarized by the following dimensionless correlation with a coefficient of 1.15:
Sh = 1.15(Re·Sc·dh/L)0.33.
The difference between the coefficient of 1.86 of the Leveque equation and this experimental coefficient of 1.15 can be attributed to the difference in the geometry of the flat membrane cell used in the experiments, particularly the solution inlet and outlet positions, as shown in Figure 5b. Mass-transfer coefficients of the flat membrane cell under operating conditions could be calculated using Equations (4) and (13).

3.2. Permeate Flux Change with Time

3.2.1. Introduction of Scaling-Based Flux Model

Three types of scale precipitation mechanisms related to the decline in permeate flux in RO membranes are proposed: cake formation, surface blockage, and mixed crystallization, as shown in Figure 6 [27,28,31,33]. The convergent values of decline in permeate flux by each mechanism were studied using a newly proposed scaling-based flux model.
(a)
Cake formation mechanism
Under the condition of no scale precipitation on the membrane surface, shown in Figure 3, Equation (3) is valid due to the concentration polarization in the region near the membrane surface. As shown in Figure 6a, when solute flux (JvC) increases, Cm exceeds the saturated concentration of solute, Cs, i.e., it becomes supersaturated. In supersaturated solutions, scale crystal nuclei are generated and grow into crystals. The crystals transfer to the membrane surface with Jv, precipitate on the membrane surface, and form a cake (scale) layer. The permeate can pass through the gaps between the crystals of the cake layer. An increase in the thickness of the cake due to the precipitation of crystals on the membrane surface enlarges the permeation resistance of the cake; therefore, Jv decreases, the amount of solute transferred to the membrane surface decreases, Cm decreases, and the supersaturation and crystallization rate also decrease. Eventually, when Cm = Cs, the crystal nuclei and crystals in solution near the membrane surface cease to form, and precipitation on the membrane surface also ceases. The increase in the thickness of the cake on the membrane surface also ceases, the permeation resistance becomes constant, and the permeate flux ceases to decrease and converges to a constant value.
(b)
Surface blockage mechanism
As shown in Figure 6b, when Cm > Cs due to concentration polarization, a crystal nucleus is generated and becomes a crystal on the membrane surface, which grows to cover the surface. The crystallized portion of the membrane surface blocks permeation, so the effective membrane area decreases, the permeate flux of the entire membrane surface decreases, and the amount of solute transferred to the membrane surface decreases. The solute concentrations of both the non-crystallized and crystallized parts of the membrane surface take on the same Cm because the flow and diffusion rates of the solution are sufficiently large compared with the crystallization rate. The amount of solute transferred to the membrane surface decreases due to the decline in permeate flux. As a result, Cm decreases and the crystallization rate decreases. Eventually, when Cm = Cs, the supply of solute to the membrane surface is in dynamic equilibrium with diffusion of solute back to the bulk, so crystal growth ceases and the area of crystal covering the membrane surface also ceases to increase. As a result, the permeable membrane area ceases to decrease and becomes constant, and the permeate flux of the entire membrane surface converges to a constant value.
(c)
Mixed crystallization mechanism
Figure 6c shows the case where the cake formation and surface blockage mechanisms occur simultaneously when crystals are precipitated on the membrane surface. The concentration of the solute at the membrane surface, Cm, becomes supersaturated due to concentration polarization and crystal nuclei are generated in the supersaturated solution, which grow into crystals. These are transferred by the permeate flux to precipitate on the membrane surface and form a cake (scale) layer. At the same time, crystal nuclei are generated on the membrane surface and become crystals that grow to cover the surface. Owing to both the increase in the permeation resistance of the permeable cake on the membrane surface and the decrease in the effective permeable membrane area caused by the growth of impermeable crystals, the permeate flux decreases and the amount of solute transferred to the membrane surface decreases. The difference in solute concentration between the surface of the impermeable crystals and that of the cake disappears because the flow and diffusion rates of the solution are sufficiently large compared with the crystallization rate, resulting in the same solute concentration, Cm, on the surfaces of the impermeable crystals and the cake. As the amount of solute supplied to the membrane surface decreases, the solute concentration in the supersaturated solution and crystallization rate also decrease. Eventually, when Cm = Cs, the generation of crystal nuclei and crystal growth in the solution near the membrane surface cease, and the precipitation of crystals on the membrane surface also ceases. At the same time, the growth of crystals on the membrane surface ceases, so the area of crystals covering the membrane surface ceases to increase. The permeable membrane area stops decreasing and becomes constant; therefore, the permeation resistance and permeable membrane area also become constant, and the permeate flux of the entire membrane surface converges to a constant value.
Although the trajectory of the permeate flux decline and the amount of scale on the membrane surface differ for the three mechanisms described above, both the precipitation and growth of crystals on the membrane surface cease when Cm in the supersaturated state decreases and becomes equal to Cs. In these three cases, the permeate flux Jv of the entire membrane surface is considered to converge to a scaling-based critical flux (Jsc), defined by:
Jsc = k ln{(CsCp)/(CbCp)} = constant.
Jsc is obtained by substituting k, Cb, and Cp, which are obtained experimentally, and Cs which are 2050, 2080, 2090 and 2100 mg/L at 20 °C, 25 °C, 30 °C and 35 °C, given by Chemical Handbook [70,71] into Equation (14). This concept is defined as the scaling-based flux model.

3.2.2. Scaling Index

The scaling index (SCI) is defined as a discriminant equation for scale precipitation operating conditions as follows:
SCI = Jv/Jsc = Jv/[k ln{(CsCp)/(CbCp)}].
(1) When SCI > 1, the following equation pertains from Equations (3) and (15):
ln{(CmCp)/(CbCp)} > ln{(CsCp)/(CbCp)}.
Given that the natural logarithm is a monotonically increasing function, for x, y > 0, x > y ⇔ ln(x) > ln(y). Therefore, if Equation (16) is satisfied, the following equation is also satisfied:
(CmCp)/(CbCp) > (CsCp)/(CbCp).
Rearranging the above gives the following equation:
Cm > Cs.
In other words, when SCI > 1, then Cm > Cs, so Cm becomes larger than Cs and scale precipitation on the RO membrane surface occurs.
(2) When SCI ≤ 1, the same consideration as above results in Cm ≤ Cs, where Cm is equal to or smaller than Cs and scale precipitation on the RO membrane surface does not occur.

3.2.3. Osmotic Pressure Model

It is widely accepted that Equations (19) and (20) of the osmotic pressure model [62] can be applied to Jv in the region where solute precipitation on the RO membrane surface does not occur:
Jv = AP − Δπ);
Δπ = π(Cm) − π(Cp),
where A: pure water permeability; ΔP: operating pressure difference; Δπ: osmotic pressure difference; π(Cm): osmotic pressure on membrane surface; and π(Cp): osmotic pressure of permeate solution. Here, Cm is given by the following equation, which is a variation of Equation (3):
Cm = Cp + (CbCp) exp(Jv/k).
From Equations (19) and (20), Jv is determined by A, ΔP, and Δπ. The A value of Equation (19) in this experiment was obtained directly from a pure water permeation experiment for each membrane.

3.2.4. Experimental Results of Permeate Flux Change with Time

To analyze the mechanism of scale precipitation, the change in the permeate flux of the RO membrane with time due to scale precipitation was measured. The results are shown in Figure 7a. The experimental conditions were as follows: temperature: 30 °C; operating pressure: 0.50 MPa; CaSO4 concentration at inlet of Cell A: 875 mg/L; and brine flow rate at outlet of Cell B: 1.67 × 10⁻⁶ m3/s (= 100 mL/min). In Cell A, which was equipped with the high-permeate flux UTC-70UL RO membrane, the permeate flux decreased after the start of operation and converged to the scaling-based critical flux expressed by Equation (22):
Jsc = k ln{(CsCp)/(CbCp)} = 6.88 × 10⁻⁶ m3/(m2 s).
The following values for Cell A, given from experiments and calculations, were applied:
Re = 125;
k = 1.59 × 10⁻⁶ Re0.33 m/s = 7.82 × 10⁻⁶ m/s;
Cs = 2090 mg/L;
Cb = 885 mg/L;
Cp = 29.9 mg/L.
When Jv converges to Jsc, then Jv = Jsc and SCI = 1. Figure 7a shows the elapsed time on the abscissa, permeate flux on the first ordinate, and SCI on the second ordinate. The gray zone with SCI > 1, i.e., Jv > Jsc, is the scaling zone; the white zone with SCI ≤ 1, i.e., JvJsc, is the non-scaling zone.
Cell B was equipped with the medium-permeate flux UTC-70 RO membrane. The initial permeate flux (Jv,0) was in the range of Jv,0Jsc, i.e., the non-scaling zone of SCI ≤ 1. There was no precipitation of solute CaSO4 and the permeate flux maintained the initial value, which was consistent with the osmotic pressure model of Equation (28):
Jv = AP − Δπ) = 4.22 × 10⁻⁶ m3/(m2 s).
The following values for Cell B, given by experiments and calculations, were applied:
A = 9.52 × 10⁻⁶ m3/(m2 s MPa)
ΔP = 0.50 MPa;
Cb = 896 mg/L;
Cp = 9.3 mg/L;
Re = 123;
k = 1.59 × 10⁻⁶ Re0.33 m/s = 7.78 × 10⁻⁶ m/s;
Cm = Cp + (CbCp) exp(Jv/k) = 1540 mg/L;
π(Cm) = 0.0569 MPa;
π(Cp) = 0.0003 MPa.
The value of π was given from the solute concentration and the van’t Hoff equation [72]:
Δπ = π(Cm) − π(Cp) = 0.0566 MPa.
The results when the pressure was set at 0.8 MPa are shown in Figure 7b and when 1.0 MPa, in Figure 7c.

3.3. Study of Convergent Value of Permeate Flux with Scale Precipitation

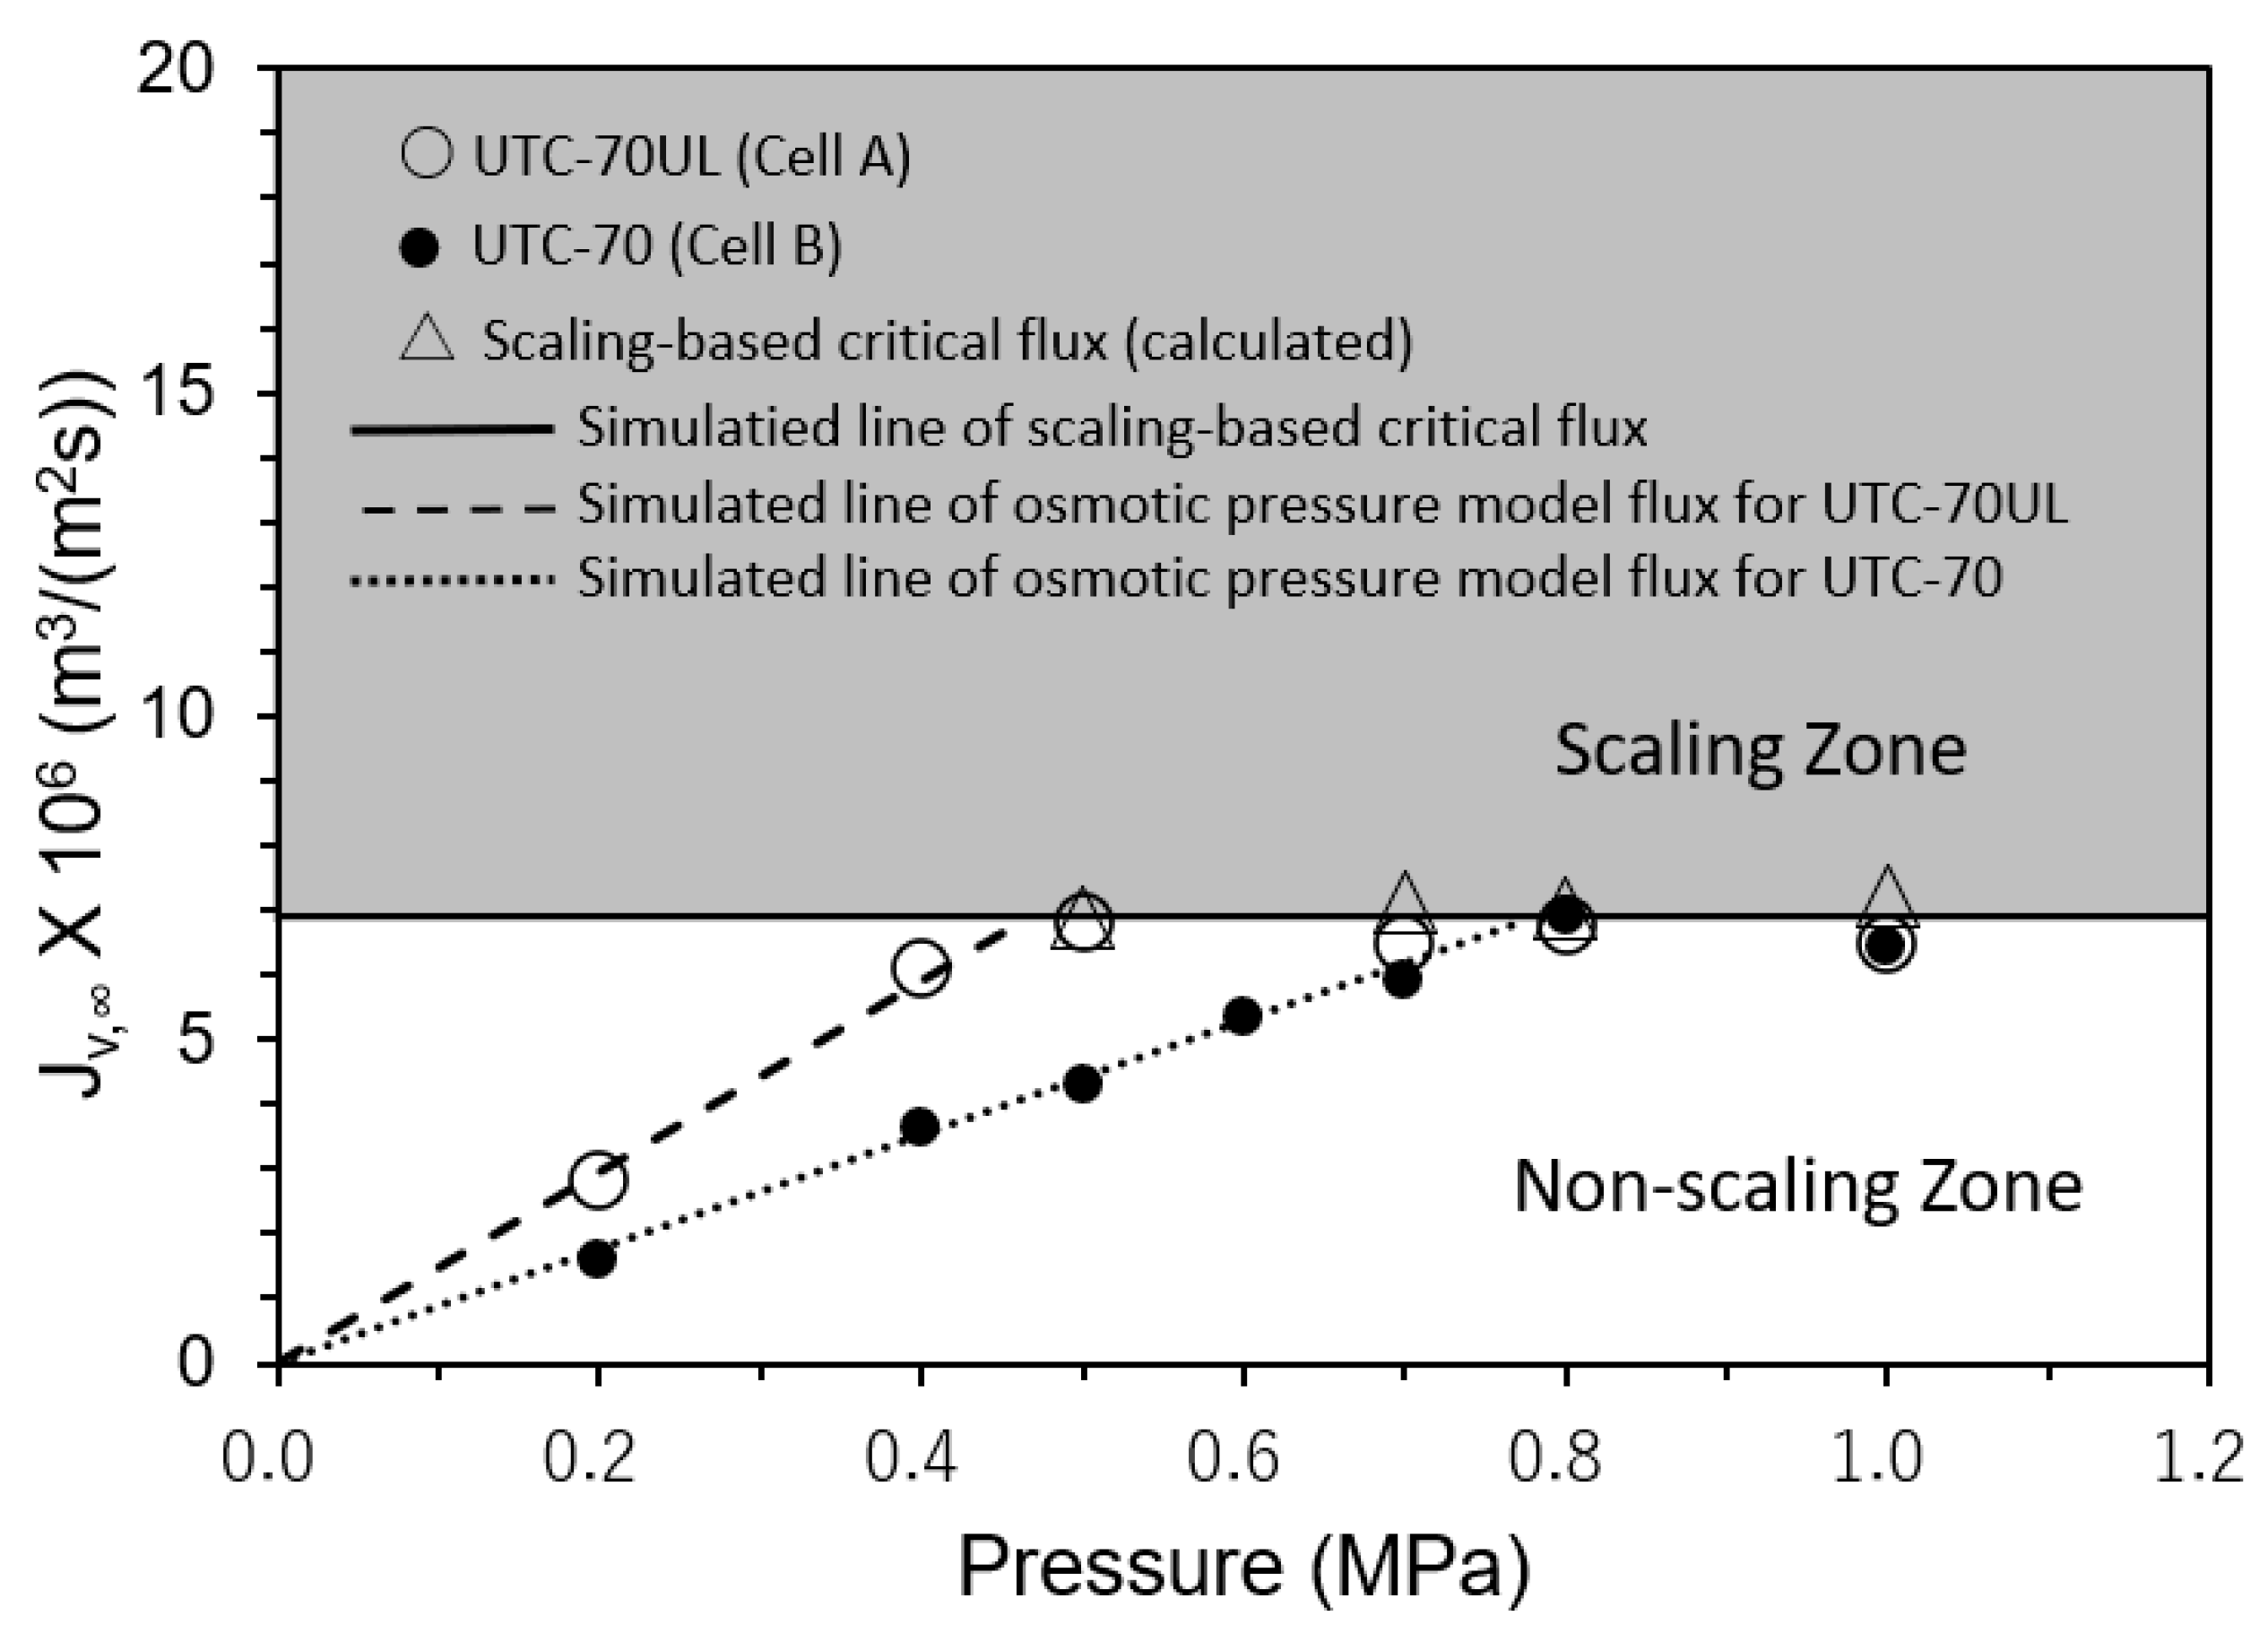
3.3.1. Effect of Operating Pressure on Convergent Value of Permeate Flux

The relationships between the operating pressures and convergent values of the permeate fluxes (Jv,) were measured. The results are shown in Figure 8. Cell A was equipped with UTC-70UL, a high-permeate flux membrane, and Cell B with UTC-70, a medium-permeate flux membrane. In both Cells A and B, scale precipitation did not occur in the non-scaling zone where the initial permeate flux (Jv,0) was in the range of Jv,0Jsc, i.e., SCI ≤ 1. The permeate flux was proportional to the operating pressure and consistent with the osmotic pressure model flux with the pure water permeability coefficients of UTC-70UL and UTC-70, as shown in Figure 8.
In the scaling zone, where Jv,0 was in the range of Jv,0 > Jsc, i.e., SCI > 1, scale precipitated on the membrane surface, and the permeate flux decreased with time and converged to the calculated scaling-based critical flux (Jsc) (triangle marks in Figure 8). The four values of Jsc were almost same and the average values were as follows:
Jsc = k ln(CsCp)/(CbCp)} = 6.9 × 10⁻⁶ m3/(m2 s).
Jsc was constant and independent of the operating pressure. Equation (39) is in good agreement with the experimental results.

3.3.2. Effect of CaSO4 Concentration on Convergent Value of Permeate Flux

The relationship between the CaSO4 concentration and the convergent value of permeate flux is shown in Figure 9. In the non-scaling zone, where the CaSO4 concentration was small and the initial permeate flux was in the range of Jv,0Jsc, i.e., SCI ≤ 1, there was no decrease in permeate flux with time and Jv was consistent with the osmotic pressure model flux. In the scaling zone, where the initial flux was in the range of Jv,0 > Jsc, i.e., SCI > 1, the permeate flux decreased with time and converged to the calculated scaling-based critical flux (triangle marks in Figure 9). Cp was small enough compared with Cb to be ignored, so Jsc could be expressed as a function of Cb as follows:
Jsc = k ln(CsCp)/(CbCp)} = (5.17 × 10⁻⁵ − 6.79 × 10⁻⁶ ln Cb) m3/(m2 s),
where
k = 1.50 × 10⁻⁶ Re0.33 m/s = 6.79 × 10⁻⁶ m/s (at 20 °C, Re = 97).
Equation (40) is in good agreement with the experimental results.

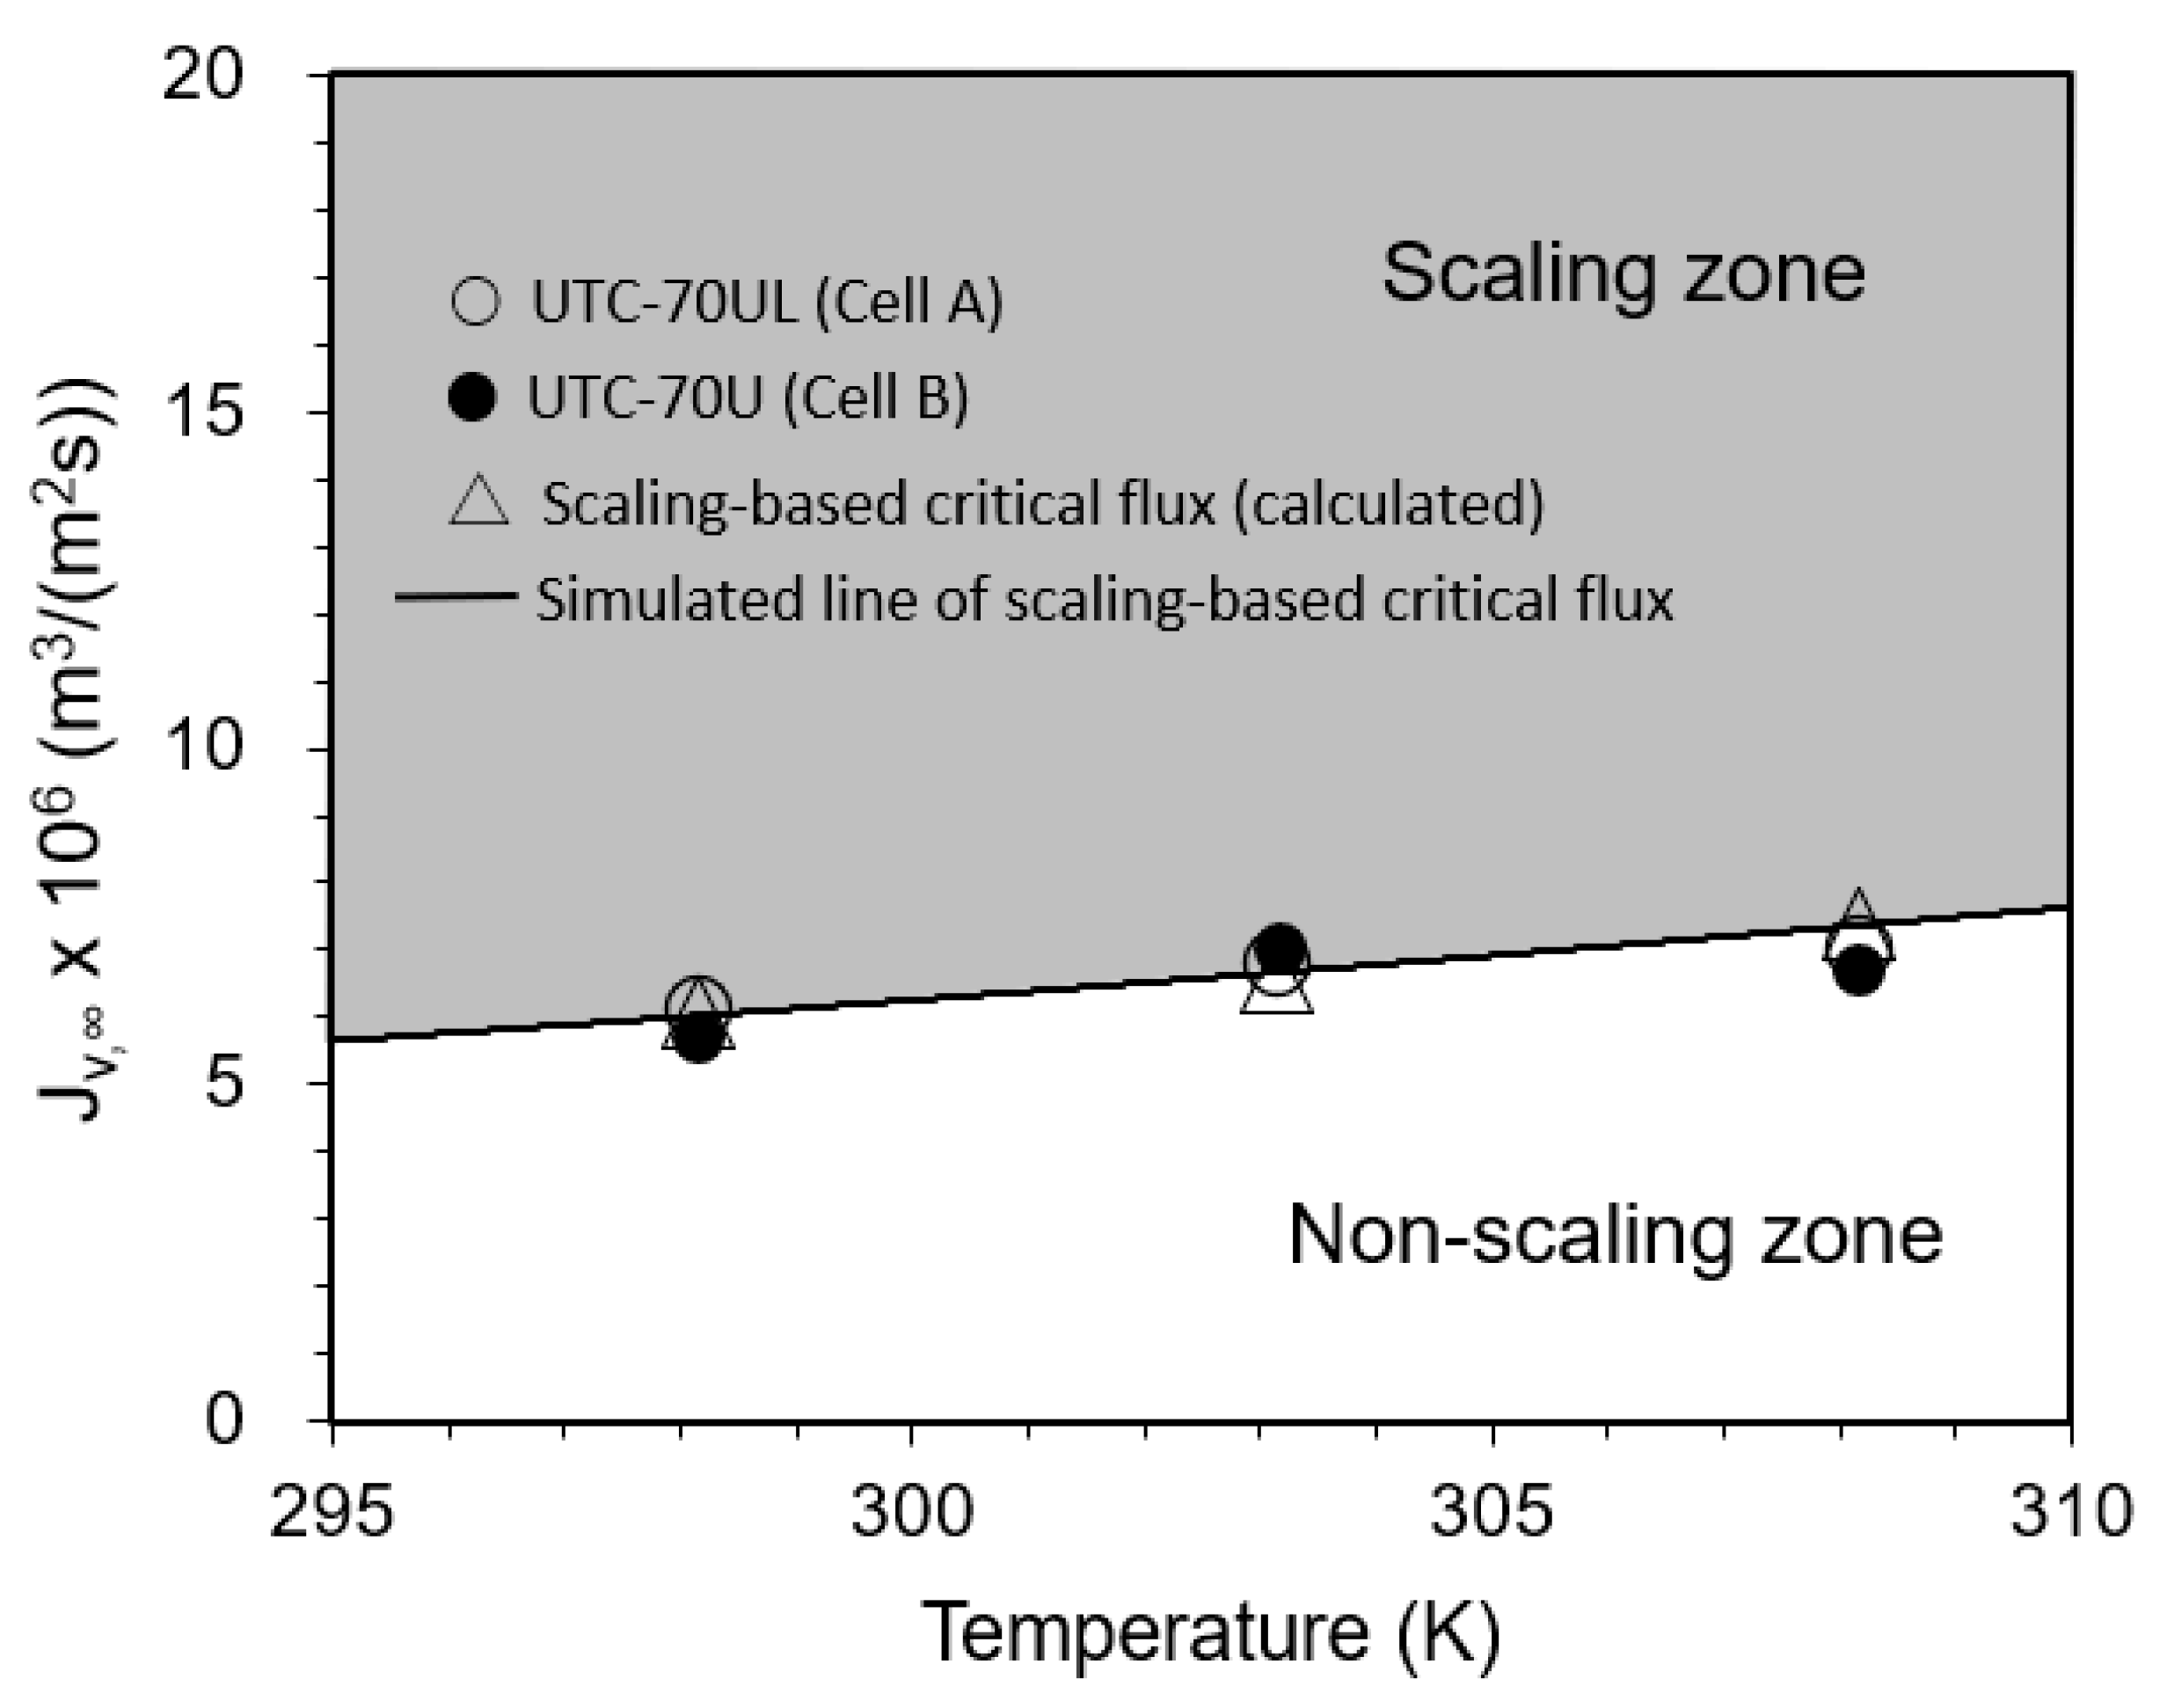
3.3.3. Effect of Temperature on Convergent Value of Permeate Flux

The relationship between temperature and the convergent value of the permeate flux is shown in Figure 10. Under the experimental conditions, the initial permeate flux was in the region of the scaling zone in the range of Jv,0 > Jsc, i.e., SCI > 1. From the beginning of operation, the permeate flux decreased with time and converged to the calculated value of the scaling-based critical flux (triangle marks in Figure 10).
Substituting Equations (4)–(6) into Equation (13), the relationship between the mass-transfer coefficient (k) and diffusion coefficient (D) of the temperature-dependent term can be summarized as follows:
k = αD0.67,
where
α = 1.15(u/L)0.33(1/dh)0.34.
The relationship between D and T can be expressed as follows from Wilke’s equation [67,73]:
/T = c (constant).
The relationship between μ and T was expressed by Andrade as follows [74]:
μ = a1 exp(b1/T),
where a1 and b1 are material constants. From Equations (44) and (45), the relationship between D and T is expressed by the following equation:
D = (c/a1)(T exp(−b1/T)).
Substituting Haskell’s equation, data from the Chemical Engineers’ Handbook, and experimental data yields the following equation [67,69]:
k = 1.38 × 10⁻⁵(T exp(−2005/T))0.67 m/s.
The simulated line of Jsc with respect to T is given as follows:
Jsc = k ln{(Cs − Cp)/(Cb − Cp)}
= 1.23 × 10⁻⁵(T exp(−2005/T))0.67 m3/(m2s).
Equation (48) is in good agreement with the experimental results.

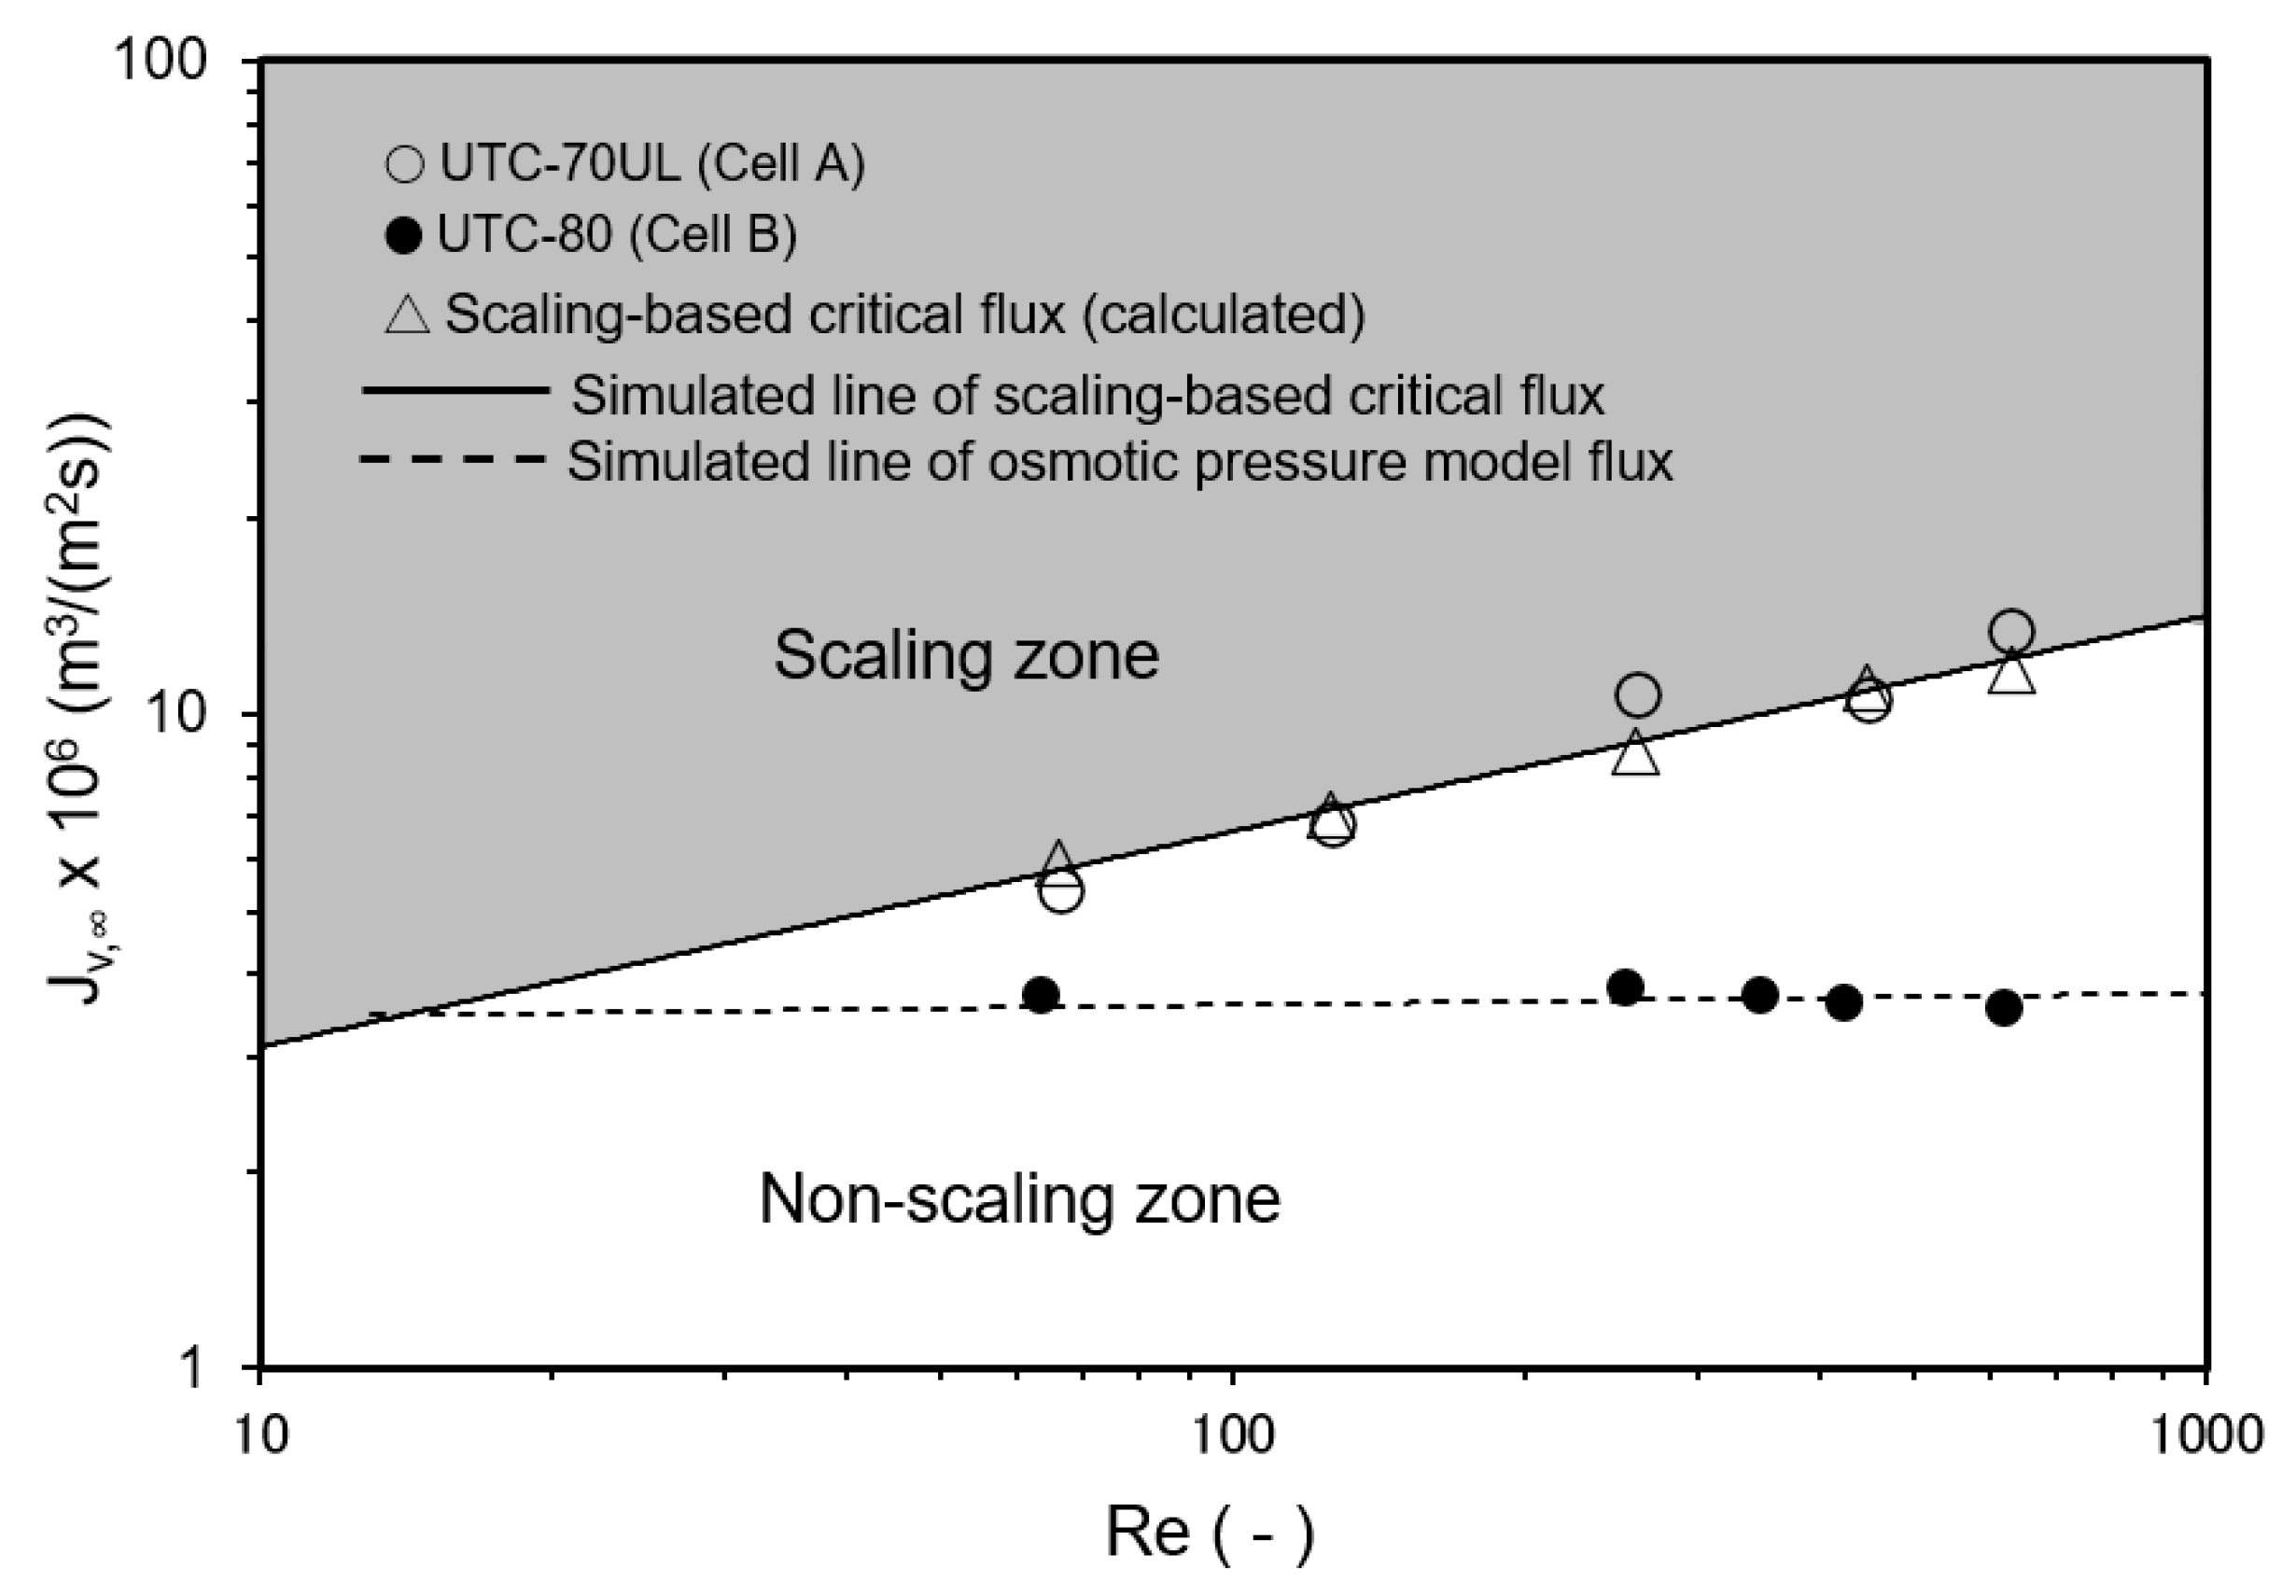
3.3.4. Effect of Reynolds Number on Convergent Value of Permeate Flux

The relationship between Re and the convergent value of the permeate flux is shown in Figure 11. Cell A was equipped with the UTC-70UL membrane, which had a high permeate flux, and the operating conditions shown in Figure 11 were in the scaling zone where Jv,0 > Jsc, i.e., SCI > 1. The flux decreased with time and converged to the calculated scaling-based critical flux (triangle marks in Figure 11). Jsc can be expressed as a function of Re as follows:
Jsc = k ln{(CsCp)/(CbCp)} = 1.45 × 10⁻⁶ Re0.33 m3/(m2 s).
Equation (49) is good agreement with the experimental results.
Cell B was equipped with a UTC-80 membrane for seawater desalination, which had a low permeate flux, and the operating conditions were in the non-scaling zone where Jv,0Jsc, i.e., SCI ≤ 1. Scale precipitation on the membrane did not occur and the permeate flux was consistent with the osmotic pressure model flux (Equation (19)).

4. Advice for Reverse Osmosis Plant Designers, Operators, and Membrane Manufacturers

To prevent scale precipitation in RO plants, it is recommended to calculate the scaling index (SCI) for solutes that may precipitate, such as CaSO4, CaCO3, and SiO2, in the most downstream RO module of an RO plant. Scale precipitation on the RO membranes can then be prevented by designing the plant and setting the operating conditions so that SCI ≤ 1, which is in the non-scaling zone.
For practical use, the modified scaling-based critical flux J’sc = k ln(Cs/Cb) can be used instead of Jsc in the region of high observed rejection of the RO membrane, and Jsc can be calculated regardless of membrane type if the value of k of the RO module is known. For the experiments shown in Figure 8, Figure 9, Figure 10 and Figure 11, the errors of Jsc with respect to Jsc were less than 7% when the observed rejection of the RO membrane was greater than 90%; for the observed rejections of 88.6%, 81.1%, and 66.6%, the errors of Jsc with respect to Jsc were 7.7%, 18.2%, and 35.3%, respectively. Therefore, the modified scaling-based critical flux (Jsc) should be carefully applied to practical operation, considering whether the observed rejection of the RO membrane is high enough.
It is recommended that RO membrane manufacturers measure the mass-transfer coefficient (k) of commercially available RO modules with the velocity variation method and disclose it to users, because this can be more easily measured by the manufacturer than by individual users. This will allow RO plant designers and operators to easily calculate the scaling-based critical flux and SCI, and to design and operate the RO plant to avoid scale precipitation.

5. Conclusions

  • The phenomena of scale precipitation on a membrane surface were investigated. Using a newly proposed scaling-based flux model, the permeate fluxes of three mechanisms related to scale precipitation phenomena—cake formation, surface blockage, and mixed crystallization—were explained to converge to the same scaling-based critical flux, defined by Equation (14).
  • The scaling-based critical flux and scaling index (SCI) defined by Equation (15) were investigated. An operating condition described by SCI > 1 is a scaling zone, in which scale precipitates on the RO membrane surface, and the permeate flux decreases with time and finally converges to the scaling-based critical flux. An operating condition described by SCI ≤ 1 is a non-scaling zone, in which there is no scale precipitation on the RO membrane surface and no decline in permeate flux with time.
  • Experiments were conducted to investigate the effects of operating conditions, such as pressure, solute concentration, temperature, and Re. It was found that scale precipitation on the RO membrane surface could be determined by the scaling index (SCI). In the non-scaling zone (SCI ≤ 1), there was no scale precipitation on the membrane surface and the permeate flux was constant with time; in the scaling zone (SCI > 1), the permeate flux decreased with time and finally converged to the scaling-based critical flux.

Author Contributions

Conceptualization, F.Y.; methodology, S.I.; investigation, F.Y., M.N. and S.I.; writing—original draft preparation, F.Y.; writing—review and editing, M.N. and S.I.; supervision, M.N. and S.I.; project administration, S.I. All authors have read and agreed to the published version of the manuscript.

Funding

This research received no external funding.

Institutional Review Board Statement

Not applicable.

Informed Consent Statement

Not applicable.

Data Availability Statement

The data presented in this study are available from the corresponding author on reasonable request.

Acknowledgments

The authors express their sincere gratitude to the Emeritus Shoji Kimura of the University of Tokyo for his guidance in this research. The authors thank Tomohito Toyoshima and Takatoshi Naruse, graduates of Kimura Laboratory, Department of Chemical Engineering, Kogakuin University, for their cooperation in the experiments and Toray Industries, Inc., for providing the RO membranes.

Conflicts of Interest

The authors declare no conflict of interest.

Abbreviations

APure water permeability (m3/(m2 s Pa))
aConstant
a1Constant
bConstant
b1Constant
CSolute concentration (mg/L)
CbSolute concentration of bulk feed (mg/L)
CmSolute concentration on membrane (mg/L)
CpSolute concentration of permeate (mg/L)
CsSaturated concentration of solute (mg/L)
cConstant
DDiffusion coefficient (m2/s)
dhHydraulic diameter (m)
JscScaling-based critical flux (m3/(m2 s))
J’scModified scaling-based critical flux (m3/(m2 s))
JvPermeate volume flux (m3/(m2 s))
Jv,0Initial permeate volume flux (m3/(m2 s))
Jv,∞Convergent permeate volume flux (m3/(m2 s))
kMass-transfer coefficient (m/s)
LLength of flow channel of cell (m)
POperating pressure (MPa)
ΔPOperating pressure difference (MPa)
RReal rejection (−)
RobsObserved rejection (−)
ReReynolds number (−)
ScSchmidt number (−)
ShSherwood number (−)
SCIScaling index (−)
TTemperature (K)
uFlow velocity (m/s)
xDistance (m)
αConstant
δBoundary layer thickness (m)
μViscosity (Pa s)
πOsmotic pressure (MPa)
ΔπOsmotic pressure difference (MPa)
ρDensity (kg/m3)

References

  1. Matsuura, T. Progress in membrane science and technology for seawater desalination—A review. Desalination 2001, 134, 47–54. [Google Scholar] [CrossRef]
  2. Sauvet-Goichon, B. Ashkelon desalination plant—A successful challenge. Desalination 2007, 203, 75–81. [Google Scholar] [CrossRef]
  3. Jiao, B.; Cassano, A.; Drioli, E. Recent advances on membrane process for concentration of fruit juices: A review. J. Food Eng. 2004, 63, 303–324. [Google Scholar] [CrossRef]
  4. Ganju, S.; Gogata, P.R. A review on approaches for effluent recovery of whey proteins from dairy industry effluents. J. Food Eng. 2017, 215, 84–96. [Google Scholar] [CrossRef]
  5. Ohya, H.; Suzuki, T.; Nakao, S.; Kato, S.; Tsuji, M.; Sugi, J. Proposal of an integrated system for the complete usage of sea water. Bull. Soc. Sea Water Sci. Jpn. 1995, 49, 195–201. [Google Scholar]
  6. Okazaki, M.; Kimura, S. Scale formation on reverse osmosis membranes. J. Chem. Eng. Jpn. 1984, 17, 145–151. [Google Scholar] [CrossRef]
  7. Rahardianto, A.; Shih, W.Y.; Lee, R.W.; Cohen, Y. Diagnostic characterization of gypsum scale formation and control in RO membrane desalination of brackish water. J. Membr. Sci. 2006, 279, 655–668. [Google Scholar] [CrossRef]
  8. Pervov, A.G. Scale formation prognosis and cleaning procedure schedules in reverse osmosis systems operation. Desalination 1991, 83, 77–118. [Google Scholar] [CrossRef]
  9. Shih, W.Y.; Rahardianto, A.; Lee, R.W.; Cohen, Y. Morphometric characterization of calcium sulfate dihydrate (gypsum) scale on reverse osmosis membranes. J. Membr. Sci. 2005, 252, 253–263. [Google Scholar] [CrossRef]
  10. Oh, H.J.; Choung, Y.K.; Lee, S.; Choi, J.S.; Hwang, T.M.; Kim, J.H. Scale formation in reverse osmosis desalination: Model development. Desalination 2009, 238, 333–346. [Google Scholar] [CrossRef]
  11. Logan, D.P.; Kimura, S. Control of gypsum scale on reverse osmosis membranes. Desalination 1985, 54, 321–331. [Google Scholar] [CrossRef]
  12. Hasson, D.; Dark, A.; Semiat, R. Inspection of CaSO4 scaling on RO membranes at various water recovery levels. Desalination 2001, 139, 73–81. [Google Scholar] [CrossRef]
  13. Jawor, A.; Hoek, E.M.V. Effects of feed water temperature on inorganic fouling of brackish water RO membranes. Desalination 2009, 235, 44–57. [Google Scholar] [CrossRef]
  14. Wang, F.; Davis, T.E.; Tarabara, V.V. Crystallization of calcium sulfate dihydrate in the presence of colloidal silica. Ind. Eng. Chem. Res. 2010, 49, 11344–11350. [Google Scholar] [CrossRef]
  15. Hu, Z.; Antony, A.; Leslie, G.; Le-Clech, P. Real-time monitoring of scale formation in reverse osmosis using electrical impedance spectroscopy. J. Membr. Sci. 2014, 453, 320–327. [Google Scholar] [CrossRef]
  16. Semiat, R.; Sutzkover, I.; Hasson, D. Technique for evaluating silica scaling and its inhibition on RO desalting. Desalination 2001, 140, 181–193. [Google Scholar] [CrossRef]
  17. Lin, C.J.; Rao, P.; Shirazi, S. Effect of operating parameters on permeate flux decline caused by cake formation—A model study. Desalination 2004, 171, 95–105. [Google Scholar] [CrossRef]
  18. Gilron, J.; Hasson, D. Calcium sulfate fouling of reverse osmosis membranes: Flux decline mechanism. Chem. Eng. Sci. 1987, 42, 2351–2360. [Google Scholar] [CrossRef]
  19. Lisitsin, D.; Hasson, D.; Semiat, R. Critical flux detection in a silica scaling RO system. Desalination 2005, 186, 311–318. [Google Scholar] [CrossRef]
  20. Borden, J.; Gilron, J.; Hasson, D. Analysis of RO flux decline due to membrane surface blockage. Desalination 1987, 66, 257–269. [Google Scholar] [CrossRef]
  21. Fountoukidis, E.; Maroulis, Z.B.; Marinos-Kouris, D. Modeling of calcium sulfate fouling of reverse osmosis membranes. Desalination 1989, 72, 293–318. [Google Scholar] [CrossRef]
  22. Fountoukidis, E.; Maroulis, Z.B.; Marinos-Kouris, D. Crystallization of calcium sulfate on reverse osmosis membranes. Desalination 1990, 79, 47–63. [Google Scholar] [CrossRef]
  23. Brusilovsky, M.; Borden, J.; Hasson, D. Flux decline due to gypsum precipitation on RO membranes. Desalination 1992, 86, 187–222. [Google Scholar] [CrossRef]
  24. Benecke, J.; Haas, M.; Baur, F.; Ernst, M. Investigating the development and reproductivity of heterogeneous gypsum scaling on reverse osmosis membranes using real-time membrane surface imaging. Desalination 2018, 428, 161–171. [Google Scholar] [CrossRef]
  25. Bartman, A.R.; Lyster, E.; Rallo, R.; Christofides, P.D.; Cohen, Y. Mineral scale monitoring for reverse osmosis desalination via real-time membrane surface image analysis. Desalination 2011, 273, 64–71. [Google Scholar] [CrossRef]
  26. Shmulevsky, M.; Li, X.; Shemer, H.; Hasson, D.; Semiat, R. Analysis of the onset of calcium sulfate scaling on RO membranes. J. Membr. Sci. 2017, 524, 299–304. [Google Scholar] [CrossRef]
  27. Lee, S.; Kim, J.; Lee, C.H. Analysis of CaSO4 scale formation mechanism in various nanofiltration modules. J. Membr. Sci. 1999, 163, 63–74. [Google Scholar] [CrossRef]
  28. Lee, S.; Lee, C.H. Effect of operating conditions on CaSO4 scale formation mechanism in nanofiltration for water softening. Wat. Res. 2000, 34, 3854–3866. [Google Scholar] [CrossRef]
  29. Dydo, P.; Turek, M.; Ciba, J. Scaling analysis of nanofiltration systems fed with saturated calcium sulfate solutions in the presence of carbonate ions. Desalination 2003, 159, 245–251. [Google Scholar] [CrossRef]
  30. Shirazi, S.; Lin, C.J.; Chen, D. Inorganic fouling of pressure-driven membrane processes—A critical review. Desalination 2010, 250, 236–248. [Google Scholar] [CrossRef]
  31. Antony, A.; Low, J.H.; Gray, S.; Childress, A.E.; Le-Clech, P.; Leslie, G. Scale formation and control in high pressure membrane water treatment systems: A review. J. Membr. Sci. 2011, 383, 1–16. [Google Scholar] [CrossRef]
  32. Al-Roomi, Y.M.; Hussain, K.F. Potential kinetic model for scaling and scale inhibition mechanism. Desalination 2016, 393, 186–195. [Google Scholar] [CrossRef]
  33. Matin, A.; Rahman, F.; Shafi, H.Z.; Zubair, S.M. Scaling of reverse osmosis membranes used in water desalination: Phenomena, impact, and control; future directions. Desalination 2019, 455, 135–157. [Google Scholar] [CrossRef]
  34. Uppu, A.; Chaudhuri, A.; Das, S.P.; Prakash, N. CFD modeling of gypsum scaling in cross-flow RO filters using moments of particle population balance. J. Environ. Chem. Eng. 2020, 8, 104151. [Google Scholar] [CrossRef]
  35. Lee, S.; Lueptow, R.M. Control of scale formation in reverse osmosis by membrane rotation. Desalination 2003, 155, 131–139. [Google Scholar] [CrossRef]
  36. Al-Amoudi, A.; Lovitt, R.W. Fouling strategies and the cleaning system of NF membranes and factors affecting cleaning efficiency. J. Membr. Sci. 2007, 303, 4–28. [Google Scholar] [CrossRef]
  37. Liu, Q.; Xu, G.R.; Das, R. Inorganic scaling in reverse osmosis (RO) desalination: Mechanisms, monitoring, and inhibition strategies. Desalination 2019, 468, 114065. [Google Scholar] [CrossRef]
  38. Field, R.W.; Wu, D.; Howell, J.A.; Gupta, B.B. Critical flux concept for microfiltration fouling. J. Membr. Sci. 1995, 100, 259–272. [Google Scholar] [CrossRef]
  39. Manttari, M.; Nystrom, M. Critical flux in NF of high molar mass polysaccharides and effluents from the paper industry. J. Membr. Sci. 2000, 170, 257–273. [Google Scholar] [CrossRef]
  40. Seidel, A.; Elimelech, M. Coupling between chemical and physical interactions in natural organic matter (NOM) fouling of nanofiltration membranes: Implications for fouling control. J. Membr. Sci. 2002, 203, 245–255. [Google Scholar] [CrossRef]
  41. Espinasse, B.; Bacchin, P.; Aimar, P. On an experimental method to measure critical flux in ultrafiltration. Desalination 2002, 146, 91–96. [Google Scholar] [CrossRef]
  42. Bacchin, P. A possible link between critical and limiting flux for colloidal systems: Consideration of critical deposit formation along a membrane. J. Membr. Sci. 2004, 228, 237–241. [Google Scholar] [CrossRef]
  43. Bacchin, P.; Aimar, P.; Sanchez, V. Model for colloidal fouling of membranes. AIChE J. 1995, 41, 368–376. [Google Scholar] [CrossRef]
  44. Bacchin, P.; Aimar, P.; Field, R.W. Critical and sustainable fluxes: Theory, experiments and applications. J. Membr. Sci. 2006, 281, 42–69. [Google Scholar] [CrossRef]
  45. Vrouwenvelder, J.S.; Paassen, J.A.M.; Agtmaal, J.M.C.; Loosdrecht, M.C.M.; Kruithof, J.C. A critical flux to avoid biofouling of spiral wound nanofiltration and reverse osmosis membranes: Fact or fiction? J. Membr. Sci. 2009, 326, 36–44. [Google Scholar] [CrossRef]
  46. Field, R.W.; Pearce, G.K. Critical, sustainable and threshold fluxes for membrane filtration with water industry applications. Adv. Colloid Interface Sci. 2011, 164, 38–44. [Google Scholar] [CrossRef]
  47. Beier, S.P.; Jonsson, G. Critical flux determination by flux-stepping. AIChE J. 2010, 56, 1739–1747. [Google Scholar] [CrossRef]
  48. Maruf, S.H.; Wang, L.; Greenberg, A.R.; Pellegrino, J.; Ding, Y. Use of nanoimprinted surface patterns to mitigate colloidal deposition on ultrafiltration membranes. J. Membr. Sci. 2013, 428, 598–607. [Google Scholar] [CrossRef]
  49. Luo, J.; Zhu, Z.; Ding, L.; Bals, O.; Wan, Y.; Jaffrin, M.Y.; Vorobiev, E. Flux behavior in clarification chicory juice by high-shear membrane filtration: Evidence for threshold flux. J. Membr. Sci. 2013, 435, 120–129. [Google Scholar] [CrossRef]
  50. Stoller, M.; Bravi, M.; Chianese, A. Threshold flux measurements of a nanofiltration membrane module by critical flux data conversion. Desalination 2013, 315, 142–148. [Google Scholar] [CrossRef]
  51. Ochando-Pulido, J.M.; Hodaifa, G.; Martinez-Ferez, A. Permeate recirculation impact on concentration polarization and fouling on RO purification of olive mill wastewater. Desalination 2014, 343, 169–179. [Google Scholar] [CrossRef]
  52. Luo, J.; Morthensen, S.T.; Meyer, A.S.; Pinelo, M. Filtration behavior of casein glycomacropeptide (CGMP) in an enzymatic membrane reactor: Fouling control by membrane selection and threshold flux operation. J. Membr. Sci. 2014, 469, 127–139. [Google Scholar] [CrossRef]
  53. Ochando-Pulido, J.M.; Hodaifa, G.; Victor-Ortega, M.D.; Martinez-Ferez, A. Fouling control by threshold flux measurements in the treatment of different olive mill wastewater streams by membranes-in-series process. Desalination 2014, 343, 162–168. [Google Scholar] [CrossRef]
  54. Stoller, M.; Ochando-Pulido, J.M. About merging threshold and critical flux concepts into a single one: The boundary flux. Sci. World J. 2014, 2014, 656101. [Google Scholar] [CrossRef]
  55. Lan, Y.; Groenen-Serrano, K.; Coetsier, C.; Causserand, C. Fouling control using critical, threshold and limiting fluxes concepts for cross-flow NF of a complex matrix: Membrane bioreactor effluent. J. Membr. Sci. 2017, 524, 288–298. [Google Scholar] [CrossRef]
  56. Cohen, R.D.; Probstein, R.F. Colloidal fouling of reverse osmosis membranes. J. Colloid Interface Sci. 1986, 114, 194–207. [Google Scholar] [CrossRef]
  57. Luo, J.; Ding, L.; Wan, Y.; Jaffrin, M.Y. Threshold flux of shear-enhanced nanofiltration: Experimental observation in dairy wastewater treatment. J. Membr. Sci. 2012, 409–410, 276–284. [Google Scholar] [CrossRef]
  58. Miller, D.J.; Kasemset, S.; Wang, L.; Paul, D.R.; Freeman, B.D. Constant flux crossflow filtration evaluation of surface-modified fouling-resistant membranes. J. Membr. Sci. 2014, 452, 171–183. [Google Scholar] [CrossRef]
  59. Miller, D.J.; Kasemset, S.; Paul, D.R.; Freeman, B.D. Comparison of membrane fouling at constant flux and constant transmembrane pressure conditions. J. Membr. Sci. 2014, 454, 505–515. [Google Scholar] [CrossRef]
  60. Tang, C.Y.; Leckie, J.O. Membrane independent limiting flux for RO and NF membranes fouled by humid acid. Environ. Sci. Technol. 2007, 41, 4767–4773. [Google Scholar] [CrossRef]
  61. Tang, C.Y.; Kwon, Y.N.; Leckie, J.O. The role of foulant—Foulant electrostatic interaction on limiting flux for RO and UF membranes during humic acid fouling—Theoretical basis, experimental evidence, and AFM interaction force measurement. J. Membr. Sci. 2009, 326, 526–532. [Google Scholar] [CrossRef]
  62. Nobel, R.D.; Stern, S.A. Membrane Separations Technology—Principles and Applications; Elsevier Science: Amsterdam, The Netherlands, 1995; pp. 49–52, 61, 117. [Google Scholar]
  63. Nakao, S.; Kimura, S. Analysis of solutes rejection in ultrafiltration. J. Chem. Eng. Jpn. 1981, 14, 32–37. [Google Scholar] [CrossRef]
  64. Taniguchi, M.; Kimura, S. Estimation of transport parameters of RO membranes for seawater desalination. AIChE J. 2000, 46, 1967–1973. [Google Scholar] [CrossRef]
  65. Schock, G.; Miquel, A. Mass transfer and pressure loss in spiral wound modules. Desalination 1987, 64, 339–352. [Google Scholar] [CrossRef]
  66. Kimura, S.; Sourirajan, S. Mass transfer coefficients for use in reverse osmosis process design. Ind. Eng. Chem. Process Des. Dev. 1968, 7, 539–547. [Google Scholar] [CrossRef]
  67. Perry, J.H. Chemical Engineers’ Handbook, 4th ed.; McGraw Hill: New York, NY, USA, 1963; Chapter 3, pp. 70, 201; Chapter 14, pp. 23–24. [Google Scholar]
  68. Olson, R.L.; Walton, J.S. Diffusion coefficients of organic liquids in solution from surface tension measurements. Ind. Eng. Chem. 1951, 43, 703–706. [Google Scholar] [CrossRef]
  69. Haskell, R. The effect of concentration and ionization on the rates of diffusion of salts in aqueous solution. Phys. Rev. 1908, 27, 145–182. [Google Scholar] [CrossRef]
  70. Linke, W.F. Solubilities, Inorganic and Metal Organic Compounds, 4th ed.; D. Van Nostrand Company: Princeton, NJ, USA, 1958; Volume 1, p. 660. [Google Scholar]
  71. Iwasawa, Y. Chemical Handbook Basic Edition, 5th ed.; Maruzen: Tokyo, Japan, 2004; p. II-150. (In Japanese) [Google Scholar]
  72. Moore, W.J. Physical Chemistry, 2nd ed.; Prentice Hall: Hoboken, NJ, USA, 1995; pp. 131–132. [Google Scholar]
  73. Wilke, C.R. Estimation of liquid diffusion coefficients. Chem. Eng. Prog. 1949, 45, 218–224. [Google Scholar]
  74. Andrade, E.N.C. The viscosity of liquids. Nature 1930, 125, 582–584. [Google Scholar] [CrossRef] [Green Version]
Figure 1. Flat membrane cell. (a) External view, (b) Inside structure.
Membranes 12 00894 g001
Figure 2. Flow diagram of experimental equipment.
Membranes 12 00894 g002
Figure 3. Concentration polarization phenomenon. Jv: permeate flux; JvC: migration of solute with permeate flux; −D(dC/dx): diffusion of solute; Cm: solute concentration on membrane surface; Cs: saturated solute concentration; Cb: solute concentration of bulk feed; Cp: solute concentration of permeate flow; and δ: thickness of boundary layer.
Membranes 12 00894 g003
Figure 4. Determination of mass-transfer coefficients by velocity variation method. (a) Relationship between Re and Jv, (b) Calculation of R, (c) Relationship between Re and k. Test conditions: solute: CaSO4; feed concentration: 140–160 mg/L; membrane: UTC-60; and temperature: Δ 20 °C, ○ 30 °C, and □ 35 °C.
Membranes 12 00894 g004
Figure 5. Comparison between experimental results and Leveque equation for determination of mass-transfer coefficient. (a) Re vs. Sh/(Re Sc dh/L)0.33, (b) Difference in flow in the cell between Leveque report and this experiment.
Membranes 12 00894 g005
Figure 6. Scaling-based flux model. (a) Cake formation mechanism. (b) Surface blockage mechanism. (c) Mixed crystallization mechanism. Jv: permeate flux; JvC: migration of solute with permeate flux; −D(dC/dx): diffusion of solute; Cm: solute concentration on membrane surface; Cs: saturated solute concentration; Cb: solute concentration of bulk feed; Cp: solute concentration of permeate flow; and δ: thickness of boundary layer.
Membranes 12 00894 g006
Figure 7. Time course of permeate flux and scaling-based critical flux. (a) Pressure: 0.5 MPa, (b) Pressure: 0.8 MPa, (c) Pressure 1.0 MPa. Test conditions: temperature: 30 °C; pressure: (a) 0.50 MPa, (b) 0.8 MPa, (c) 1.0 MPa; feed CaSO4 concentration: 875 mg/L; brine flow rate: 1.67 × 10⁻⁶ m3/s (= 100 mL/min); Re: (a) 125 (Cell A) and 123 (Cell B), (b) 127 (Cell A) and 123 (Cell B), (c) 127 (Cell A) and 124 (Cell B); and membrane: UTC-70UL (Cell A) and UTC-70 (Cell B). Scaling-based critical flux was Jsc = k ln{(CsCp)/(CbCp)} = 6.9 × 10⁻⁶ m3/(m2 s). Osmotic pressure model flux in (a) was Jv = AP − Δπ) = 4.22 × 10⁻⁶ m3/(m2 s) for UTC-70.
Membranes 12 00894 g007aMembranes 12 00894 g007b
Figure 8. Effect of operating pressure on convergent permeate flux. Test conditions: temperature: 30 °C; feed CaSO4 concentration: 875 mg/L; brine flow rate: 1.67 × 10⁻⁶ m3/s (= 100 mL/min); Re: 124–127 (Cell A) and 122–124 (Cell B); and membrane: UTC-70UL (Cell A) and UTC-70 (Cell B). Simulated line of scaling-based critical flux is given by Jsc = k ln{(CsCp)/(CbCp)} = 6.9 × 10⁻⁶ m3/(m2 s). Simulated lines of osmotic pressure model flux are given by Jv = AP − Δπ), A = 1.80 × 10⁻⁵ m3/(m2 s) for UTC-70UL and Jv = AP − Δπ), A = 9.52 × 10⁻⁶ m3/(m2 s) for UTC-70.
Membranes 12 00894 g008
Figure 9. Effect of CaSO4 concentration on convergent permeate flux. Test conditions: temperature: 20 °C; pressure: 0.80 MPa; brine flow rate: 1.67 × 10⁻⁶ m3/s (= 100 mL/min); Re: 93–98 (Cell A) and 92–94 (Cell B); and membrane: UTC-70UL (Cells A and B). Simulated line of scaling-based critical flux is given by Jsc = k ln{(CsCp)/(CbCp)} = (5.17 × 10⁻⁵ − 6.79 × 10⁻⁶ ln Cb) m3/(m2 s). Simulated line of osmotic pressure model flux is given by Jv = AP − Δπ), A = 1.41 × 10⁻⁵ m3/(m2 s) for UTC-70UL.
Membranes 12 00894 g009
Figure 10. Effect of temperature on convergent permeate flux. Test conditions: pressure: 0.80 MPa; feed CaSO4 concentration: 875 mg/L; brine flow rate: 1.67 × 10⁻⁶ m3/s (= 100 mL/min); Re: 110 (298 K), 126 (303 K), 133 (308 K) for Cell A and 108 (298 K), 123 (303 K), 128 (308 K) for Cell B; and membrane: UTC-70UL (Cells A and B). Simulated line of scaling-based critical flux is given by Jsc = k ln{(CsCp)/(CbCp)} = (1.23 × 10⁻⁵ (T exp(−2005/T))0.67) m3/(m2 s).
Membranes 12 00894 g010
Figure 11. Effect of Reynolds number on convergent permeate flux. Test conditions: temperature: 30 °C; pressure: 0.80 MPa; feed CaSO4 concentration: 875 mg/L; and membrane: UTC-70UL (Cell A) and UTC-80 (Cell B). Simulated line of scaling-based critical flux is given by Jsc = k ln{(CsCp)/(CbCp)} = 1.45 × 10⁻⁶ Re0.33 m3/(m2 s). Simulated line of osmotic pressure model flux was Jv = AP − Δπ), A = 4.83 × 10⁻⁶ m3/(m2 s MPa) for UTC-80.
Membranes 12 00894 g011
Table 1. Permeate flux and salt rejection of reverse osmosis membranes used in this study.
Membrane Model
UTC-60UTC-70ULUTC-70UTC-80
Performance
    Permeate flux (m3/(m2d)0.781.151.260.65
    Salt rejection (%)70.999.599.799.9
Test conditions
    Applied pressure (MPa)0.350.751.55.5
    Temperature (°C)25252525
    NaCl concentration (mg/L)500150015003.5% Seawater
    pH (−)6.56.56.56.5
Publisher’s Note: MDPI stays neutral with regard to jurisdictional claims in published maps and institutional affiliations.

