Comparison of Pretreatment Methods for Salinity Gradient Power Generation Using Reverse Electrodialysis (RED) Systems
Abstract
:1. Introduction
2. Materials and Methods
2.1. Lab-Scale RED System
2.2. Preparation of High-Salinity and Low-Salinity Solutions
2.3. Pretreatments
2.4. Model Development
- The current flow distribution is continuous;
- Only the difference in the ion concentrations between the HS and LS solutions is considered to calculate the open-circuit voltage (OCV) and the power density;
- The parameters used in the model are evaluated under average conditions between the inlet and the outlet [43].
2.5. EEM Analysis and PARAFAC Model
3. Results and Discussion
3.1. Water Quality of Raw and Pretreated Water
3.2. OCV and Power Density
3.3. Stack Pressure
3.4. Visual Observations of IEX Membranes
3.5. EEM and PARAFAC Analysis
3.6. Correlations between Water Quality Parameters and Stack Pressure
4. Conclusions
- The RO brine without pretreatment had a relatively high TOC (19 mg/L) and UV254 (0.514 cm−1), while the CF, MF, and UF could not reduce the organic matters; the NF, GAC, and AFM showed the TOC removal ranging from 79 to 91%, and the UV254 removal ranging from 83% to 97%;
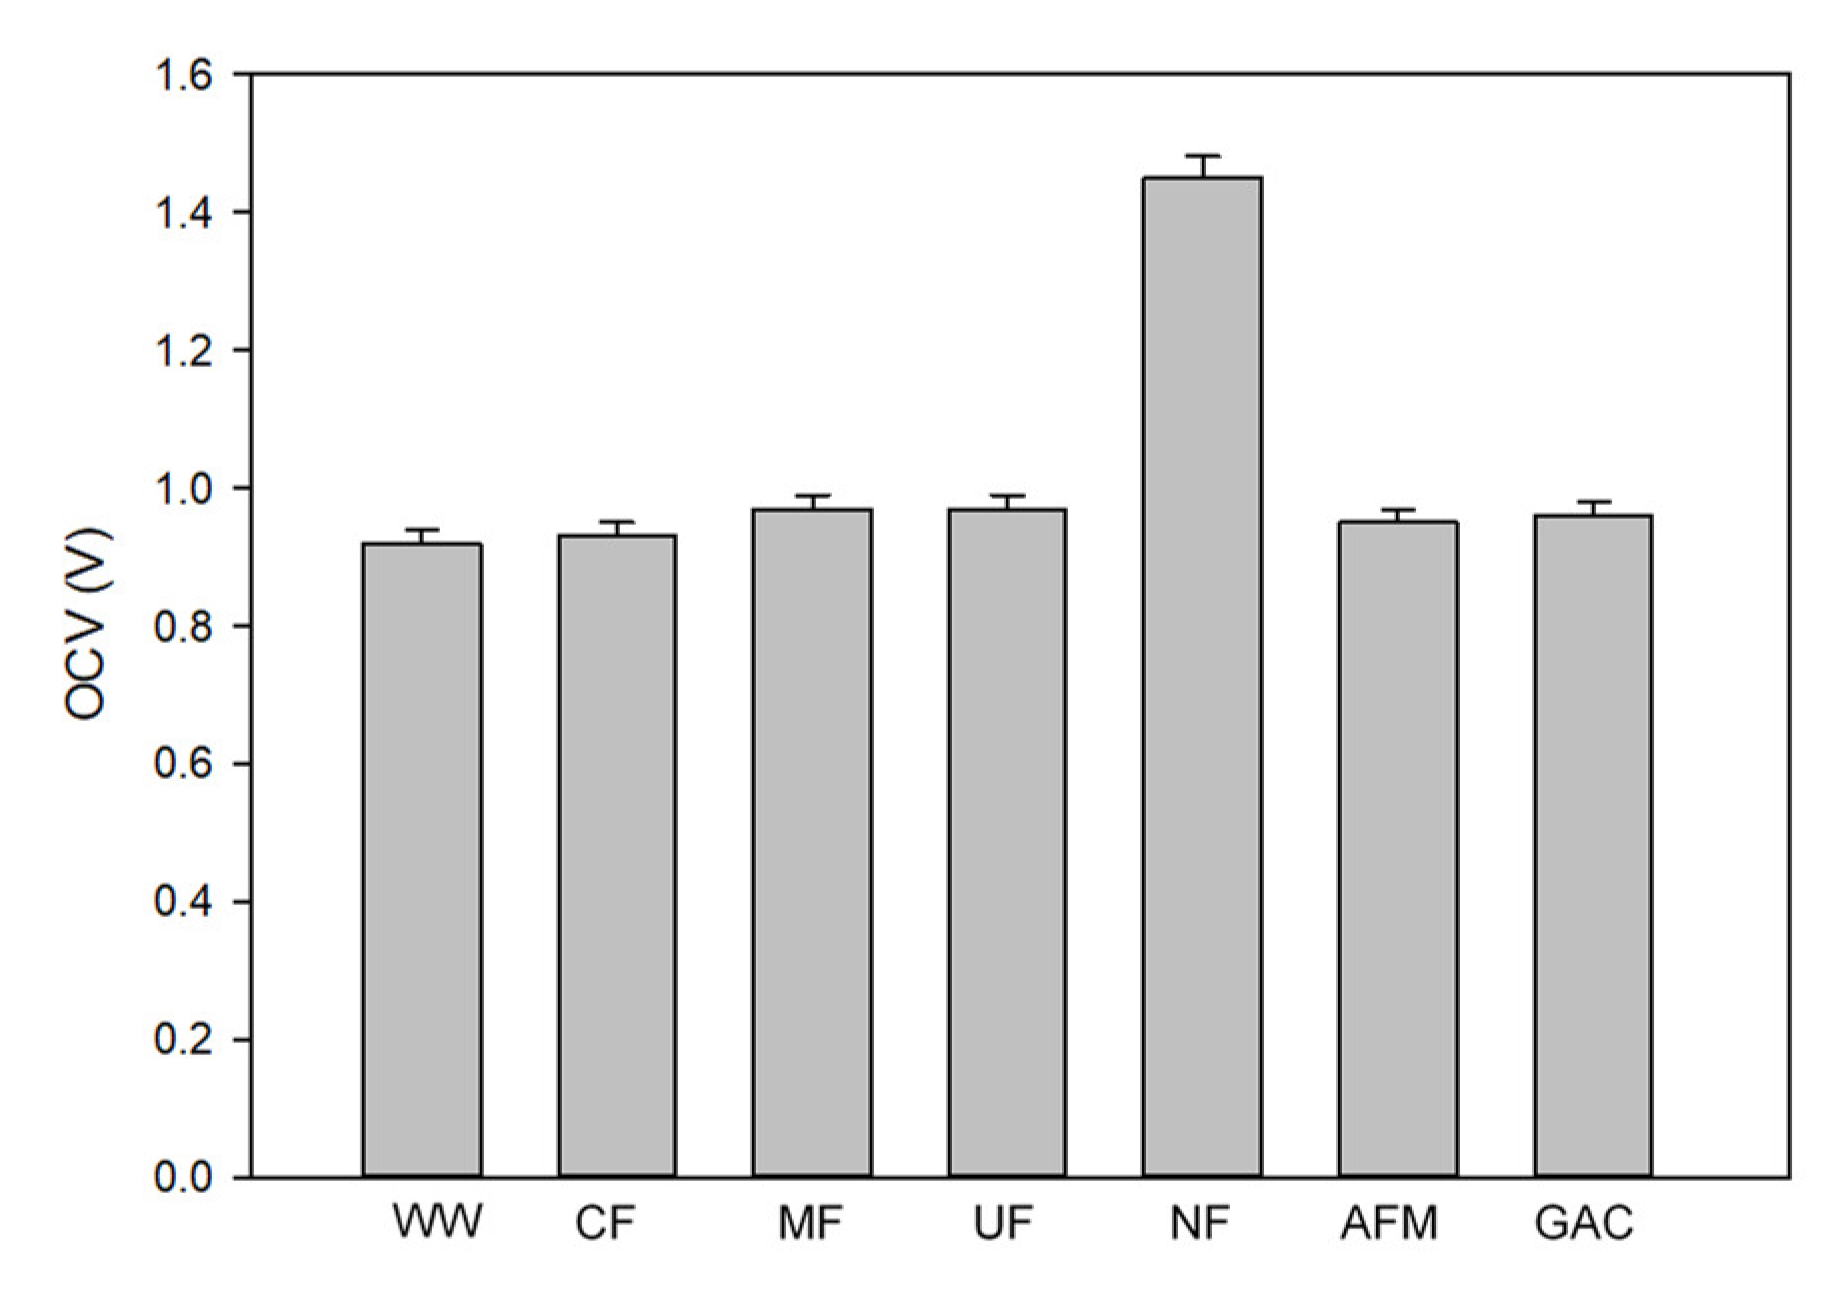
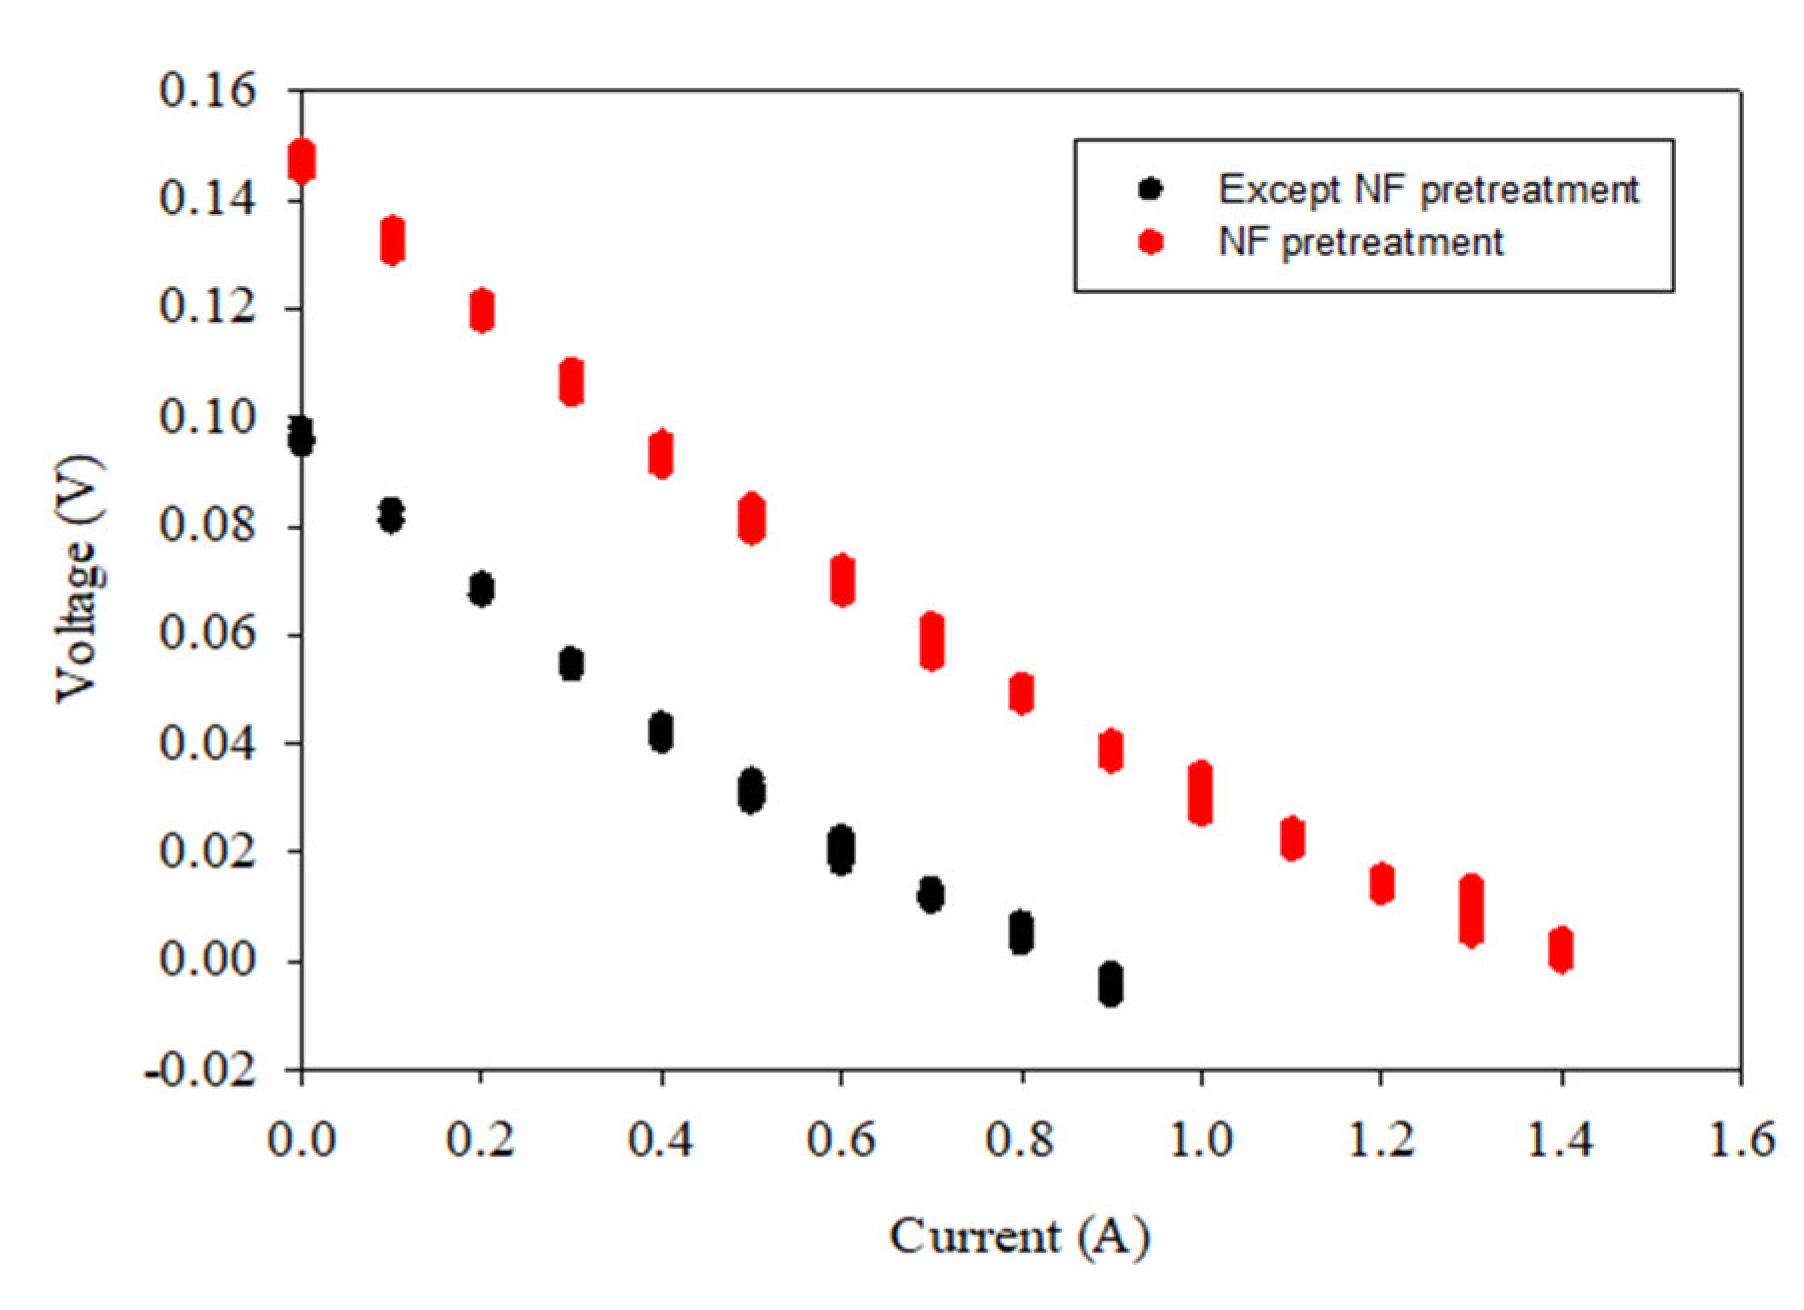
- The OCV value for the NF-pretreated water was 1.46 V, and the OCV values for all the other cases were in the range between 0.92 V and 0.97 V. The OCV is not significantly influenced by the turbidity, the TOC, and the UV254, but it is by the TDS;
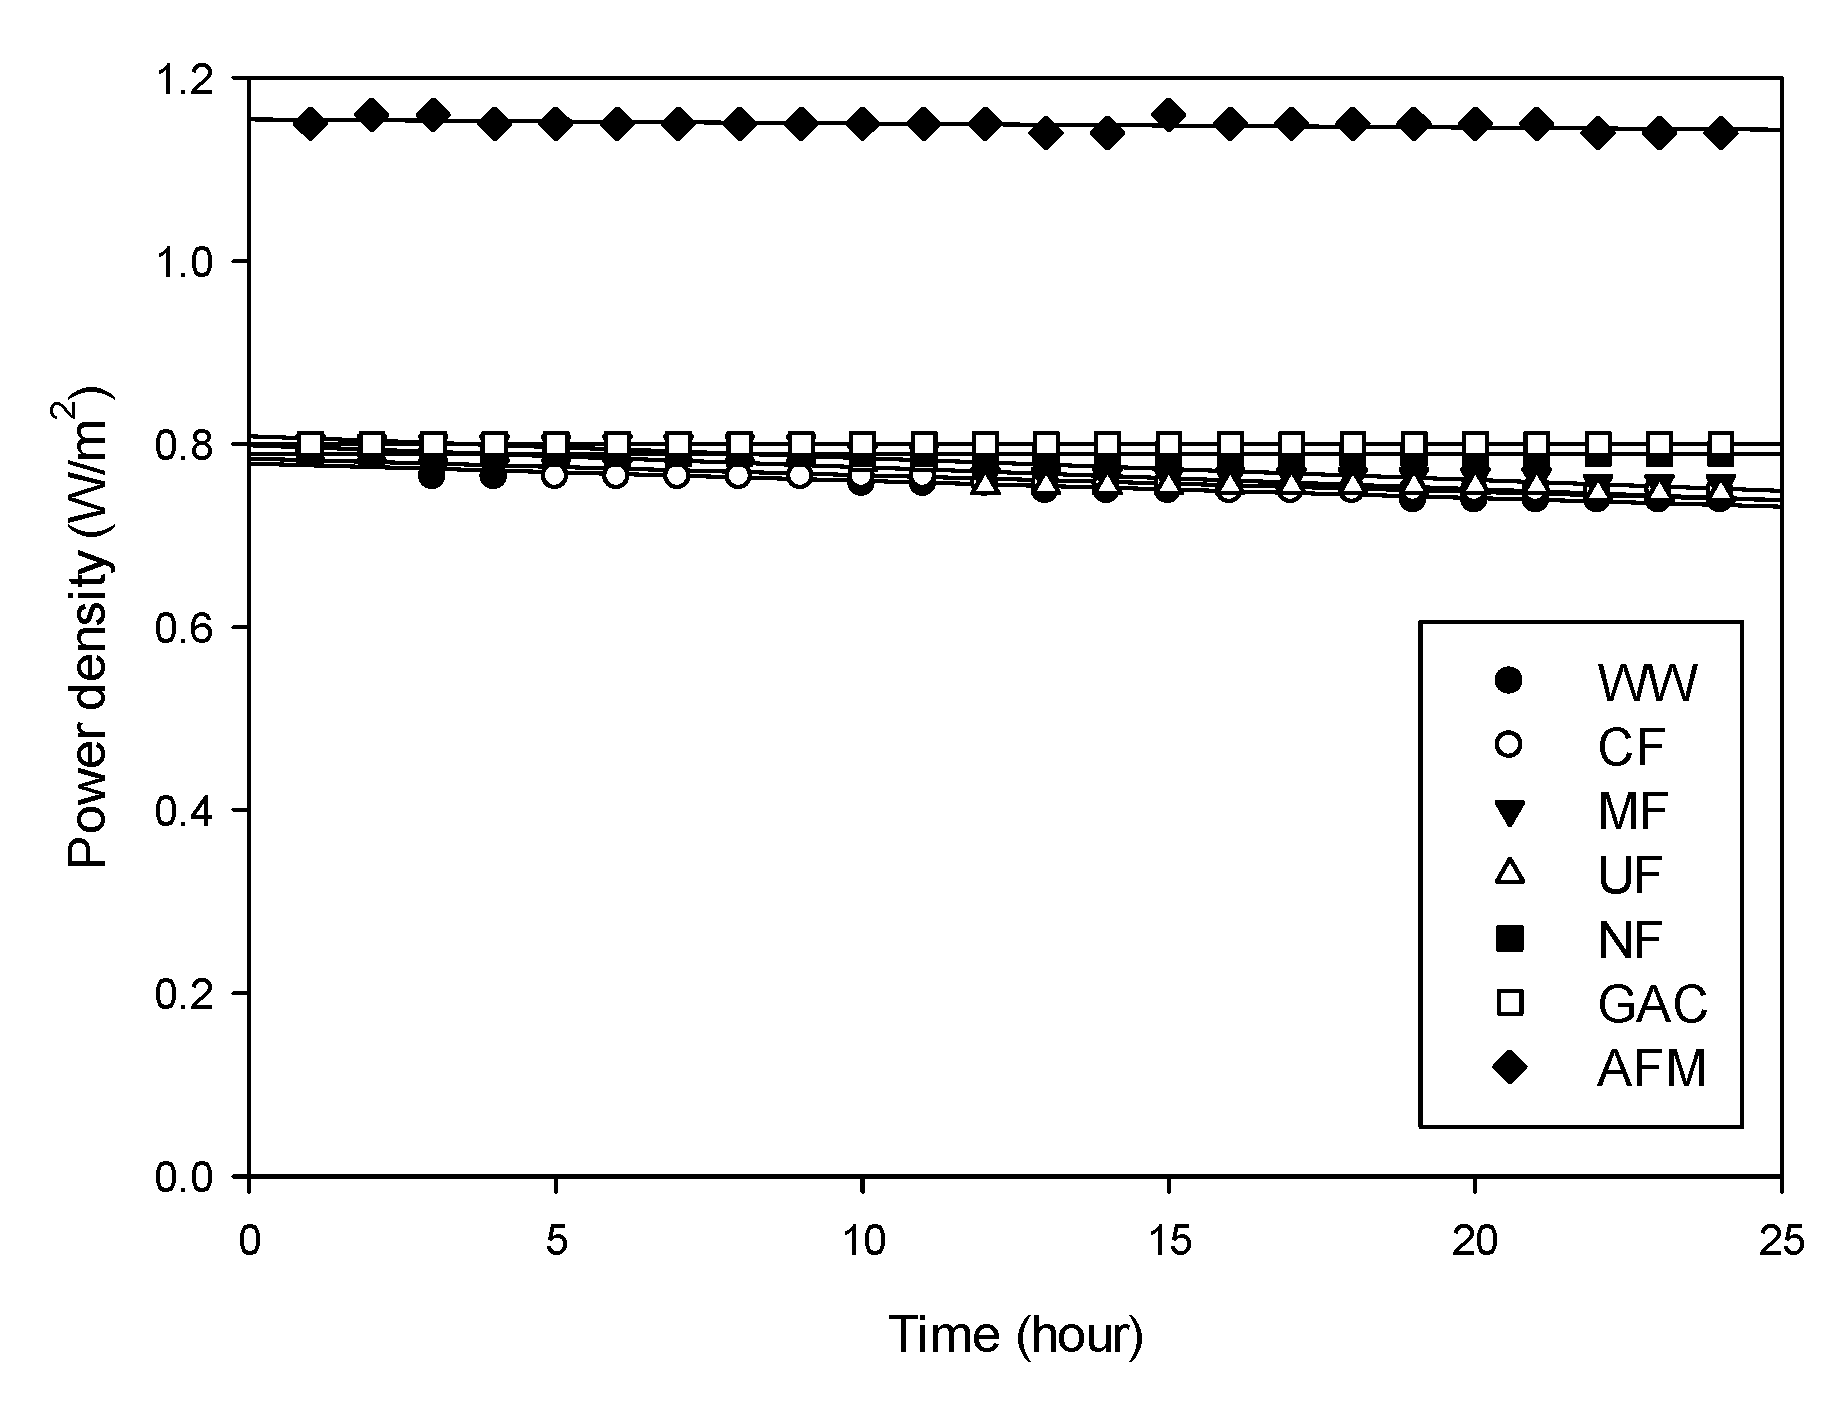
- Similar to the OCV, the power density was higher for the NF-pretreated water (1.15 W/m2) than for the other cases (0.79 ~ 0.8 W/m2). The reduction in the power density with time was not significant (<−2.39 × 10⁻³ W/m2-h, less than 15% per 24 h). The NF, GAC, and AFM were slightly better at controlling the reduction in the power density than the CF, MF, and UF;
- The experimental results on the OCV and power density for the water samples were matched well with the model calculations. The errors of the OCV calculations range between 6.3 and 13.8%. Those of the power density calculations range from 3.6% to 4.8%;
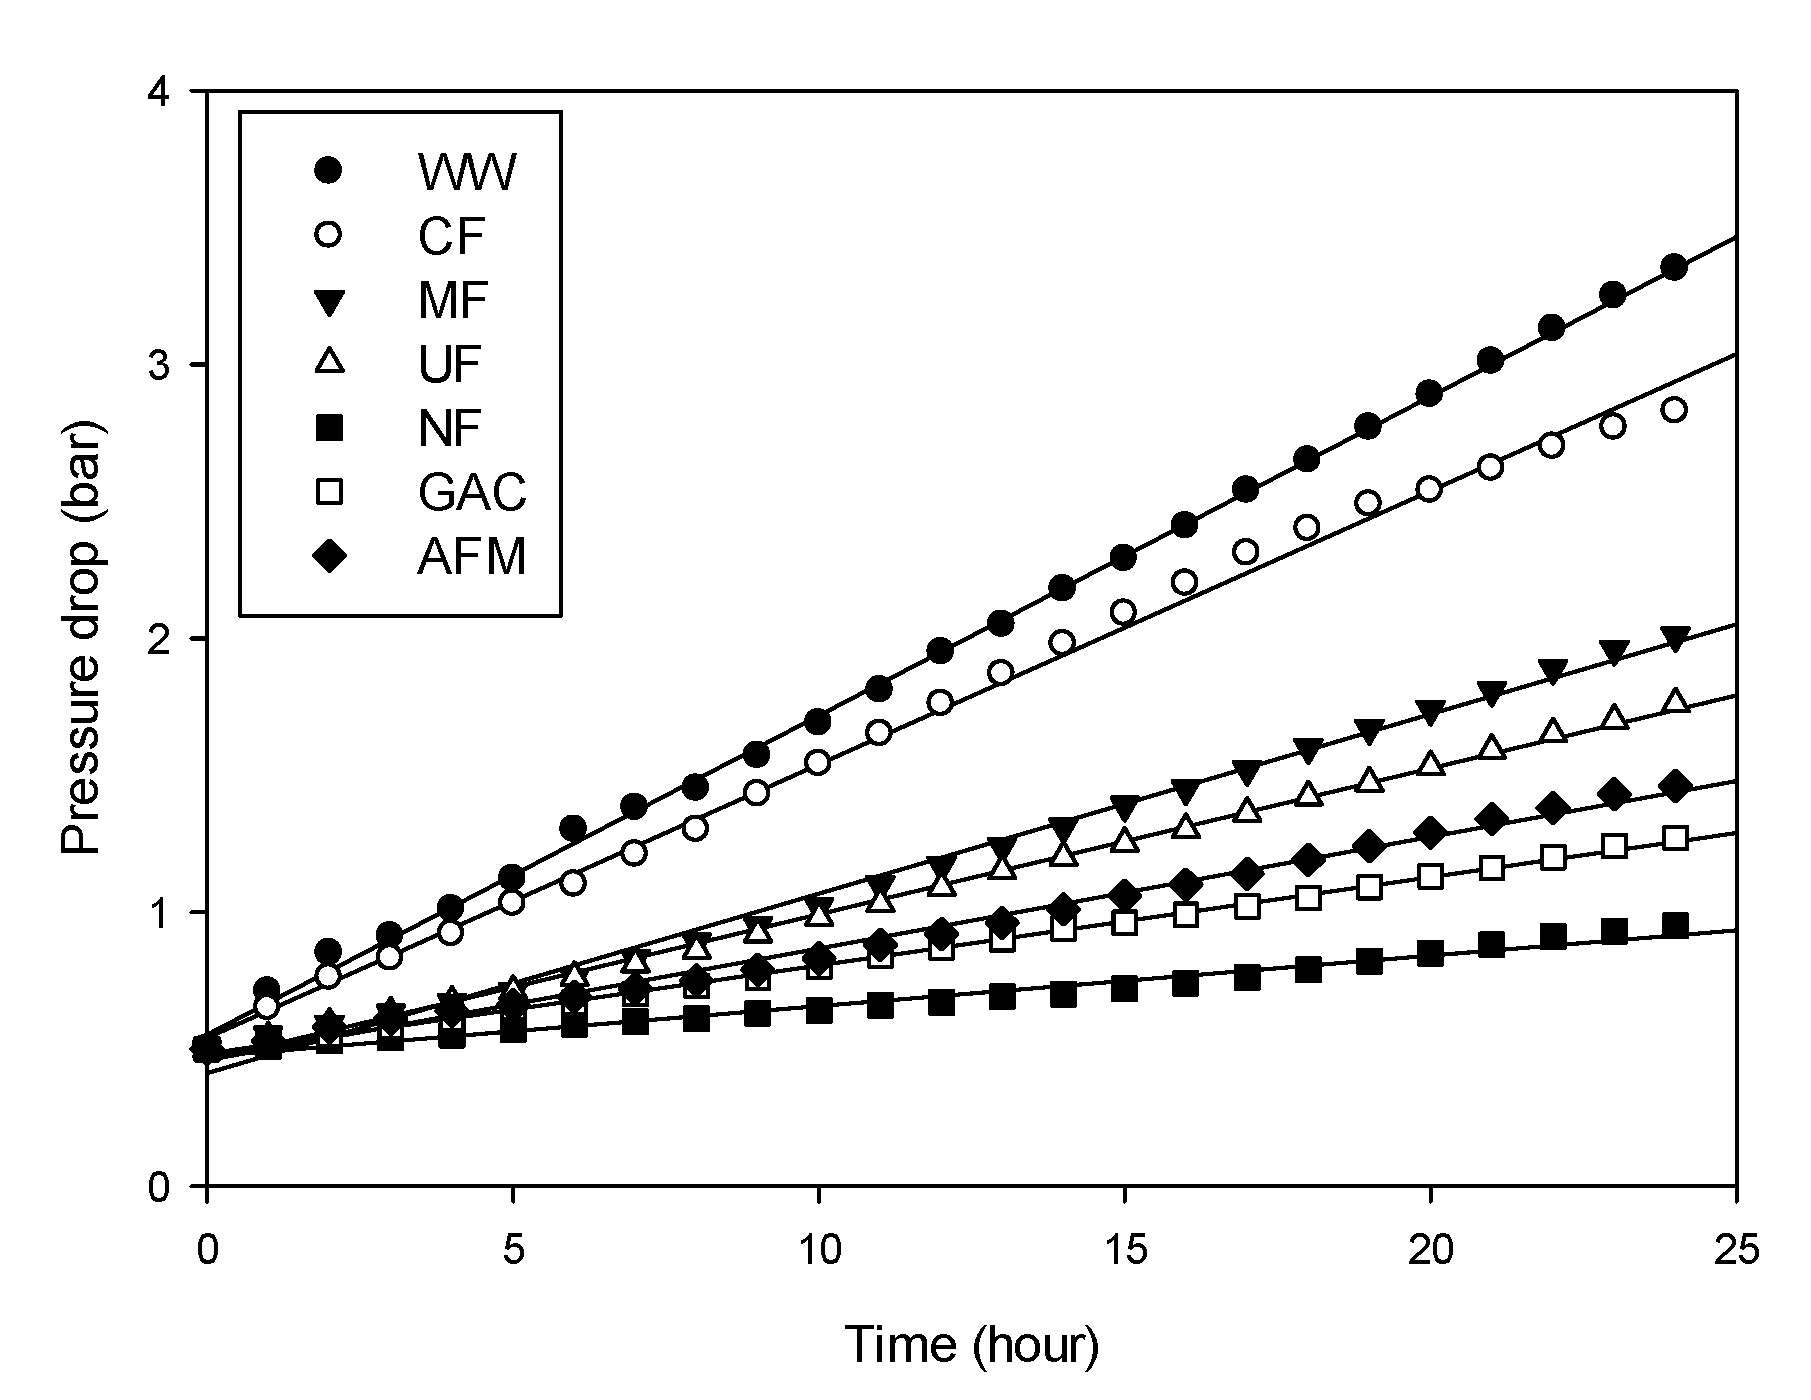
- Although the turbidity of the untreated feed (RO brine without pretreatment) was not high (1.3 NTU), the stack pressure increased from 0.5 to 3.35 bar within 24 h. The final stack pressures for the water samples treated by the CF, MF, and UF were higher than those treated by the NF, GAC, and AFM;
- The PARAFAC analysis was carried out for the water samples with different pretreatments. Three main fluorescence peaks were identified by the PARAFAC analysis, including terrestrial humic-like substance (C1), microbial humic-like substance (C2), and protein-like substance (C3). In the CF, MF, and UF cases, the scores were not significantly changed. On the contrary, the scores substantially decreased in the NF, GAC, and AFM cases;
- The rates of the stack pressure increase were correlated with the water quality parameters and the PARAFAC scores. The correlation between the turbidity and the increase in the stack pressure was the strongest. There were also reasonable relationships between the rates of the stack pressure increase and C1/C3. On the other hand, the rates of the stack pressure increase were not successfully correlated with C2. These imply that the increase in the stack pressure is closely related to the amounts of terrestrial humic-like substances and protein-like substances;
- Although the NF exhibited the highest pretreatment efficiency, it uses a substantial amount of energy, which leads to a reduction in the net energy production by RED. Accordingly, the GAC and AFM are recommended as the optimum RED pretreatment methods because of their effectiveness at removing organic matter.
Author Contributions
Funding
Institutional Review Board Statement
Data Availability Statement
Conflicts of Interest
Abbreviations
| Area resistance of HS solution | |
| Area resistance of LS solution | |
| Permselectivity of anion exchange membrane | |
| Permselectivity of cation exchange membrane | |
| C | Ion concentration (mol·m−3) |
| Output voltage | |
| Open-circuit voltage | |
| F | Faraday’s constant (96,485 C·mol−1) |
| Intermembrane distances of HS solution | |
| Intermembrane distance of LS solution | |
| Electric conductivity of HS solution | |
| Electric conductivity of LS solution | |
| I | Electrical current |
| Number of cell pairs | |
| R | Universal gas constant (8.31 J·mol·K−1) |
| Resistance of anion exchange membrane (Ω·m2) | |
| Resistance of cation exchange membrane (Ω·m2) | |
| Resistance in RED stack (internal loss) | |
| Resistance of the concentration change between the inlet and outlet | |
| P | Gloss power |
| T | Temperature (K) |
| Resistance time inside the stack | |
| z | Valence, and γ is the activity coefficient |
| Mask factor of the membrane | |
| Porosity of the spacers (-) |
References
- Zhou, Z.; Benbouzid, M.; Frédéric Charpentier, J.; Scuiller, F.; Tang, T. A review of energy storage technologies for marine current energy systems. Renew. Sustain. Energy Rev. 2013, 18, 390–400. [Google Scholar] [CrossRef] [Green Version]
- Logan, B.E.; Elimelech, M. Membrane-based processes for sustainable power generation using water. Nature 2012, 488, 313–319. [Google Scholar] [CrossRef] [PubMed]
- Jia, Z.; Wang, B.; Song, S.; Fan, Y. Blue energy: Current technologies for sustainable power generation from water salinity gradient. Renew. Sustain. Energy Rev. 2014, 31, 91–100. [Google Scholar] [CrossRef]
- Helfer, F.; Lemckert, C. The power of salinity gradients: An Australian example. Renew. Sustain. Energy Rev. 2015, 50, 1–16. [Google Scholar] [CrossRef] [Green Version]
- Jalili, Z.; Krakhella, K.W.; Einarsrud, K.E.; Burheim, O.S. Energy generation and storage by salinity gradient power: A model-based assessment. J. Energy Storage 2019, 24, 100755. [Google Scholar] [CrossRef]
- Seyfried, C.; Palko, H.; Dubbs, L. Potential local environmental impacts of salinity gradient energy: A review. Renew. Sustain. Energy Rev. 2019, 102, 111–120. [Google Scholar] [CrossRef]
- Yip, N.Y.; Elimelech, M. Thermodynamic and energy efficiency analysis of power generation from natural salinity gradients by pressure retarded osmosis. Environ. Sci. Technol. 2012, 46, 5230–5239. [Google Scholar] [CrossRef]
- Tufa, R.A.; Curcio, E.; van Baak, W.; Veerman, J.; Grasman, S.; Fontananova, E.; Di Profio, G. Potential of brackish water and brine for energy generation by salinity gradient power-reverse electrodialysis (SGP-RE). RSC Adv. 2014, 4, 42617–42623. [Google Scholar] [CrossRef] [Green Version]
- Chen, Y.; Alanezi, A.A.; Zhou, J.; Altaee, A.; Shaheed, M.H. Optimization of module pressure retarded osmosis membrane for maximum energy extraction. J. Water Process Eng. 2019, 32, 100935. [Google Scholar] [CrossRef]
- Han, G.; Zhou, J.; Wan, C.; Yang, T.; Chung, T.-S. Investigations of inorganic and organic fouling behaviors, antifouling and cleaning strategies for pressure retarded osmosis (PRO) membrane using seawater desalination brine and wastewater. Water Res. 2016, 103, 264–275. [Google Scholar] [CrossRef]
- Altaee, A.; Cippolina, A. Modelling and optimization of modular system for power generation from a salinity gradient. Renew. Energy 2019, 141, 139–147. [Google Scholar] [CrossRef]
- Lee, S.; Choi, J.; Park, Y.-G.; Shon, H.; Ahn, C.H.; Kim, S.-H. Hybrid desalination processes for beneficial use of reverse osmosis brine: Current status and future prospects. Desalination 2019, 454, 104–111. [Google Scholar] [CrossRef]
- Tedesco, M.; Cipollina, A.; Tamburini, A.; Micale, G. Towards 1 kW power production in a reverse electrodialysis pilot plant with saline waters and concentrated brines. J. Membr. Sci. 2017, 522, 226–236. [Google Scholar] [CrossRef] [Green Version]
- Veerman, J.; Saakes, M.; Metz, S.J.; Harmsen, G.J. Electrical power from sea and river water by reverse electrodialysis: A first step from the laboratory to a real power plant. Environ. Sci. Technol. 2010, 44, 9207–9212. [Google Scholar] [CrossRef]
- Nazif, A.; Karkhanechi, H.; Saljoughi, E.; Mousavi, S.M.; Matsuyama, H. Recent progress in membrane development, affecting parameters, and applications of reverse electrodialysis: A review. J. Water Process Eng. 2022, 47, 102706. [Google Scholar] [CrossRef]
- Kim, H.; Yang, S.; Choi, J.; Kim, J.-O.; Jeong, N. Optimization of the number of cell pairs to design efficient reverse electrodialysis stack. Desalination 2021, 497, 114676. [Google Scholar] [CrossRef]
- Veerman, J.; Saakes, M.; Metz, S.; Harmsen, G. Reverse electrodialysis: Performance of a stack with 50 cells on the mixing of sea and river water. J. Membr. Sci. 2009, 327, 136–144. [Google Scholar] [CrossRef] [Green Version]
- Pattle, R. Production of electric power by mixing fresh and salt water in the hydroelectric pile. Nature 1954, 174, 660. [Google Scholar] [CrossRef]
- Wick, G. Prospects for renewable energy from sea. Mar. Technol. Soc. J. 1977, 11, 16–21. [Google Scholar]
- Weinstein, J.N.; Leitz, F.B. Electric power from differences in salinity: The dialytic battery. Science 1976, 191, 557–559. [Google Scholar] [CrossRef]
- Fontananova, E.; Messana, D.; Tufa, R.; Nicotera, I.; Kosma, V.; Curcio, E.; Van Baak, W.; Drioli, E.; Di Profio, G. Effect of solution concentration and composition on the electrochemical properties of ion exchange membranes for energy conversion. J. Power Sources 2017, 340, 282–293. [Google Scholar] [CrossRef]
- Veerman, J.; Saakes, M.; Metz, S.J.; Harmsen, G. Reverse electrodialysis: Evaluation of suitable electrode systems. J. Appl. Electrochem. 2010, 40, 1461–1474. [Google Scholar] [CrossRef] [Green Version]
- Veerman, J.; Post, J.; Saakes, M.; Metz, S.; Harmsen, G. Reducing power losses caused by ionic shortcut currents in reverse electrodialysis stacks by a validated model. J. Membr. Sci. 2008, 310, 418–430. [Google Scholar] [CrossRef] [Green Version]
- Tedesco, M.; Scalici, C.; Vaccari, D.; Cipollina, A.; Tamburini, A.; Micale, G. Performance of the first reverse electrodialysis pilot plant for power production from saline waters and concentrated brines. J. Membr. Sci. 2016, 500, 33–45. [Google Scholar] [CrossRef] [Green Version]
- Hong, J.G.; Park, T.-W.; Dhadake, Y. Property evaluation of custom-made ion exchange membranes for electrochemical performance in reverse electrodialysis application. J. Electroanal. Chem. 2019, 850, 113437. [Google Scholar] [CrossRef]
- Veerman, J.; Saakes, M.; Metz, S.; Harmsen, G. Reverse electrodialysis: A validated process model for design and optimization. Chem. Eng. J. 2011, 166, 256–268. [Google Scholar] [CrossRef]
- Gurreri, L.; Battaglia, G.; Tamburini, A.; Cipollina, A.; Micale, G.; Ciofalo, M. Multi-physical modelling of reverse electrodialysis. Desalination 2017, 423, 52–64. [Google Scholar] [CrossRef] [Green Version]
- Tedesco, M.; Brauns, E.; Cipollina, A.; Micale, G.; Modica, P.; Russo, G.; Helsen, J. Reverse electrodialysis with saline waters and concentrated brines: A laboratory investigation towards technology scale-up. J. Membr. Sci. 2015, 492, 9–20. [Google Scholar] [CrossRef] [Green Version]
- Mei, Y.; Tang, C.Y. Recent developments and future perspectives of reverse electrodialysis technology: A review. Desalination 2018, 425, 156–174. [Google Scholar] [CrossRef]
- Vermaas, D.A.; Saakes, M.; Nijmeijer, K. Doubled power density from salinity gradients at reduced intermembrane distance. Environ. Sci. Technol. 2011, 45, 7089–7095. [Google Scholar] [CrossRef]
- Hong, J.G.; Zhang, W.; Luo, J.; Chen, Y. Modeling of power generation from the mixing of simulated saline and freshwater with a reverse electrodialysis system: The effect of monovalent and multivalent ions. Appl. Energy 2013, 110, 244–251. [Google Scholar] [CrossRef]
- Tedesco, M.; Hamelers, H.; Biesheuvel, P. Nernst-Planck transport theory for (reverse) electrodialysis: I. Effect of co-ion transport through the membranes. J. Membr. Sci. 2016, 510, 370–381. [Google Scholar] [CrossRef]
- Długołęcki, P.; Dąbrowska, J.; Nijmeijer, K.; Wessling, M. Ion conductive spacers for increased power generation in reverse electrodialysis. J. Membr. Sci. 2010, 347, 101–107. [Google Scholar] [CrossRef]
- Chen, S.C.; Amy, G.L.; Chung, T.-S. Membrane fouling and anti-fouling strategies using RO retentate from a municipal water recycling plant as the feed for osmotic power generation. Water Res. 2016, 88, 144–155. [Google Scholar] [CrossRef]
- Wan, C.F.; Jin, S.; Chung, T.-S. Mitigation of inorganic fouling on pressure retarded osmosis (PRO) membranes by coagulation pretreatment of the wastewater concentrate feed. J. Membr. Sci. 2019, 572, 658–667. [Google Scholar] [CrossRef]
- Ju, J.; Choi, Y.; Lee, S.; Jeong, N. Comparison of fouling characteristics between reverse electrodialysis (RED) and pressure retarded osmosis (PRO). Desalination 2021, 497, 114648. [Google Scholar] [CrossRef]
- Santoro, S.; Tufa, R.A.; Avci, A.H.; Fontananova, E.; Di Profio, G.; Curcio, E. Fouling propensity in reverse electrodialysis operated with hypersaline brine. Energy 2021, 228, 120563. [Google Scholar] [CrossRef]
- Chon, K.; Jeong, N.; Rho, H.; Nam, J.-Y.; Jwa, E.; Cho, J. Fouling characteristics of dissolved organic matter in fresh water and seawater compartments of reverse electrodialysis under natural water conditions. Desalination 2020, 496, 114478. [Google Scholar] [CrossRef]
- D’Angelo, A.; Tedesco, M.; Cipollina, A.; Galia, A.; Micale, G.; Scialdone, O. Reverse electrodialysis performed at pilot plant scale: Evaluation of redox processes and simultaneous generation of electric energy and treatment of wastewater. Water Res. 2017, 125, 123–131. [Google Scholar] [CrossRef]
- Ortiz-Imedio, R.; Gomez-Coma, L.; Fallanza, M.; Ortiz, A.; Ibañez, R.; Ortiz, I. Comparative performance of Salinity Gradient Power-Reverse Electrodialysis under different operating conditions. Desalination 2019, 457, 8–21. [Google Scholar] [CrossRef]
- Tufa, R.A.; Curcio, E.; Brauns, E.; van Baak, W.; Fontananova, E.; Di Profio, G. Membrane distillation and reverse electrodialysis for near-zero liquid discharge and low energy seawater desalination. J. Membr. Sci. 2015, 496, 325–333. [Google Scholar] [CrossRef]
- Nam, J.-Y.; Hwang, K.-S.; Kim, H.-C.; Jeong, H.; Kim, H.; Jwa, E.; Yang, S.; Choi, J.; Kim, C.-S.; Han, J.-H. Assessing the behavior of the feed-water constituents of a pilot-scale 1000-cell-pair reverse electrodialysis with seawater and municipal wastewater effluent. Water Res. 2019, 148, 261–271. [Google Scholar] [CrossRef] [PubMed]
- Długołȩcki, P.; Gambier, A.; Nijmeijer, K.; Wessling, M. Practical potential of reverse electrodialysis as process for sustainable energy generation. Environ. Sci. Technol. 2009, 43, 6888–6894. [Google Scholar] [CrossRef] [PubMed]
- Tedesco, M.; Cipollina, A.; Tamburini, A.; Bogle, I.D.L.; Micale, G. A simulation tool for analysis and design of reverse electrodialysis using concentrated brines. Chem. Eng. Res. Des. 2015, 93, 441–456. [Google Scholar] [CrossRef] [Green Version]
- Vermaas, D.A.; Guler, E.; Saakes, M.; Nijmeijer, K. Theoretical power density from salinity gradients using reverse electrodialysis. Energy Procedia 2012, 20, 170–184. [Google Scholar] [CrossRef] [Green Version]
- Vermaas, D.A.; Saakes, M.; Nijmeijer, K. Power generation using profiled membranes in reverse electrodialysis. J. Membr. Sci. 2011, 385, 234–242. [Google Scholar] [CrossRef]
- Baghoth, S.A.; Sharma, S.K.; Amy, G.L. Tracking natural organic matter (NOM) in a drinking water treatment plant using fluorescence excitation–emission matrices and PARAFAC. Water Res. 2011, 45, 797–809. [Google Scholar] [CrossRef]
- Yu, H.; Qu, F.; Liang, H.; Han, Z.-S.; Ma, J.; Shao, S.; Chang, H.; Li, G. Understanding ultrafiltration membrane fouling by extracellular organic matter of Microcystis aeruginosa using fluorescence excitation–emission matrix coupled with parallel factor analysis. Desalination 2014, 337, 67–75. [Google Scholar] [CrossRef]
- Wells, M.J.M.; Hooper, J.; Mullins, G.A.; Bell, K.Y. Development of a fluorescence EEM-PARAFAC model for potable water reuse monitoring: Implications for inter-component protein–fulvic–humic interactions. Sci. Total Environ. 2022, 820, 153070. [Google Scholar] [CrossRef]
- Santín, C.; Yamashita, Y.; Otero, X.L.; Alvarez, M.A.; Jaffé, R. Characterizing humic substances from estuarine soils and sediments by excitation-emission matrix spectroscopy and parallel factor analysis. Biogeochemistry 2009, 96, 131–147. [Google Scholar] [CrossRef]
- Suhalim, N.S.; Kasim, N.; Mahmoudi, E.; Shamsudin, I.J.; Mohammad, A.W.; Mohamed Zuki, F.; Jamari, N.L. Rejection Mechanism of Ionic Solute Removal by Nanofiltration Membranes: An Overview. Nanomaterials 2022, 12, 437. [Google Scholar] [CrossRef] [PubMed]


| Conditions | Values |
|---|---|
| Cell pairs (stack) | 10 |
| Area of one membrane (m2) | 0.0019 |
| QHC (mL/min) | 15 |
| QLC (mL/min) | 15 |
| CHC/CLC (M) | 0.6 M/0.1 M |
| Temperature (K) | 293 |
| Conditions | Specifications | |
|---|---|---|
| Manufacture | CEM | Fujifilm (Type-1, Manufacturing Europe, The Netherlands) |
| AEM | ||
| Thickness (μm) | CEM | 125 |
| AEM | 124 | |
| Area resistance (Ω·cm2) | CEM | 1.87 ± 0.01 |
| AEM | 1.08 ± 0.02 | |
| Transport number (-) | CEM | 0.952 |
| AEM | 0.963 | |
| CF | MF | UF | NF | GAC | AFM | |
|---|---|---|---|---|---|---|
| Manufacturer | Millipore | Millipore | A/G technology | Dow | Sunghong-Lab | Dryden Aqua |
| Model | TMTP14250 | GVHP 14250 | UFP10 | NF 70 | Granular activated carbon | Activated filter media |
| Pore size (μm) | 5 | 0.22 | 100 kDa (MWCO) | - | - | - |
| Media size (mm) | - | - | - | - | 0.2~5 | 0.4~1 |
| Feed flow rate (L/min) | 0.5 | 0.5 | 0.5 | 0.5 | 0.5 | 0.5 |
| Applied pressure (bar) | 0.1 | 0.5 | 1 | 2.5 | 0.08 | 0.08 |
| Electric Conductivity (μS/cm) | Turbidity (NTU) | TOC (mg/L) | UV254 (cm−1) | SUVA (L/mg-m) | |
|---|---|---|---|---|---|
| WW (no pretreatment) | 5850 | 1.30 | 19.0 | 0.514 | 2.71 |
| CF | 5850 | 1.25 | 18.7 | 0.502 | 2.68 |
| MF | 5850 | 0.80 | 17.9 | 0.497 | 2.94 |
| UF | 5850 | 0.60 | 13.0 | 0.287 | 2.20 |
| NF | 1456 | 0.15 | 1.8 | 0.017 | 1.01 |
| GAC | 5850 | 0.32 | 2.1 | 0.014 | 1.27 |
| AFM | 5850 | 0.40 | 3.9 | 0.089 | 2.28 |
| Chloride (mg/L) | Sulfate (mg/L) | Sodium (mg/L) | Calcium (mg/L) | Magnesium (mg/L) | Potassium (mg/L) | Silica (mg/L) | |
|---|---|---|---|---|---|---|---|
| WW | 111.48 | 565 | 798 | 1191 | 232 | 164 | 33.1 |
| NF | 81.1 | 53.5 | 431 | 10.8 | 30.3 | 13.6 | 8.7 |
| Water Type | Experimental OCV (V) | Calculated OCV (V) | Error (%) |
|---|---|---|---|
| WW (no pretreatment) | 0.92 | 1.036 | 11.19 |
| CF | 0.93 | 1.036 | 10.23 |
| MF | 0.97 | 1.036 | 6.3 |
| UF | 0.97 | 1.036 | 6.3 |
| NF | 1.46 | 1.694 | 13.8 |
| AFM | 0.95 | 1.036 | 8.3 |
| GAC | 0.96 | 1.036 | 7.3 |
| Water Type | Experimental Power Density (W/m2) | Calculated Power Density (W/m2) | Error (%) |
|---|---|---|---|
| WW (no pretreatment) | 0.790 | 0.83 | 4.8 |
| CF | 0.790 | 0.83 | 3.6 |
| MF | 0.800 | 0.83 | 3.6 |
| UF | 0.800 | 0.83 | 3.6 |
| NF | 1.15 | 1.2 | 4.1 |
| AFM | 0.790 | 0.83 | 3.6 |
| GAC | 0.800 | 0.83 | 3.6 |
| Water Type | Initial Stack Pressure (bar) | Final Stack Pressure (bar) | Rate of Stack Pressure Increase (bar/h) |
|---|---|---|---|
| WW (no pretreatment) | 0.5 | 3.35 | 0.11875 |
| CF | 0.5 | 2.83 | 0.097083 |
| MF | 0.5 | 2.01 | 0.062917 |
| UF | 0.5 | 1.76 | 0.0525 |
| NF | 0.5 | 0.95 | 0.01875 |
| AFM | 0.5 | 1.27 | 0.032083 |
| GAC | 0.5 | 1.46 | 0.04 |
| Components | Ex/Em | Description |
|---|---|---|
| Component 1 (C1) | 250(350)/450 | Terrestrial humic-like fluorescence |
| Component 2 (C2) | 250(325)/400 | Microbial humic-like fluorescence |
| Component 3 (C3) | 275/306 | Tryptophan-like substances (protein-like) |
| Water Type | Scores on Component 1 | Scores on Component 2 | Scores on Component 3 |
|---|---|---|---|
| WW (no pretreatment) | 7.0380 | 4.6656 | 4.3001 |
| CF | 6.5034 | 4.2204 | 4.1537 |
| MF | 6.8197 | 4.5548 | 4.0824 |
| UF | 6.2786 | 4.9669 | 3.7588 |
| NF | 3.2413 | 2.7326 | 1.9000 |
| AFM | 4.0954 | 1.3516 | 2.5199 |
| GAC | 4.3546 | 1.5523 | 2.7844 |
Publisher’s Note: MDPI stays neutral with regard to jurisdictional claims in published maps and institutional affiliations. |
© 2022 by the authors. Licensee MDPI, Basel, Switzerland. This article is an open access article distributed under the terms and conditions of the Creative Commons Attribution (CC BY) license (https://creativecommons.org/licenses/by/4.0/).
Share and Cite
Ju, J.; Choi, Y.; Lee, S.; Park, C.-g.; Hwang, T.; Jung, N. Comparison of Pretreatment Methods for Salinity Gradient Power Generation Using Reverse Electrodialysis (RED) Systems. Membranes 2022, 12, 372. https://doi.org/10.3390/membranes12040372
Ju J, Choi Y, Lee S, Park C-g, Hwang T, Jung N. Comparison of Pretreatment Methods for Salinity Gradient Power Generation Using Reverse Electrodialysis (RED) Systems. Membranes. 2022; 12(4):372. https://doi.org/10.3390/membranes12040372
Chicago/Turabian StyleJu, Jaehyun, Yongjun Choi, Sangho Lee, Chan-gyu Park, Taemun Hwang, and Namjo Jung. 2022. "Comparison of Pretreatment Methods for Salinity Gradient Power Generation Using Reverse Electrodialysis (RED) Systems" Membranes 12, no. 4: 372. https://doi.org/10.3390/membranes12040372
APA StyleJu, J., Choi, Y., Lee, S., Park, C.-g., Hwang, T., & Jung, N. (2022). Comparison of Pretreatment Methods for Salinity Gradient Power Generation Using Reverse Electrodialysis (RED) Systems. Membranes, 12(4), 372. https://doi.org/10.3390/membranes12040372


