
Can Large-Scale Offshore Membrane Desalination Cost-Effectively and Ecologically Address Water Scarcity in the Middle East?

Abstract
:1. Introduction
2. Methods
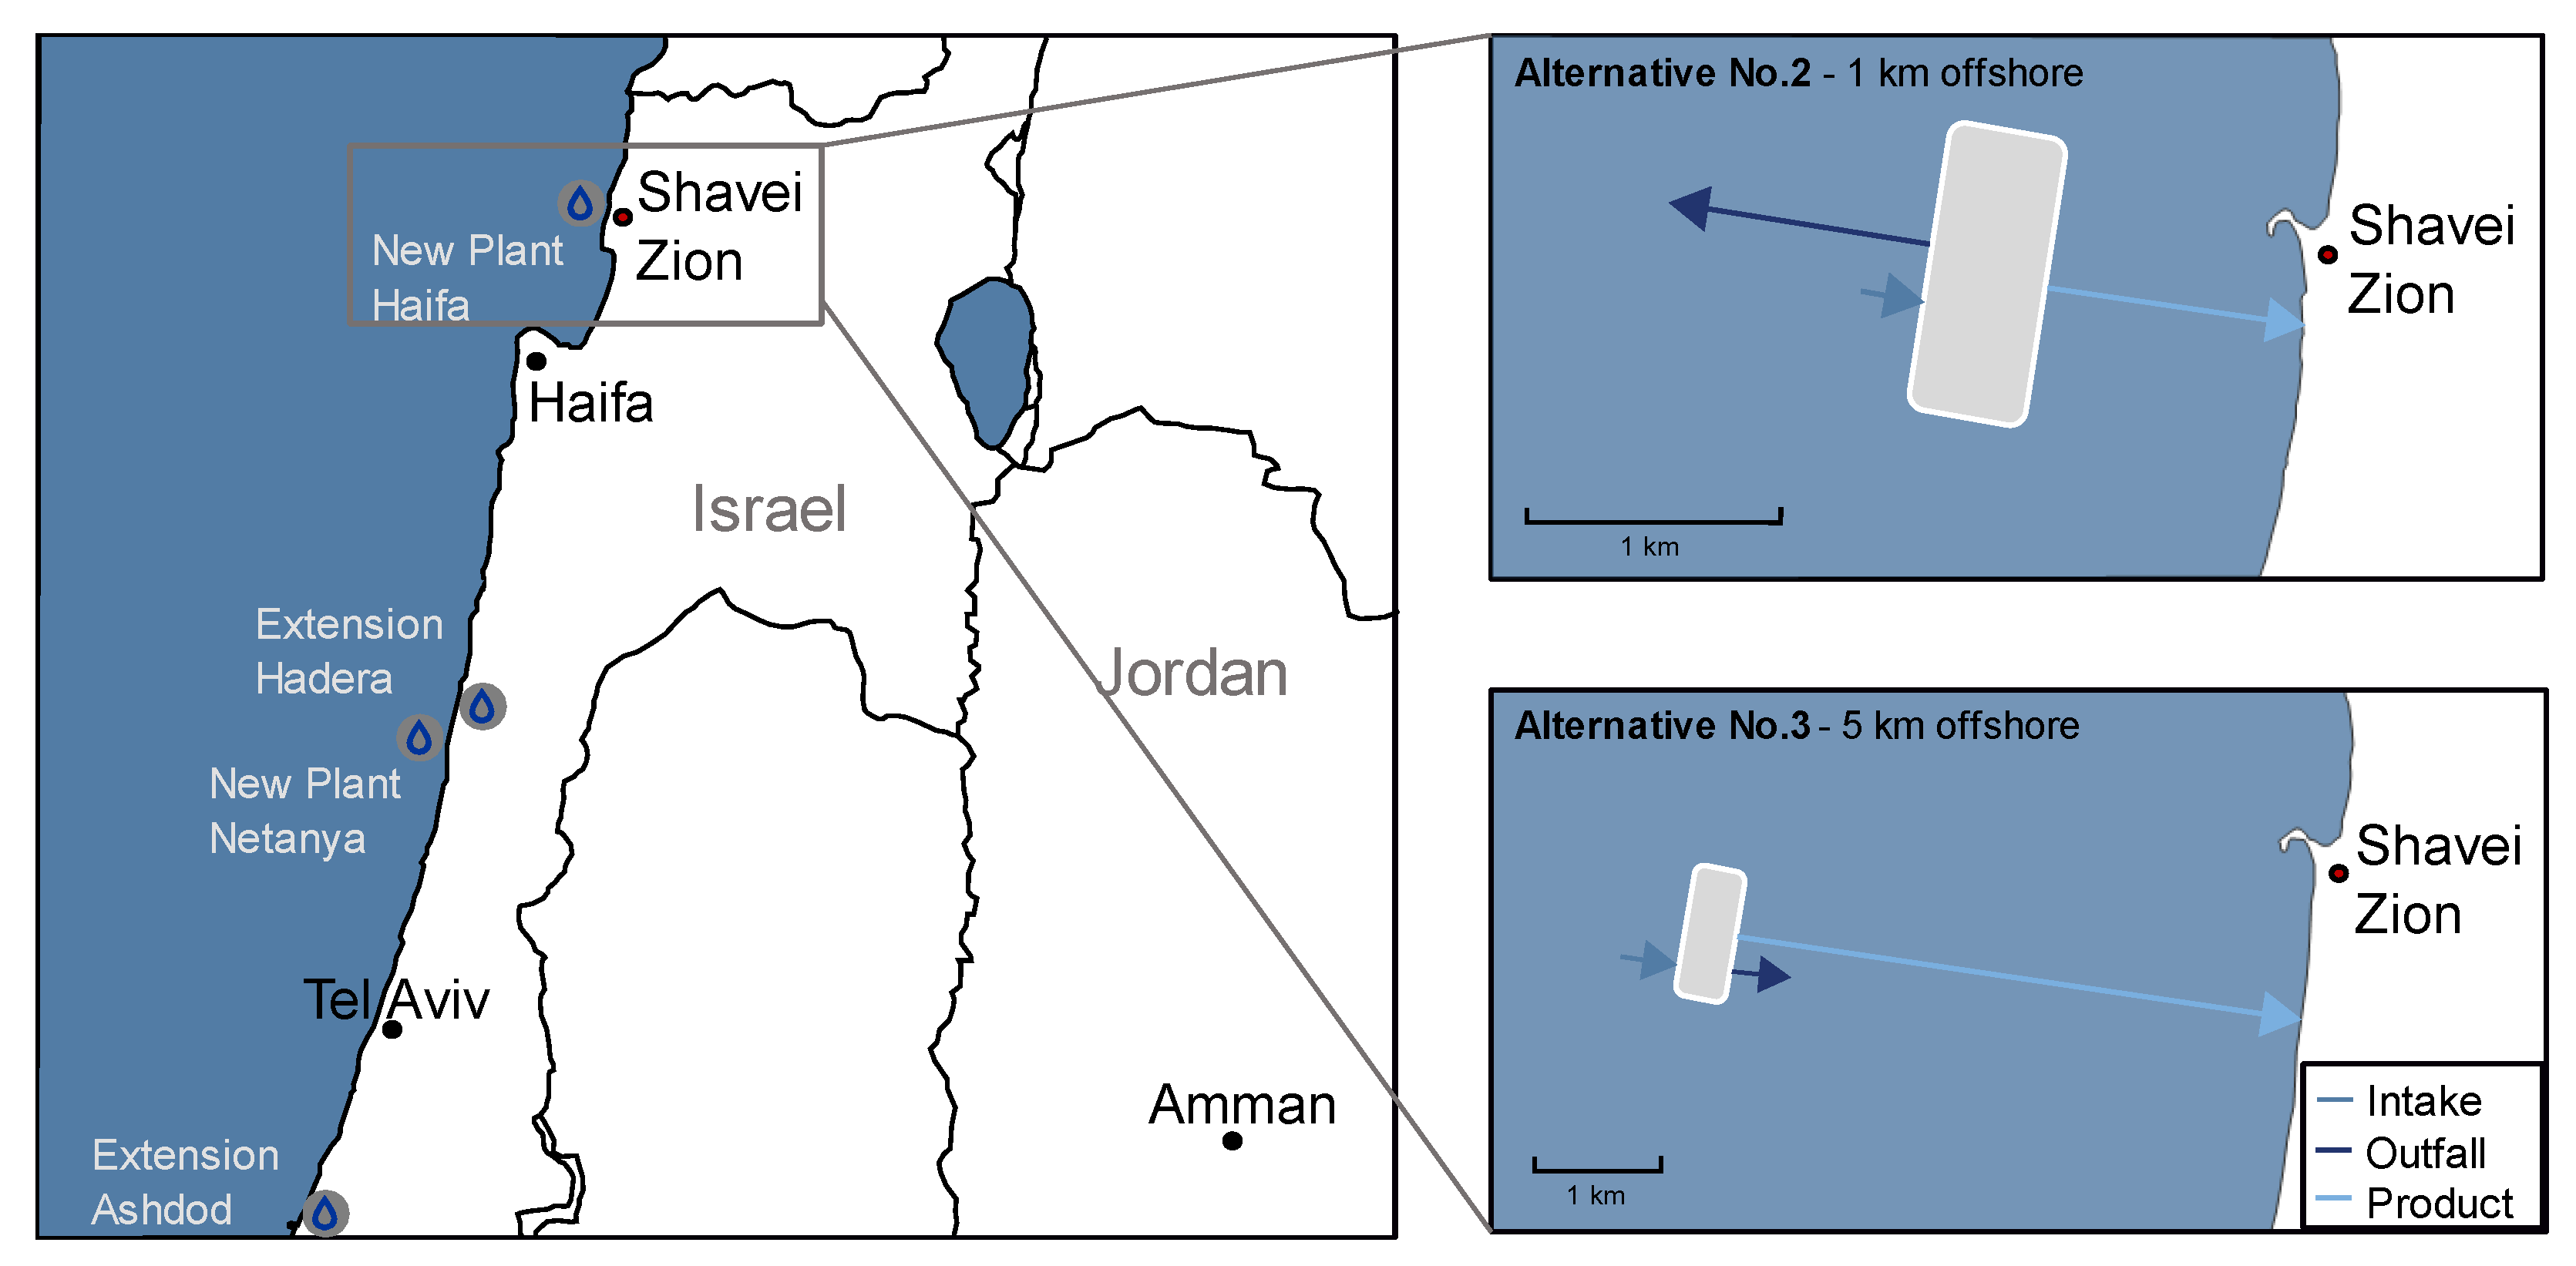
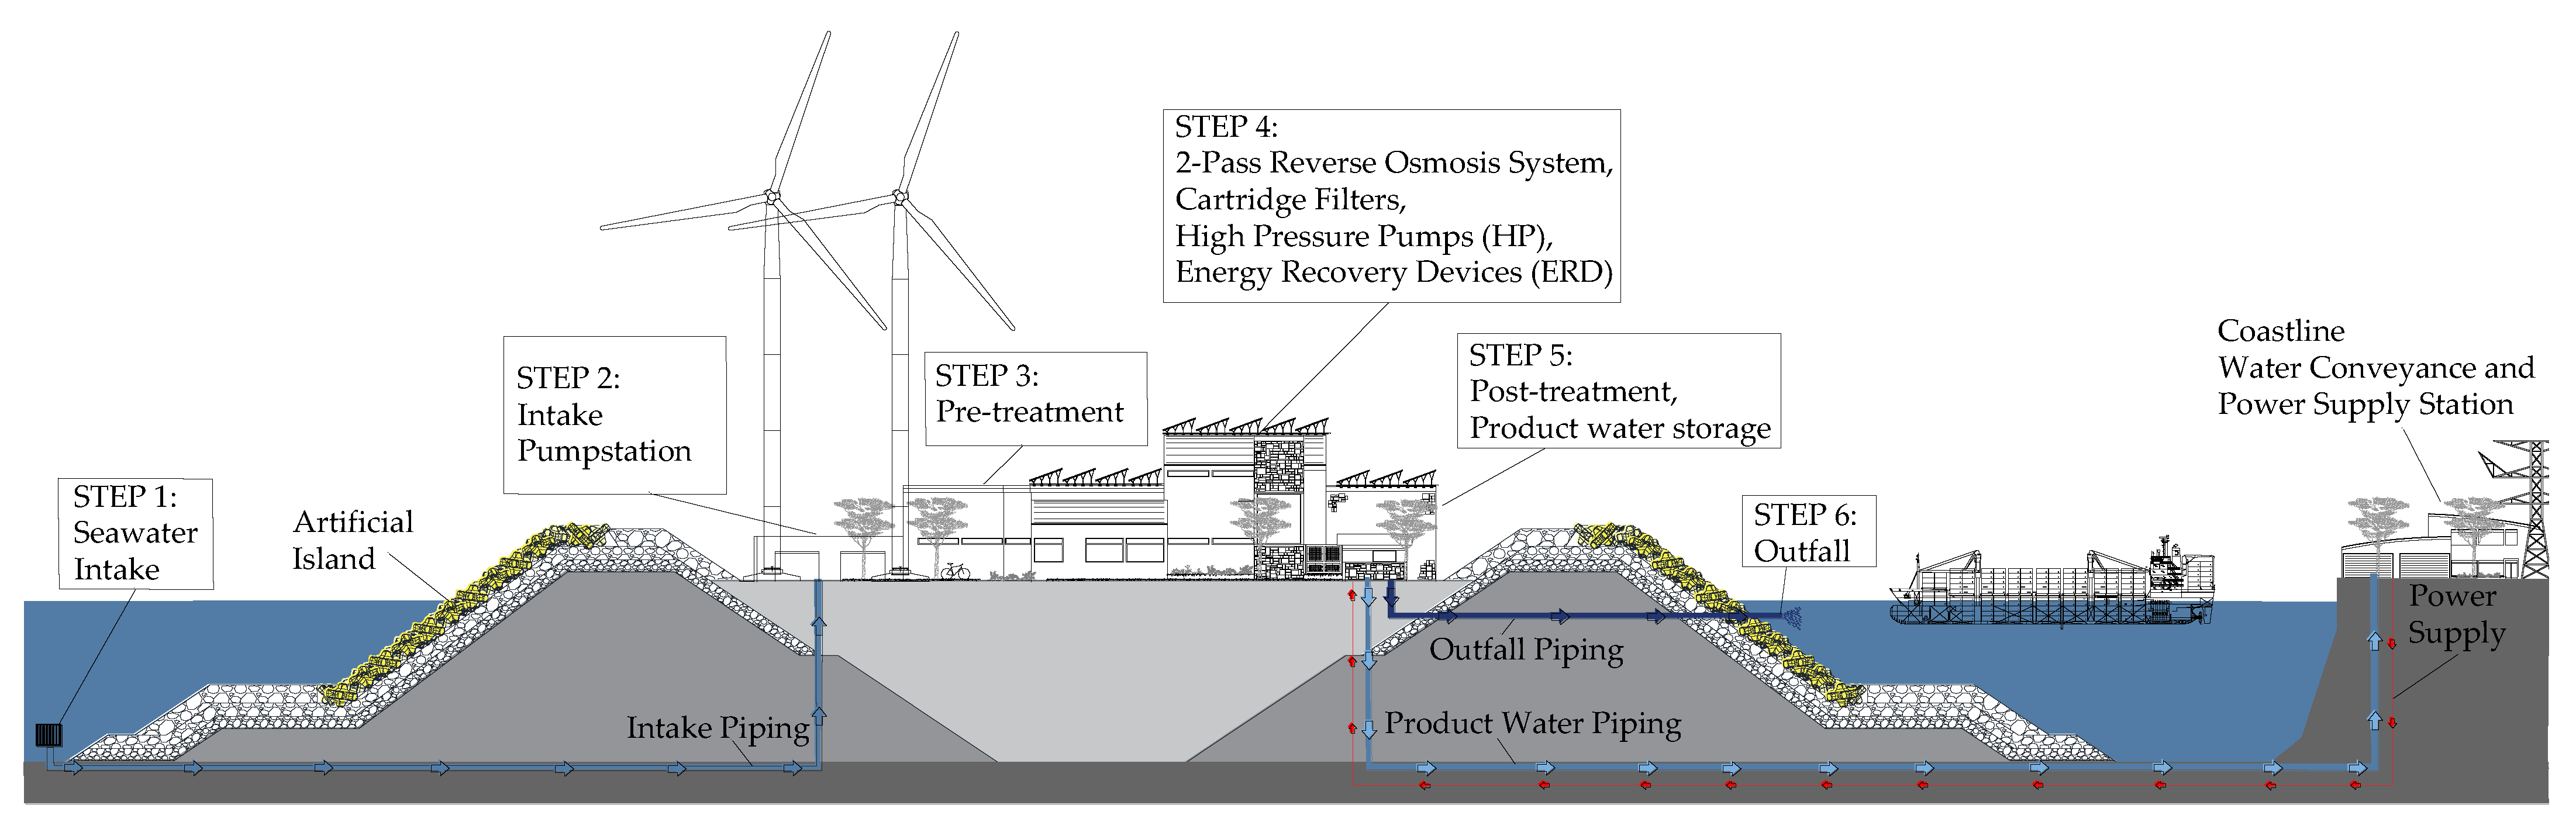
2.1. Case Study and Artificial Island Design
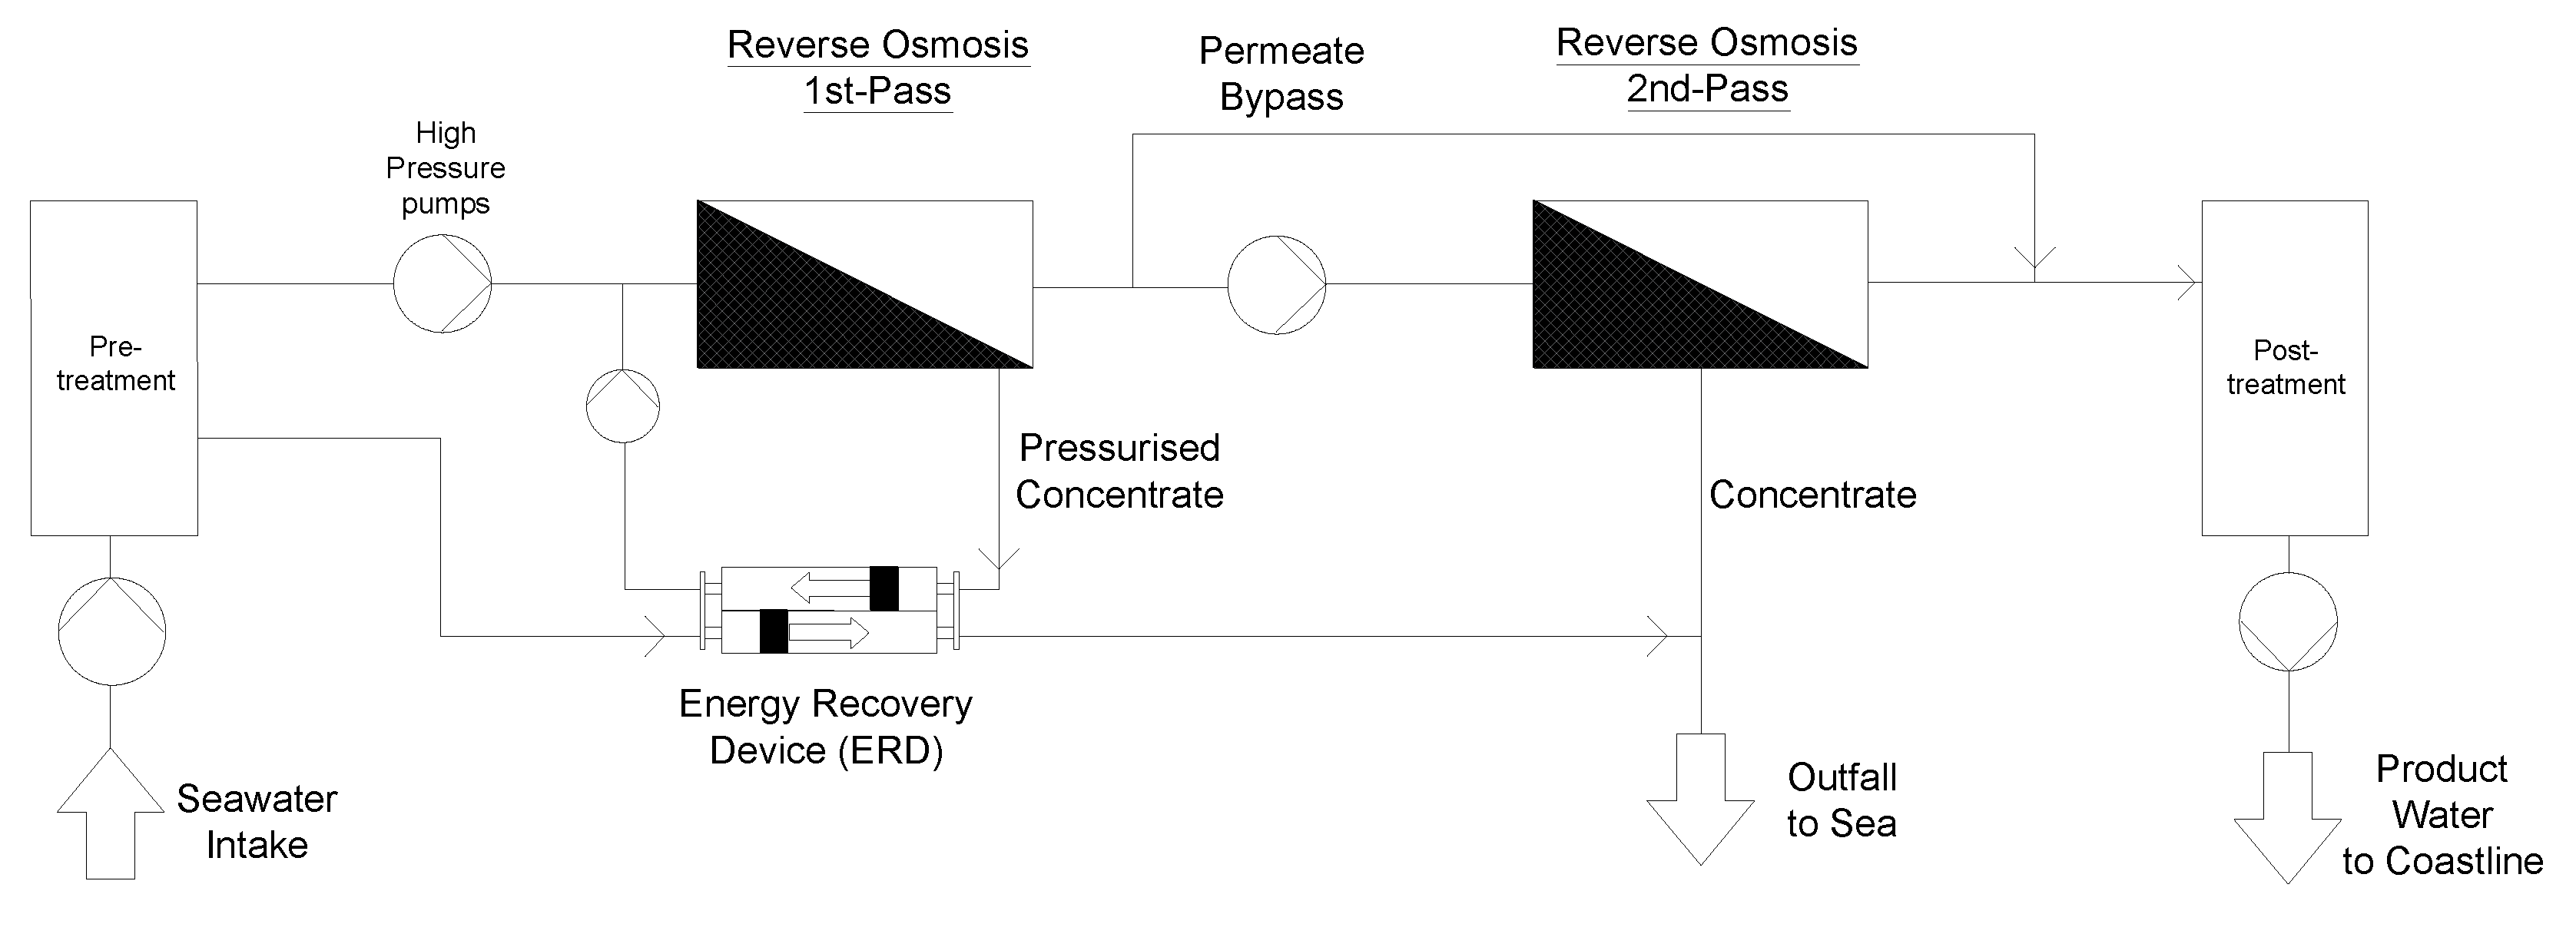
2.2. Desalination Project Context and Design
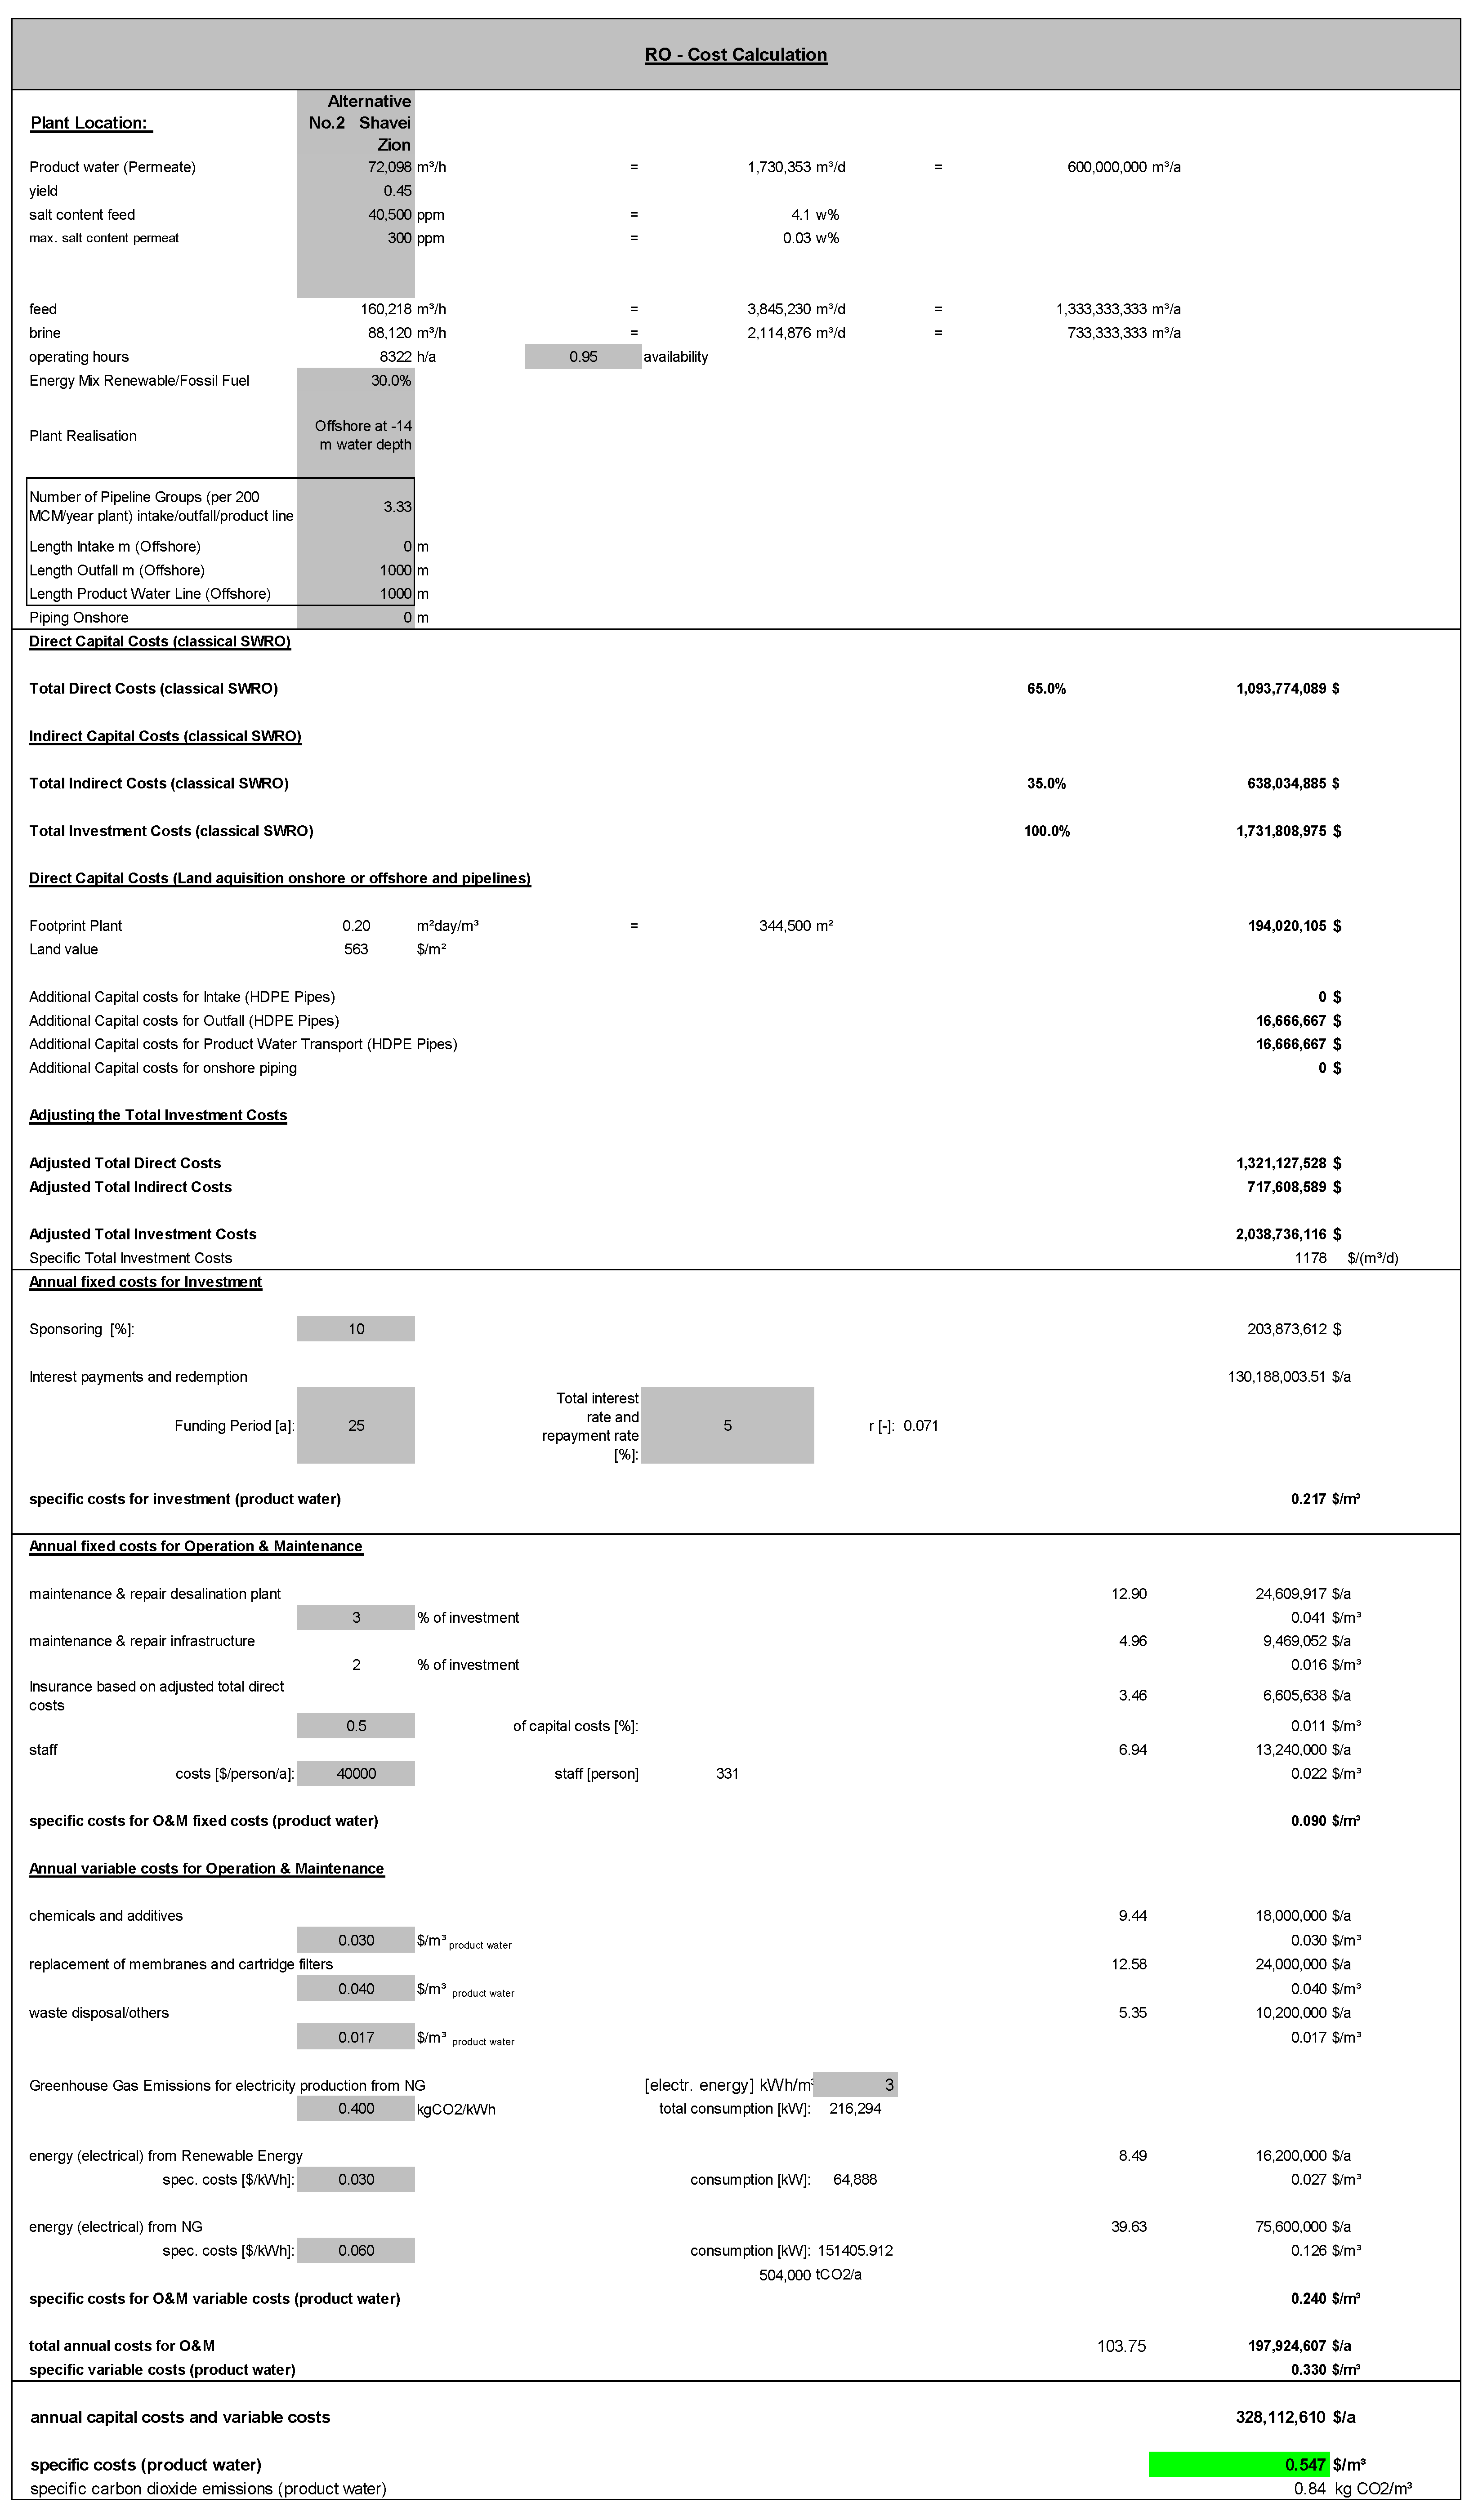
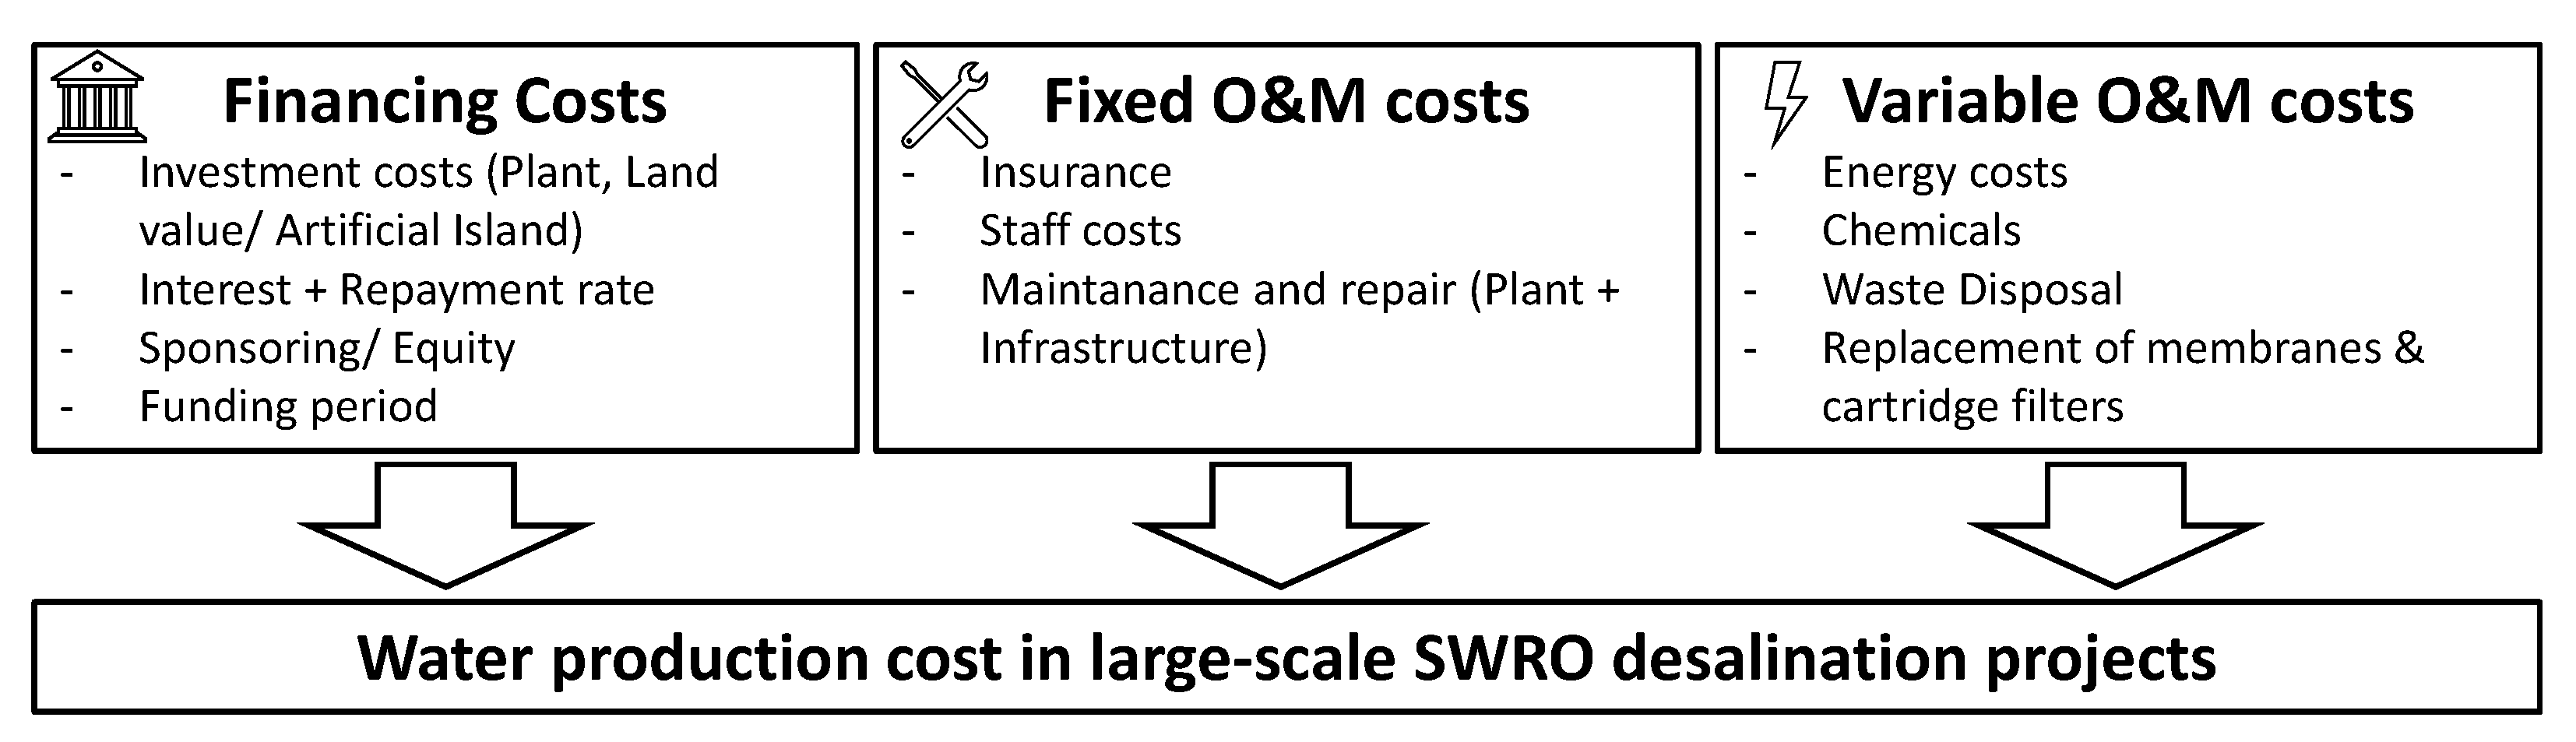
2.3. Method for Water Production Cost Calculation
2.4. Cost Calculation Assumptions for the Desalination Project and Energy Mix
3. Results and Discussion
3.1. Assessment of the Offshore Construction Cost
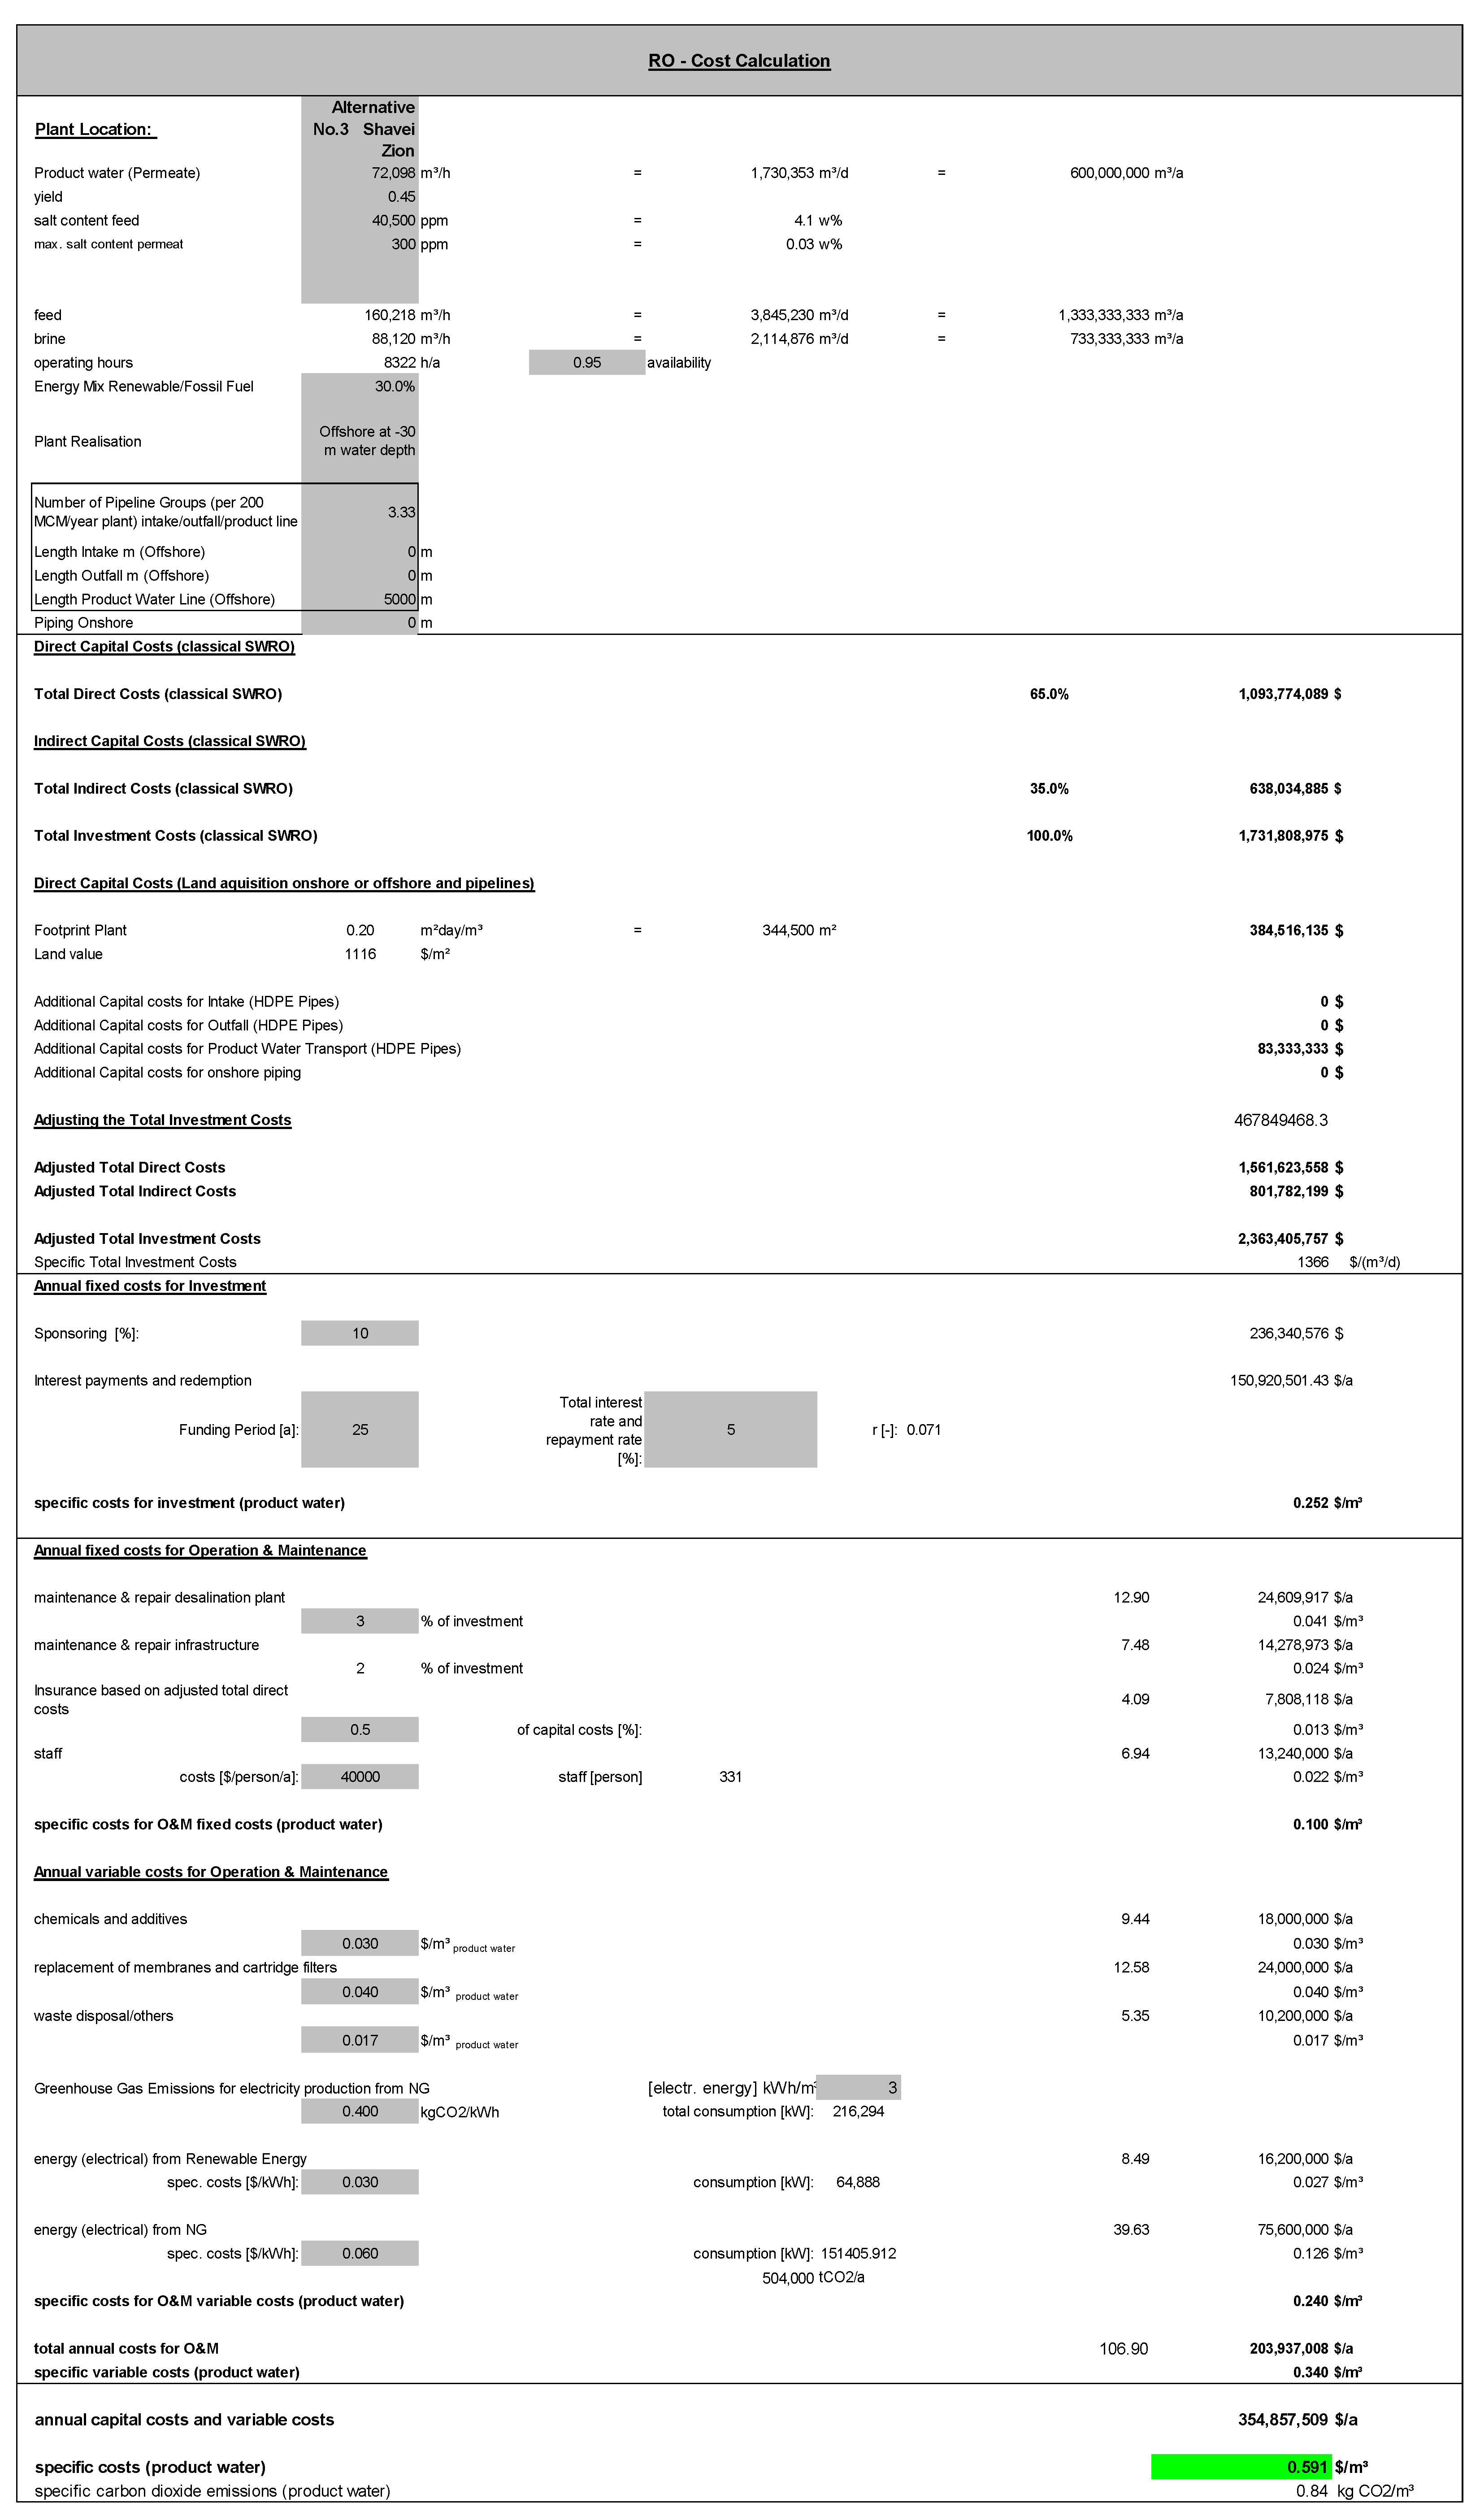
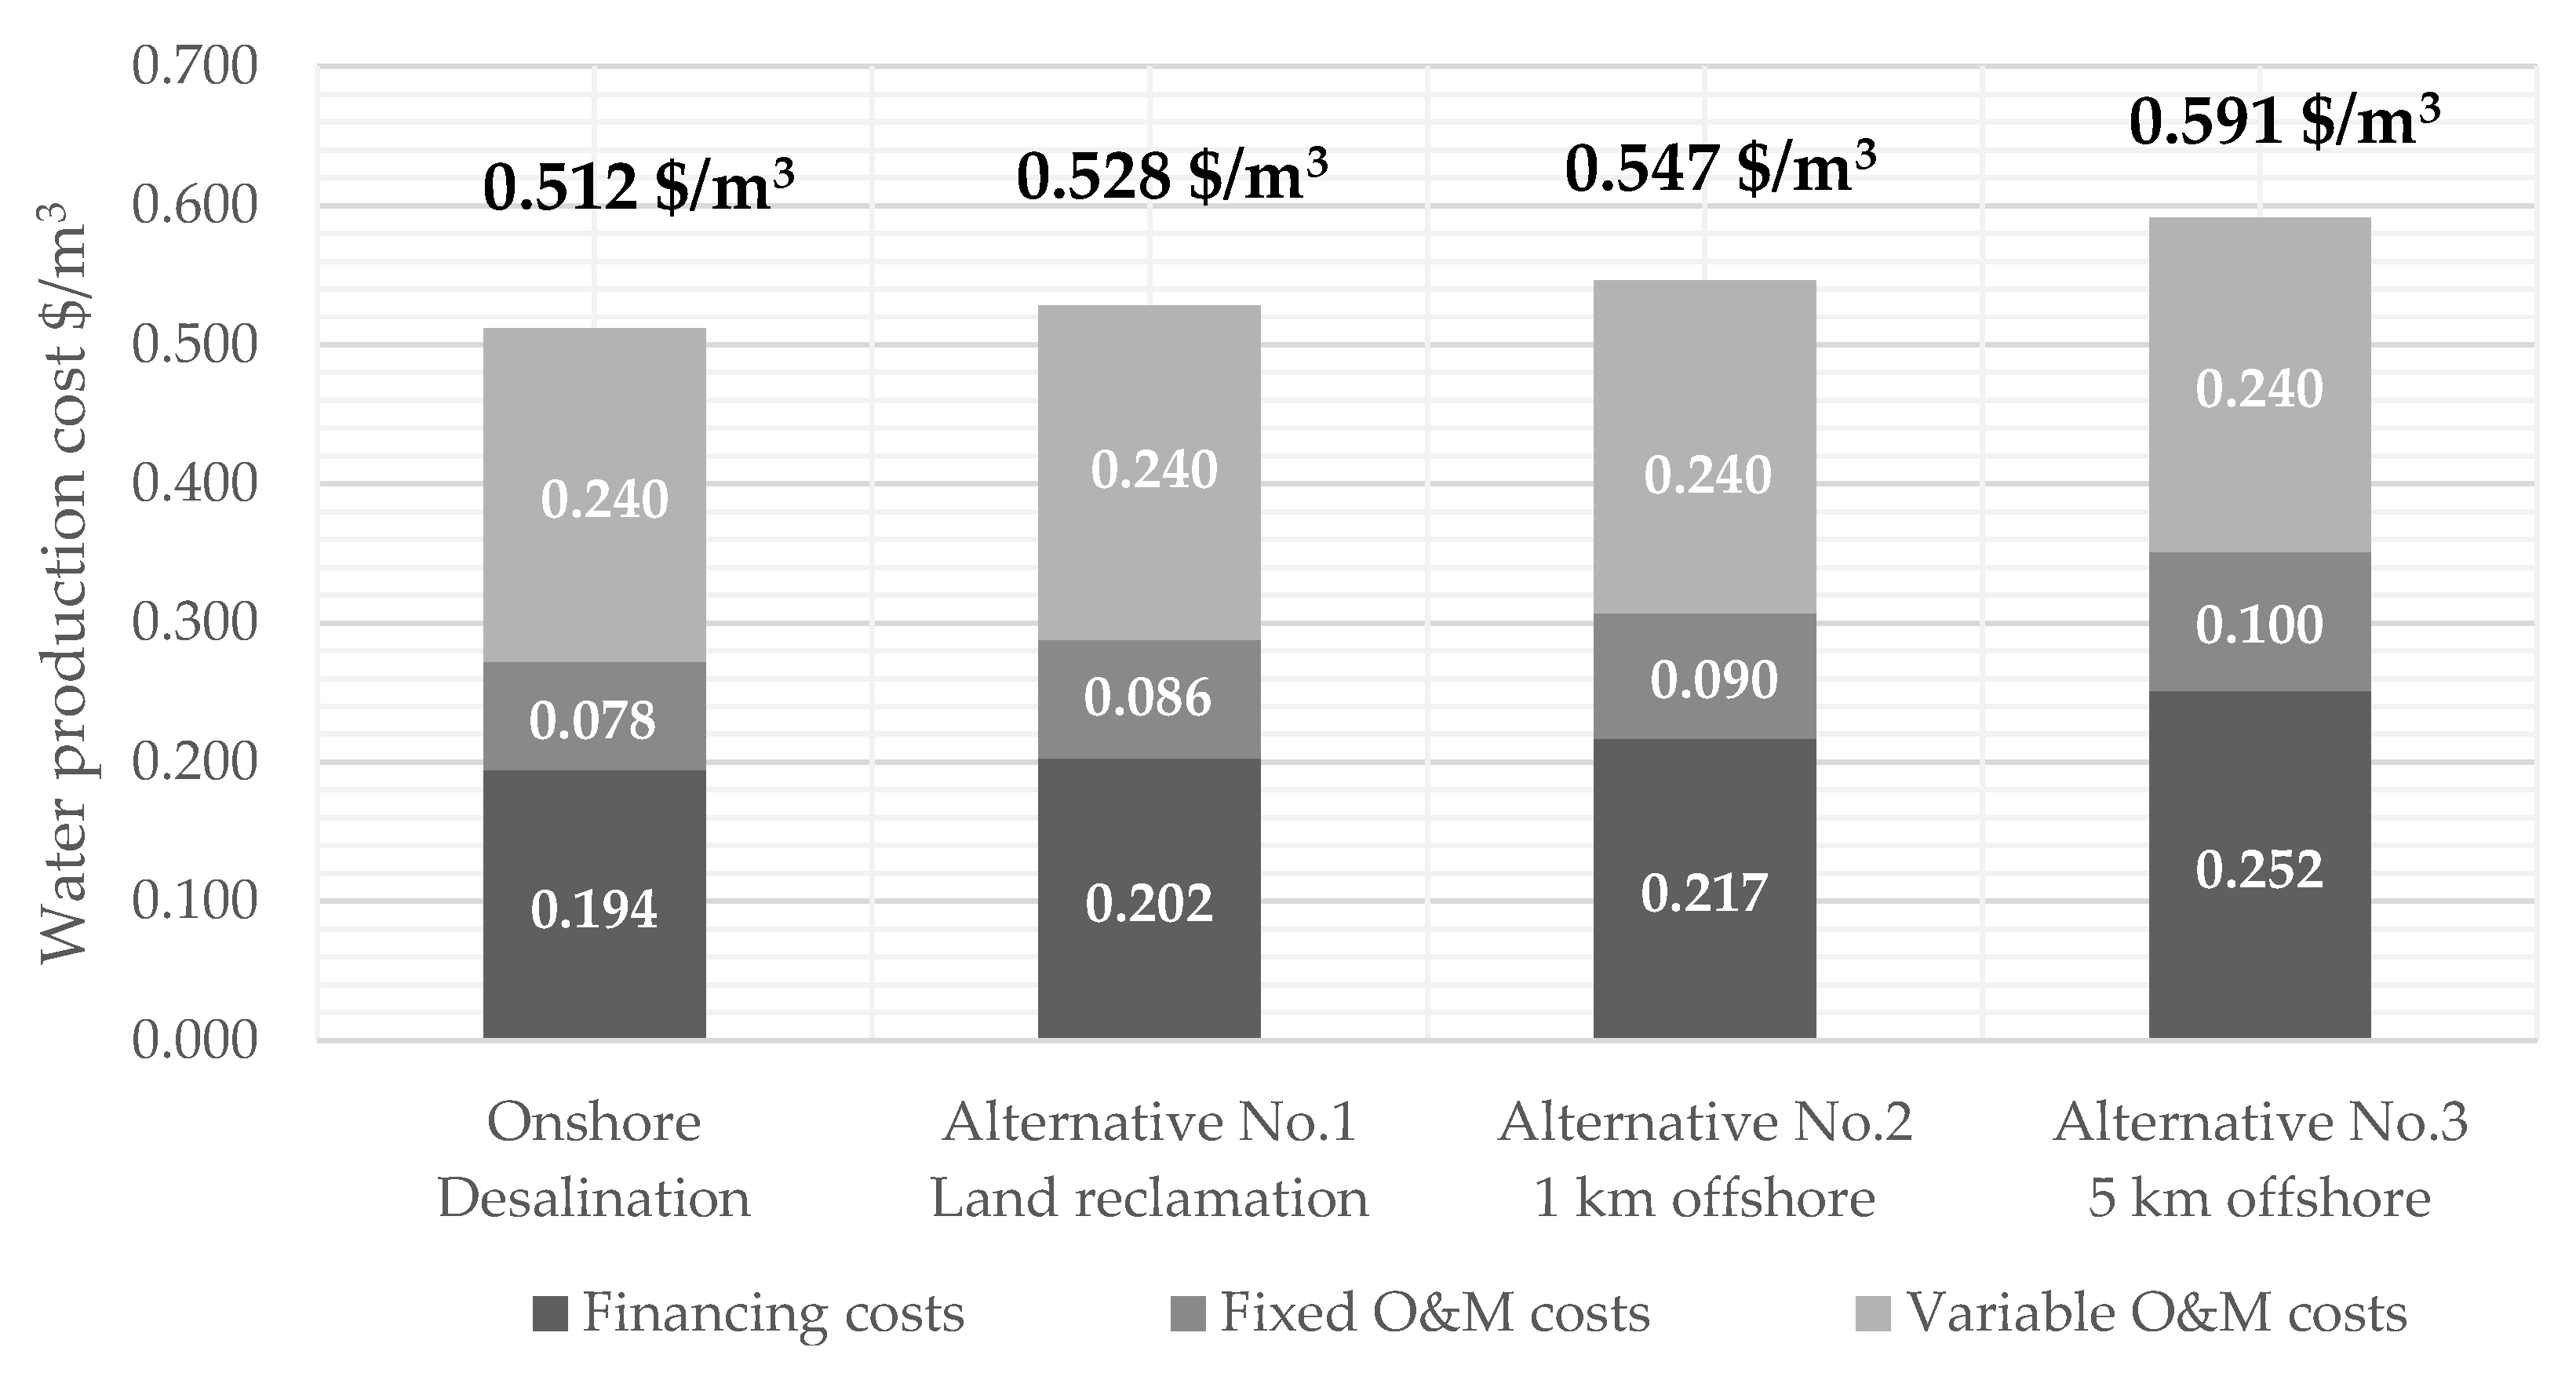
3.2. Assessment of the Water Production Cost of the Offshore Alternatives
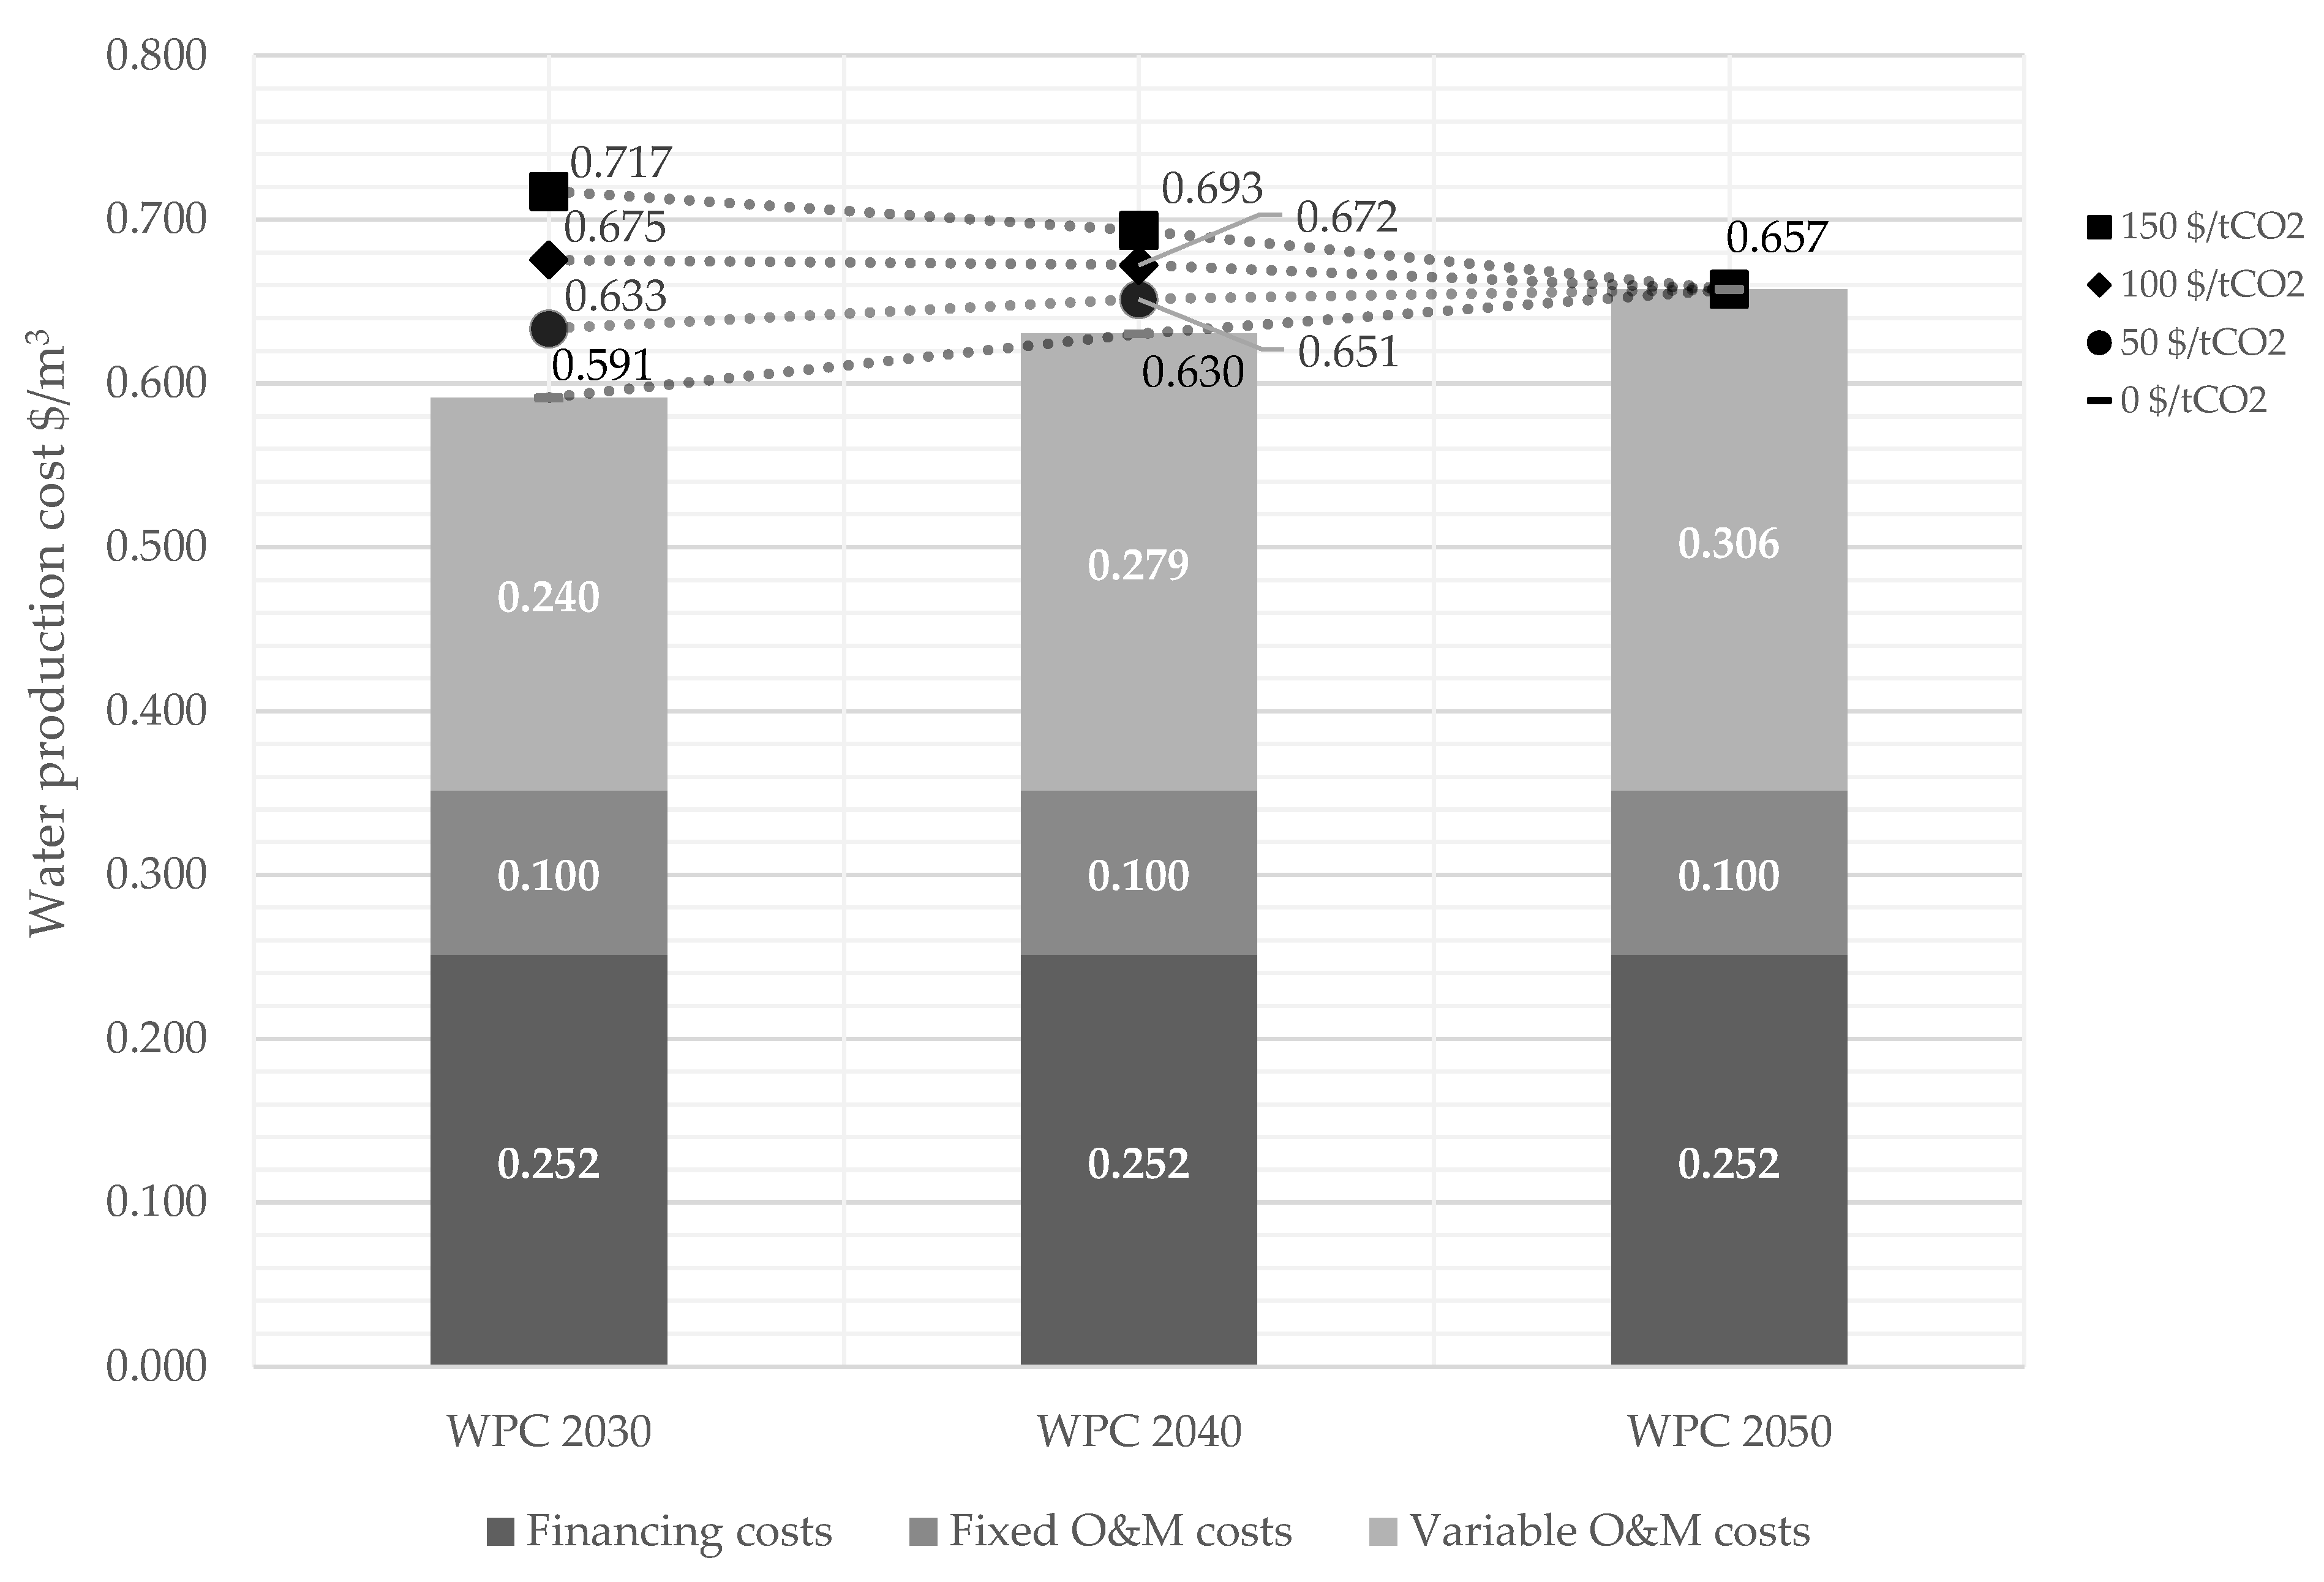
3.3. Effect of a Carbon Tax on the Water Production Cost
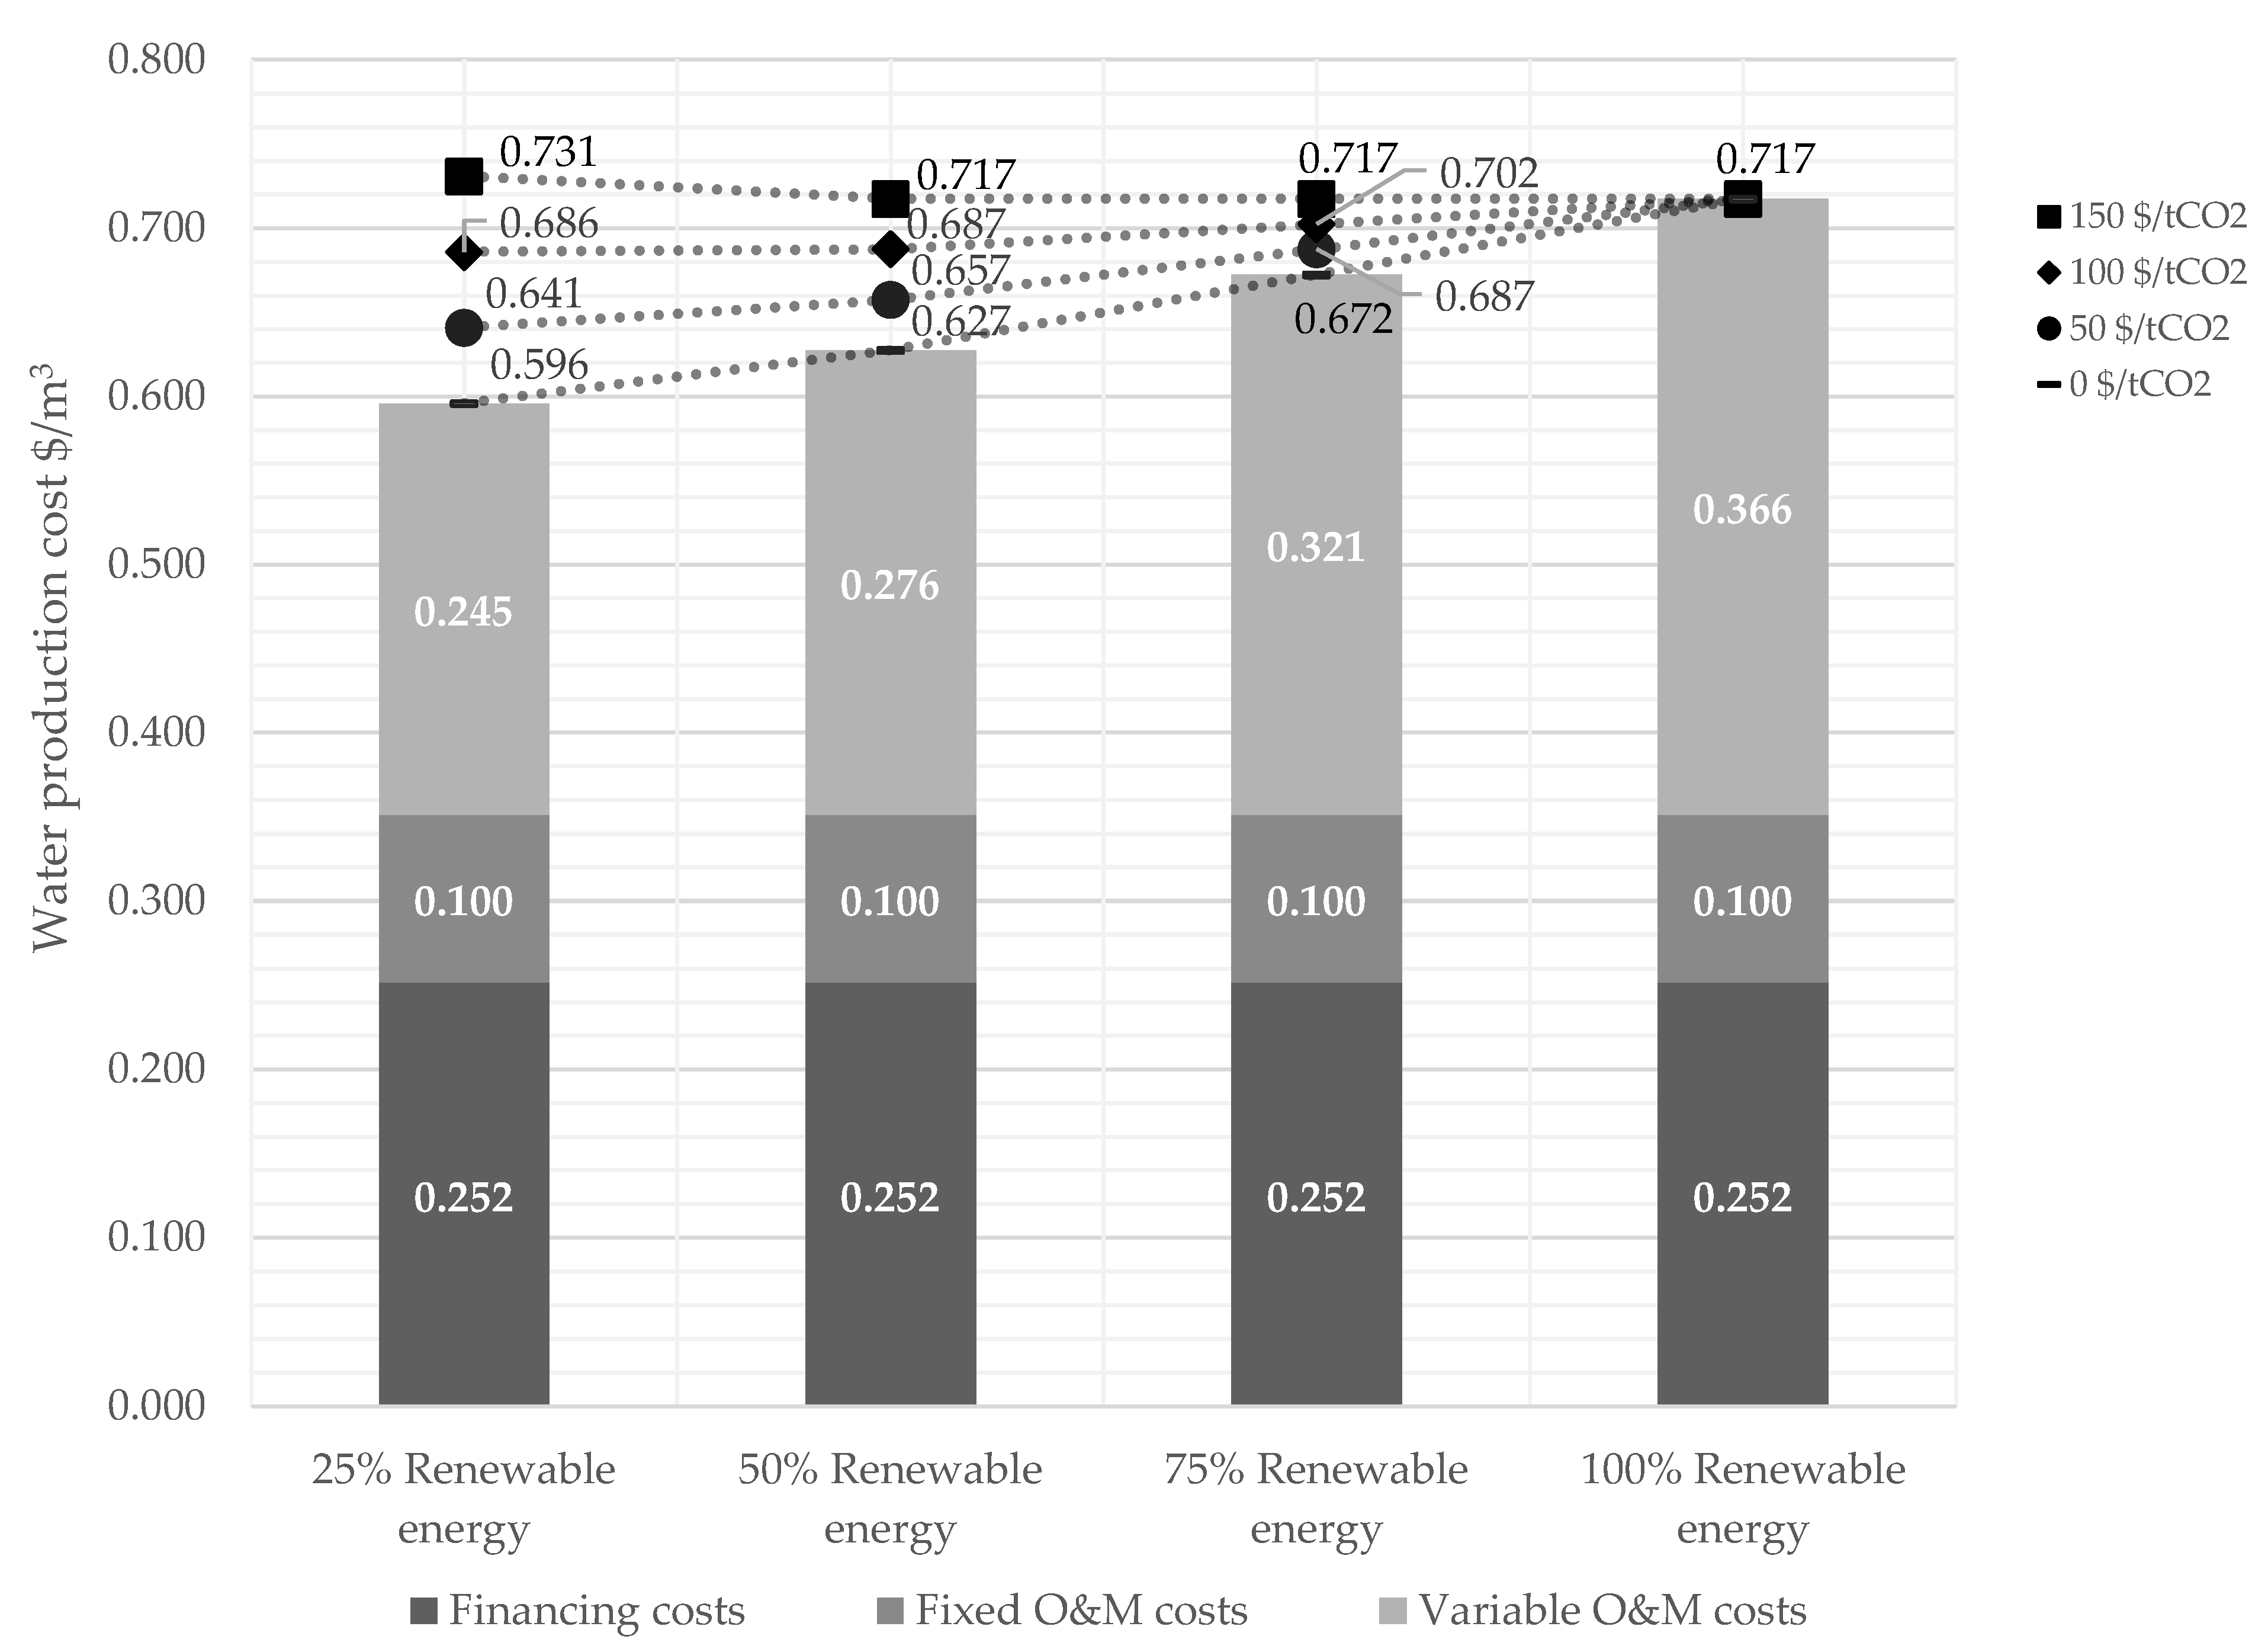
3.4. Determination of Threshold Carbon Tax Level to Provide the Incentive to Couple Desalination with Renewable Energy
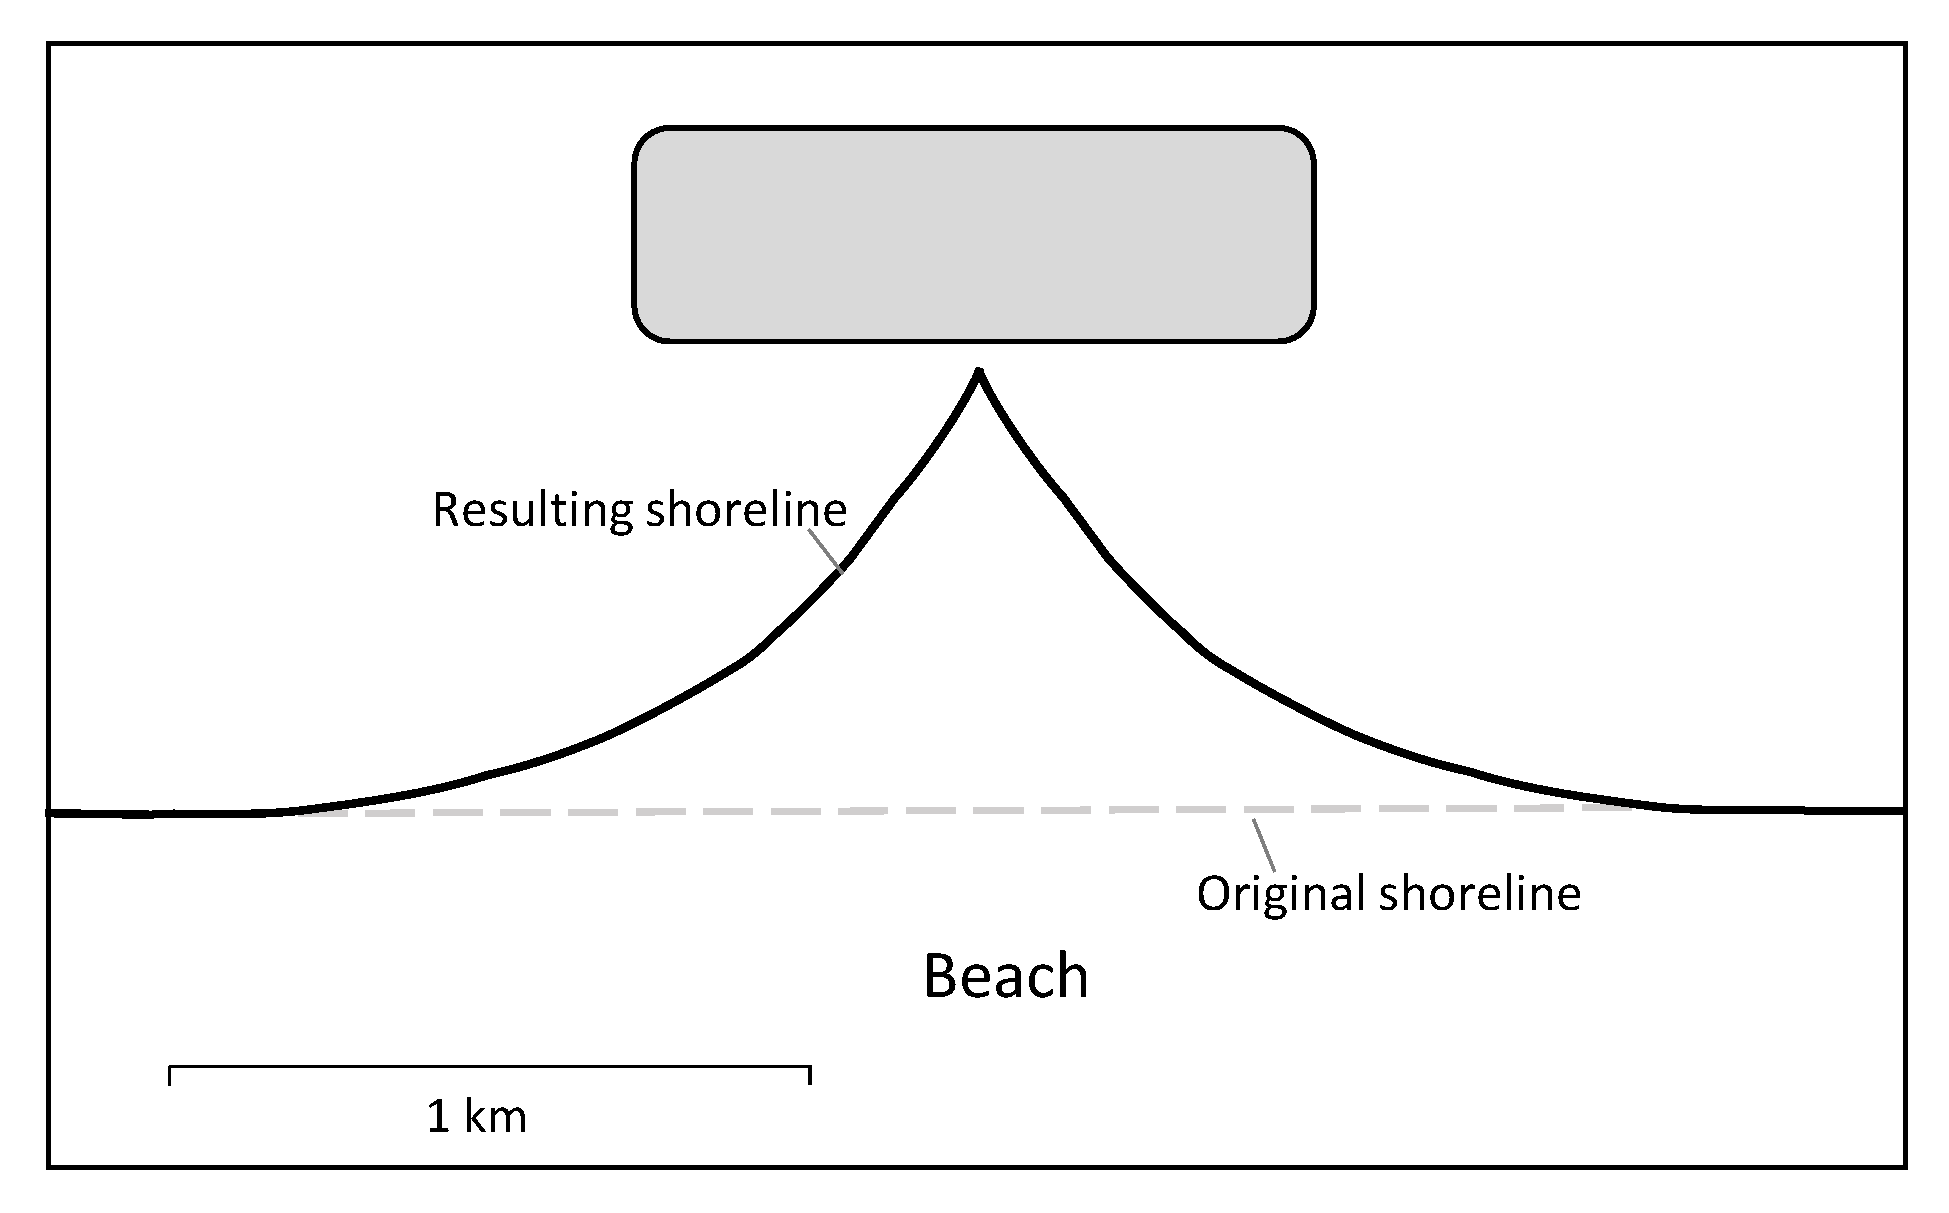
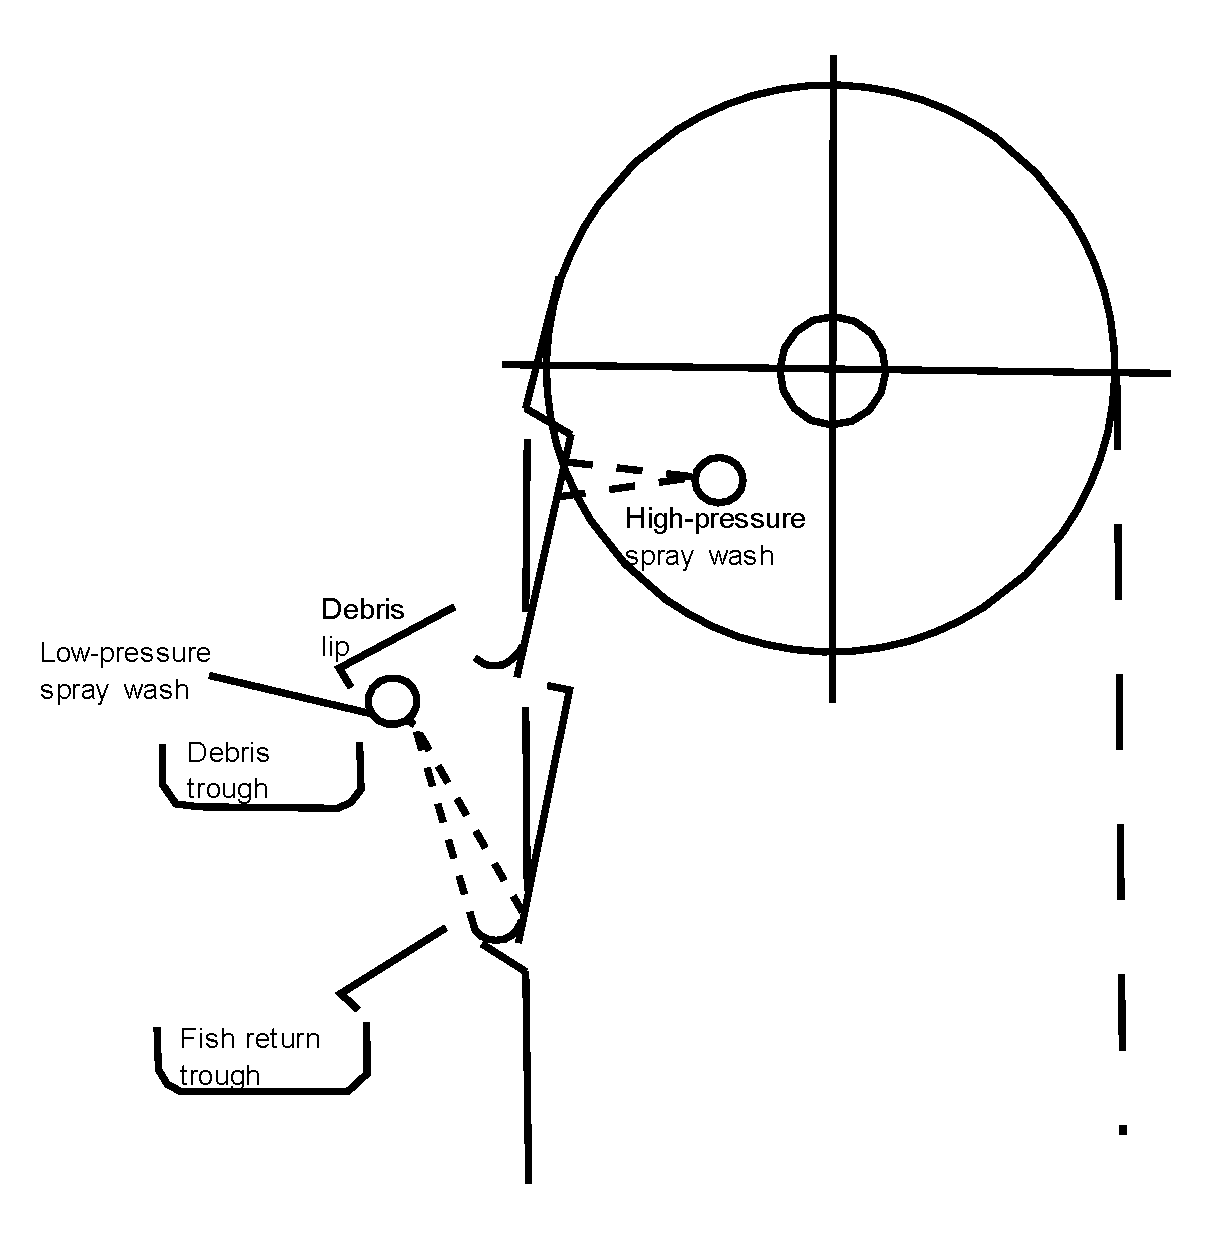
3.5. Identification of Environmental Impact and Mitigation Strategies
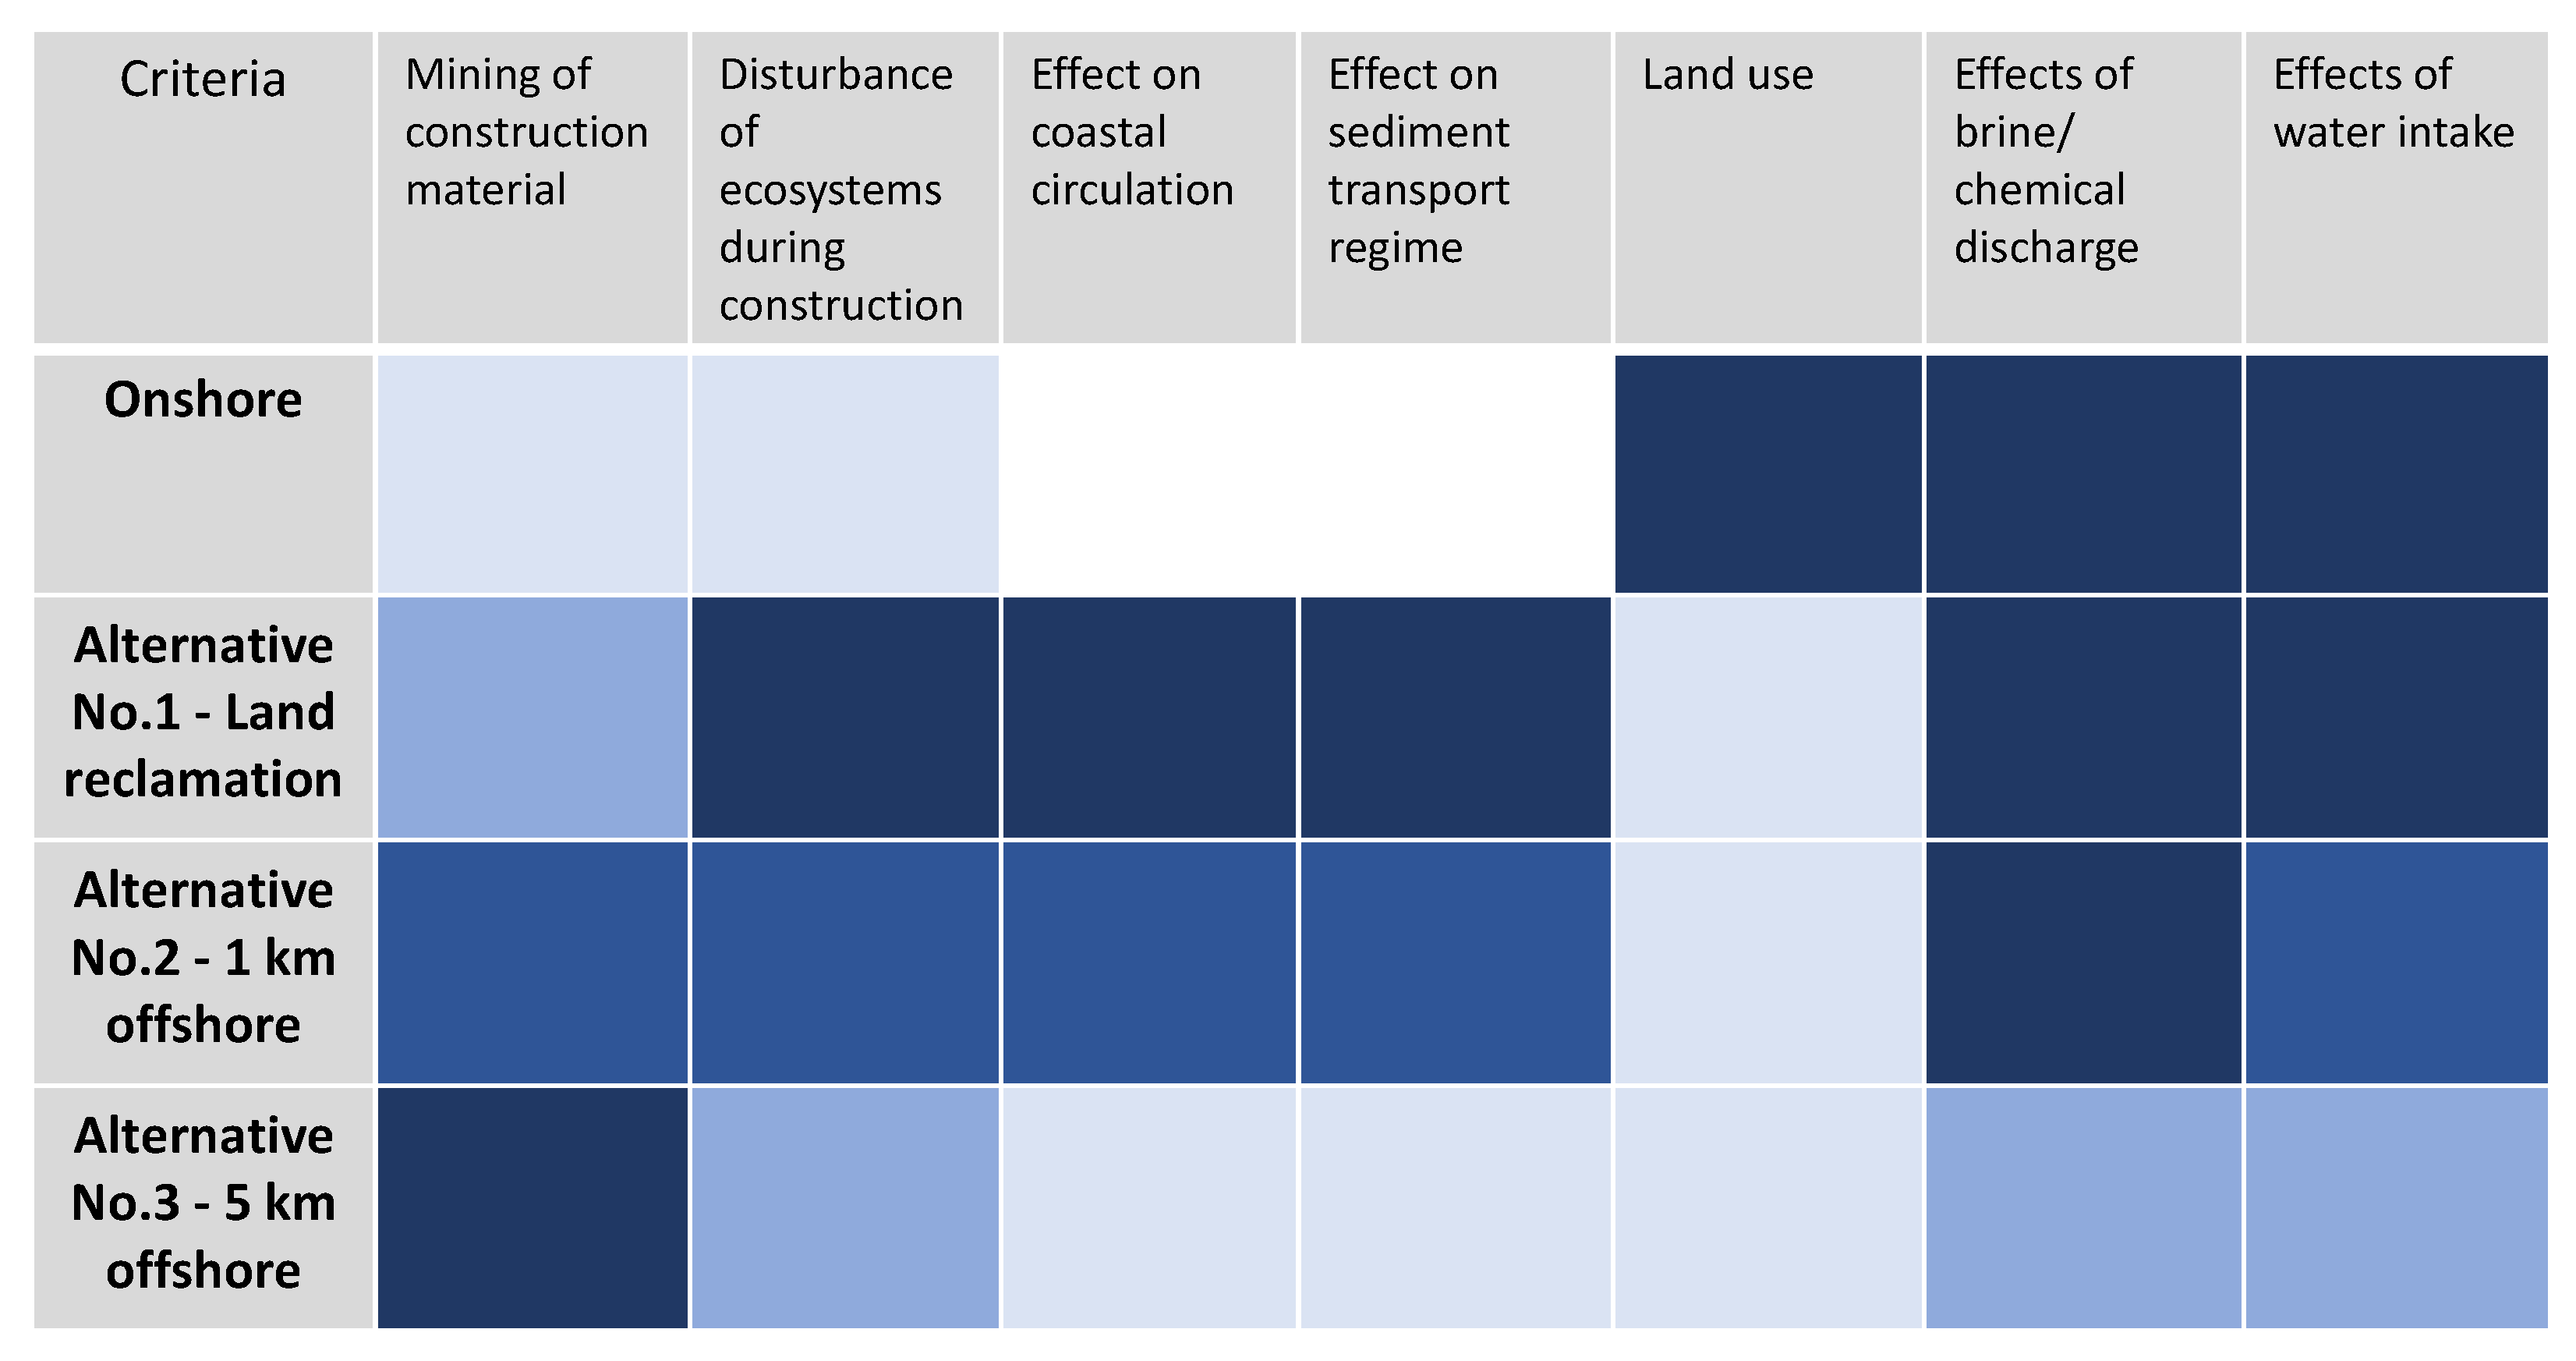
3.6. Qualitative Assessment of the Environmental Impact of the Alternatives
3.7. Limitations of the Study
4. Conclusions
Author Contributions
Funding
Institutional Review Board Statement
Informed Consent Statement
Data Availability Statement
Acknowledgments
Conflicts of Interest
Abbreviations
| BOT | Build-Operate-Transfer |
| CAPEX | Capital expenditures |
| CCPP | Combined Cycle Power Plant |
| CERC | Coastal Engineering Research Center |
| CLI | Concrete Layer Innovation |
| EIA | Environmental Impact Assessment |
| ERD | Energy Recovery Device |
| HP | High pressure pumps |
| i | Interest and repayment rate |
| IPP | Independent Power Producer |
| LCOE | Levelized Cost of Energy |
| MCM/y | Million cubic meters per year |
| Mio. | Million |
| n | Funding period |
| NCEP | National Centers for Environmental Prediction |
| No. | Numbers indicating ordinal numeration |
| NTU | Nephelometric Turbidity Unit |
| OD | Outer diameter |
| O&M | Operation and Maintenance |
| O&Mfix | Fixed operation and maintenance costs |
| O&Mvar | Variable operation and maintenance costs |
| OPEX | Operational expenditures |
| ppm | Parts per million |
| PV | Photovoltaics |
| RO | Reverse Osmosis |
| SDI | Silt Density Index |
| SWRO | Seawater Reverse Osmosis |
| Tm | Mean wave period |
| Ts | Significant wave period |
| UAE | United Arab Emirates |
| USACE | United States Army Corps of Engineers |
| WEC | Wave Energy Converter |
| WPC | Water Production Cost |
Appendix A


Appendix B

| Cost Component | Volume (m3) | Unit Price ($/m3) | Total Cost ($) |
|---|---|---|---|
| Reclamation fill | 3,393,600 | 10 | 33,930,600 |
| Core fill | 1,074,222 | 10 | 10,742,220 |
| Filter layer (0.4–2 ton) | 263,391 | 20 | 5,267,820 |
| Filter layer (4–6 ton) | 202,652 | 20 | 4,053,040 |
| Armour (18 m3 Accropode) | 120,087 | 120 | 14,410,440 |
| Toe (4–6 ton) | 50,479 | 35 | 1,766,765 |
| Back Armour (10–12 ton) | 74,094 | 40 | 2,963,760 |
| Direct investment cost | - | - | 73,134,645 |
| Indirect investment cost (Engineering, Permitting, Contingency) | 35 | % | 25,597,126 |
| Total cost | 98,731,771 |
| Cost Item | Volume (m3) | Unit Price ($/m3) | Total Cost ($) |
|---|---|---|---|
| Reclamation fill | 5,421,158 | 15 | 81,317,370 |
| Core fill | 2,705,163 | 15 | 40,577,445 |
| Filter layer (0.4–2 ton) | 536,505 | 35s | 18,777,675 |
| Filter layer (4–6 ton) | 382,045 | 35 | 13,371,575 |
| Armour (18 m3 Accropode) | 229,489 | 120 | 27,538,680 |
| Toe (4–6 ton) | 65,696 | 35 | 2,299,360 |
| Back Armour (10–12 ton) | 202,760 | 50 | 10,138,000 |
| Direct investment cost | - | - | 194,020,105 |
| Indirect investment cost (Engineering, Permitting, Contingency) | 35 | % | 67,907,037 |
| Total cost | 261,927,142 |
References
- Schewe, J.; Heinke, J.; Gerten, D.; Haddeland, I.; Arnell, N.W.; Clark, D.B.; Dankers, R.; Eisner, S.; Fekete, B.M.; Colón-González, F.J.; et al. Multimodel assessment of water scarcity under climate change. Proc. Natl. Acad. Sci. USA 2014, 111, 3245–3250. [Google Scholar] [CrossRef] [PubMed] [Green Version]
- Rusteberg, B.; Bensabat, J.; de Bourgoing, P.; Al-Karablieh, E.; Sadah, M.-A.; Tamimi, A. Future freshwater deficits in Palestine and Jordan. In The SALAM Initiative: Transboundary Strategies for the Resolution of the Water Deficit Problem in the Middle East; de Bourgoing, P., Nussbaum, P., Rusteberg, B., Sauter, M., Eds.; 2022; ISBN 978-3-943647-10-5. (In Press). Available online: https://www.uni-goettingen.de/en/seminar/642396.html (accessed on 9 March 2022).
- The SALAM Initiative: Transboundary Strategies for the Resolution of the Water Deficit Problem in the Middle East. Available online: http://www.iwrm-salam.de/ (accessed on 17 January 2022).
- Janowitz, D.; Bensabat, J.; Yüce, S. On- and Offshore Solutions for Large-Scale Seawater Desalination at the Israeli Coast and Gaza. In The SALAM Initiative: Transboundary Strategies for the Resolution of the Water Deficit Problem in the Middle East; de Bourgoing, P., Nussbaum, P., Rusteberg, B., Sauter, M., Eds.; 2022; ISBN 978-3-943647-10-5. (In Press). Available online: https://www.uni-goettingen.de/en/seminar/642396.html (accessed on 9 March 2022).
- Rusteberg, B.; Bensabat, J.; de Bourgoing, P.; Zarzar, G.; Al-Karablieh, E.; Sadah, M.-A. Alternative regional water production and transfer strategies. In The SALAM Initiative: Transboundary Strategies for the Resolution of the Water Deficit Problem in the Middle East; de Bourgoing, P., Nussbaum, P., Rusteberg, B., Sauter, M., Eds.; 2022; ISBN 978-3-943647-10-5. (In Press). Available online: https://www.uni-goettingen.de/en/seminar/642396.html (accessed on 9 March 2022).
- Fritzmann, C.; Löwenberg, J.; Wintgens, T.; Melin, T. State-of-the-art of reverse osmosis desalination. Desalination 2007, 216, 1–76. [Google Scholar] [CrossRef]
- Qasim, M.; Badrelzaman, M.; Darwish, N.N.; Darwish, N.A.; Hilal, N. Reverse osmosis desalination: A state-of-the-art review 2019, 459, 59–104. Desalination 2019, 459, 59–104. [Google Scholar] [CrossRef] [Green Version]
- Elimelech, M.; Phillip, W.A. The future of seawater desalination: Energy, technology, and the environment. Science 2011, 333, 712–717. [Google Scholar] [CrossRef] [PubMed]
- Zarzo, D.; Prats, D. Desalination and energy consumption. What can we expect in the near future? Desalination 2018, 427, 1–9. [Google Scholar] [CrossRef]
- Karabelas, A.J.; Koutsou, C.P.; Kostoglou, M.; Sioutopoulos, D.C. Analysis of specific energy consumption in reverse osmosis desalination processes. Desalination 2018, 431, 15–21. [Google Scholar] [CrossRef]
- Tal, A. Addressing Desalination’s Carbon Footprint: The Israeli Experience. Water 2018, 10, 197. [Google Scholar] [CrossRef] [Green Version]
- Surkes, S. Israel to Impose Carbon Tax, Starting with Fossil Fuels. Available online: https://www.timesofisrael.com/israel-to-impose-carbon-tax-starting-with-fossil-fuels/ (accessed on 7 December 2021).
- Feria-Díaz, J.J.; Correa-Mahecha, F.; López-Méndez, M.C.; Rodríguez-Miranda, J.P.; Barrera-Rojas, J. Recent Desalination Technologies by Hybridization and Integration with Reverse Osmosis: A Review. Water 2021, 13, 1369. [Google Scholar] [CrossRef]
- Lattemann, S.; Höpner, T. Environmental impact and impact assessment of seawater desalination. Desalination 2008, 220, 1–15. [Google Scholar] [CrossRef]
- Tom Freyberg. Sorek Stands Tall. Available online: https://www.waterworld.com/international/potable-water/article/16201752/sorek-stands-tall (accessed on 10 January 2022).
- Voutchkov, N. Desalination Project Cost Estimating and Management; CRC Press: Boca Raton, FL, USA, 2019; ISBN 978-0-8153-7414-5. [Google Scholar]
- Alfasi, N. Can Planning Protect the Public Interest? Geogr. Res. Forum 2009, 29, 83–102. [Google Scholar]
- Surkes, S. Panel Approves Sixth Desalination Plant to Sate Western Galilee. Available online: https://www.timesofisrael.com/panel-approves-sixth-desalination-plant-to-sate-western-galilee/#gs.f6oh1s (accessed on 6 December 2021).
- Kolman, R. New Land in the Water: Economically and Socially, Land Reclamation Pays. Terra Aqua 2012, 128, 3–8. [Google Scholar]
- Rik Mirovsky. Canada’s Beaverhall Buys TEL Aviv Nofei Yam Lot. Available online: https://www.jpost.com/business-and-innovation/real-estate/article-694607 (accessed on 5 February 2022).
- Broom, D. Denmark Approves Artificial Island to Site 10 GW Offshore Wind Hub. Available online: https://energypost.eu/denmark-approves-artificial-island-to-site-10gw-offshore-wind-hub/ (accessed on 6 December 2021).
- Shelf Gdalia, Z.Y. Conference on Shore Extensions and Artifical Islands off the Coast of Israel Haifa Israel: Samuel Neaman Institute. 1994. Available online: https://www.neaman.org.il/EN/Conference-shore-extensions-artifical-islands-off-coast-Israel (accessed on 10 January 2022).
- Zimmels, Y.; Boas, A. Construction of a pile-based offshore airport. Ocean Eng. 2002, 30, 127–150. [Google Scholar] [CrossRef]
- Assif, S.; Portman, M.; Cohen, Y.; Adler, E.; Porat, I.; Teff-Seker, Y.; Spier, V.; Perlman, A.; Katz, B.; Dror, T.; et al. The Israel Marine Plan. Technion Israel Institute of Technology: Swatow, China, 2015. [Google Scholar]
- Serna, Á.; Tadeo, F. Offshore Desalination Using Wave Energy. Adv. Mech. Eng. 2013, 5, 539857. [Google Scholar] [CrossRef]
- Kokubun, T. Shift to Floating Seawater Desalination: In Order to Reduce Environmental Issues and Supply Timely to Meet Demand. Available online: https://www.oecd.org/sti/ind/oecd-shipbuilding-workshop-kokubun.pdf (accessed on 9 February 2022).
- Kress, N.; Gertner, Y.; Shoham-Frider, E. Seawater quality at the brine discharge site from two mega size seawater reverse osmosis desalination plants in Israel (Eastern Mediterranean). Water Res. 2020, 171, 115402. [Google Scholar] [CrossRef] [PubMed]
- Navionics. Nautical Charts Shavei Zion, Israel. Available online: https://www.navionics.com/deu/ (accessed on 7 December 2021).
- Construction Industry Research and Information Association; Civieltechnisch Centrum Uitvoering Research en Regelgeving (The Netherlands). The Rock Manual: The Use of Rock in Hydraulic Engineering, 2nd ed.; C683: London, UK, 2007. [Google Scholar]
- National Centers for Environmental Prediction. Climate Forecast System Reanalysis (CFSR). Available online: https://www.ncei.noaa.gov/products/weather-climate-models/climate-forecast-system (accessed on 9 February 2022).
- United States. Army. Corps of Engineers. Shore Protection Manual. Available online: https://usace.contentdm.oclc.org/digital/collection/p16021coll11/id/1934/ (accessed on 10 January 2022).
- Rosen, D.S.; Kit, E. Evaluation of the Wave Characteristics at the Mediterranean Coast of Israel. Isr. J. Earth-Sci. 1982, 30, 120–134. [Google Scholar]
- CEC Marine Ltd. Available online: http://www.cecmarine.com/ (accessed on 11 January 2022).
- Concrete Layer Innovations. CLI Calculator. Available online: https://www.concretelayer.com/en/solutions/online-resources/calculator (accessed on 4 February 2022).
- CLI. ACCROPODE™ II—ECOPODE™ Design Guide Table. Available online: https://www.concretelayer.com/sites/default/files/2019-05/ECOPODE%E2%84%A2_Design%20_Table_2012_0.pdf (accessed on 10 January 2022).
- Gill, D.A. Geological Aspects of Planning Artificial Islands Offshore Tel Aviv, Israel; The University of Arizona: Tucson, AZ, USA, 1999. [Google Scholar]
- World Health Organization. Guidelines for Drinking-Water Quality; Fourth edition incorporating the first addendum; World Health Organization: Geneva, Switzerland, 2017; ISBN 9789241549950. [Google Scholar]
- Grattan, S.R.; Díaz, F.J.; Pedrero, F.; Vivaldi, G.A. Assessing the suitability of saline wastewaters for irrigation of Citrus spp.: Emphasis on boron and specific-ion interactions. Agric. Water Manag. 2015, 157, 48–58. [Google Scholar] [CrossRef]
- Grieve, C.M.; Grattan, S.R.; Maas, E.V. Plant salt tolerance. In ASCE Manual and Reports on Engineering Practice No. 71 Agricultural Salinity Assessment and Management, 2nd ed.; Wallender, W.W., Tanji, K.K., Eds.; ASCE: Reston, VA, USA, 2012; Chapter 13; pp. 405–459. [Google Scholar]
- Schiffler, M. Perspectives and challenges for desalination in the 21st century. Desalination 2004, 165, 1–9. [Google Scholar] [CrossRef]
- Sauvet-Goichon, B. Ashkelon desalination plant—A successful challenge. Desalination 2007, 203, 75–81. [Google Scholar] [CrossRef]
- Gude, V.G. Desalination and sustainability—An appraisal and current perspective. Water Res. 2016, 89, 87–106. [Google Scholar] [CrossRef]
- Gao, L.; Yoshikawa, S.; Iseri, Y.; Fujimori, S.; Kanae, S. An Economic Assessment of the Global Potential for Seawater Desalination to 2050. Water 2017, 9, 763. [Google Scholar] [CrossRef]
- Lokiec, F.; Kronenberg, G. South Israel 100 million m3/y seawater desalination facility: Build, operate and transfer (BOT) project. Desalination 2003, 156, 29–37. [Google Scholar] [CrossRef]
- Tenne, A. Sea Water Desalination in Israel: Planning, Coping with Difficulties, and Economic Aspects of Long-Term Risks; Water Authority—State of Israel Desalination Devision. 2010. Available online: https://www.gov.il/BlobFolder/reports/water-authority-data-english/he/12-Desalination-in-Israel.pdf (accessed on 10 January 2022).
- Vartiainen, E.; Masson, G.; Breyer, C.; Moser, D.; Román Medina, E. Impact of weighted average cost of capital, capital expenditure, and other parameters on future utility-scale PV levelised cost of electricity. Prog. Photovolt. Res. Appl. 2020, 28, 439–453. [Google Scholar] [CrossRef] [Green Version]
- IRENA. Renewable Power Generation Costs in 2019, International Renewable Energy Agency, Abu Dhabi. 2020. Available online: https://www.irena.org/publications/2020/Jun/Renewable-Power-Costs-in-2019 (accessed on 10 January 2022).
- Ministry of Energy Israel. Promotion of Renewable Energy in the Israeli Energy Sector. Available online: https://www.gov.il/en/departments/general/renewable_energy (accessed on 17 January 2022).
- Ministry of Energy Israel. UAE, Jordan and Israel Collaborate to Mitigate Climate Change with Sustainability Project. Available online: https://www.gov.il/en/departments/news/press_221121 (accessed on 10 January 2022).
- Gordon, J.M.; Fasquelle, T.; Nadal, E.; Vossier, A. Providing large-scale electricity demand with photovoltaics and molten-salt storage. Renew. Sustain. Energy Rev. 2021, 135, 110261. [Google Scholar] [CrossRef]
- Luo, X.; Wang, J.; Dooner, M.; Clarke, J. Overview of current development in electrical energy storage technologies and the application potential in power system operation. Appl. Energy 2015, 137, 511–536. [Google Scholar] [CrossRef] [Green Version]
- Gür, T.M. Review of electrical energy storage technologies, materials and systems: Challenges and prospects for large-scale grid storage. Energy Environ. Sci. 2018, 11, 2696–2767. [Google Scholar] [CrossRef]
- Schmidt, O.; Melchior, S.; Hawkes, A.; Staffell, I. Projecting the Future Levelized Cost of Electricity Storage Technologies. Joule 2019, 3, 81–100. [Google Scholar] [CrossRef] [Green Version]
- IEA; NEA. Projected Costs of Generating Electricity (2020 Edition). 2020. Available online: https://www.iea.org/reports/projected-costs-of-generating-electricity-2020 (accessed on 10 January 2022).
- Weisser, D. A guide to life-cycle greenhouse gas (GHG) emissions from electric supply technologies. Energy 2007, 32, 1543–1559. [Google Scholar] [CrossRef]
- National Marine Dredging Company. UPPER ZAKUM FIELD DEVELOPMENT. Available online: https://www.nmdc.com/site/projectDetails/10 (accessed on 4 February 2022).
- Concrete Layer Innovations. Upper Zakum Oil Field, Artificial Islands Project North and West. Available online: https://www.concretelayer.com/en/upper-zakum-oil-field-artificial-islands-project-north-and-west (accessed on 4 February 2022).
- Concrete Layer Innovations. Artificial Islands for Satah Al-Razboot (SARB). Available online: https://www.concretelayer.com/en/artificial-islands-satah-al-razboot-sarb (accessed on 4 February 2022).
- Dredging International, MEDCO. SARB Island Project—EuDA 2013 AGM Conference. Available online: https://www.european-dredging.eu/pdf/04_SARB_Islands.pdf (accessed on 10 January 2022).
- Michael Daly. $2 Billion Artificial Island Planned as North Sea Wind Power Hub. Available online: https://www.stuff.co.nz/business/world/90402105/2-billion-artificial-island-planned-as-north-sea-wind-power-hub (accessed on 4 February 2022).
- Ministry of Energy Israel. The World’s Lowest Price of Desalinated Water in the Sorek 2 Desalination Plant Tender. Available online: https://www.gov.il/en/departments/news/desalination_260520 (accessed on 6 December 2021).
- Marmelshtein, Y. Attracting private funding through public finance: A case study of desalination of sea water in Israel. In Proceedings of the OECD-WWC-Netherlands Roundtable on Financing Water, Tel Aviv, Israel, 13 September 2017; Volume 13. [Google Scholar]
- Lokiec, F.; Meerovitch, R. Implementation of build-operate-transfer schemes: Obstacles & solutions. In Proceedings of the World Congress on Desalination and Water Reuse, Tianjin, China, 20–25 October 2013. [Google Scholar]
- IMF. Chapter 3: Mitigating Climate Change. In World Economic Outlook, October 2020: A Long and Difficult Ascent; IMF: Washington, DC, USA, 2020; pp. 85–114. ISBN 978-1-51355-815-8. [Google Scholar]
- Dialyna, E.; Tsoutsos, T. Wave Energy in the Mediterranean Sea: Resource Assessment, Deployed WECs and Prospects. Energies 2021, 14, 4764. [Google Scholar] [CrossRef]
- Schallenberg-Rodríguez, J.; Del Rio-Gamero, B.; Melian-Martel, N.; Lis Alecio, T.; González Herrera, J. Energy supply of a large size desalination plant using wave energy. Practical case: North of Gran Canaria. Appl. Energy 2020, 278, 115681. [Google Scholar] [CrossRef]
- Janowitz, D.; Margheri, M.; Yakhoul, H.; Bensabat, J.; Rusteberg, B.; Yüce, S. Bartering Blue Water vs. Green Energy—Innovative Swap-Options for Cooperation between Israel and Jordan. In Proceedings of the International Conference on Water Management and Sustainability: Solutions for Arid Region (WMS-EXPO2020); Dubai, United Arab Emirates, 22–24 March 2022, (Accepted by the Program Committee for presentation).
- Degraer, S.; Carey Drew, A.; Coolen, J.W.P.; Hutchinson, Z.L.; Kerckhof, F.; Rumes, B.; Vanaverbeke, J. Offshore wind farm artificial reefs affect ecosystem structure and functioning. Oceanography 2020, 33, 48–57. [Google Scholar] [CrossRef]
- Dugan, J.E.; Airoldi, L.; Chapman, M.G.; Walker, S.J.; Schlacher, T. Estuarine and Coastal Structures: Environmental Effects, A Focus on Shore and Nearshore Structures. Treatise Estuar. Coast. Sci. 2011, 8, 17–41. [Google Scholar]
- Black, K.P.; Andrews, C.J. Sandy Shoreline Response to Offshore Obstacles Part 1: Salient and Tombolo Geometry and Shape. J. Coast. Res. 2001, 29, 82–93. [Google Scholar]
- Landry, C.; Keeler, A.; Kriesel, W. An Economic Evaluation of Beach Erosion Management Alternatives. Mar. Resour. Econonomics 2003, 18, 105–127. [Google Scholar] [CrossRef]
- Luijendijk, A.; Taal, M. Sand Motor. Available online: https://www.deltares.nl/en/projects/sand-engine/ (accessed on 6 December 2021).
- Zviely, D.; Kit, E.; Rosen, B.; Galili, E.; Klein, M. Shoreline migration and beach-nearshore sand balance over the last 200 years in Haifa Bay (SE Mediterranean). Geo-Mar. Lett. 2009, 29, 93–110. [Google Scholar] [CrossRef]
- Guo, X.; Chen, C.; Tang, J. Numerical Simulation of the hydrodynamic effects of an artificial island. Fresenius Environ. Bull. 2018, 27, 2671–2682. [Google Scholar]
- Missimer, T.M.; Jones, B.; Maliva, R.G. Intakes and Outfalls for Seawater Reverse-Osmosis Desalination Facilities: Innovations and Environmental Impact. Springer International Publishing: Basel, Switzerland,, 2015; ISBN 978-3-319-13202-0. [Google Scholar]
- Callaghan, T.P. Entrainment and Impingement of Organisms in Power Plant Cooling. Encycl. Energy 2004, 447–457. [Google Scholar] [CrossRef]
- Aqseptence Group. Sustainable and Eco-friendly Fish Protection in Water Intakes. 2021. Available online: https://www.passavant-geiger.com/fileadmin/Resources/Passavant_Geiger_Noggerath/Products/Documents/Geiger_R_Electric_Fish_Repelling/Geiger_Fish_Protection_Technologies_EN__3_.pdf (accessed on 10 January 2022).
- Chavand, V.; Evenden, C. Noise Assessment of a Desalination Plant. In Proceedings of the 20th International Congress on Acoustics, ICA 2010, Sydney, Australia, 23–27 August 2010. [Google Scholar]
- Pérez, C.; Iglesias, G. Integration of Wave energy Converters and Offshore Windmills. In Proceedings of the 4th International Conference on Ocean Energy, Dublin, Ireland, 17–20 October 2012. [Google Scholar]
- United Nations Environment Programme. Desalination: Resource and Guidance Manual for Environmental Impact Assessment; World Health Organization: Geneva, Switzerland, 2008; Available online: https://wedocs.unep.org/handle/20.500.11822/30011;jsessionid=CC649D9AA7F8A9A96CEC2407B3DA0FCC (accessed on 10 January 2022).
- Chee, S.Y.; Othman, A.G.; Sim, Y.K.; Mat Adam, A.N.; Firth, L.B. Land reclamation and artificial islands: Walking the tightrope between development and conservation. Glob. Ecol. Conserv. 2017, 12, 80–95. [Google Scholar] [CrossRef] [Green Version]


| Alternatives | Water Depth | Crest Height of the Structure above Chart Datum |
|---|---|---|
| No. 1—Artificial Island Land reclamation | −5 m | +8 m |
| No. 2—Artificial Island 1 km offshore | −12 m | +14 m |
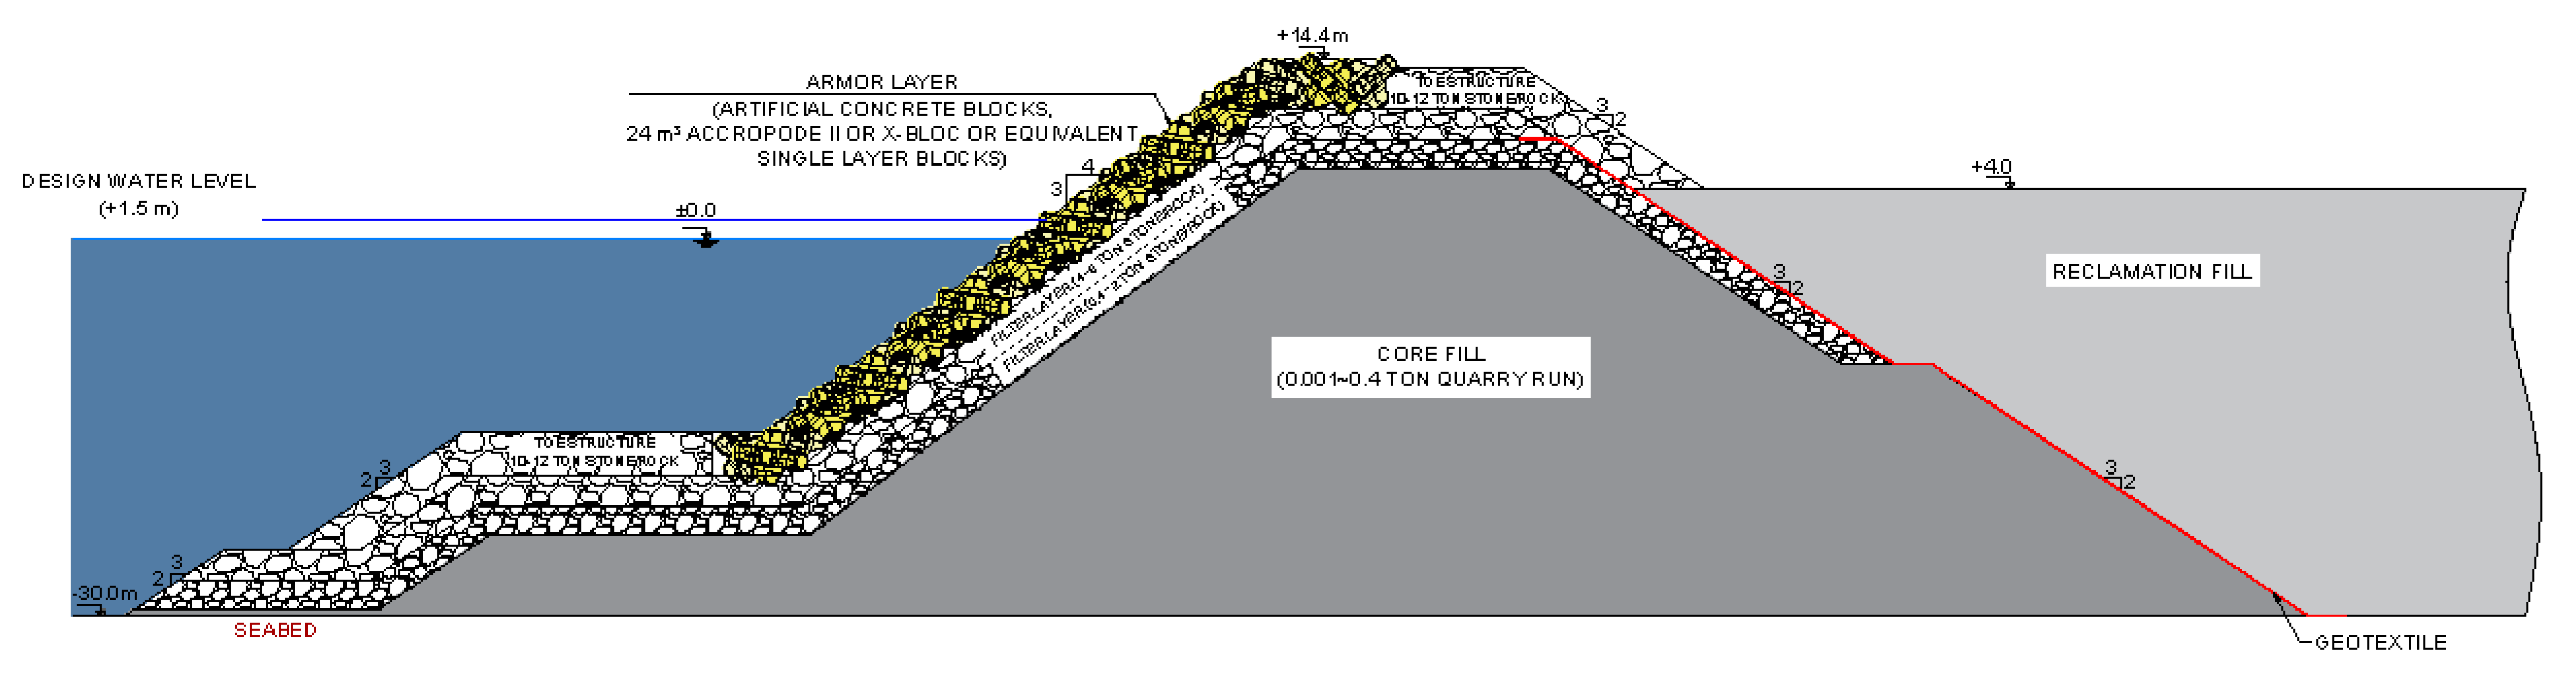
| No. 3—Artificial Island 5 km offshore | −30 m | +14.4 m |
| Parameter | Value | Unit |
|---|---|---|
| Type | BOT project Membrane-based Two-pass SWRO system | |
| Capacity | 600 | MCM/y |
| Availability | >95 | % |
| Feed TDS | 40,500 | ppm [41] |
| Permeate TDS | 300 | ppm [41] |
| Recovery rate | ~45 | % [41] |
| Energy demand | 3 | kWh/m3 [16] |
| Parameter | Value | Unit |
|---|---|---|
| Financing costs | ||
| Share of sponsoring/equity from total capital costs | 10 | % |
| BOT contract/funding period | 25 | years [45] |
| Sum interest rate and repayment rate | 5 | % |
| Fixed O&M costs | ||
| Maintenance and repair desalination plant | 3 | % |
| Maintenance and repair infrastructure (onshore) | 1 | % |
| Maintenance and repair infrastructure (offshore) | 2 | % |
| Variable O&M costs | ||
| Chemicals | 0.03 | $/m3 [6,16] |
| Replacement of membranes and cartridge filters | 0.04 | $/m3 [16] |
| Waste disposal | 0.017 | $/m3 [16] |
| Parameter | Value (2030) | Value (2040) | Value (2050) | Unit |
|---|---|---|---|---|
| Share of Renewable energy | 30 | 65 | 100 | % |
| LCOE PV | 0.03 [50] | 0.015 [46] | 0.01 [46] | $/kWh |
| LCOE PV + Storage | 0.12 [50] | 0.11 | 0.10 | $/kWh |
| Total LCOE Renewable | 0.03 | 0.066 | 0.073 | $/kWh |
| LCOE CCPP | 0.06 | 0.06 | 0.06 | $/kWh |
| Cost Item | Volume (m3) | Unit Price ($/m3) | Total Cost ($) |
|---|---|---|---|
| Reclamation fill | 9,800,230 | 15 | 147,003,450 |
| Core fill | 7,652,648 | 15 | 114,789,720 |
| Filter layer (0.4–2 ton) | 953,964 | 35 | 33,388,740 |
| Filter layer (4–6 ton) | 796,019 | 35 | 27,860,665 |
| Armour (24 m2 Accropode) | 303,998 | 120 | 36,479,760 |
| Toe structure (10–12 ton) | 297,116 | 50 | 14,855,800 |
| Back Armour (10–12 ton) | 202,760 | 50 | 10,138,000 |
| Direct investment cost | - | - | 384,516,135 |
| Indirect investment cost (Engineering, Permitting, Contingency) | 35 | % | 134,580,647 |
| Total cost | 519,096,782 |
| Artificial Island Projects | Construction Cost per Square Meter (2022) | Water Depth (Distance to Shore) | Project Description | Location |
|---|---|---|---|---|
| Alternative No. 1 (conceptual evaluation in this study) | ~287 $/m2 | −10 m (Land reclamation) | Rectangular Shape ~0.1 billion $, ~0.34 km2 | North Haifa, Israel |
| Alternative No. 2 (conceptual evaluation in this study) | ~760 $/m2 | −12 m (1 km offshore) | Rectangular Shape ~0.26 billion $, ~0.34 km2 | North Haifa, Israel |
| Alternative No. 3 (conceptual evaluation in this study) | ~1507 $/m2 | −30 m (5 km offshore) | Rectangular Shape ~0.52 billion $, ~0.34 km2 | North Haifa, Israel |
| Upper Zakum Field Development (constructed) [56,57] | ~469 $/m2 *2 | −6 m to −13 m (84 km offshore) | Falcon-shaped, 2011–2014 ~ 0.63 billion $ (2011), ~1.68 km2 | Abu Dhabi, UAE |
| Sateh Al Razboot oilfield (constructed) [58,59] | - | −13 m to −15 m (120 km offshore) | Falcon-shaped, 2011–2013 ~0.32 km2 | Abu Dhabi, UAE |
| Artificial Island North Sea Wind Power Hub (planned) [60] | ~333 $/m2 | −18 m (100 km offshore) | Expected Realisation between 2030–2050 ~2 billion $, 6 km2 | Middle of North Sea between Europe and the United Kingdom |
| Artificial Island for an airport offshore Tel Aviv (conceptual) [23] | ~1395 $/m2 *1 | ~−19.5 m (1.35 km offshore) | Rectangular Shape ~2.1 billion $ (2002), 2.32 km2 | Tel Aviv, Israel |
| Alternative | Intake Piping *1 | Outfall Piping *1 | Product Piping *1 | Piping ($) + Structure ($) = Total Cost ($) |
|---|---|---|---|---|
| No. 1—Artificial Island Land reclamation | 1 km ~20 Mio. $ | 2 km ~33 Mio. $ | Discharge already at shoreline | ~53 Mio. $ + ~73 Mio. $ = 126 Mio. $ |
| No. 2—Artificial Island 1 km offshore | Intake at site | 1 km ~17 Mio. $ | 1 km ~17 Mio. $ | ~34 Mio. $ + ~194 Mio. $ = 228 Mio. $ |
| No. 3—Artificial Island 5 km offshore | Intake at site | Outfall at site | 5 km ~83 Mio. $ | ~83 Mio. $ + ~385 Mio. $ = 468 Mio. $ |
Publisher’s Note: MDPI stays neutral with regard to jurisdictional claims in published maps and institutional affiliations. |
© 2022 by the authors. Licensee MDPI, Basel, Switzerland. This article is an open access article distributed under the terms and conditions of the Creative Commons Attribution (CC BY) license (https://creativecommons.org/licenses/by/4.0/).
Share and Cite
Janowitz, D.; Groche, S.; Yüce, S.; Melin, T.; Wintgens, T. Can Large-Scale Offshore Membrane Desalination Cost-Effectively and Ecologically Address Water Scarcity in the Middle East? Membranes 2022, 12, 323. https://doi.org/10.3390/membranes12030323
Janowitz D, Groche S, Yüce S, Melin T, Wintgens T. Can Large-Scale Offshore Membrane Desalination Cost-Effectively and Ecologically Address Water Scarcity in the Middle East? Membranes. 2022; 12(3):323. https://doi.org/10.3390/membranes12030323
Chicago/Turabian StyleJanowitz, Daniel, Sophie Groche, Süleyman Yüce, Thomas Melin, and Thomas Wintgens. 2022. "Can Large-Scale Offshore Membrane Desalination Cost-Effectively and Ecologically Address Water Scarcity in the Middle East?" Membranes 12, no. 3: 323. https://doi.org/10.3390/membranes12030323
APA StyleJanowitz, D., Groche, S., Yüce, S., Melin, T., & Wintgens, T. (2022). Can Large-Scale Offshore Membrane Desalination Cost-Effectively and Ecologically Address Water Scarcity in the Middle East? Membranes, 12(3), 323. https://doi.org/10.3390/membranes12030323