
A Novel Green Diluent for the Preparation of Poly(4-methyl-1-pentene) Membranes via a Thermally-Induced Phase Separation Method


Abstract
:1. Introduction
2. Experimental
2.1. Materials and Chemicals
2.2. Preparation of the PMP Membranes
2.2.1. Preparation of the PMP-MA Mixture Samples
2.2.2. Preparation of the PMP-Diluents Piece Membrane Samples
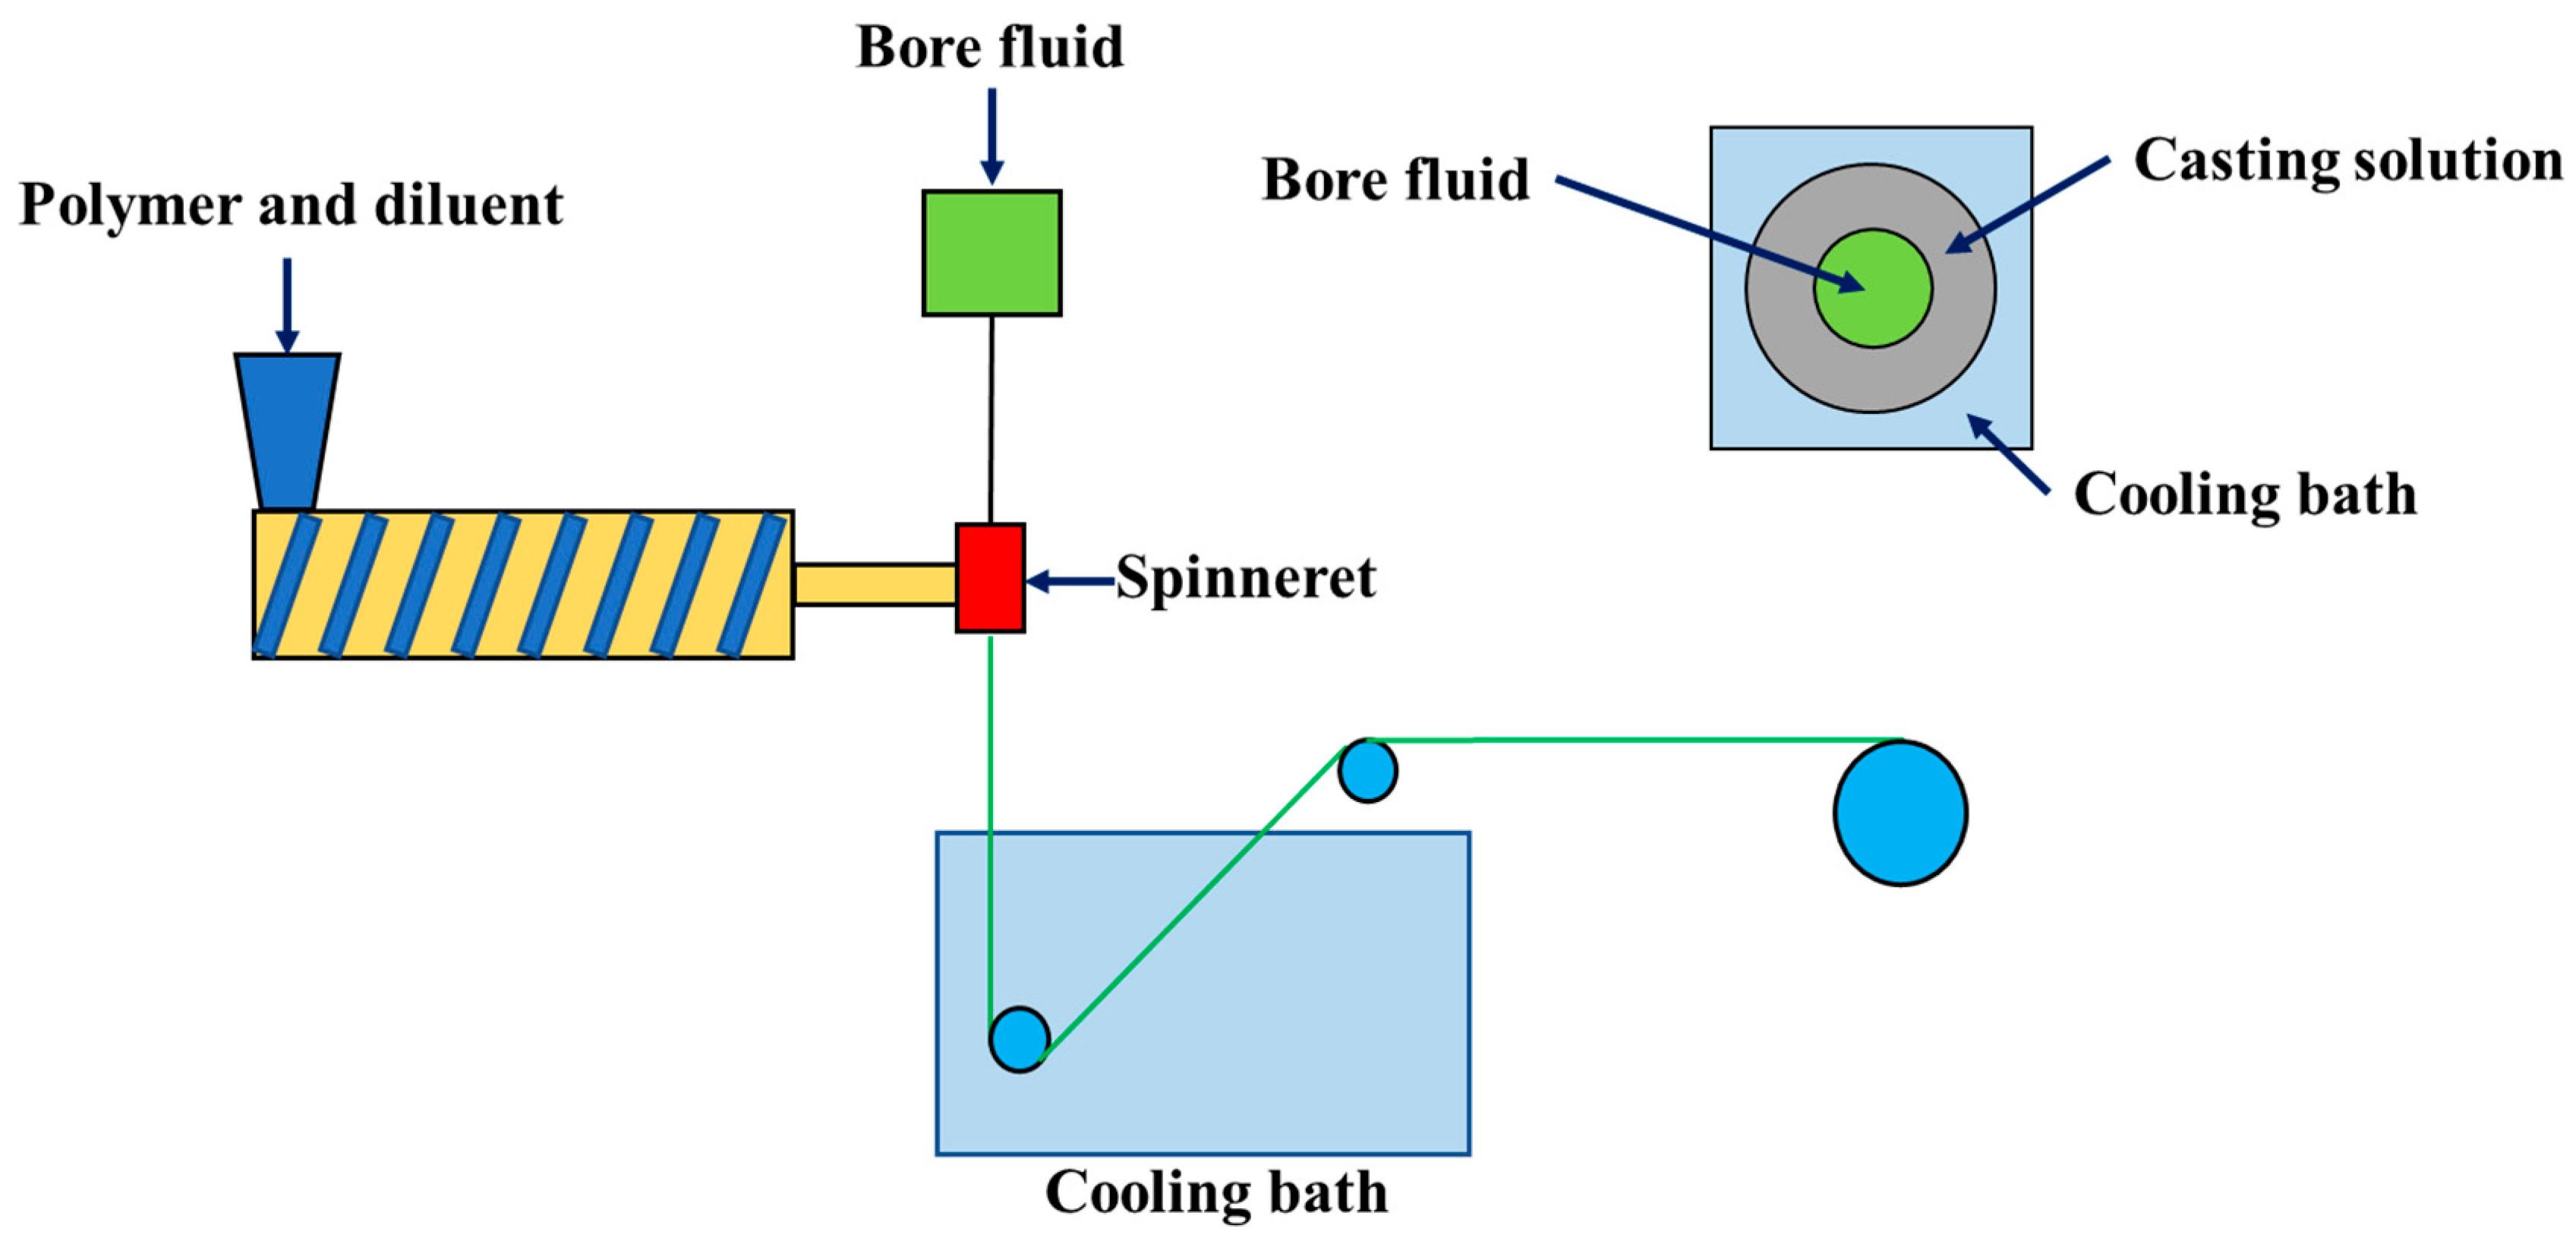
2.2.3. Preparation of the PMP HF Membranes
2.3. Phase Diagram and Crystallization Kinetics
2.4. Characterization of PMP Membranes
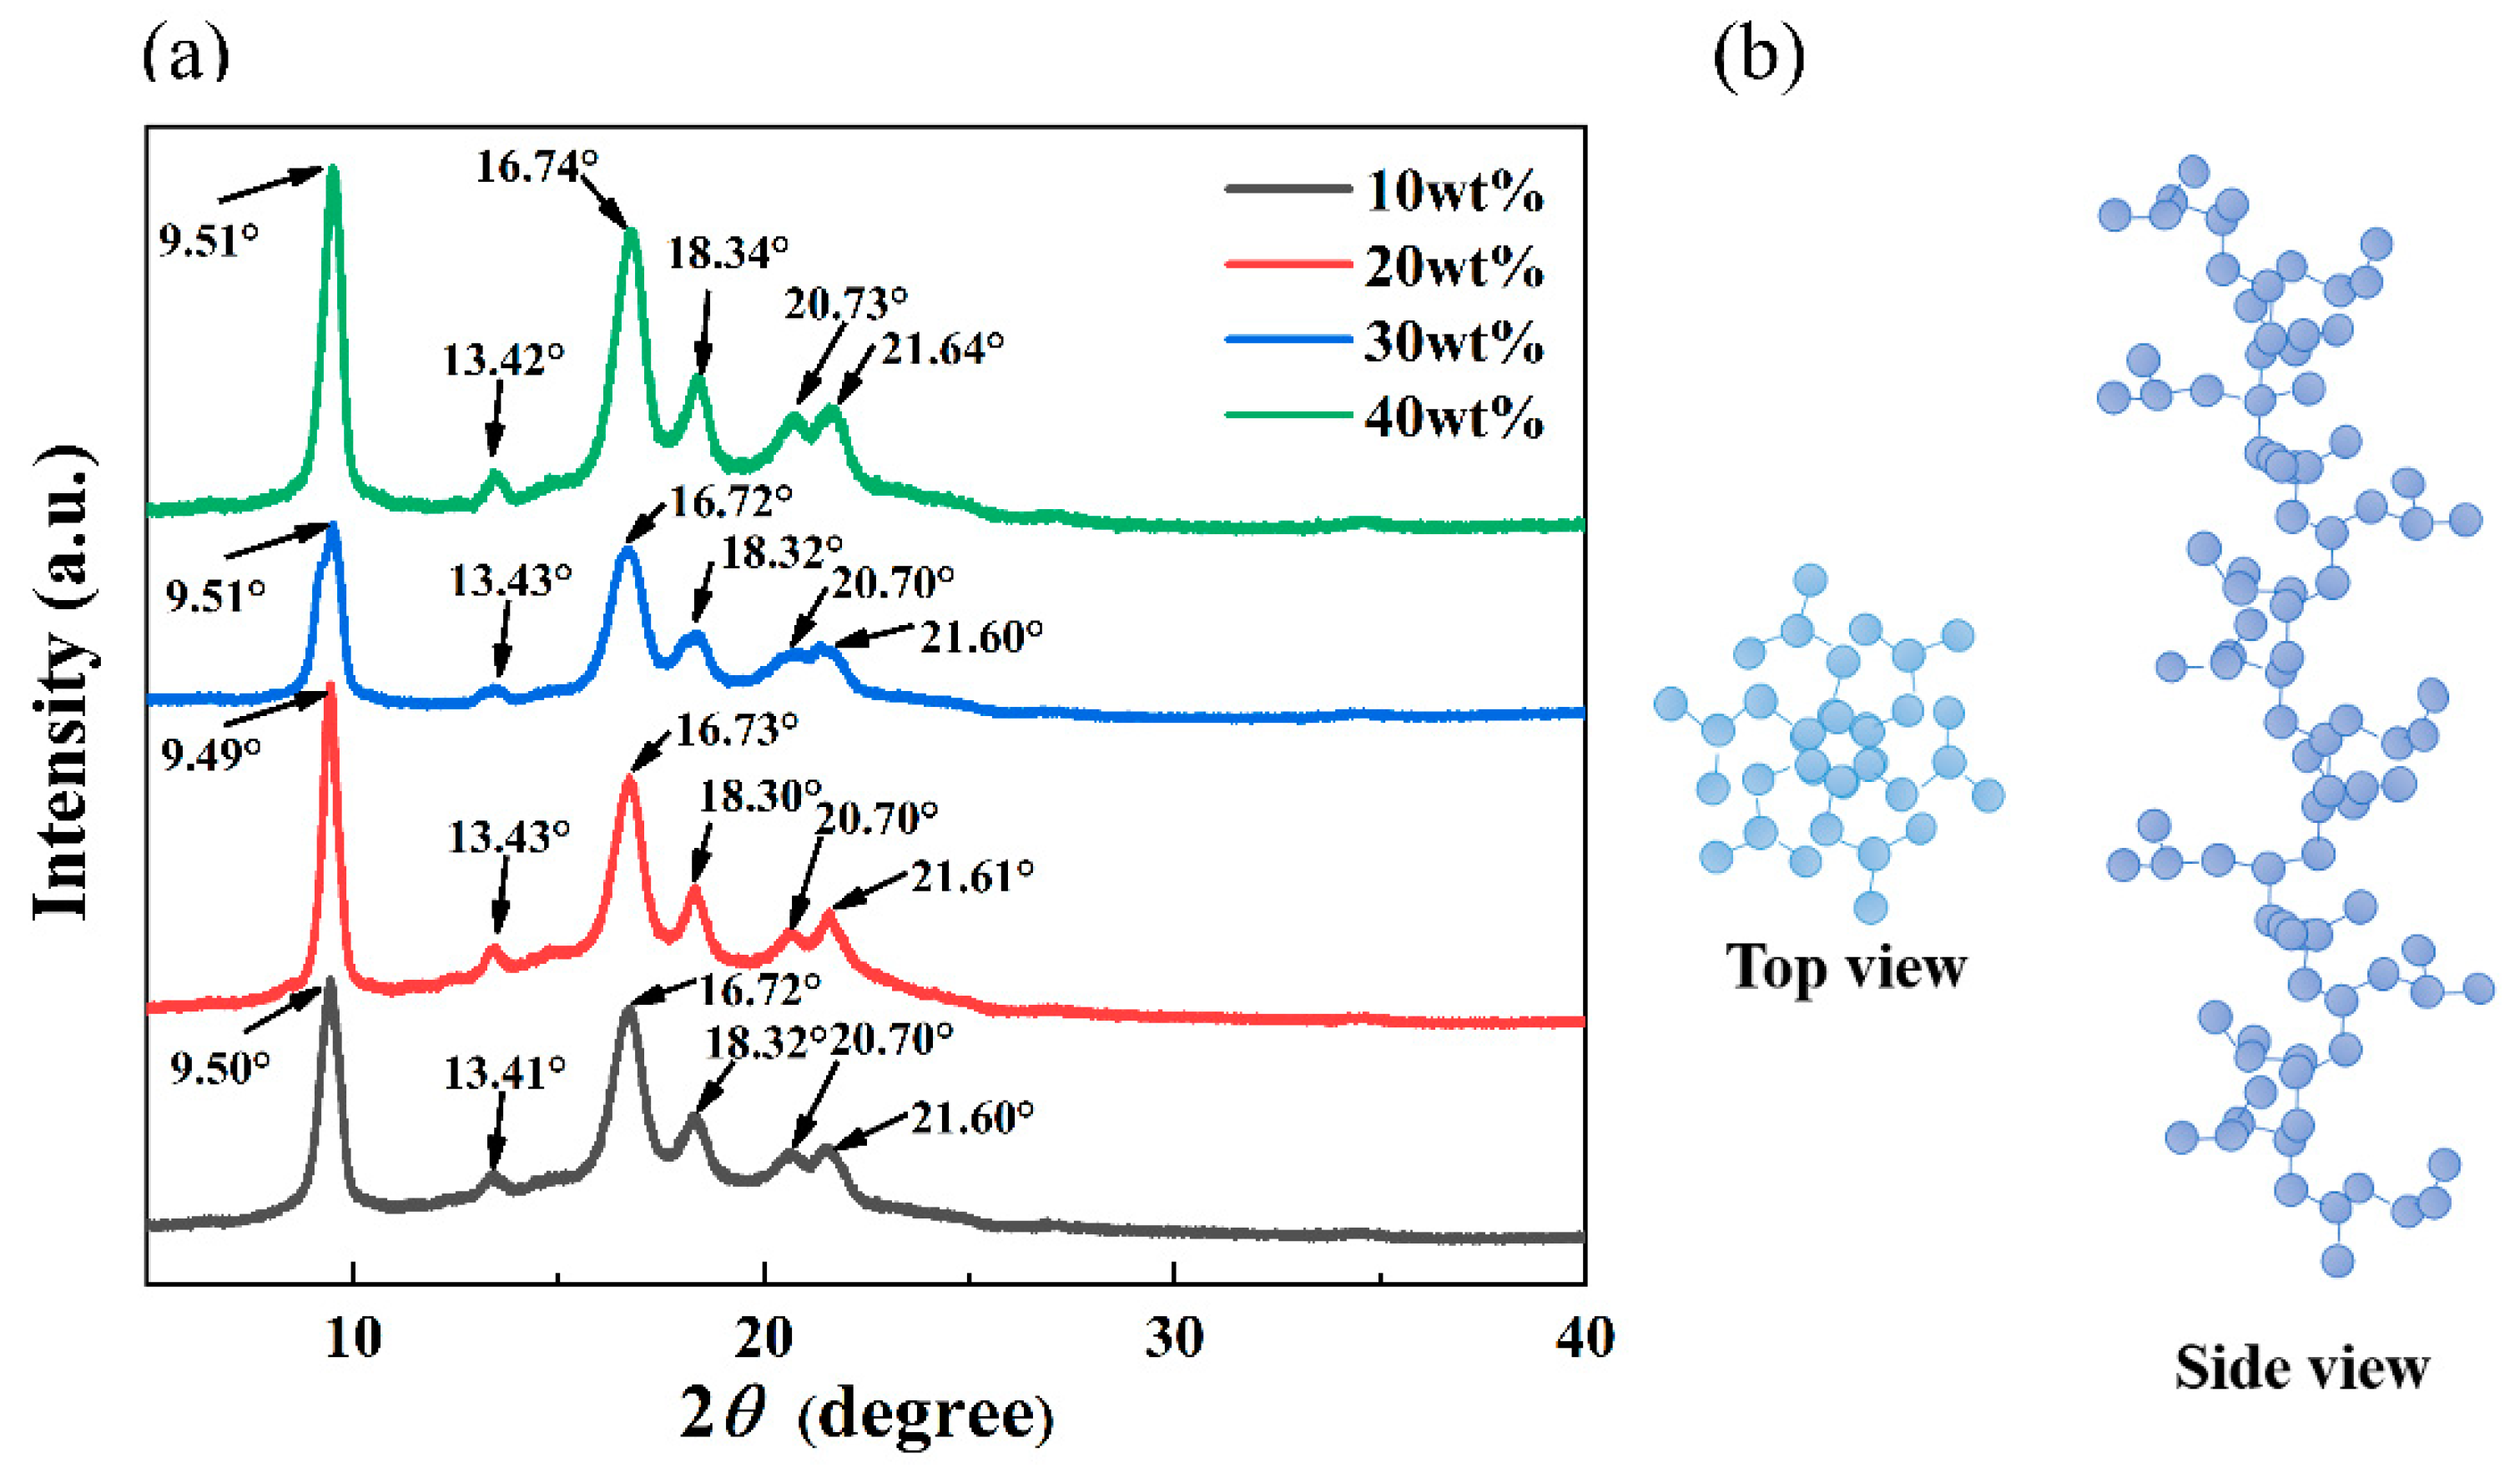
2.4.1. Crystalline Forms
2.4.2. Morphology Study
2.4.3. Porosity
2.4.4. Surface Contact Angle
2.4.5. Nitrogen Flux of the Membrane
2.4.6. Mechanical Property
3. Result and Discussion
3.1. Diluent Selection
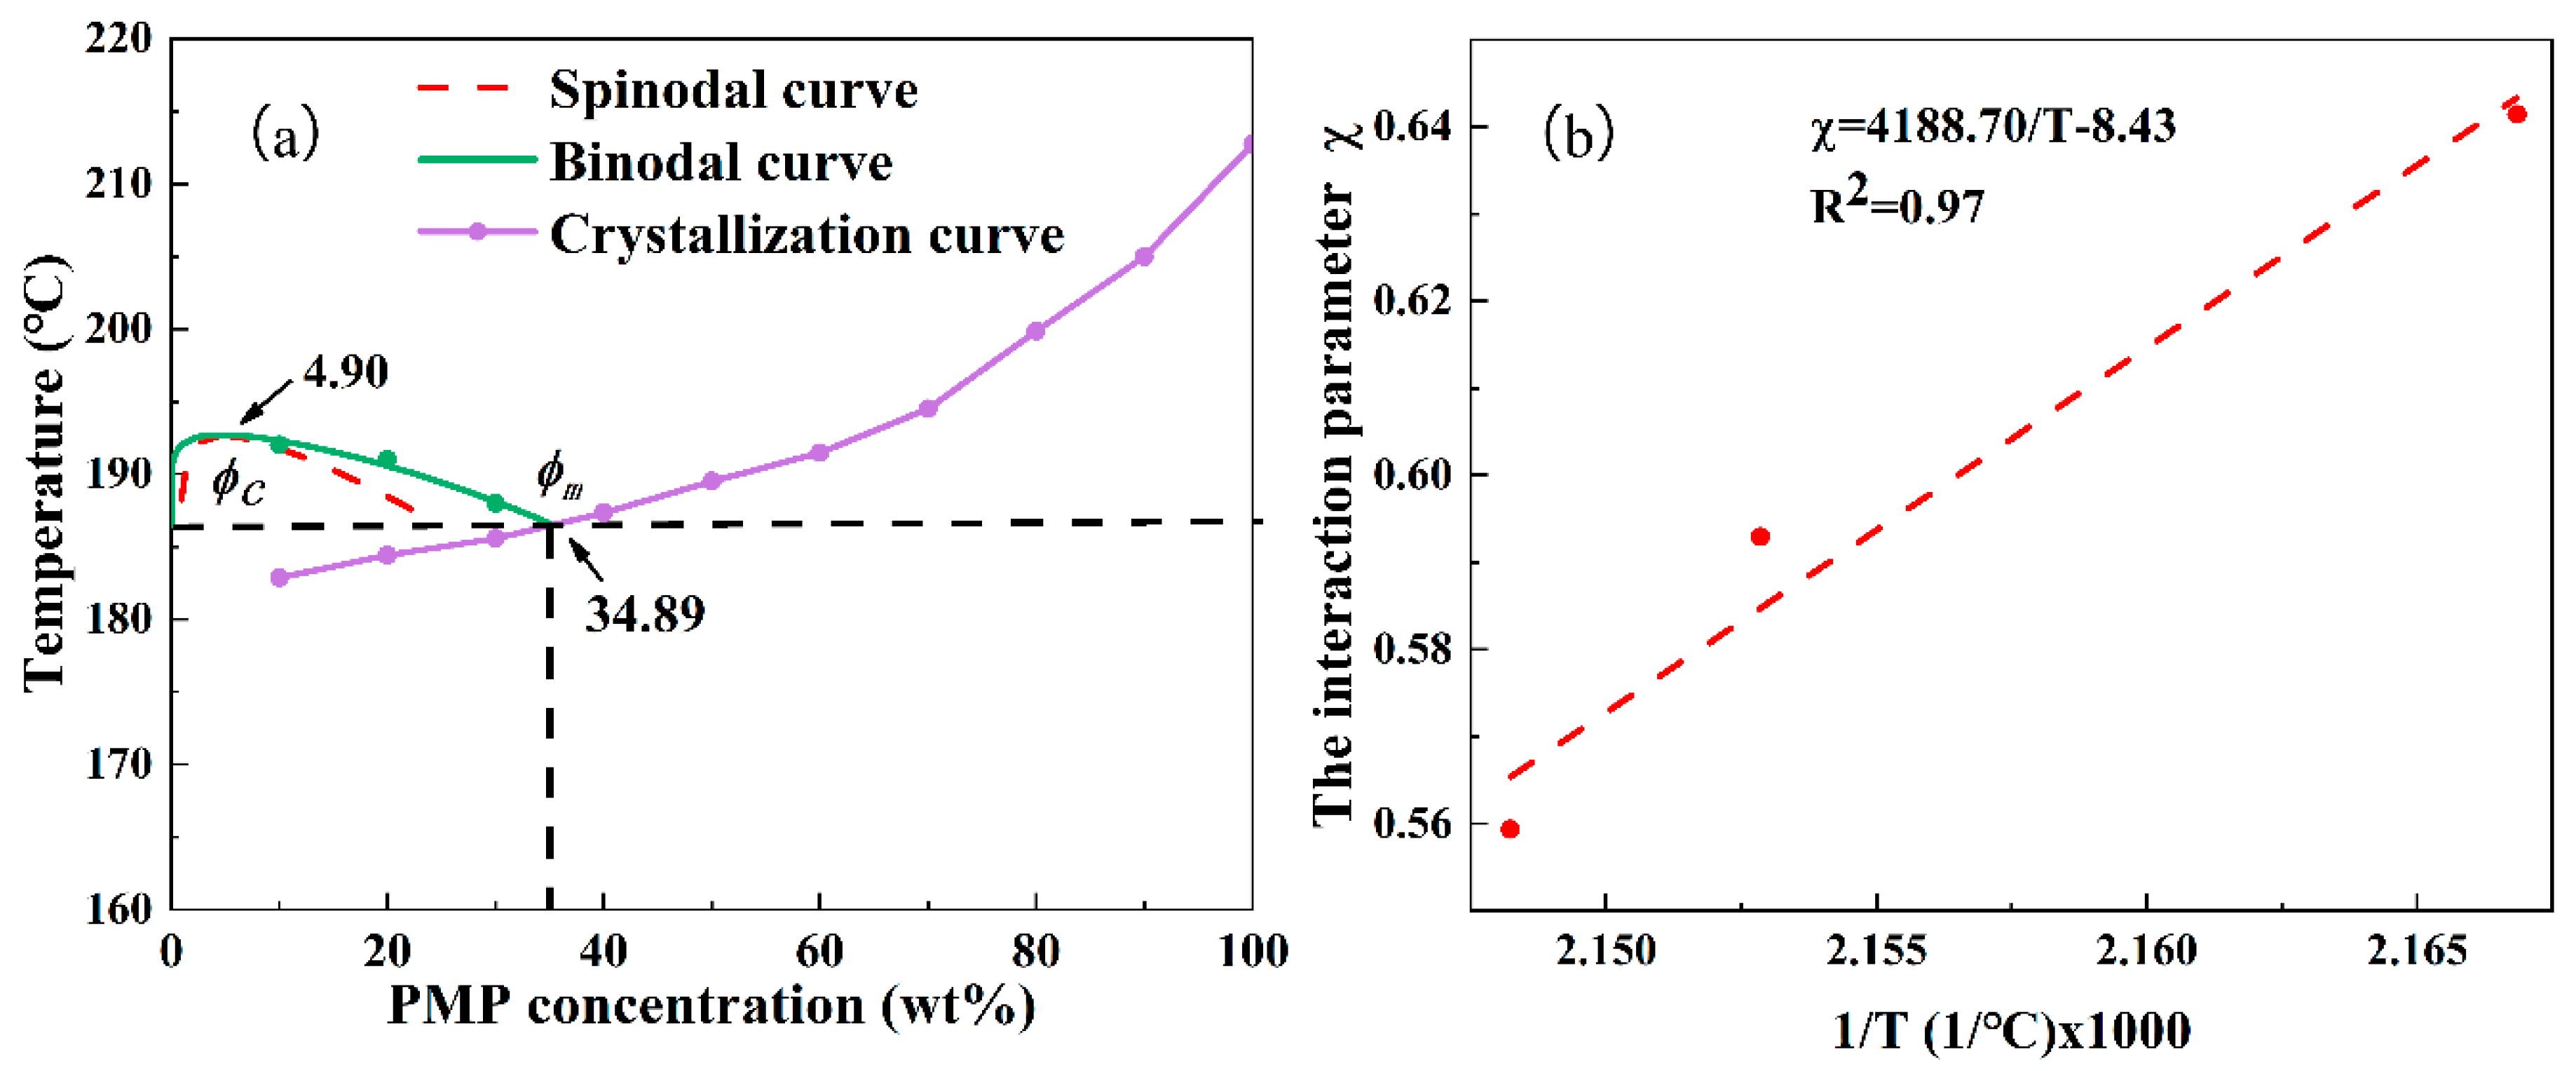
3.2. Phase Diagram of the PMP-MA System
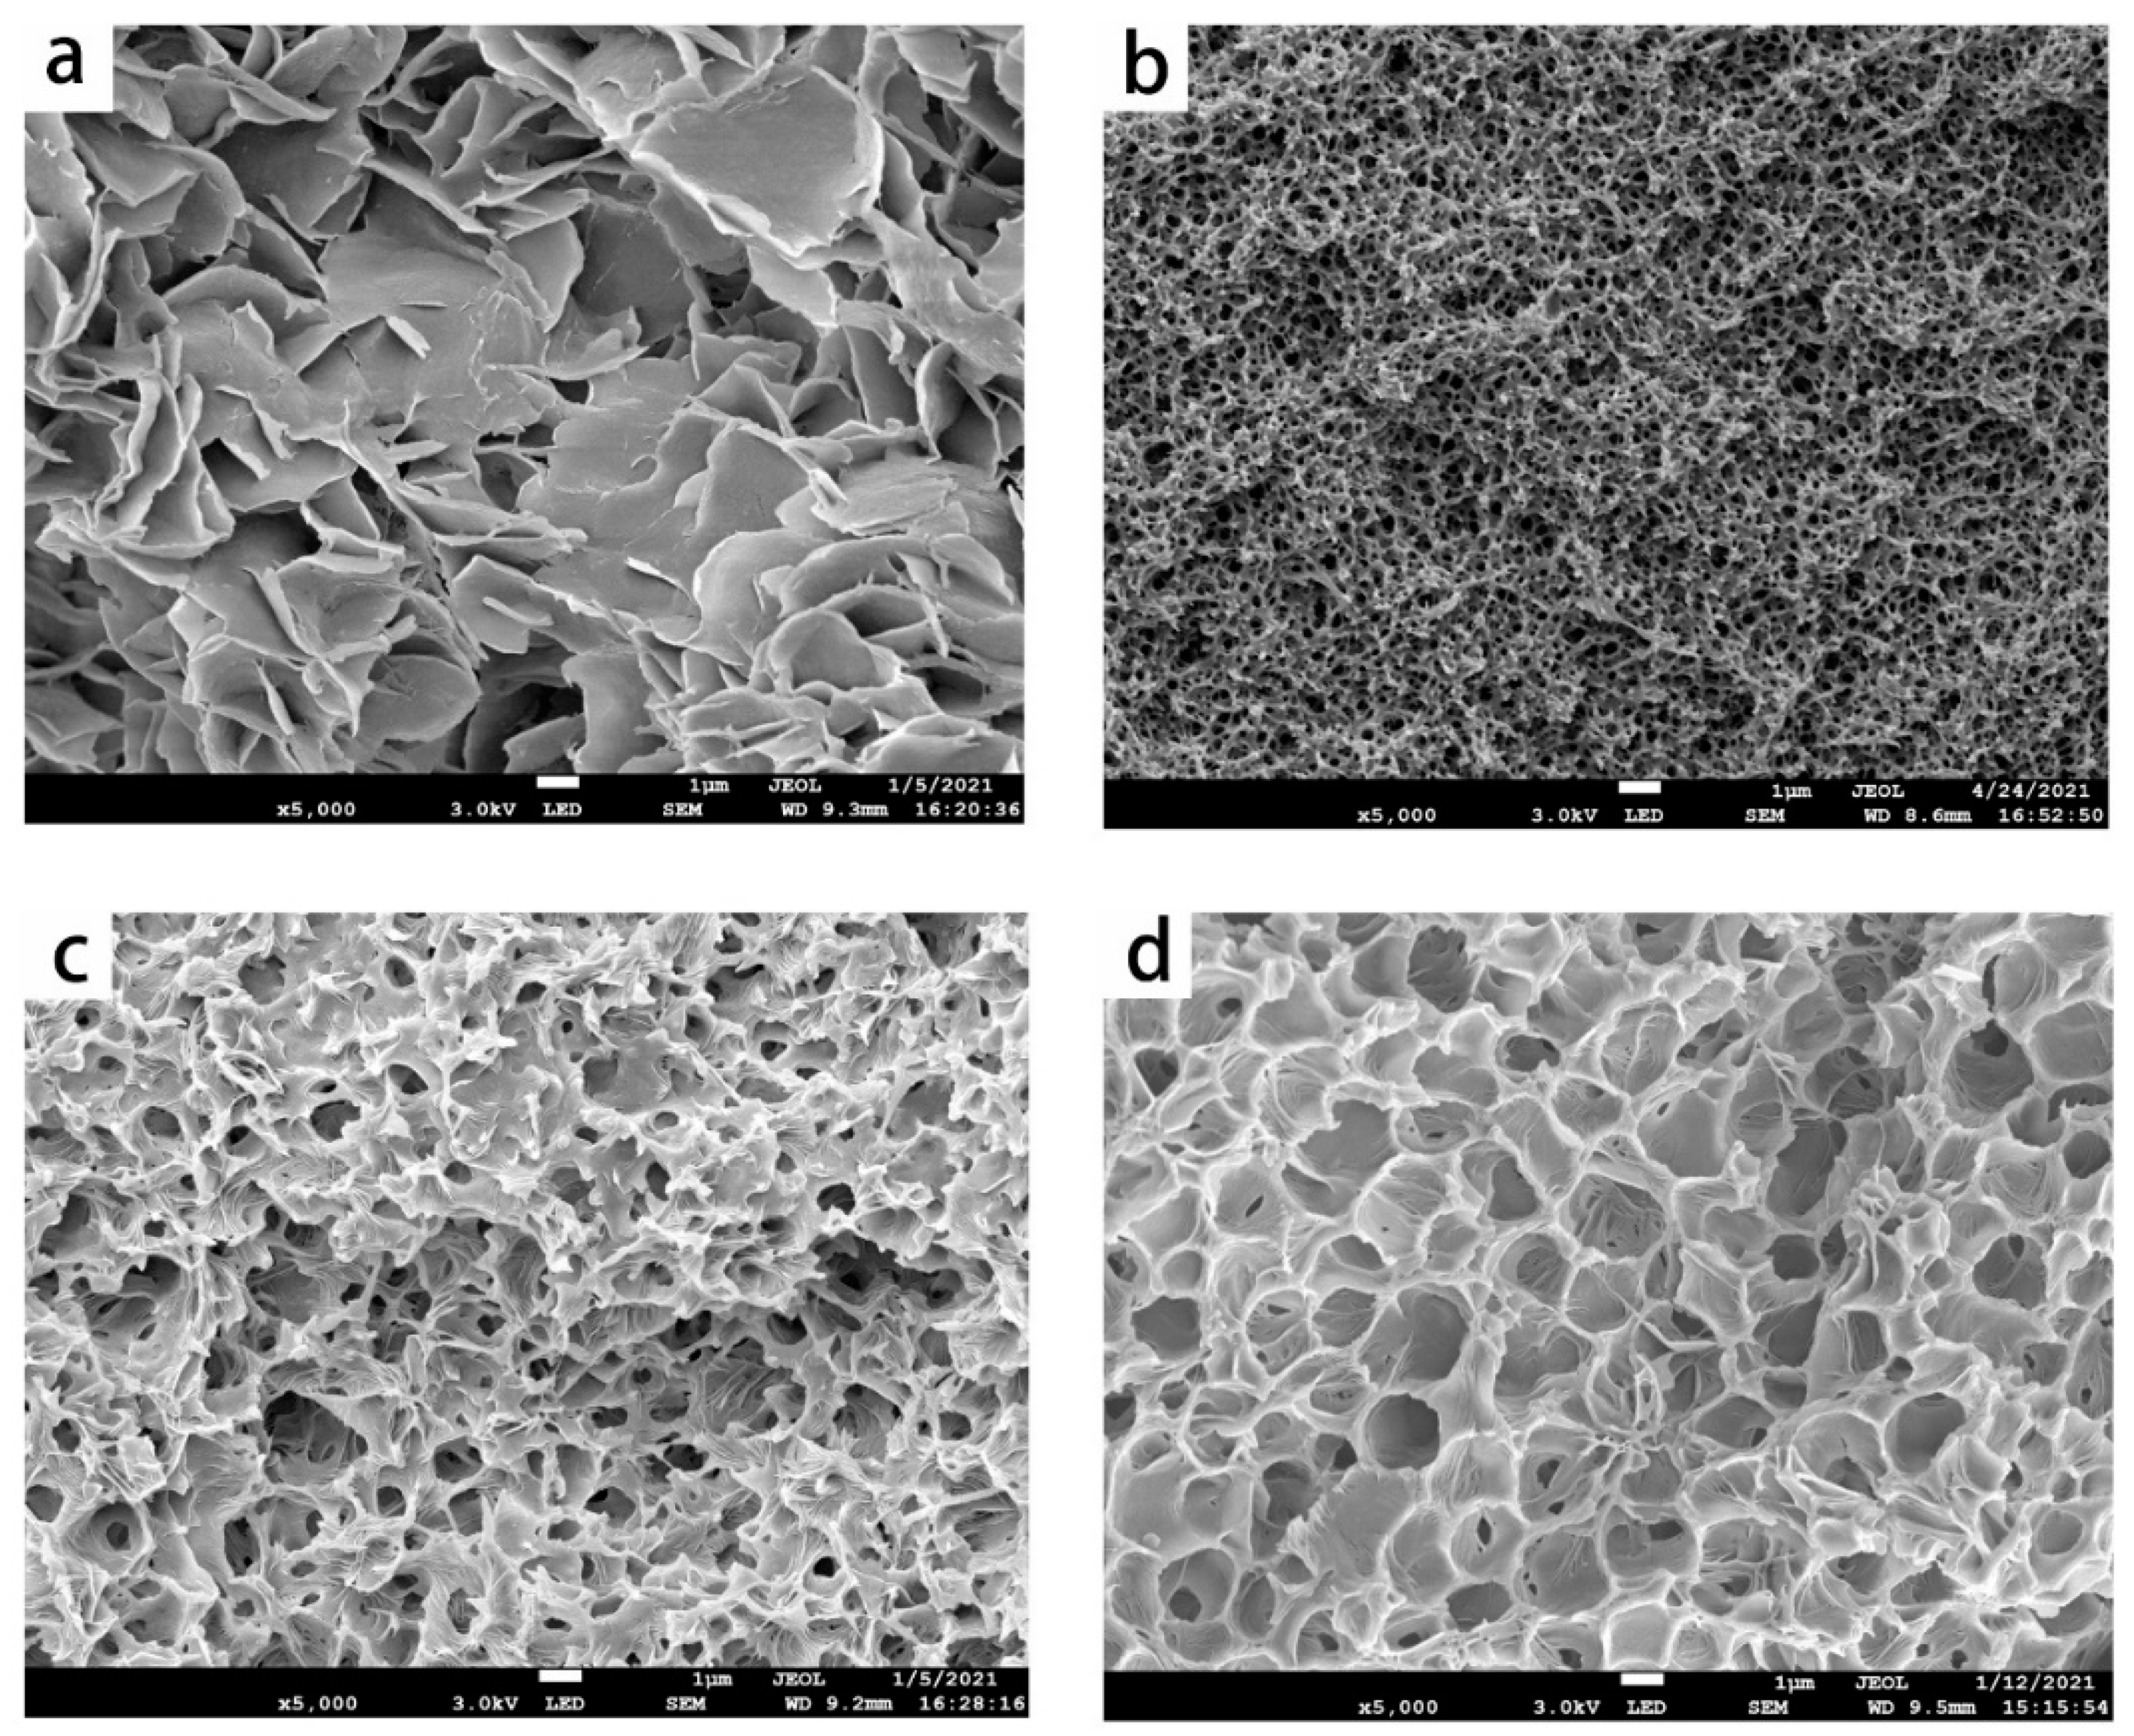
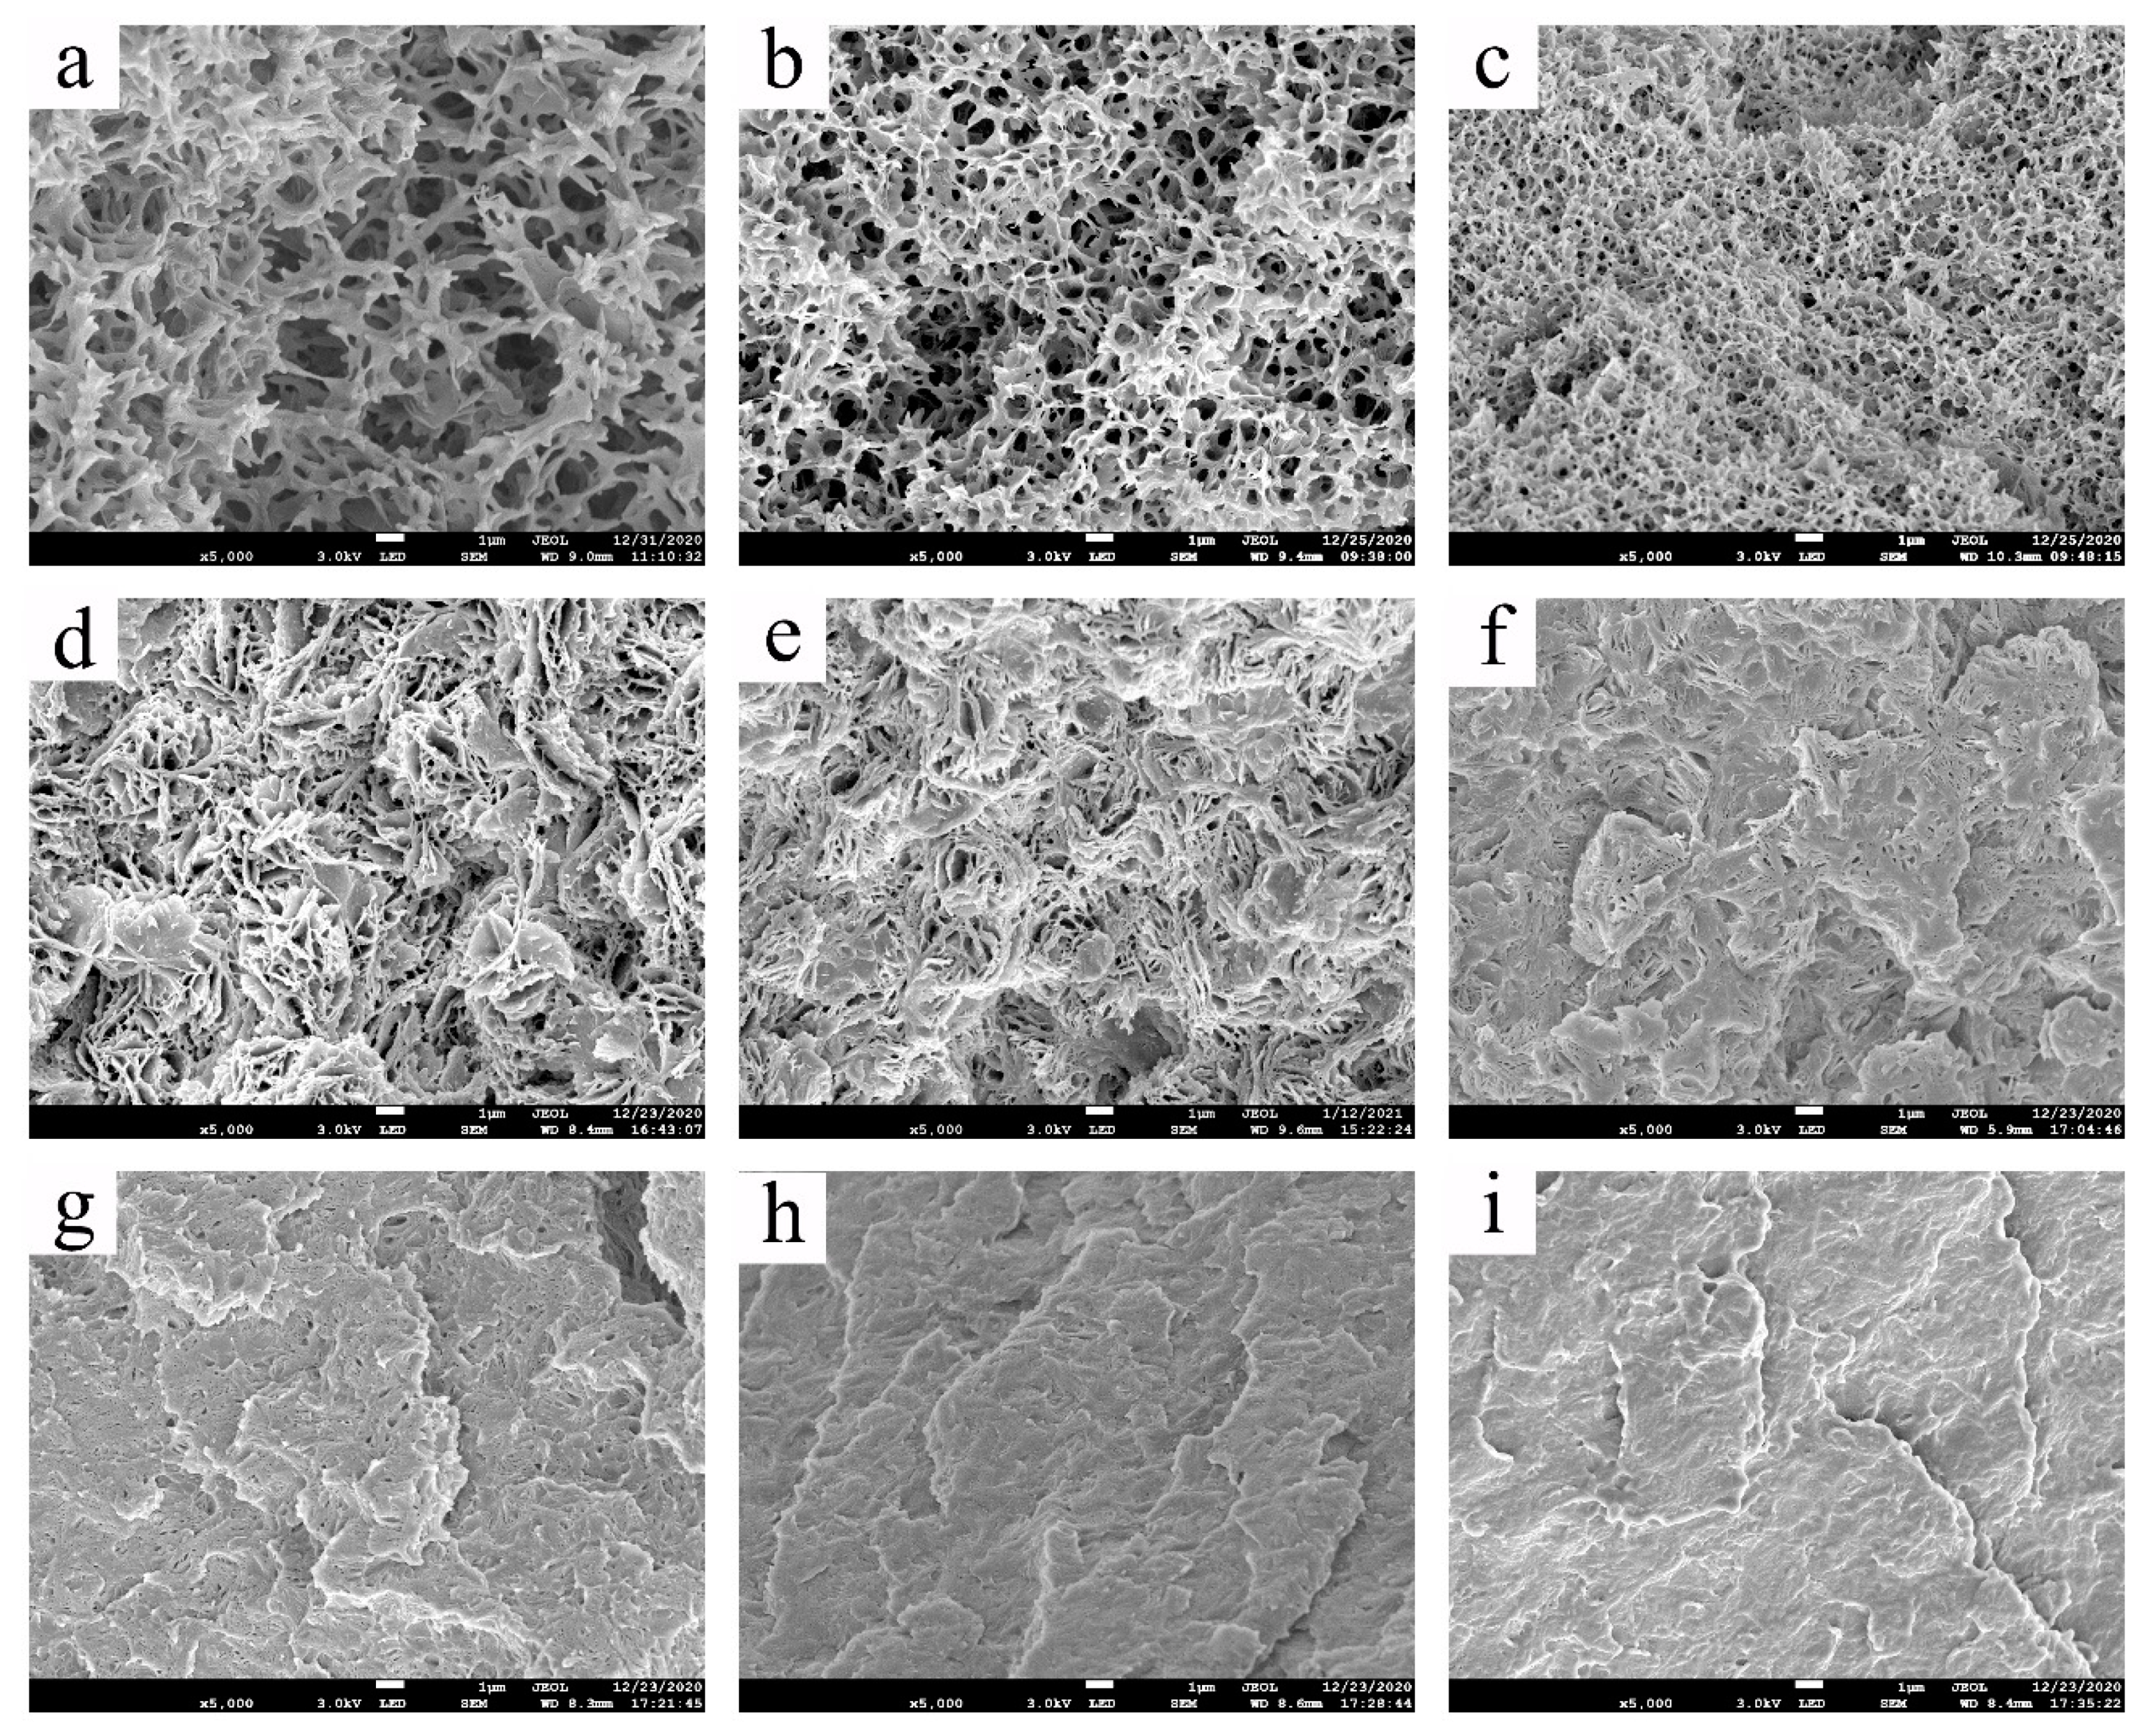
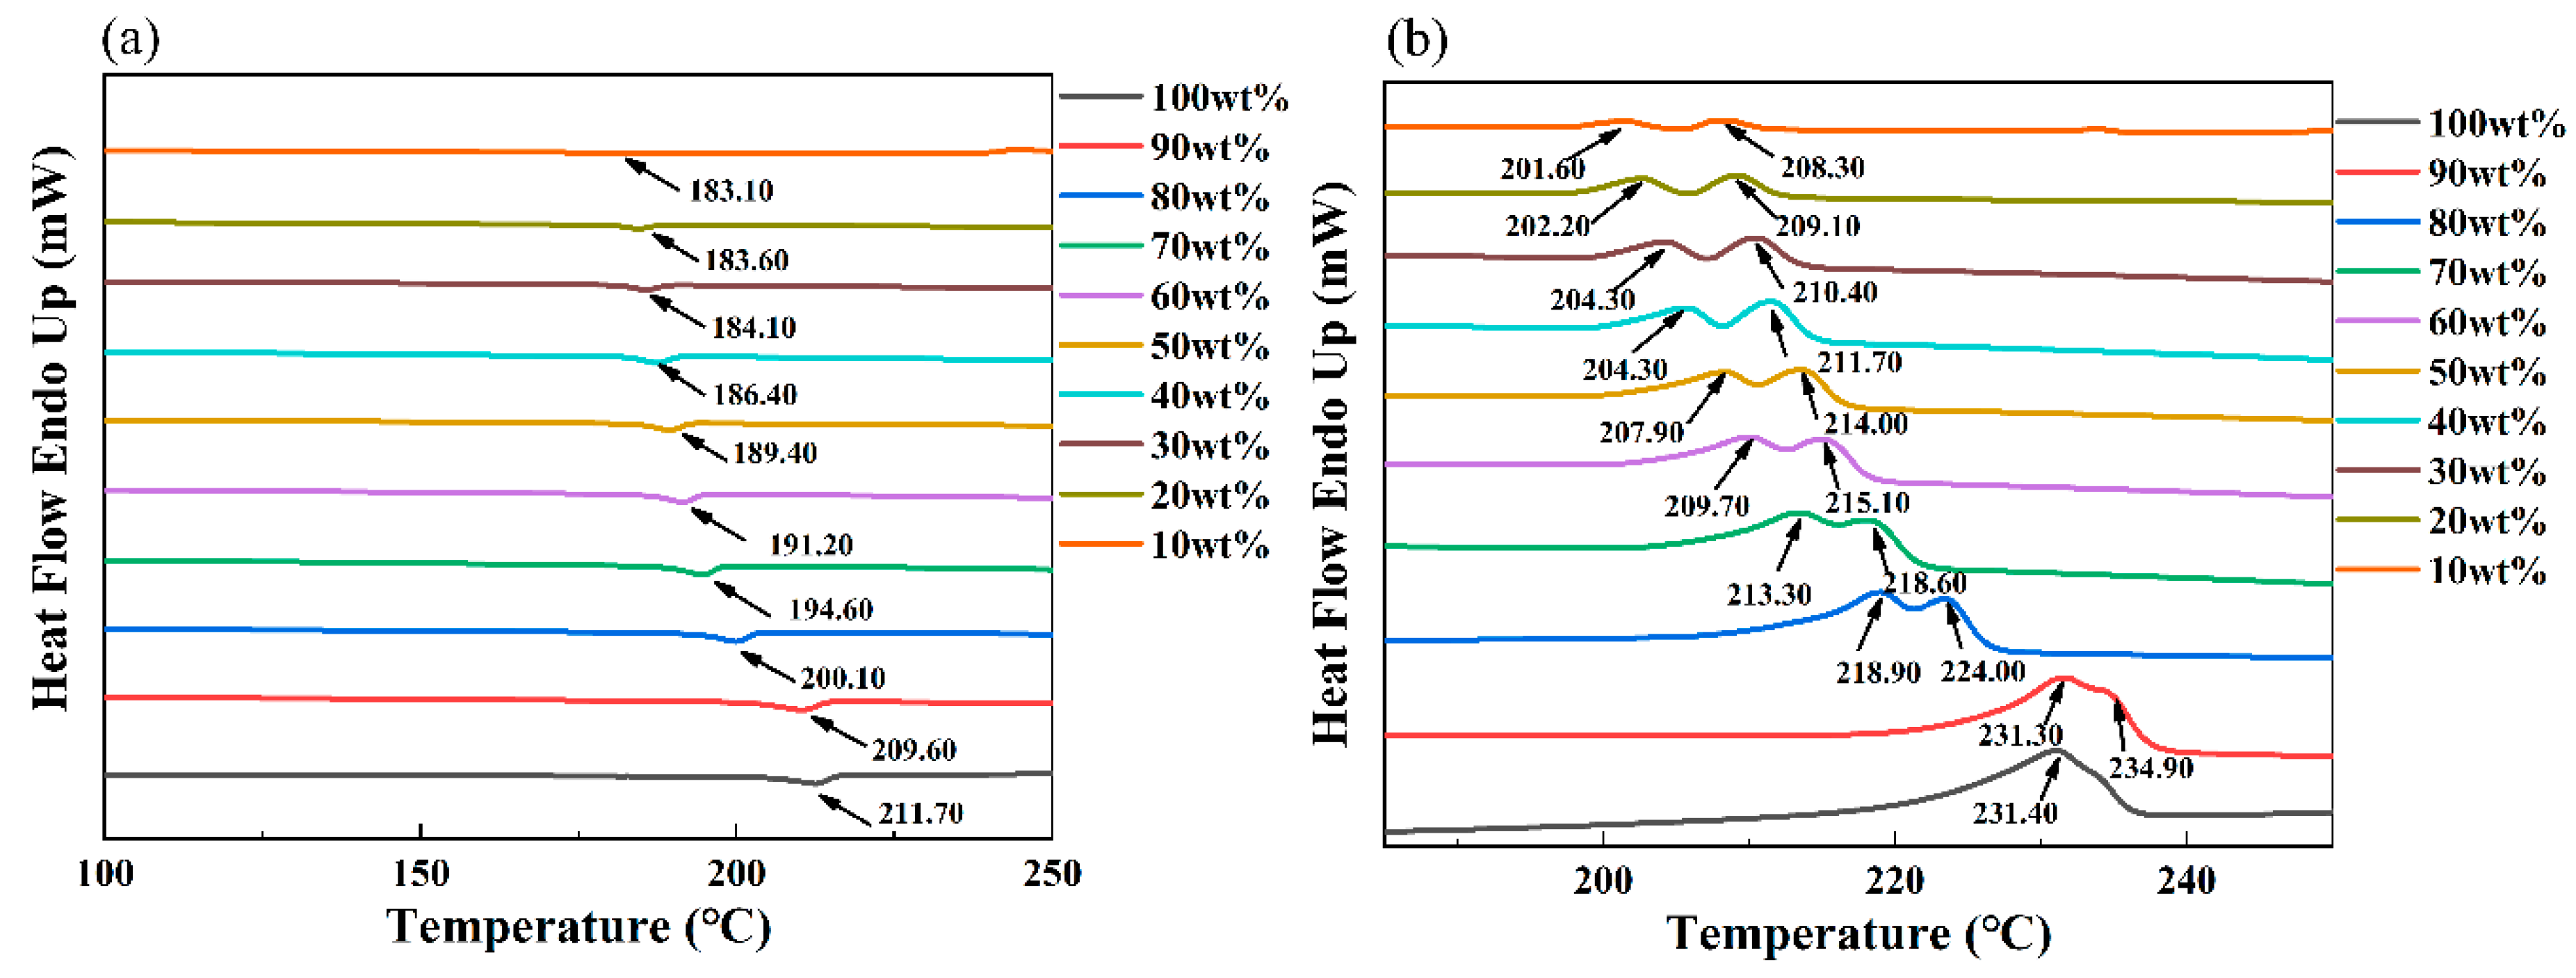
3.3. The Effect of the PMP Concentration on the Crystallization Behavior and Morphologies of the Membranes
3.4. Morphology and Performance of the PMP HF Membranes
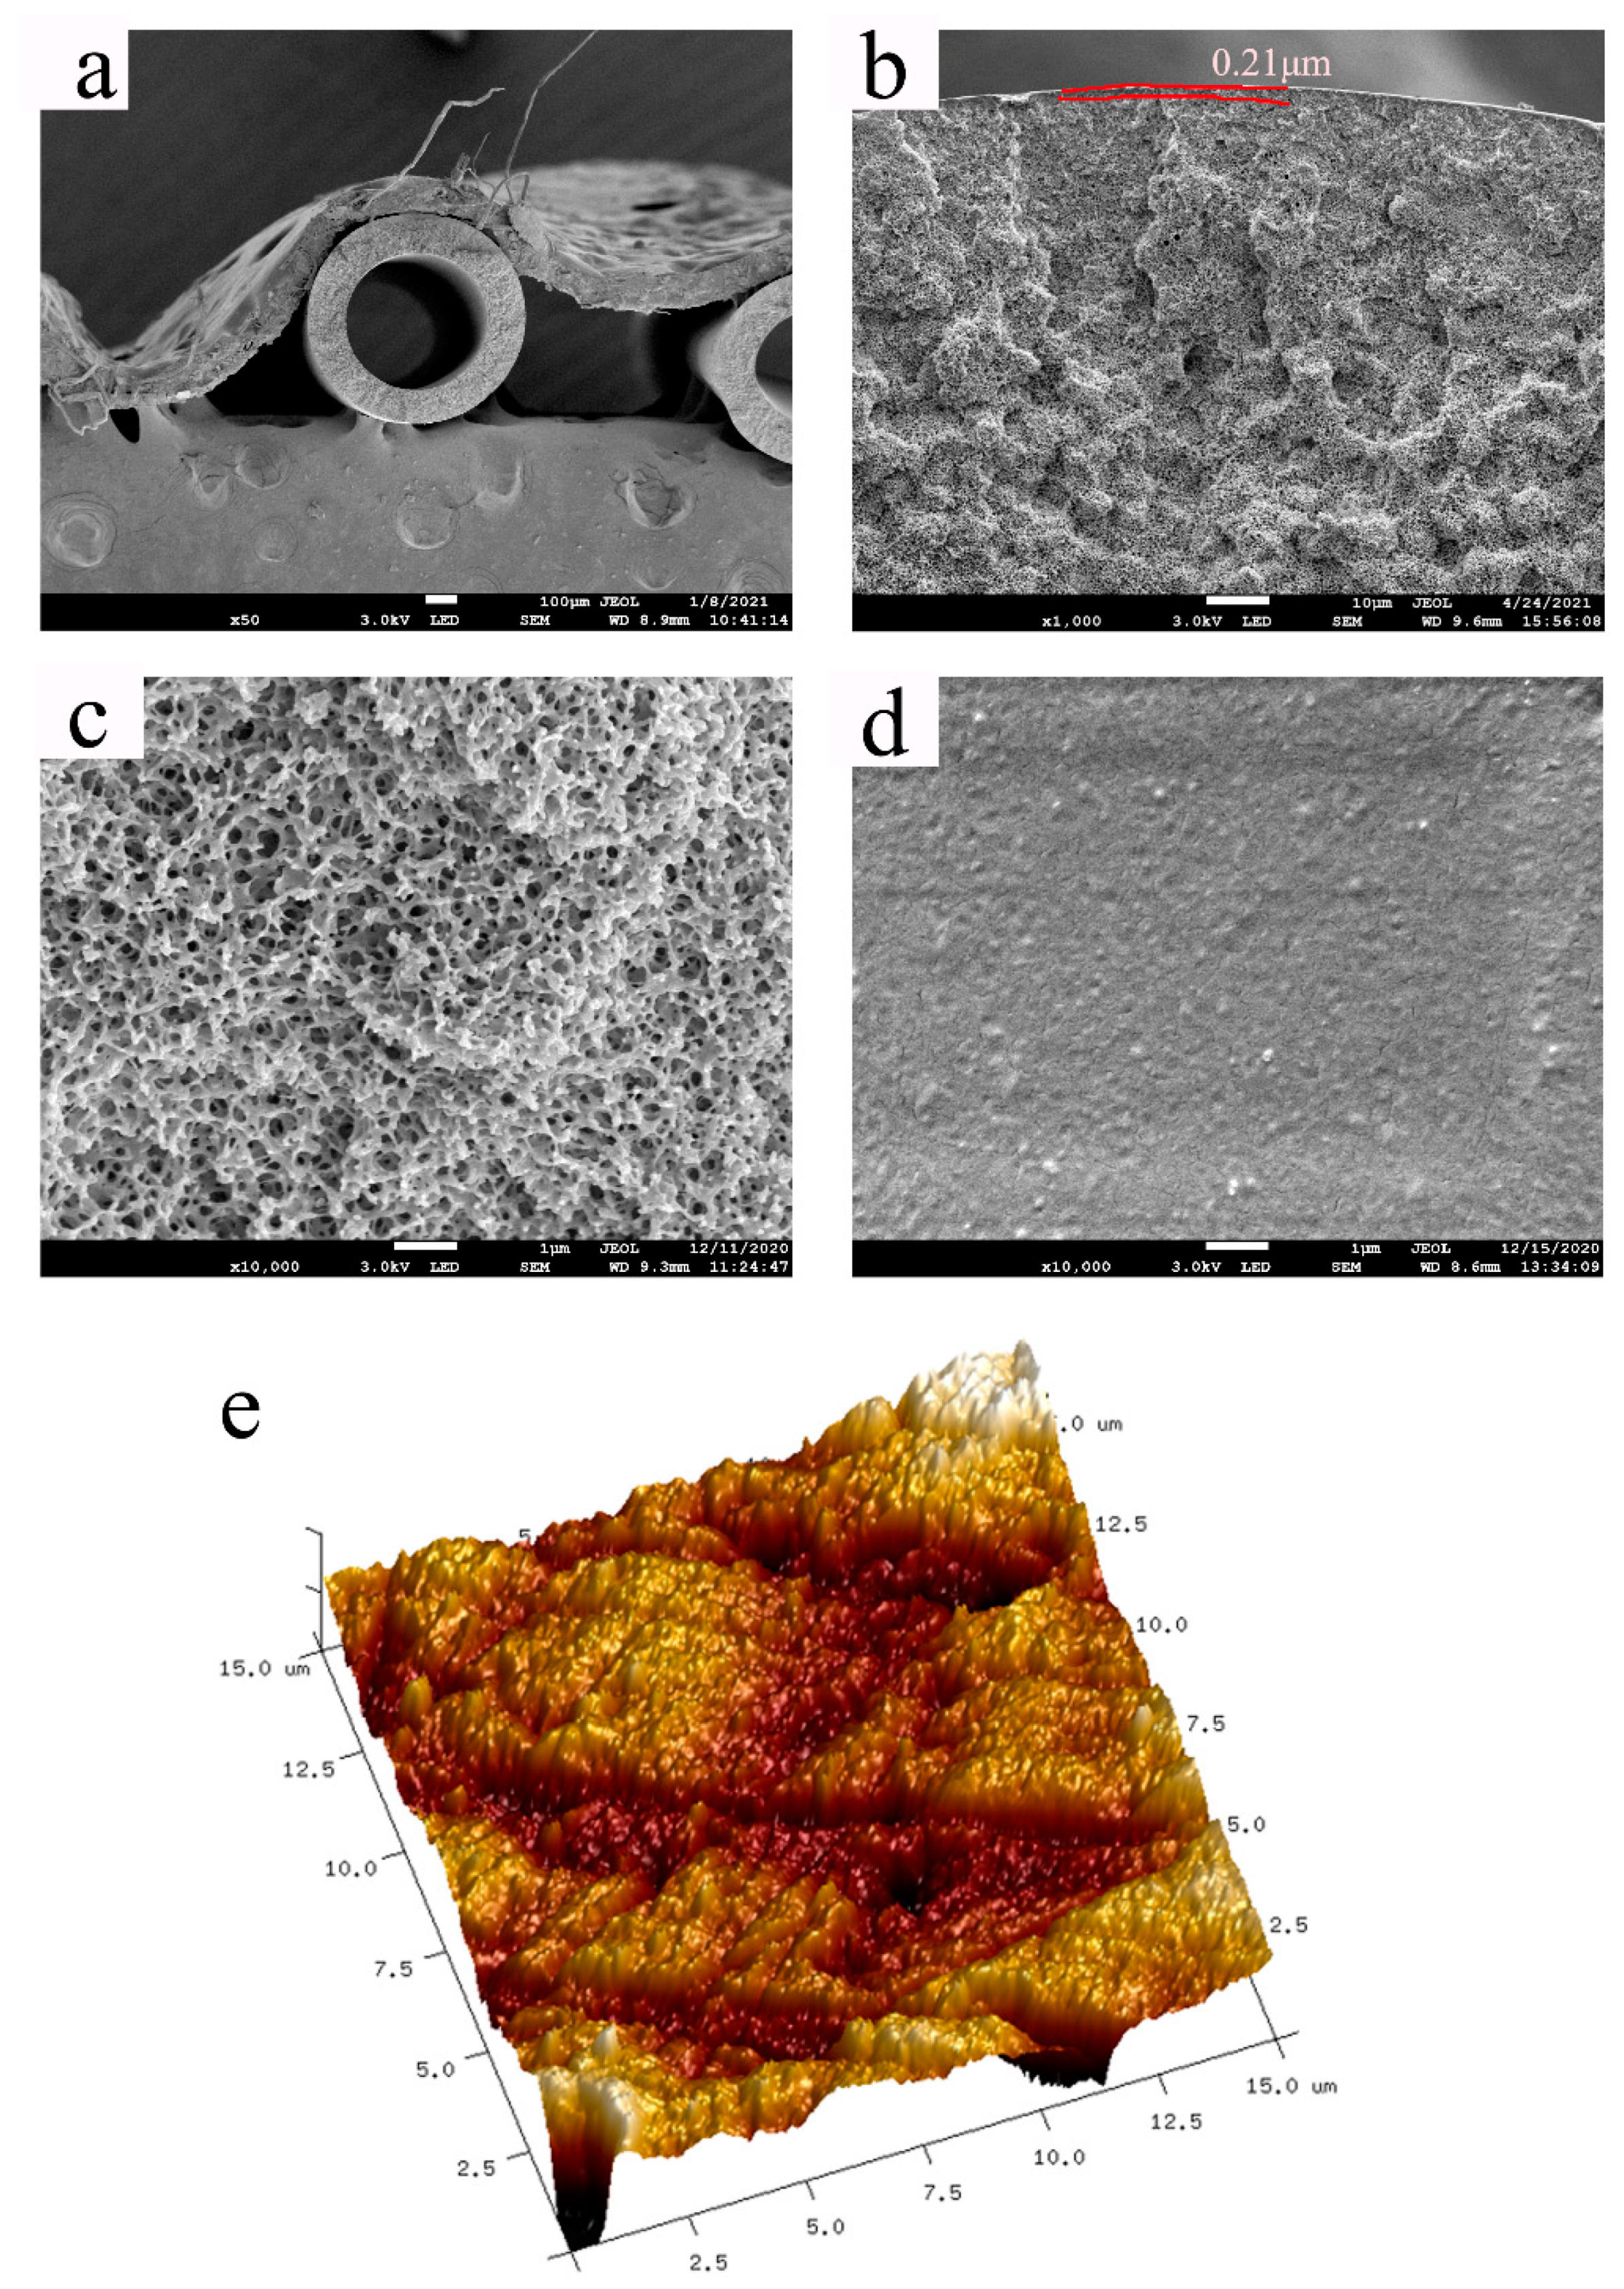
3.4.1. Morphology of the PMP HF Membranes
3.4.2. Performance of the PMP HF Membranes
4. Conclusions
Author Contributions
Funding
Institutional Review Board Statement
Informed Consent Statement
Data Availability Statement
Conflicts of Interest
Appendix A

| Groups | |||
|---|---|---|---|
| CCOOH | −0.29 | 0.90 | 3.74 |
| –CH3 | −0.97 | −1.64 | −0.78 |
| –CH2 | −0.03 | −0.30 | −0.41 |
| –CH< | 0.65 | 0.65 | −0.20 |
Appendix B
- (1)
- The fitting method of the binodal curve: according to the Flory-Huggins theory, the binodal curve in a polymer-diluent system satisfies the following equations:
- (2)
- The fitting method of the spinodal curve: In the Flory-Huggins theory, the spinodal curve should satisfy:
References
- Puleo, A.C.; Paul, D.R.; Wong, P.K. Gas sorption and transport in semicrystalline poly(4-methyl-1-pentene). Polymer 1989, 30, 1357–1366. [Google Scholar] [CrossRef]
- Markova, S.; Shalygin, M.; Pelzer, M.; Gries, T.; Teplyakov, V. Application prospects of dense gas separation hollow fibers based on poly(4-methyl-1-pentene). Chem. Pap. 2020, 74, 1917–1921. [Google Scholar] [CrossRef]
- Horton, S.; Thuys, C.; Bennett, M.; Augustin, S.; Rosenberg, M.; Brizard, C. Experience with the Jostra Rotaflow and Quad-rox(D) oxygenator for ECMO. Perfusion 2004, 19, 17–23. [Google Scholar] [CrossRef]
- Yeager, T.; Roy, S. Evolution of Gas Permeable Membranes for Extracorporeal Membrane Oxygenation. Artif. Organs 2017, 41, 700–709. [Google Scholar] [CrossRef] [Green Version]
- Lequier, L.; Horton, S.B.; McMullan, D.M.; Bartlett, R.H. Extracorporeal Membrane Oxygenation Circuitry. Pediatr. Crit. Care Med. 2013, 14, 7–12. [Google Scholar] [CrossRef] [Green Version]
- Lloyd, D.R.; Kinzer, K.E.; Tseng, H.S. Microporous membrane formation via thermally induced phase separation. I. Solid-liquid phase separation. J. Membr. Sci. 1990, 52, 239–261. [Google Scholar] [CrossRef]
- Zhang, Q.; Zhang, Y.Q.; Xia, D.W.; Zhao, Y.; Shi, Y.Q.; Jiao, Q.Z. Preparation of a Porous Structure in a Poly(4-Methyl-1-Pentene)/Diphenyl Ether System with a Thermally Induced Phase-Separation Method. J. Appl. Polym. Sci. 2009, 112, 1271–1277. [Google Scholar] [CrossRef]
- Müller, M.O.; Kessler, E.; Hornscheidt, R.R.; Frank, W.; Lang, A.J. Integrally asymmetrical polyolefin membrane for gas transfer. China Patent 1,121,896 C, 24 September 2003. [Google Scholar]
- Kessler, E.; Batzilla, T.; Wechs, F.; Wiese, F. Integrally Asymmetrical Polyolefin Membrane. China Patent 1,141,169 C, 10 March 2004. [Google Scholar]
- Kessler, E.; Batzilla, T.; Wechs, F.; Wiese, F. Method for producing an integrally asymmetrical polyolefin membrane. China Patent 1,136,035 C, 28 January 2004. [Google Scholar]
- Kessler, E.; Batzilla, T.; Wechs, F.; Wiese, F. Polyolefin membrane with an integrally asymmetric structure and method for the production thereof. China Patent 1,301,149 C, 21 February 2007. [Google Scholar]
- Tao, H.J.; Zhang, J.; Wang, X.L.; Gao, J.L. Phase separation and polymer crystallization in a poly(4-methyl-1-pentene)–dioctylsebacate–dimethylphthalate system via thermally induced phase separation. J. Polym. Sci. Part B Polym. Phys. 2007, 45, 153–161. [Google Scholar] [CrossRef]
- Tao, H.J.; Zhang, J.; Wang, X.L. Effect of diluents on the crystallization behavior of poly(4-methyl-1-pentene) and membrane morphology via thermally induced phase separation. J. Appl. Polym. Sci. 2008, 108, 1348–1355. [Google Scholar] [CrossRef]
- Tao, H.J.; Xia, Q.; Chen, S.J.; Zhang, J.; Wang, X.L. Solid-liquid phase separation of poly-4-methyl-1-pentene/diluent system via thermally induced phase separation. Desalination Water Treat. 2010, 17, 294–303. [Google Scholar] [CrossRef]
- Huang, X.; Wang, W.P.; Zheng, Z.; Wang, X.L.; Shi, J.L.; Fan, W.L.; Li, L.; Zhang, Z.B. Dissipative particle dynamics study and experimental verification on the pore morphologies and diffusivity of the poly (4-methyl-1-pentene)-diluent system via thermally induced phase separation: The effect of diluent and polymer concentration. J. Membr. Sci. 2016, 514, 487–500. [Google Scholar] [CrossRef]
- Huang, X. Fabrication of poly (4-methyl-1-pentene) hollow fiber membrane via thermally induced phase separation and its surface hemocompatibility modification. Master’s Thesis, Nanjing University, Nanjing, China, 2016. [Google Scholar]
- Tang, T.Y.; Xu, M.F.; Ling, T.; Huang, X.; Huang, S.; Fan, W.L.; Li, L. Computer simulation and experimental verification of morphology and gas permeability of poly(4-methyl-1-pentene) membranes: Effects of polymer chain and diluent extractant. J. Mater. Sci. 2019, 54, 10784–10797. [Google Scholar] [CrossRef]
- Zheng, Z. Study on Grafting Multi-Fluoro Molecules onto the Surface of Poly-4-Methyl-1-Pentene Hollow Fiber Membranes for Artificial Lungs. Master’s Thesis, Nanjing University, Nanjing, China, 2018. [Google Scholar]
- Voigt, I.; Ansorge, W.; Wilfa, F. For the Hollow-Fibre Membrane in Anaesthetic Circuit. China Patent 109,475,821 A, 20 April 2017. [Google Scholar]
- Jia, J.D.; Chen, M.Z. Preparation Method of Asymmetric Polyolefin Film. China Patent 110,548,411 A, 9 September 2019. [Google Scholar]
- Jia, J.D.; Chen, M.Z. Preparation Method of Asymmetric Polyolefin Film. China Patent 110,538,682 A, 9 September 2019. [Google Scholar]
- Jia, J.D.; Chen, M.Z.; Yu, J.D. Asymmetric Hydrophobic Polyolefin Hallow Fiber Membrane and Preparation Method and Application Thereof. China Patent 111,888,946 A, 17 August 2020. [Google Scholar]
- Lim, M.W. The history of extracorporeal oxgenators. Anaesthesia 2006, 61, 984–995. [Google Scholar] [CrossRef] [PubMed]
- Breiter, S. Biomaterials for Artificial Organs; Woodhead Pub Ltd.: Cambridge, UK, 2011; pp. 3–33. [Google Scholar]
- Lloyd, D.R.; Kim, S.S.; Kinzer, K.E. Microporous membrane formation via thermally induced phase separation. II. Liquid—liquid phase separation. J. Membr. Sci. 1991, 64, 1–11. [Google Scholar] [CrossRef]
- Kim, S.S.; Lloyd, D.R. Microporous membrane formation via thermally-induced phase separation. III. Effect of thermodynamic interactions on the structure of isotactic polypropylene membranes. J. Membr. Sci. 1991, 64, 13–29. [Google Scholar] [CrossRef]
- International agency for research on cancer. IARC Monographs on the Evaluation of Carcinogenic Risks to Humans; IARC Press: Lyon, France, 2012; Volume 101, 555p. [Google Scholar]
- Jubeen, F.; Liaqat, A.; Sultan, M.; Iqbal, S.Z.; Sajid, I.; Sher, F. Green synthesis and biological evaluation of novel 5-fluorouracil derivatives as potent anticancer agents. Saudi Pharm. J. 2019, 27, 1164–1173. [Google Scholar] [CrossRef] [PubMed]
- Ali, M.; Jahan, Z.; Sher, F.; Niazi, M.B.K.; Kakar, S.J.; Gul, S. Nano architectured cues as sustainable membranes for ultra-filtration in blood hemodialysis. Mater. Sci. Eng. C 2021, 128. [Google Scholar] [CrossRef]
- Narinder, K.; Vishal, C.; Anil, K.G. Essential fatty acids as functional components of foods—A review. J. Food Sci. Tech. 2014, 51, 2289–2303. [Google Scholar]
- Chen, L.; Liu, T.Z.; Zhang, W.; Chen, X.L.; Wang, J.F. Biodiesel production from algae oil high in free fatty acids by two-step catalytic conversion. Bioresour. Technol. 2012, 111, 208–214. [Google Scholar] [CrossRef]
- Florindo, C.; Romero, L.; Rintoul, I.; Branco, L.C.; Marrucho, I.M. From phase change materials to green solvents: Hydrophobic low viscous fatty acid–based deep eutectic solvents. ACS Sustain. Chem. Eng. 2018, 6, 3888–3895. [Google Scholar] [CrossRef]
- Khan, N.A.; Niazi, M.B.K.; Sher, F.; Jahan, Z.; Noor, T.; Azhar, O.; Rashid, T.; Iqbal, N. Metal Organic Frameworks Derived Sustainable Polyvinyl Alcohol/Starch Nanocomposite Films as Robust Materials for Packaging Applications. Polymers 2021, 13, 2307. [Google Scholar] [CrossRef]
- Altaf, F.; Niazi, M.B.K.; Jahan, Z.; Ahmad, T.; Akram, M.A.; Safdar, A.; Butt, M.S.; Noor, T.; Sher, F. Synthesis and characterization of pva/starch hydrogel membranes incorporating essential oils aimed to be used in wound dressing applications. J. Polym. Environ. 2021, 29, 156–174. [Google Scholar] [CrossRef]
- Hansen, C.M. Hansen Solubility Parameters. A User’s Handbook, 2nd ed.; CRC Press: New York, NY, USA, 2007. [Google Scholar]
- Stefanis, E.; Constantinou, L.; Tsivintzelis, I.; Panayiotou, C. New group-contribution method for predicting temperature-dependent properties of pure organic compounds. Int. J. Thermophys. 2005, 26, 1369–1388. [Google Scholar] [CrossRef]
- Stefanis, E.; Panayiotou, C. Prediction of Hansen solubility parameters with a new group-contribution method. Int. J. Thermophys. 2008, 29, 568–585. [Google Scholar] [CrossRef]
- De La Peña-Gil, A.; Toro-Vazquez, J.F.; Rogers, M.A. Simplifying Hansen solubility parameters for complex edible fats and oils. Food Biophys. 2016, 11, 283–291. [Google Scholar] [CrossRef]
- Venkatram, S.; Kim, C.; Chandrasekaran, A.; Ramprasad, R. Critical assessment of the Hildebrand and Hansen solubility parameters for polymers. J. Chem. Inf. Model. 2019, 59, 4188–4194. [Google Scholar] [CrossRef] [PubMed]
- Olabisi, O.; Robeson, L.M.; Shaw, M.T. Polymer-Polymer Miscibility, 1st ed.; Academic Press: New York, NY, USA, 1979. [Google Scholar]
- Lim, G.B.A.; Kim, S.S.; Ye, Q.H.; Wang, Y.F.; Lloyd, D.R. Microporous membrane formation via thermally-induced phase separation. IV. Effect of isotactic polypropylene crystallization kinetics on membrane structure. J. Membr. Sci. 1991, 64, 31–40. [Google Scholar] [CrossRef]
- McGuire, K.S.; Lloyd, D.R.; Lim, G.B.A. Microporous membrane formation via thermally-induced phase separation. VII. Effect of dilution, cooling rate, and nucleating agent addition on morphology. J. Membr. Sci. 1993, 79, 27–34. [Google Scholar] [CrossRef]
- Nakajima, A.; Hayashi, S.; Taka, T. Melting behavior of poly-4-methyl-pentene-1 single crystals. Kolloid Z. Z. Polym. 1969, 233, 869–878. [Google Scholar] [CrossRef]
- Nakajima, A.; Hayashi, S. Single crystals of polyvinyl chloride polymerized at various temperatures. Kolloid Z. Z. Polym. 1969, 229, 12–17. [Google Scholar] [CrossRef]
- Nakajima, A.; Hayashi, S.; Nishimura, H. Change in lamellar thickness of polyethylene single crystal during isothermal annealing in bulk. Kolloid Z. Z. Polym. 1969, 229, 107–116. [Google Scholar] [CrossRef]
- Charlet, G.; Delmas, G.; Revol, J.F.; Manley, R.S. Effect of solvent on the polymorphism of poly(4-methylpentene-1): 1. Solution-grown single crystals. Polymer 1984, 25, 1613–1618. [Google Scholar] [CrossRef]
- Charlet, G.; Delmas, G. Effect of solvent on the polymorphism of poly(4-methylpentene-1): 2. Crystallization in semi-dilute solutions. Polymer 1984, 25, 1619–1625. [Google Scholar] [CrossRef]
- Rodriguez, F.J.M.; Phillips, P.J.; Lin, J.S.; Campos, R. The triple melting behavior of poly(ethylene terephthalate): Molecular weight effects. J. Polym. Sci. Part B. Polym. Phys. 1997, 35, 1757–1774. [Google Scholar] [CrossRef]
- Rodriguez, F.J.M.; Phillips, P.J.; Lin, J.S.; Avila-Orta, C.A. Triple melting behavior of poly(ethylene terephthalateco-1,4-cyclohexylene dimethylene terephthalate) random copolyesters. J. Polym. Sci. Part B Polym. Phys. 1998, 36, 763–781. [Google Scholar] [CrossRef]
- Daniel, C.; Vitillo, J.G.; Fasano, G.; Guerra, G. Aerogels and polymorphism of isotactic poly(4-methyl-pentene-1). ACS Appl. Mater. Interfaces 2011, 3, 969–977. [Google Scholar] [CrossRef]
- Akbari, A.; Hamadanian, M.; Jabbari, V.; Lehi, A.Y.; Bojaran, M. Influence of PVDF concentration on the morphology, surface roughness, crystalline structure, and filtration separation properties of semicrystalline phase inversion polymeric membranes. Desalination Water Treat 2012, 46, 96–106. [Google Scholar] [CrossRef]
- Young, R.J.; Lovell, P.A. Introduction to Polymers, 2nd ed.; Chapman & Hall: London, UK, 1991. [Google Scholar]


| Year | Main Authors [References] | Key Diluents | Membrane Geometry | Comments |
|---|---|---|---|---|
| 1990 | Lloyd D.R. [6] | mineral oil (MO) * | Flat sheet (FS) | Membranes prepared presented flaky crystal structures due to the solid-liquid phase separation. |
| 2003 | Müller M.O. [8] | dioctyl adipate (DOA) + glycerol triacetate (GTA); | HF | Membranes prepared presented bicontinuous cross-section structures beneath an ultrathin surface layer. |
| 2004, 2007 | Kessler E. [9,10,11] | dibutyl phthalate (DBP) *; diphenyl ether (DPE) *; DOA *; Palm kernel oil *; coconut oil *; dioctyl phthalate (DOP) + GTA; DOA + GTA; DBP + GTA | HF | Membranes prepared presented bicontinuous cross-section structures beneath ultrathin surface layers for all the diluent mixtures and some single diluent systems (such as DPE, Palm kernel oil, and coconut oil) |
| 2007–2010 | Zhang J. [12,13,14] | dioctyl sebacate (DOS) + dimethyl phthalate (DMP); DBP + DOP; DOP *; DOA * | FS | Spherulitic structures were formed when the DOP or DOA was the single diluent and could be replaced by cellular structure by adding a poor solvent; Membranes prepared presented bicontinuous structures as the weight ratio of DOS:DMP = 1:1 |
| 2009 | Xia D. [7] | DPE * | FS | Variant pore structures were formed at different PMP concentrations and cooling rates; spinodal decomposition occurred and bicontinuous structure could be found as the PMP concentration was lower than 30 wt%. |
| 2016 | Li L. [15,16,17,18] | DOP *; DPE *; DBP *; DBP + DOP; | HF | DOP, as a good diluent, provided smaller and more inter-connected pores, with the highest porosity and gas permeation values; DPE and DBP, as relatively poor diluents, presented larger and less inter-connected pores, with lower porosity and gas permeation values. |
| 2017 | Voigt I [19] | DOA + GTA | HF | Membranes prepared presented bicontinuous cross-section structures beneath an ultrathin surface layer. |
| 2019–2020 | Jia J. [20,21,22] | dibutyl sebacate (DBS) + castor oil (CO); methyl 12-hydroxystearate (MHS) + DOA; MHS + dimethyl phthalate (DMP); | HF | Membranes prepared presented asymmetric bicontinuous cross-section structures beneath dense surface layers. |
| Component Name | Chemical Formula | Structure | Melting Point/°C | Boiling Point/°C | The Molecular Weight/Da |
|---|---|---|---|---|---|
| PMP | [C6H12]n | 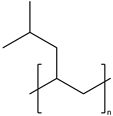 | 231.40 | - | 87,200 |
| LA | C12H24O2 | 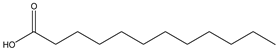 | 44–46 | 298.90 | 200.36 |
| MA | C14H28O2 | 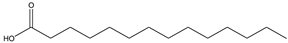 | 58.00 | 250.50 | 228.37 |
| PA | C16H32O2 | 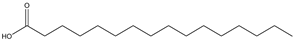 | 63.10 | 351.00 | 256.42 |
| SA | C18H36O2 |  | 67.00 ~69.00 | 361.00 | 284.48 |
| Polymer or Diluent | (MPa1/2) | (MPa1/2) | (MPa1/2) | Ra | Membrane Cross-Section Structure |
|---|---|---|---|---|---|
| PMP | 16.60 b | 4.80 b | 5.20 b | - | - |
| LA | 15.80 b | 3.60 b | 6.80 b | 2.60 | Flaky crystal with a PMP concentration of 20–30 wt%. |
| MA | 15.70 b | 3.00 b | 6.00 b | 2.70 | Bicontinuous with a PMP concentration of 20–30 wt%. |
| PA | 15.70 b | 2.40 b | 5.20 b | 3.00 | Cellular with a PMP concentration of 20–30 wt%. |
| SA | 15.60 b | 1.70 b | 4.30 b | 3.70 | Cellular with a PMP concentration of 20-–30 wt%. |
| DBP | 17.80 a | 8.60 a | 4.10 a | 4.60 | Bicontinuous with a PMP concentration of 30–35 wt% [17,18]. |
| DPE | 19.50 a | 3.40 a | 5.80 a | 6.00 | Bicontinuous with a PMP concentration of 30–35 wt% [7]. |
| DOP | 16.60 a | 7.00 a | 3.10 a | 3.10 | Bicontinuous with a PMP concentration of 30–35 wt% [19]. |
| DOA | 16.70 a | 2.00 a | 5.10 a | 2.60 | Flaky crystal with a PMP concentration of 20–60 wt% [16]. |
| PMP Concentration/wt% | Melting Enthalpy/J/g | Initial Crystallization Temperature/°C | Final Crystallization Temperature/ °C | Peak Crystallization Temperature/ °C | Peak Temperature Difference/°C | Crystallinity/% |
|---|---|---|---|---|---|---|
| 10 | 1.27 | 181.10 | 185.90 | 183.10 | 4.85 | 10.80 |
| 20 | 3.98 | 180.10 | 189.20 | 183.60 | 9.07 | 16.96 |
| 30 | 5.20 | 179.80 | 191.00 | 184.10 | 11.18 | 14.76 |
| 40 | 7.23 | 180.70 | 192.70 | 186.40 | 11.97 | 15.86 |
| 50 | 9.22 | 184.30 | 194.30 | 189.40 | 10.02 | 15.74 |
| 60 | 11.10 | 185.50 | 195.50 | 191.20 | 10.02 | 15.79 |
| 70 | 13.40 | 186.10 | 199.40 | 194.60 | 13.26 | 16.33 |
| 80 | 17.16 | 192.50 | 205.70 | 200.10 | 13.24 | 18.30 |
| 90 | 19.41 | 199.10 | 216.00 | 209.60 | 16.86 | 18.40 |
| 100 | 23.56 | 201.70 | 218.90 | 211.70 | 17.26 | 20.10 |
| Property | Value | Literature Value |
|---|---|---|
| Outer diameter/μm | 900 ± 100 | 1000 ± 200 [16,17] |
| Inner diameter/μm | 600 ± 100 | 600 ± 200 [16,17] |
| The thickness of the dense surface layer/μm | 0.21 | 2–3 [17,19] |
| Porosity/% | 60–70 | 40–70 [17,19] |
| Surface contact angle/° | 105.80 | - |
| Tensile strength/cN | 96 | 40–180 [9] |
| Nitrogen flux/mL·(bar·cm2·min)−1 | 8.20 ± 0.10 | 0–1 [12] |
Publisher’s Note: MDPI stays neutral with regard to jurisdictional claims in published maps and institutional affiliations. |
© 2021 by the authors. Licensee MDPI, Basel, Switzerland. This article is an open access article distributed under the terms and conditions of the Creative Commons Attribution (CC BY) license (https://creativecommons.org/licenses/by/4.0/).
Share and Cite
Tang, Y.; Li, M.; Lin, Y.; Wang, L.; Wu, F.; Wang, X. A Novel Green Diluent for the Preparation of Poly(4-methyl-1-pentene) Membranes via a Thermally-Induced Phase Separation Method. Membranes 2021, 11, 622. https://doi.org/10.3390/membranes11080622
Tang Y, Li M, Lin Y, Wang L, Wu F, Wang X. A Novel Green Diluent for the Preparation of Poly(4-methyl-1-pentene) Membranes via a Thermally-Induced Phase Separation Method. Membranes. 2021; 11(8):622. https://doi.org/10.3390/membranes11080622
Chicago/Turabian StyleTang, Yuanhui, Mufei Li, Yakai Lin, Lin Wang, Fangyu Wu, and Xiaolin Wang. 2021. "A Novel Green Diluent for the Preparation of Poly(4-methyl-1-pentene) Membranes via a Thermally-Induced Phase Separation Method" Membranes 11, no. 8: 622. https://doi.org/10.3390/membranes11080622
APA StyleTang, Y., Li, M., Lin, Y., Wang, L., Wu, F., & Wang, X. (2021). A Novel Green Diluent for the Preparation of Poly(4-methyl-1-pentene) Membranes via a Thermally-Induced Phase Separation Method. Membranes, 11(8), 622. https://doi.org/10.3390/membranes11080622