Article

Entamoeba histolytica: Proteomics Bioinformatics Reveal Predictive Functions and Protein–Protein Interactions of Differentially Abundant Membrane and Cytosolic Proteins

by
Norhidayah Azmi
and
Nurulhasanah Othman
*
Institute for Research in Molecular Medicine (INFORMM), Universiti Sains Malaysia, Pulau Pinang 11800, Malaysia
*
Author to whom correspondence should be addressed.
Membranes 2021, 11(6), 376; https://doi.org/10.3390/membranes11060376
Submission received: 30 March 2021 / Revised: 18 May 2021 / Accepted: 18 May 2021 / Published: 21 May 2021
(This article belongs to the Special Issue Biomolecules in Cell Membranes: Structure and Dynamics)

Abstract

:
Amoebiasis is caused by Entamoeba histolytica and ranked second for parasitic diseases causing death after malaria. E. histolytica membrane and cytosolic proteins play important roles in the pathogenesis. Our previous study had shown several cytosolic proteins were found in the membrane fraction. Therefore, this study aimed to quantify the differential abundance of membrane and cytosolic proteins in membrane versus cytosolic fractions and analyze their predicted functions and interaction. Previous LC-ESI-MS/MS data were analyzed by PERSEUS software for the differentially abundant proteins, then they were classified into their functional annotations and the protein networks were summarized using PantherDB and STRiNG, respectively. The results showed 24 (44.4%) out of the 54 proteins that increased in abundance were membrane proteins and 30 were cytosolic proteins. Meanwhile, 45 cytosolic proteins were found to decrease in abundance. Functional analysis showed differential abundance proteins involved in the molecular function, biological process, and cellular component with 18.88%, 33.04% and, 48.07%, respectively. The STRiNG server predicted that the decreased abundance proteins had more protein–protein network interactions compared to increased abundance proteins. Overall, this study has confirmed the presence of the differentially abundant membrane and cytosolic proteins and provided the predictive functions and interactions between them.

1. Introduction

Amoebiasis or amoebic dysentery is a protozoan disease caused by Entamoeba histolytica, which is mainly found in the human colon. It may exist as a non-pathogenic commensal or penetrate the intestinal mucosa and metastasize to cause an extraintestinal infection like an amoebic liver abscess (ALA) [1]. The parasite has a simple two-stage life cycle including trophozoite and cyst stages. Infection of a human by E. histolytica begins by ingestion of the cyst, which is protected from the environment by a highly resistant chitin-containing cell wall [2]. Trophozoites penetrate the intestinal mucus layer that develops colitis in the colon during the disease-causing process. Trophozoite invasion includes the destruction of epithelial cells, lymphocytes, and polymorphonuclear cells [2].
Many studies have been performed on the trophozoites form because it is easy to cultivate. During the infection, surface molecules of trophozoites connect the host to the parasite, which is crucial in tissue invasion, colitis induction, and the development of liver abscess [3]. However, little is understood about the E. histolytica membrane molecules. Membrane proteins can be found on the cell surface, reticulum endoplasm (ER), Golgi apparatus, endomembrane, mitochondria and nucleus. In E. histolytica, host–parasite interactions occur on the membrane surface, which is the outer layer of the trophozoites, and the adherence process is initiated by Gal/GalNAc lectin membrane protein, which is the first step in developing the disease. This adherence is important in mediating killing and/or phagocytosis and exposing the surface molecules to the host’s immune system [2].
Membrane proteins possess transmembrane (TM) domains, which differentiate them from cytosolic proteins [4]. They are responsible for cellular adhesion and recognition, molecular receptors, substrate transportation through membranes, signal transduction, protein secretion, enzymatic activity [5] and/or signal peptides, which assists protein positioning in cellular organelles or the cell membrane [6]. To date, only around 20 proteins or protein families of E. histolytica membrane have been identified [3]. Therefore, it is important to further identify E. histolytica membrane proteins since a majority of the protein functions are unexplored.
Critical steps for protein analysis in a biological context are extraction and isolation of proteins from chemical and physical interactions with other biomolecules from specific cells [7]. Hence, our previous extensive study (Ujang et al., (2018) [7]) performed three different extraction methods to fractionate membrane and cytosolic proteins of E. histolytica trophozoites. The extractions were performed to isolate the total membrane and not for an organelle specific-membrane fraction. The membrane and cytosolic fractions were analyzed by LC-ESI-MS/MS for protein identification to indicate the presence or absence of the membrane and cytosolic proteins in the fractions. The result showed a commercial kit, ProteoPrep (Sigma-Aldrich, Darmstadt, Germany) was the best method for the membrane protein extraction in terms of its sensitivity and specificity by analyzing membrane and cytosolic fractions. Mixed membrane and cytosolic proteins accounted for 267, 127 and 130 identified proteins in both fractions [7]. The cytosolic proteins were found to be present in the membrane fraction from the three extraction methods. This phenomenon has raised our curiosity as to whether the cytosolic proteins were really located and worked hand in hand with the membrane proteins or this phenomenon occurred because of the technique used during the membrane extraction step.
Using the previous MS data of label-free quantification [7], we aimed to analyze the differential abundance proteins in membrane versus cytosolic fractions of E. histolytica. The differentially abundant proteins were analyzed using bioinformatics platforms to further understand the predictive biological functions and interactions among the proteins. In this study, the TM and signal peptide domains of identified proteins were obtained from AmoebaDB database. The database uses a specific algorithm to predict the presence of these domains in the protein. We hypothesized that the membrane proteins were increased while cytosolic proteins were decreased in abundance by comparing the membrane versus cytosolic fractions. If there were increased abundance of membrane and cytosolic proteins in the membrane fraction, we postulated there were protein–protein interactions between these two proteins. This would therefore strengthen the notion that the cytosolic proteins localized to the membrane part and functioned together with membrane proteins in E. histolytica.

2. Materials and Methods

2.1. PERSEUS Software Platform Analysis

MS data of LFQ from three different extraction methods by Ujang et al., (2018) [7] were retrieved from ProteomeXchange with identifier no. PXD010171 for differential protein abundant analysis in membrane versus cytosolic fractions using PERSEUS MaxQuant software (MaxPlanck Institute of Biochemistry, Martinsried, Germany). The LFQ intensities were based on 267, 127 and 130 identified proteins in both fractions [7]. In this study, the LFQ intensities of the membrane fraction was the numerator and the cytosolic fraction was the denominator. Therefore, the differential abundance proteins presented in the result were on the proteins of the membrane fraction. The PERSEUS integrates a multitude of algorithms enabling complete analysis of MS data starting from raw LC-MS runs. Firstly, Perseus.exe was downloaded from the website www.maxquant.net/perseus/ (accessed on: 06.05.2020). The Generic Matrix Upload icon was clicked, and the icon box was selected. A new window popped out. The data frame was composed by selecting data features carefully inside the right box. The LFQ intensities of membrane and cytosolic proteins of three extraction methods were uploaded for quantification and statistical analyses along with other parameters, i.e., accession no., description of protein, score, number of peptides and coverage. Log in transformation parameter and base parameters were selected to transform the data in order to facilitate the protein abundance fold change calculation in the analysis. For data analysis, there were four different statistical tests offered by Perseus; one sample, two samples, multiple samples, and two-way ANOVA. This study used t-test for two group analysis. The q-value and False Discovery Rate (FDR) calculated were set-up to show a cut-off curve indicating which proteins were significant. The S0 (fold-change) and FDR were set to 0 and q < 0.05, respectively. Then, a volcano plot was visualized by setting the x and y-axis with log2 fold changes and −log10 p-values, respectively. This was done to visualize the potential or significant proteins located in the right and left of the quadrant’s plot. Finally, the statistical results were saved by exporting to a file or in .txt and it could be opened either in Excel or Perseus software. The proteins that showed differences in the fold-change (Fc) > 2 and q < 0.01 were considered significant.

2.2. Determination of Transmembrane and Signal Peptide Domains

The accession no. of differentially abundant proteins was searched against the AmoebaDB database release 47 (accessed on 10 June 2020). Then, information on the presence of transmembrane and signal peptide domains were obtained from the protein properties and features section.

2.3. Gene Ontology

Classification of the differential abundant proteins into their molecular function, biological process, and cellular component was performed by the Protein ANalysis THrough Evolutionary Relationship (PANTHER) DB version 15.0 system at www.pantherdb.org (accessed on 17 June 2020). The Gene List Analysis page was browsed, the accession number of the increased or decreased abundant proteins with fold –change (Fc) > 2 and q < 0.05 were typed in the box and the ID list was ticked. Then, E. histolytica was selected as the ID and functional classification was viewed in the gene list. The submit button was clicked to generate pie charts. The result was based on the analysis that was selected, i.e., Functional Classification Viewed in the Gene List. It displayed a gene list indicating mapped and unmapped genes. The system brought up the family list page if PANTHER Generic Mapping file or ID’s from Reference Proteome Genome file was selected as an input file. A multi-coloured pie chart icon was clicked to display the functional analysis results of all the proteins involved in molecular function, biological process, cellular components, and protein classes and their related pathways. Category name, and series of numbers appeared when the mouse was moved over the pie chart. The numbers represented statistics of the selected category. The legend link on the right side of the pie chart also could be used to retrieve a gene list of the category.

2.4. Protein–Protein Interaction Network Prediction

The www.string-db.org (version 11, accessed on 20 June 2020) webpage was navigated to analyze protein–protein interaction networks. STRiNG provides a database of known and predicted protein–protein interactions including indirect (functional) and direct (physical) associations arising from computational prediction, knowledge transferable and primary databases, such as participating in the same biological process or protein class (gene ontology). STRiNG (Search Tool for Retrieval of Interacting Genes/Proteins) can be searched by single or multiple protein names, or by amino acid sequences in any available formats. In this study, a total of 99 accession numbers derived from 54 and 45 increased and decreased abundant proteins was inserted as protein identifier. The multiple proteins input was selected. Then, the organism of interest (E. histolytica) was specified before clicking the SEARCH button. Then, the network was displayed to show the predicted network of association for a group of proteins. Proteins were represented by the nodes, and edges showed predicted functional associations. By clicking on a node gave several details of the protein and the edge displayed a detailed evidence breakdown. The line or edge could be seen in seven different colors, which represented different evidence used in protein relation prediction. The protein window provided information about the protein and other links related to the protein.

3. Results

3.1. Differential Abundant Proteins

By combining the results from mass spectrometry analysis of three extraction methods by Ujang et al., 2018 [7], a total of 99 differentially abundant proteins with 54 increased and 45 decreased abundance in membrane versus cytosolic fractions fulfilled the chosen criteria of protein fold-change (Fc) > 2 fold and q < 0.05 (Table 1). Furthermore, 24 of the increased abundant proteins were predicted as membrane proteins (Table 2) and there was no membrane protein from decreased abundance proteins (Table 3).

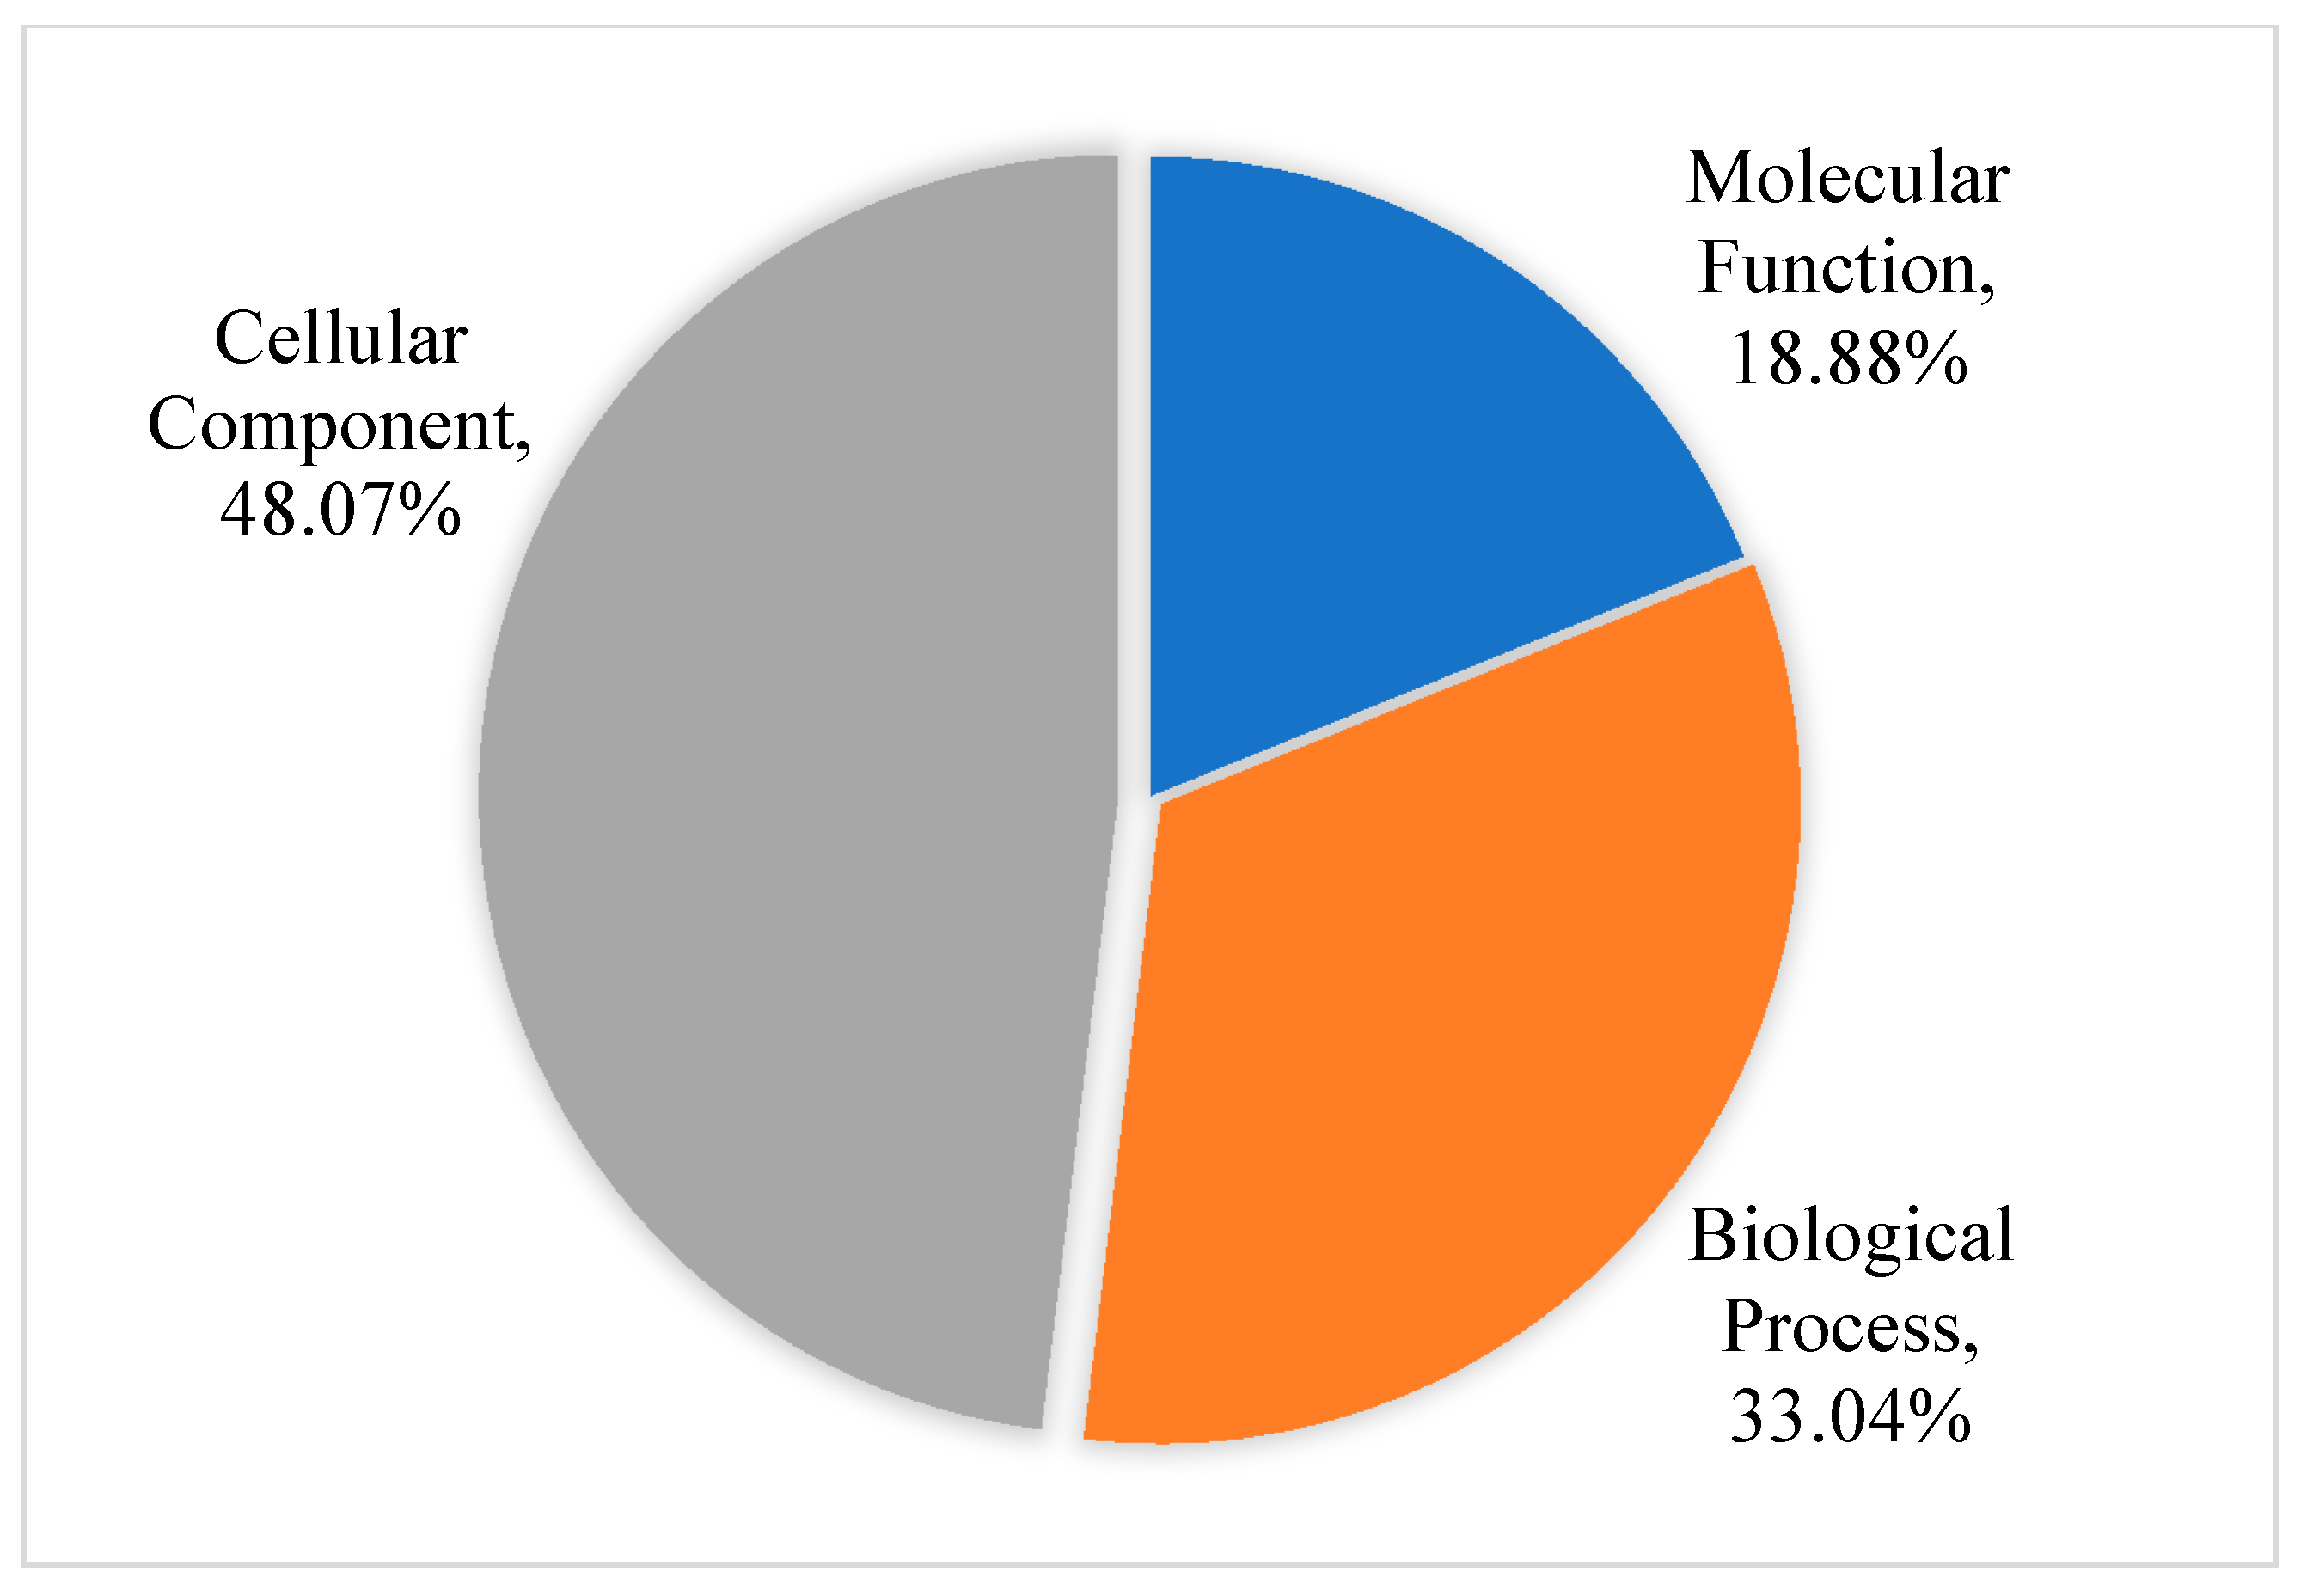
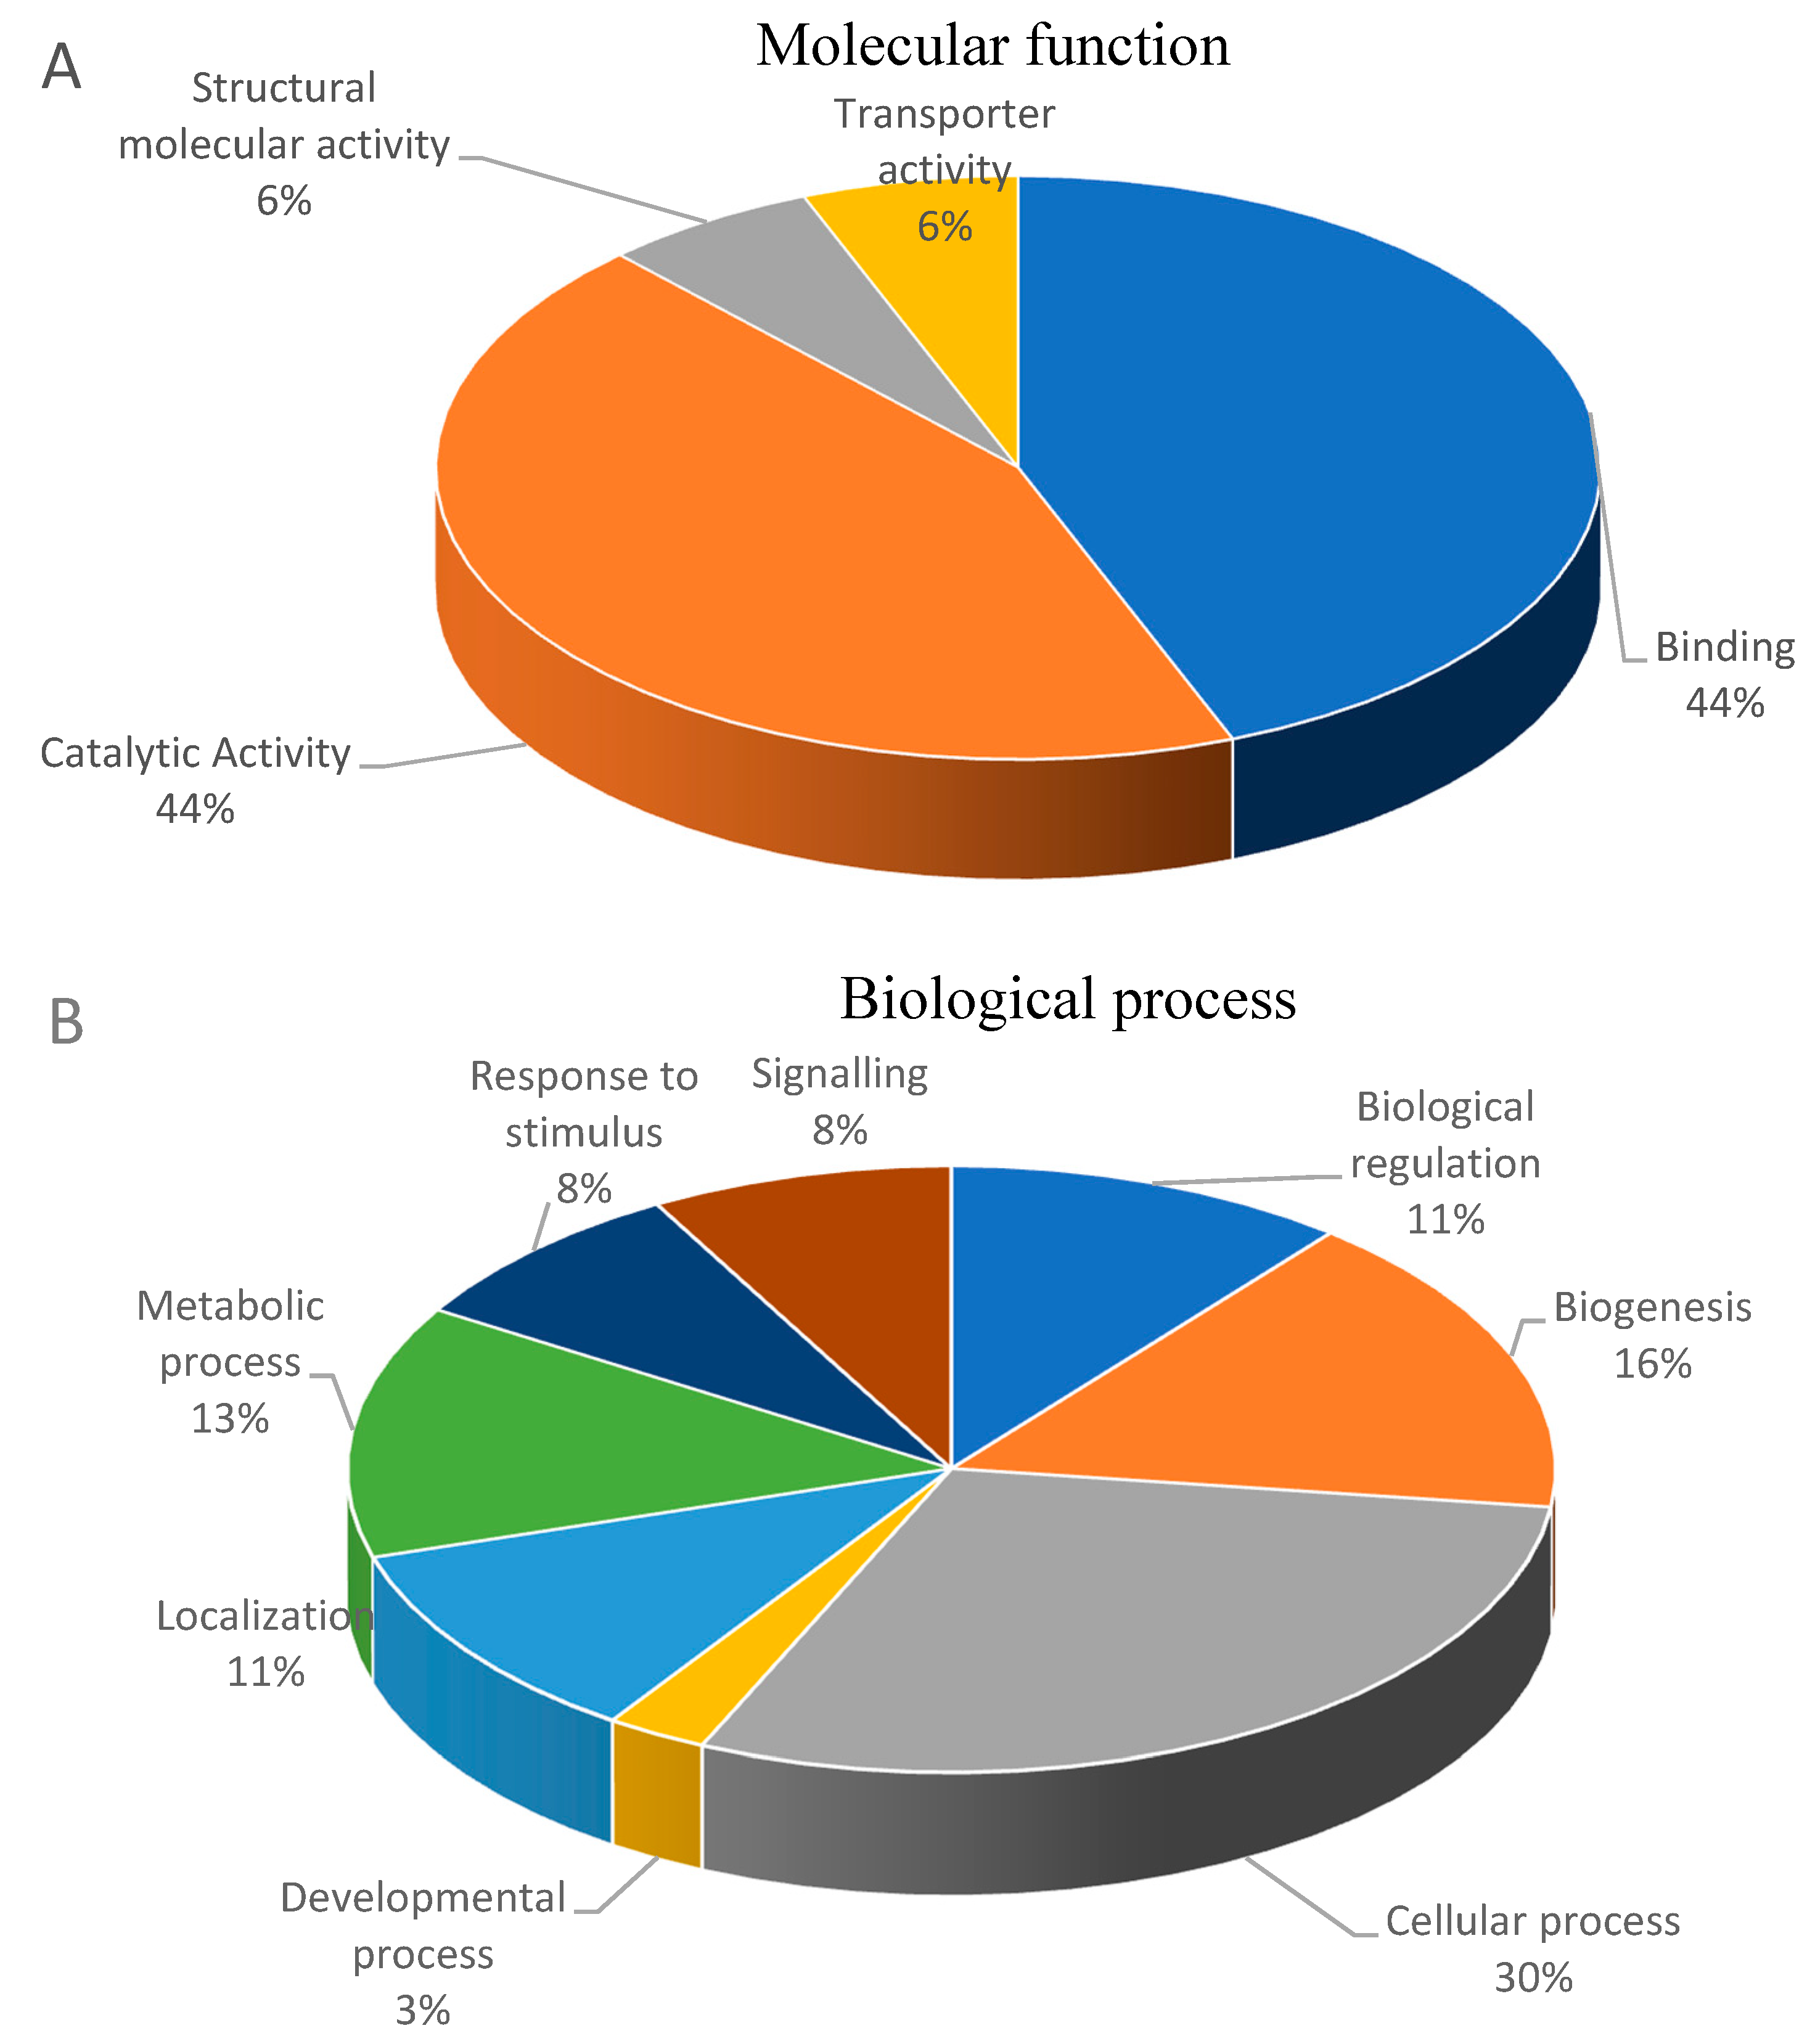
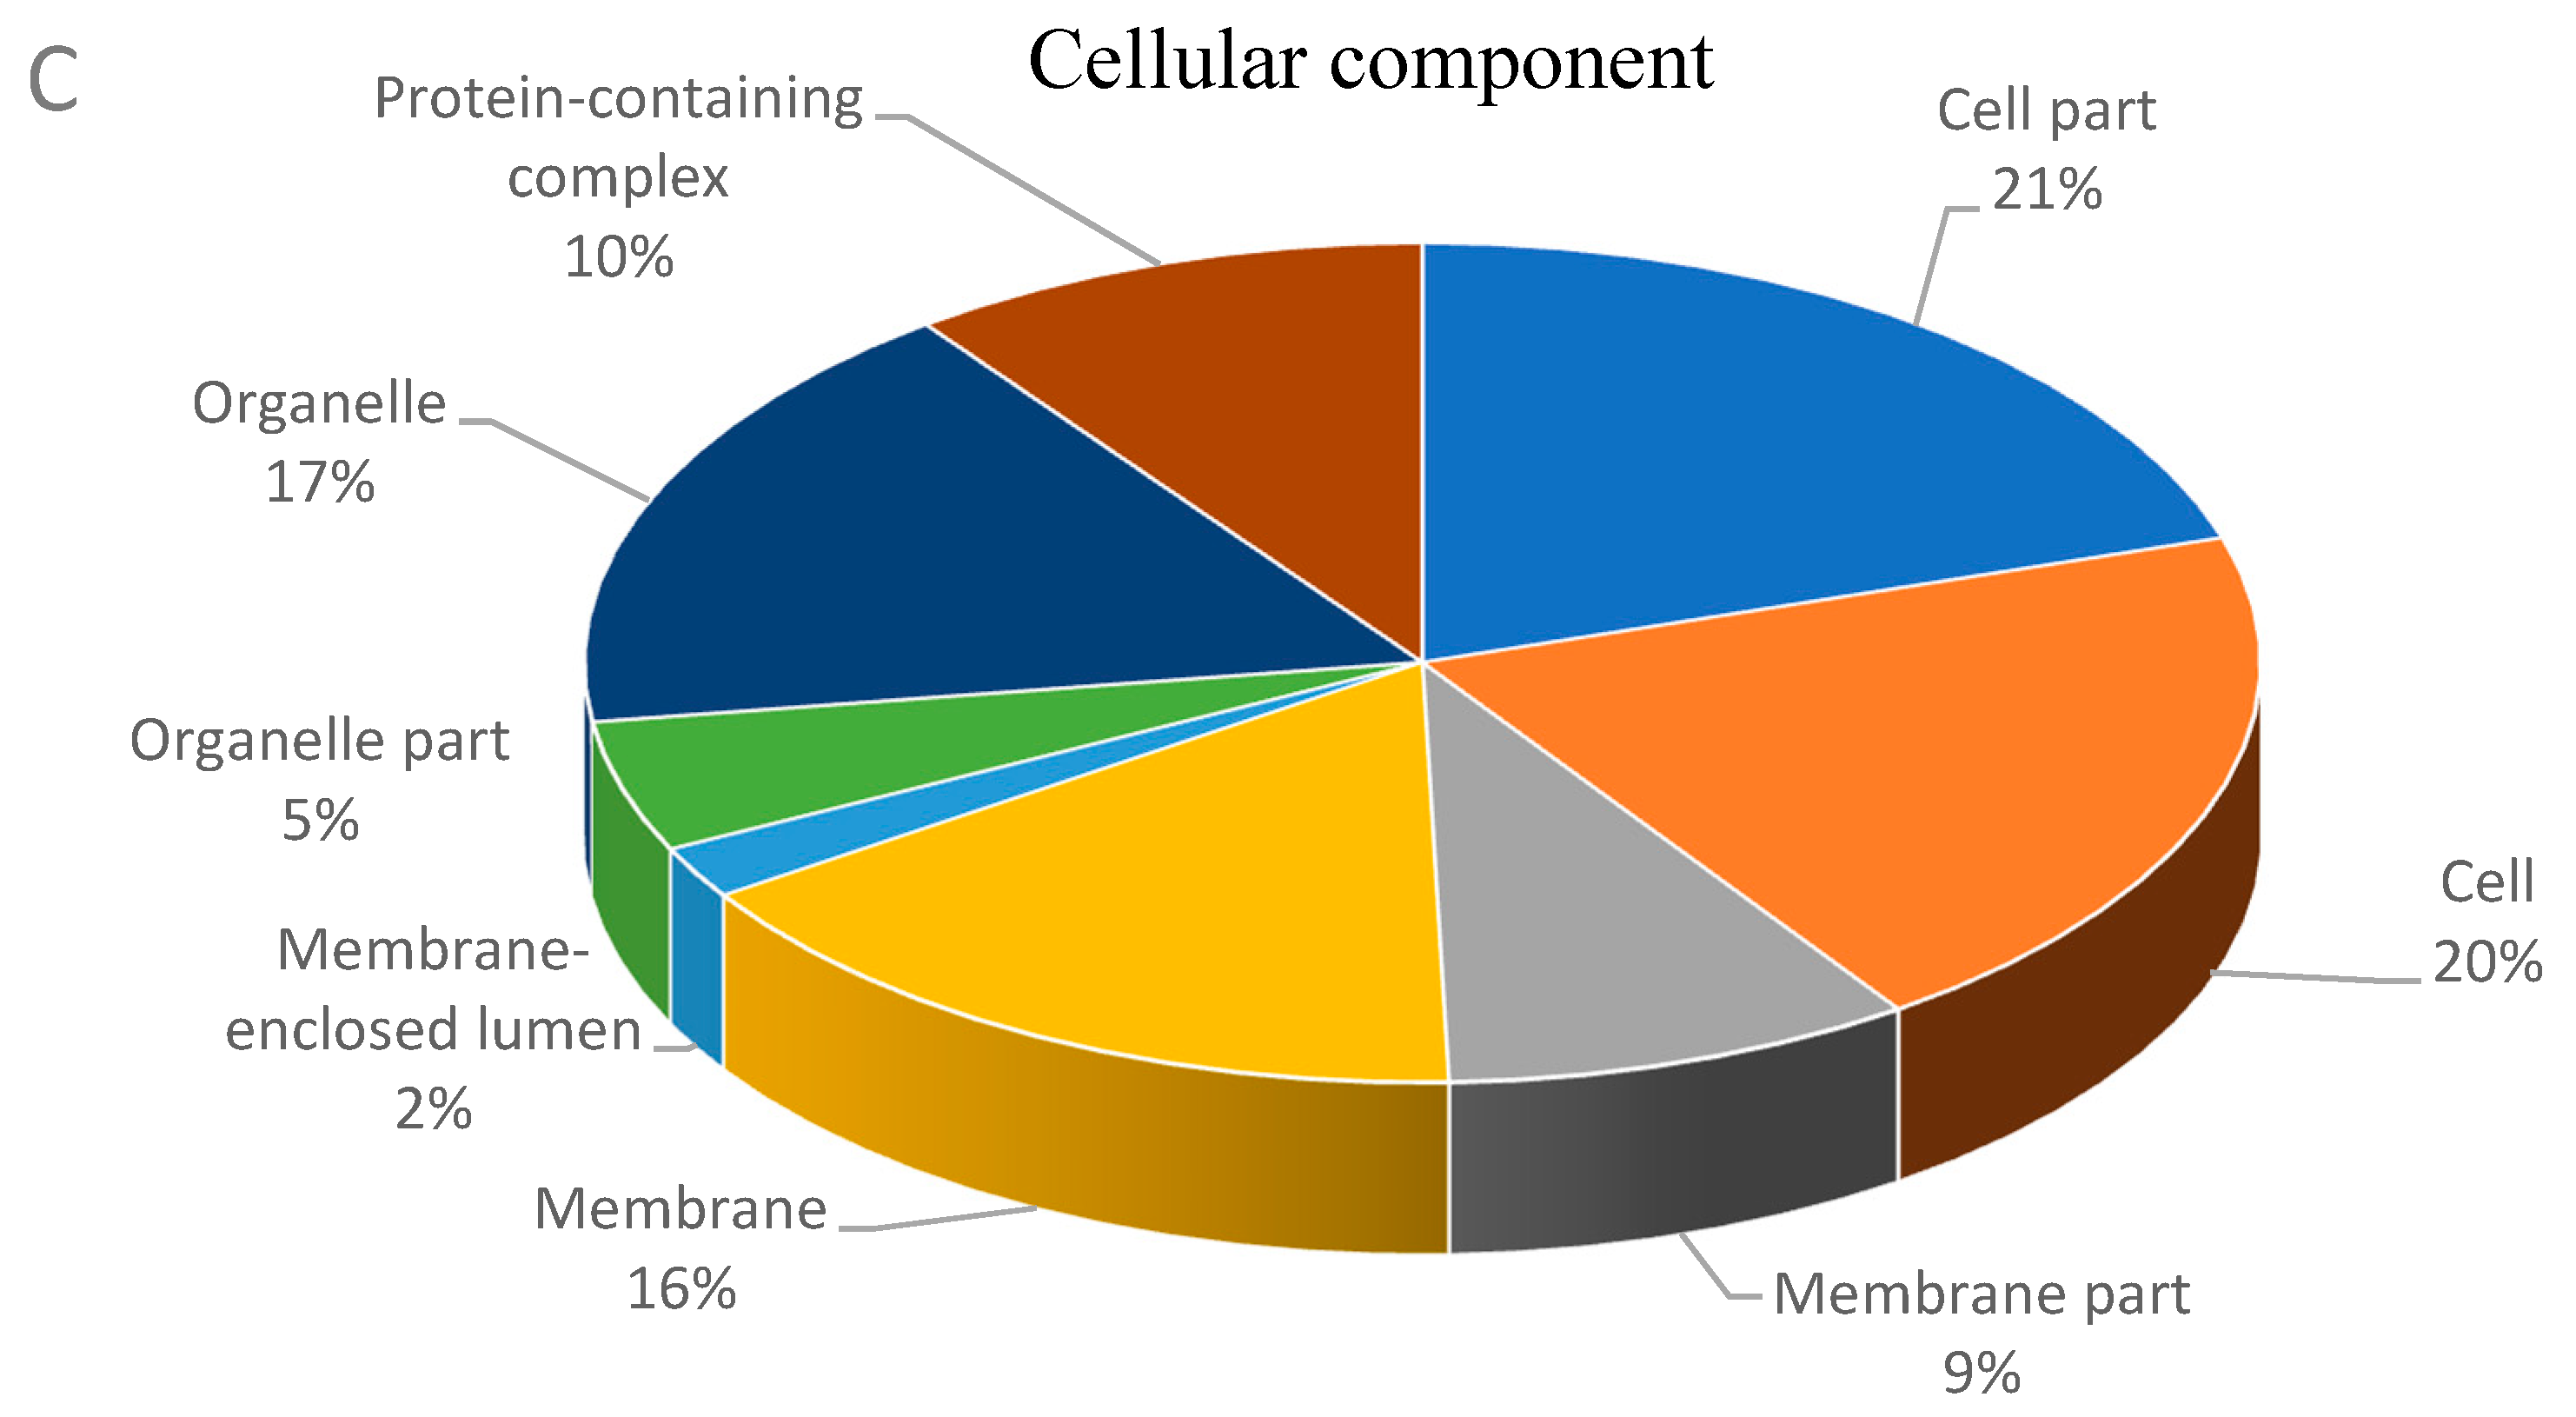
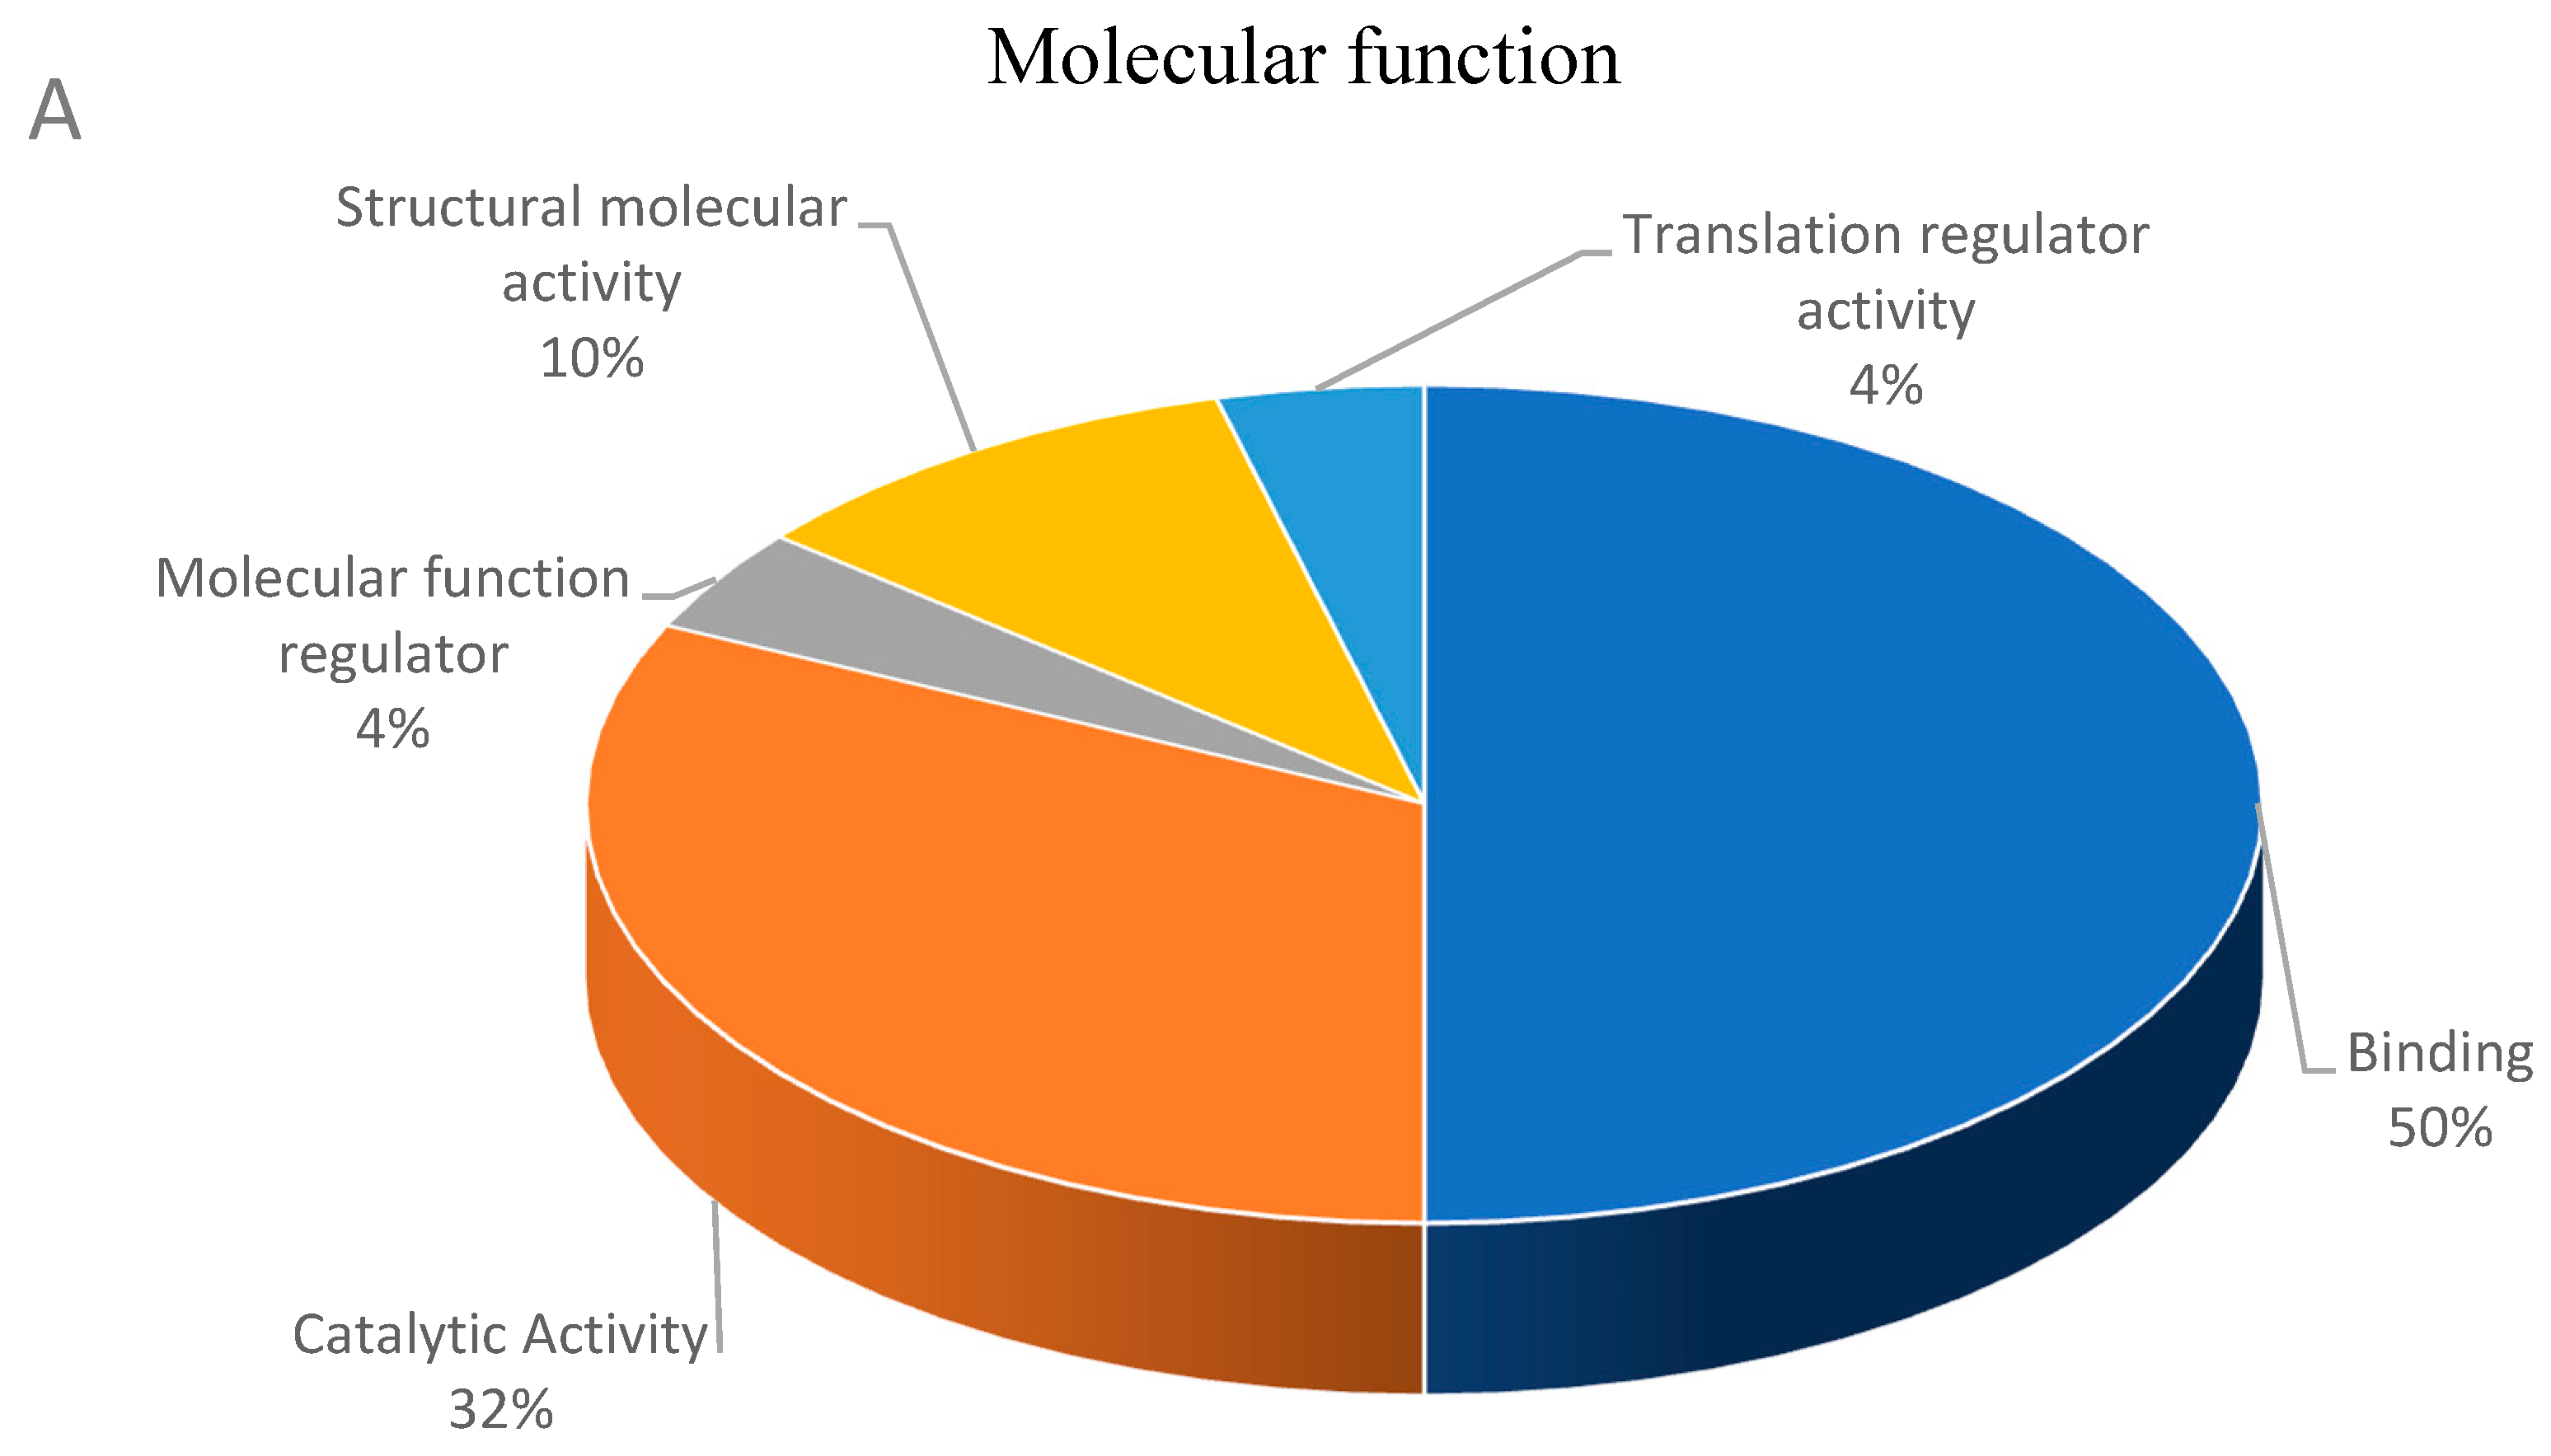
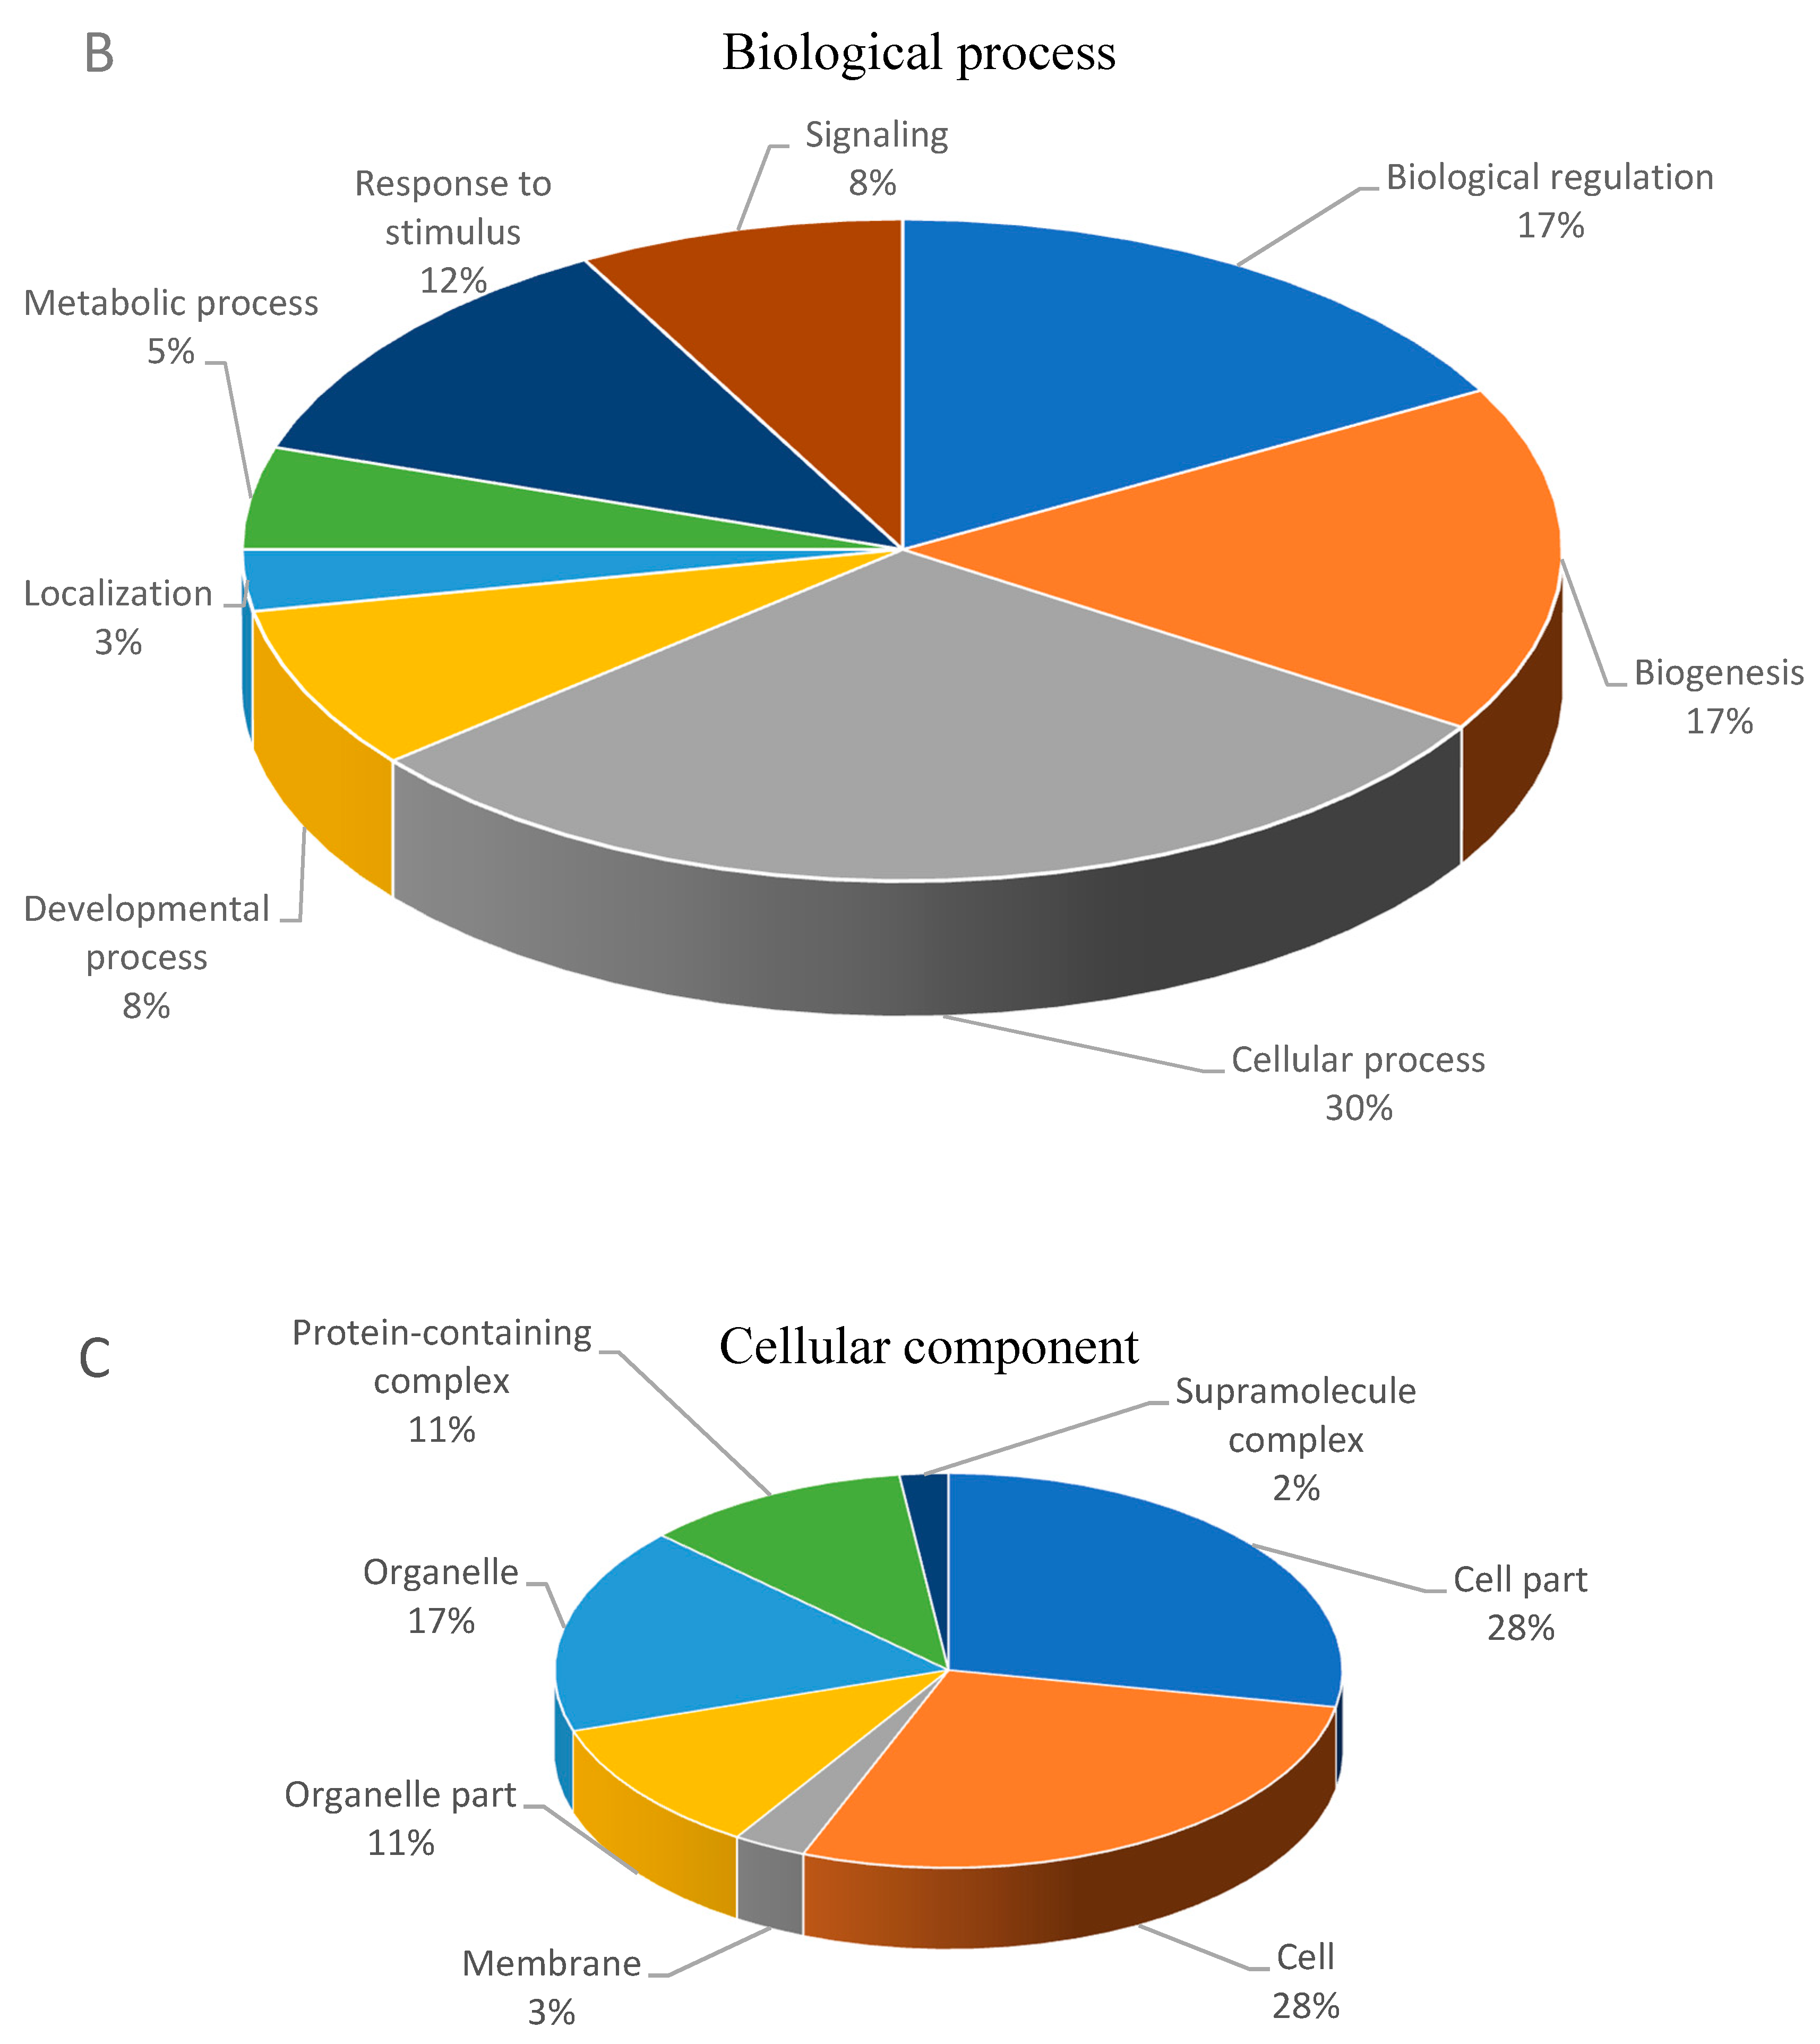
3.2. Functional Classification of Differential Abundant Proteins.

Figure 1 shows 48.07%, 33.04% and 18.88% of the differential abundant proteins involved in cellular components, biological process and molecular function, respectively. Increased abundance proteins of the membrane fraction involved in molecular function included catalytic activity (seven proteins), binding (seven proteins), structural molecular activity (one protein) and transporter activity (one protein) (Figure 2A). Figure 2B showed increased abundance proteins involved in the biological processes such as biological regulation (four proteins), biogenesis (six proteins), cellular process (eleven proteins), developmental process (one protein), localization (four proteins), metabolic process (five proteins), response to stimulus (three proteins), and signaling (three proteins). These proteins were also involved in cellular components such as cell part (twelve proteins), cell (twelve proteins), membrane part (five proteins), membrane (nine proteins), membrane-enclosed lumen (one protein), organelle part (three proteins), organelle (ten proteins), and protein-containing complex (six proteins), as shown in Figure 2C.
Decreased abundance proteins were involved in the molecular function such as binding (fourteen proteins), catalytic activity (nine proteins), molecular function regulator (one protein), structural molecular activity (three proteins), and translation regulator activity (one protein) (Figure 3A). Proteins associated with biological process involved biological regulation (seven proteins), biogenesis (seven proteins), cellular process (twelve proteins), developmental process (three proteins), localization (one protein), metabolic process (two proteins), response to stimulus (five proteins), and signaling (three proteins) (Figure 3B). These proteins were classified into cellular components such as cell and cell part (fifteen proteins each), membrane (two proteins), organelle and organelle part (nine and six proteins each), protein-containing complex (six proteins), and supramolecule complex (one protein) as shown in Figure 3C.
Increased abundance proteins demonstrated by PANTHER DB analysis (Table S1 in Supplementary Materials) were mainly involved in binding and catalytic activity (molecular function), cellular process (biological process) and cell and cell part (cellular component). The identified proteins were Rho family GTPase protein (EHI_129750), 70 kDa heat shock protein, putative (EHI_199590), calreticulin putative (EHI_136160), 60S acidic ribosomal protein (EHI_175460), NAD(P) transhydrogenase subunit alpha putative (EHI_014030), 3-oxo 5 alpha-steroid 4-dehydrogenase domain (EHI_076870), calcium- transporting ATPase (EHI_054830), Ehsyntaxin 1A fragment (EHI_139030) and protein SEY1 homolog 2 (EHI_054180).
On the other hand, PANTHER DB analysis showed decreased abundant proteins (Table S2 in Supplementary Materials) mainly involved in binding (molecular function), cellular process (biological process) and cell and cell part (cellular component). There were some proteins involved in the binding, cellular activities and cell/cell part such as heat shock protein 70 putative (EHI_052860), peptidyl-prolyl cis-trans isomerase (EHI_125840), elongation factor 2 (EHI_166820), filamin 2 putative (EHI_104630), actin putative (EHI_198930), Rho family GTPase (EHI_192450 and EHI_146180), profilin (EHI_176140), Skp1 family protein (EHI_174180), Rho GDP exchange inhibitor (EHI_147570), Arp2/3 complex 34 kDa subunit (EHI_091250) and F-actin-capping protein subunit beta (EHI_005020).

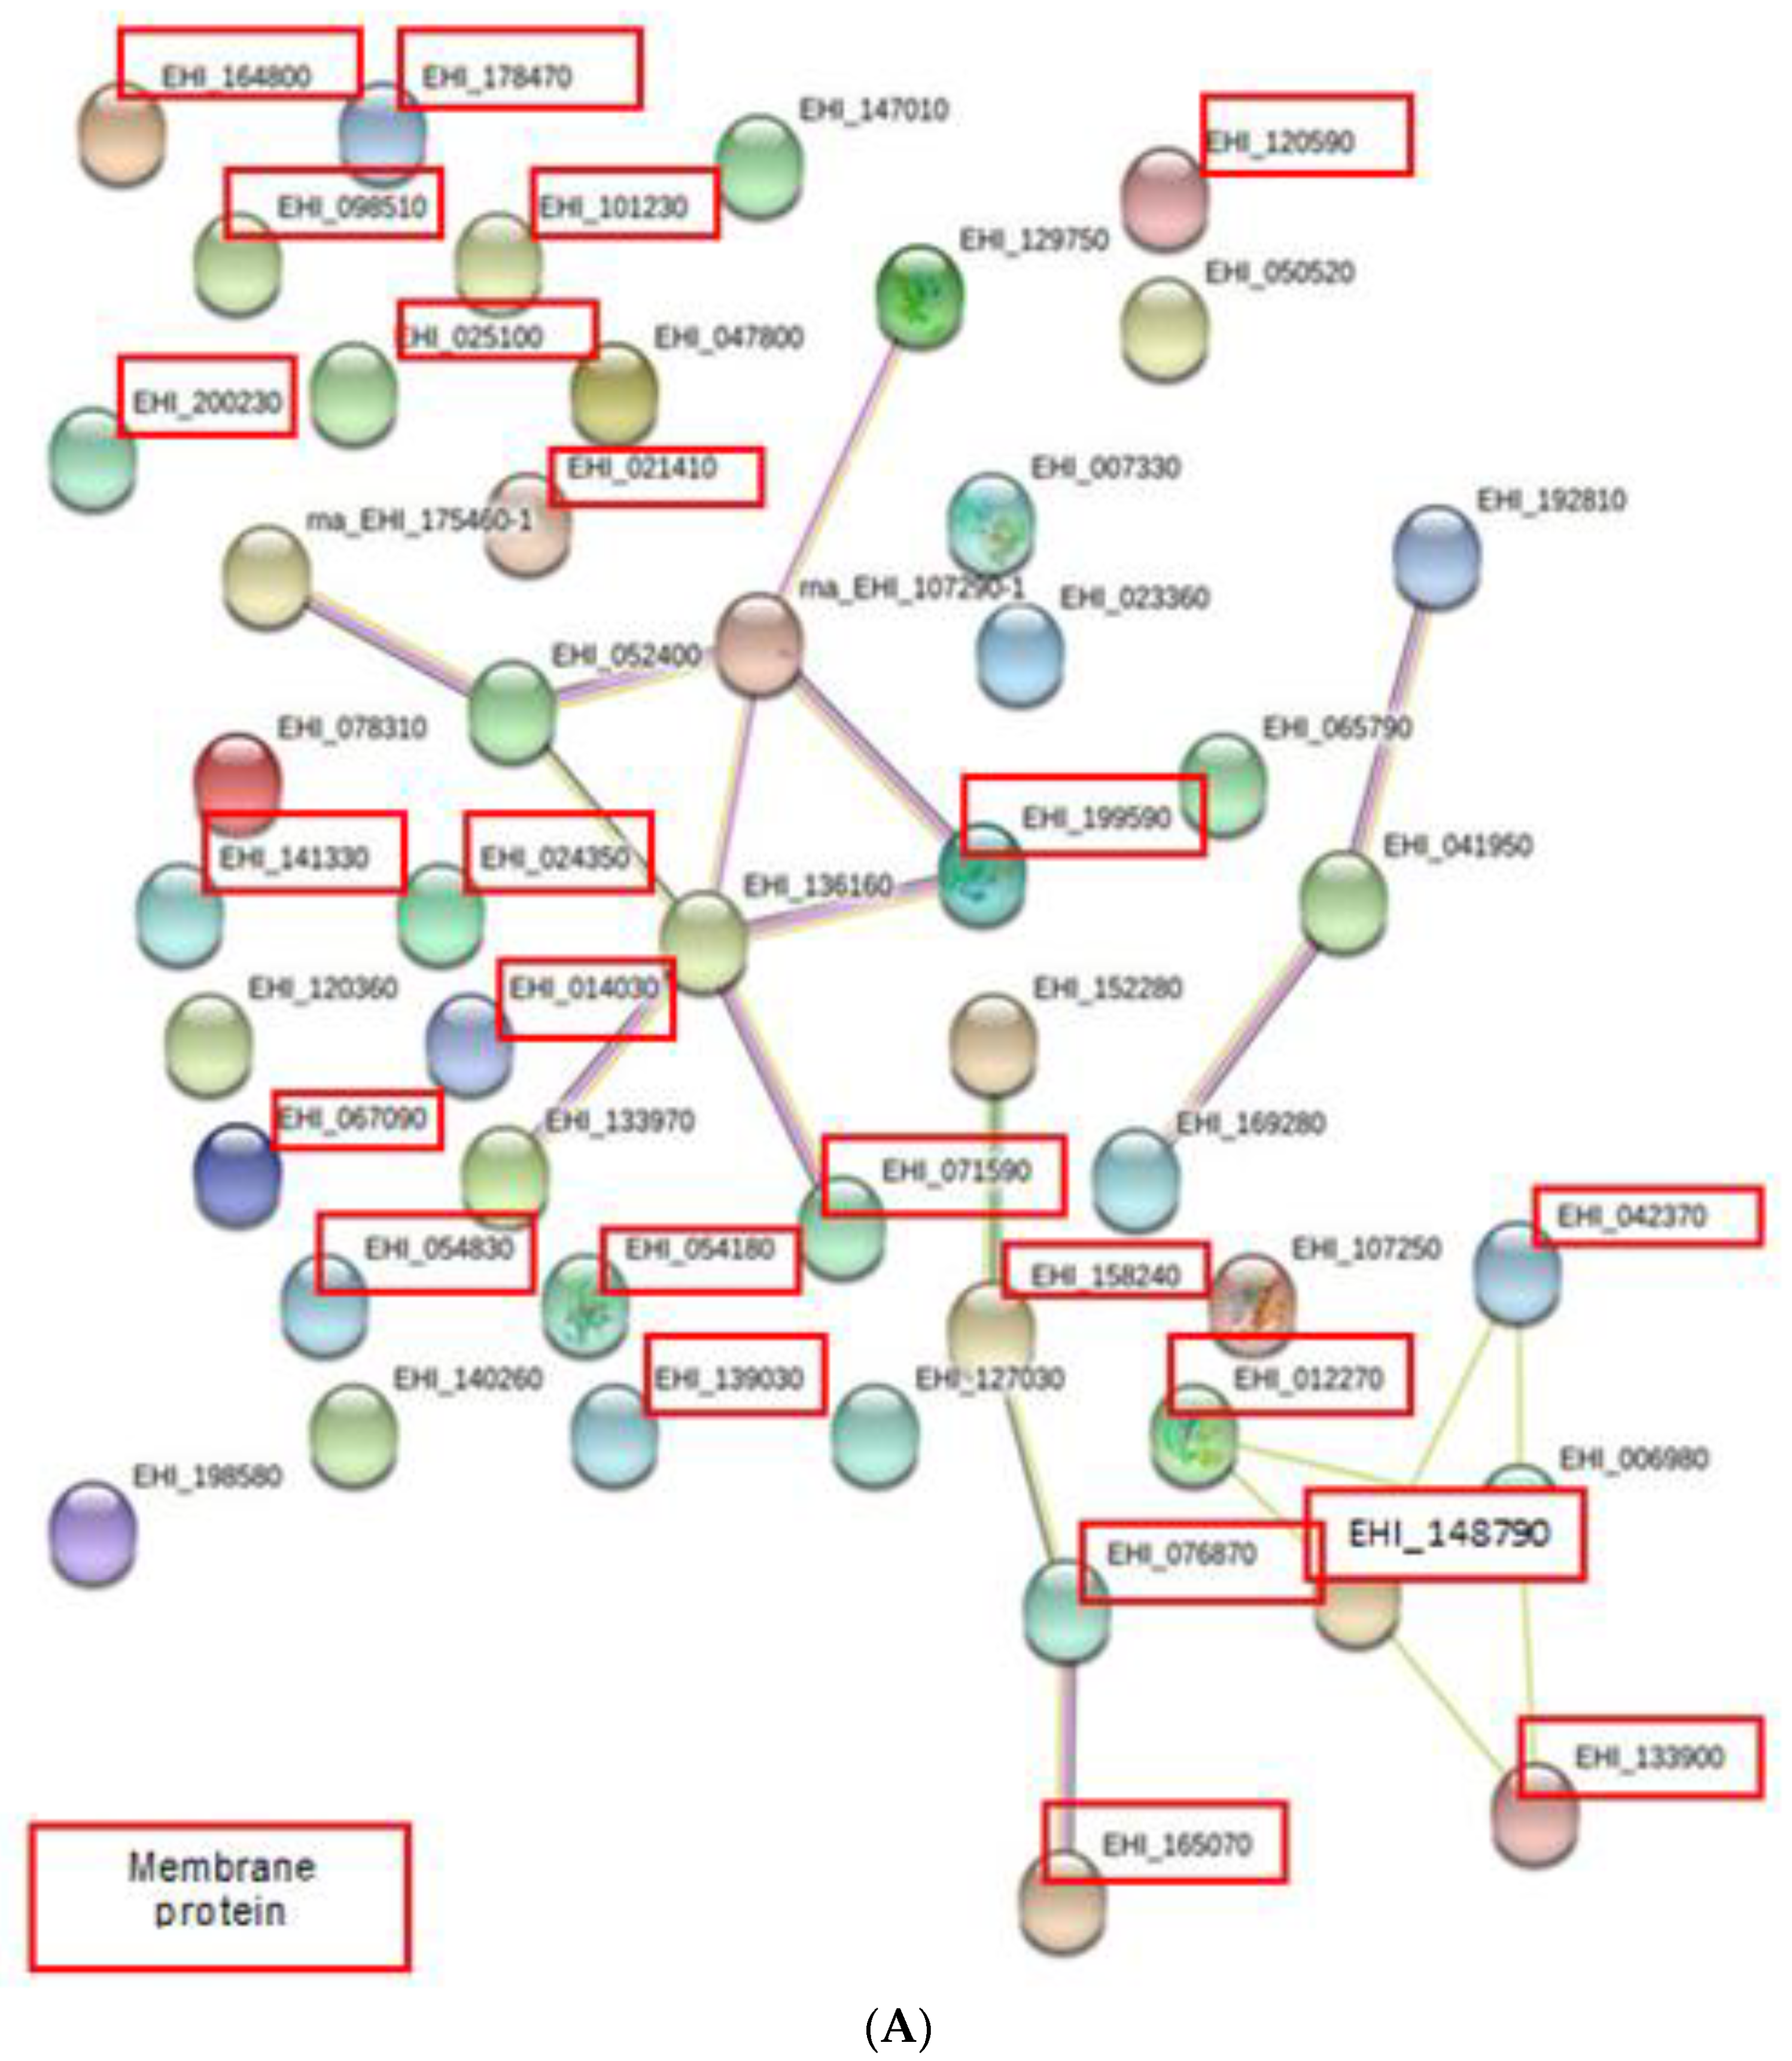
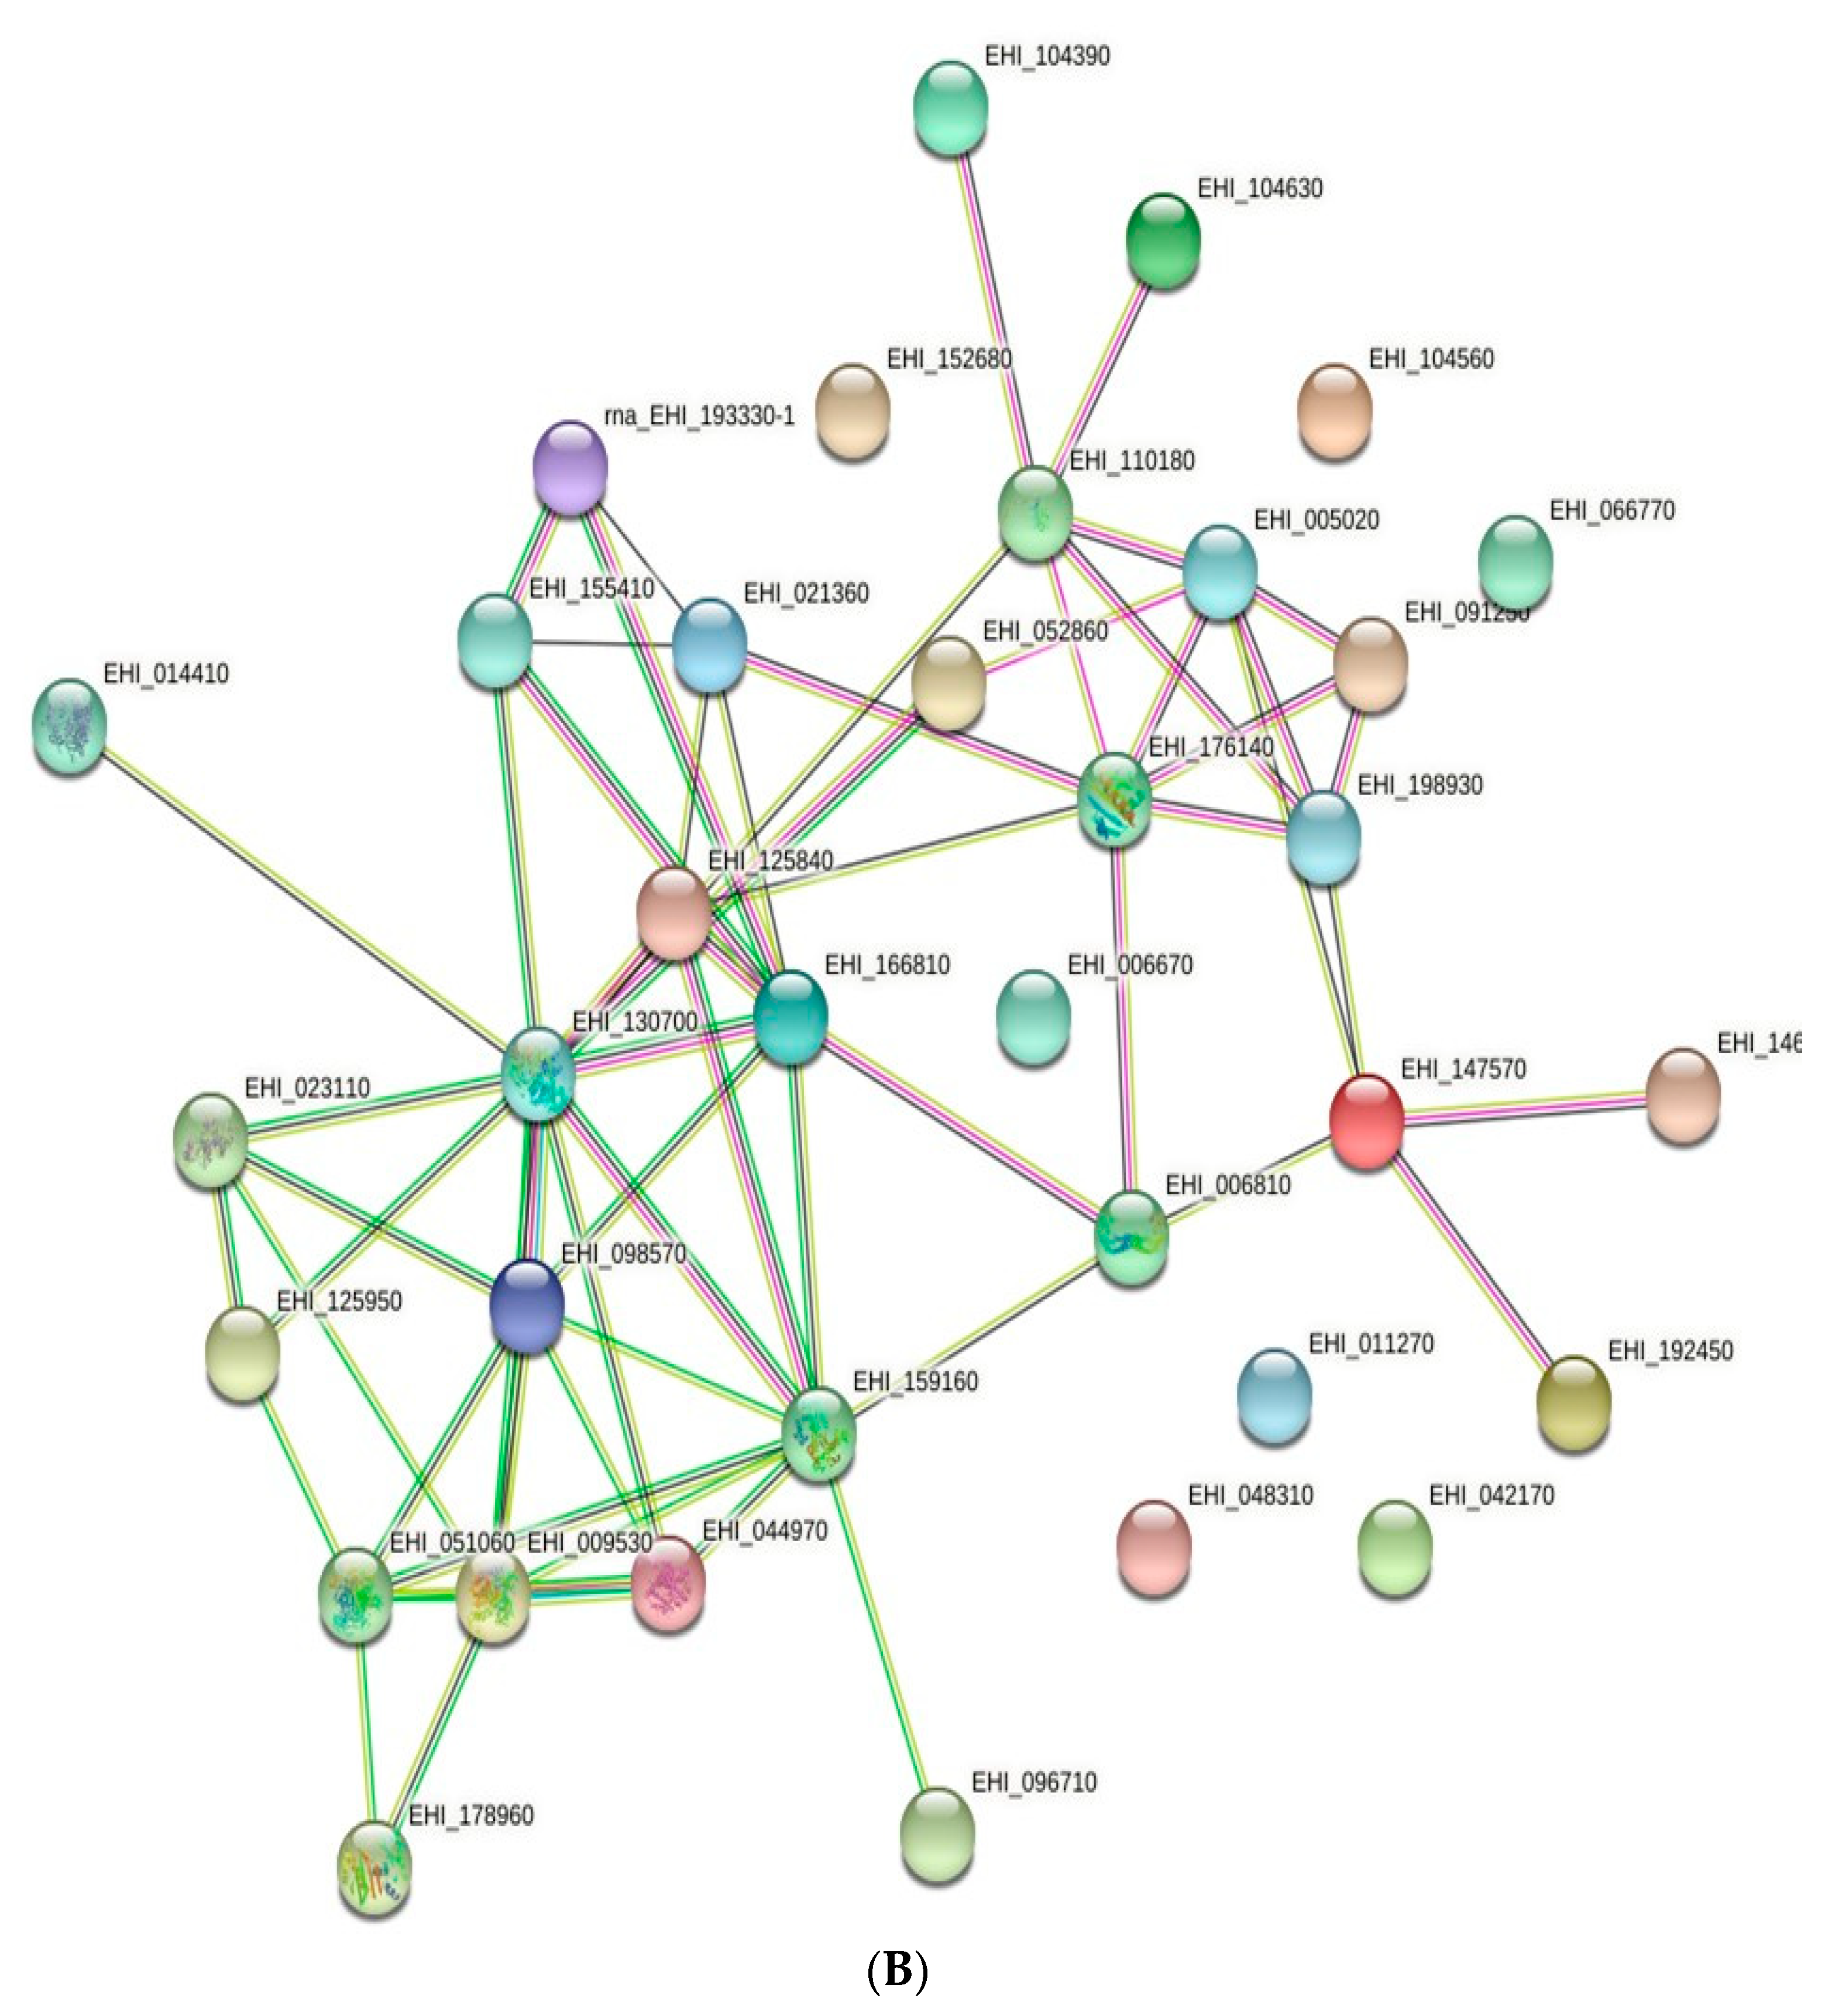
3.3. Protein–Protein Interaction Network Prediction.

Highly significant interactions (p < 3.66 × 10⁻¹¹) were predicted in decreased abundance proteins when compared to increased abundance proteins (p < 1.91 × 10⁻⁷) (Figure 4A,B). Analysis by STRiNG showed there were interactions between membrane and cytosolic proteins among increased abundance proteins as shown in Figure 4A. Line colors indicate types of interaction evidences (Table 4).

4. Discussion

In this study, there were increased and decreased abundance proteins in membrane versus cytosolic fractions from combining all three extraction methods. In this study, 24 (44.4%) out of 54 increased abundance proteins in the membrane fraction were confirmed membrane proteins as they had a transmembrane region and/or single peptide (Table 3 and Table 4). Meanwhile, 45 (100%) of the decreased abundance proteins were cytosolic proteins without a transmembrane region and/or single peptide. This study supported our previous finding (Ujang et al., (2018) [7]) in which there were mixed membrane and cytosolic proteins in the membrane fraction. We have confirmed and added value to the previous report that several increased abundance cytosolic proteins are present in the E. histolytica membrane fraction in this study.
There was a combination of membrane and cytosolic proteins among increased abundance proteins. Membrane proteins are 70 kDa HSP putative, 3-oxo 5-alpha-steroid 4-dehydrogenase, calcium-transporting ATPase, NAD(P) transhydrogenase, protein SEY1 homolog 2, cell surface proteases gp63 putative, Ehsyntaxin 1A (fragment) and Ehsyntaxin B. Furthermore, Rho family GTPase, calreticulin putative, 60S acidic ribosomal protein, uncharacterized proteins, and Rho and Rab family GTPase were cytosolic proteins (Table 2). For example, a well-studied protein that related to the parasite’s pathogenicity over past decades was calreticulin and this protein was found to be increased in abundance in the present study. Calreticulin is an immunogenic molecule involved in binding and cellular process, has no transmembrane domain and/or signal peptide. It is able to induce a host immune response. Furthermore, during the initial stage of the infection, increased expression of this parasite protein can be seen [8,9].
In this study, type A flavoprotein (EHI_152650), an oxidoreductase enzyme, was found to be decreased in abundance together with other stress response enzymes; superoxide dismutase (EHI_159160), peptidylprolyl isomerase (EHI_125840), and heat shock protein 70 putative (EHI_052860) in the membrane fraction. An interesting observation by Macfarlane and Singh (2005) showed the stress response in the nonvirulent E. histolytica was affected if a group of genes decreased in their expression, for instance, type A flavoprotein, which plays a role in the detoxification of oxygen and nitric oxide [8].
Different isoforms of Rho family GTPase and 70 kDa heat shock proteins were found to be increased and decreased in abundance in this study (Table 2 and Table 3). The Rho family GTPase protein (EHI_129750) and 70 kDa heat shock protein putative (EHI_199590) were increased in abundance, while its isoforms Rho family GTPase (EHI_192450 and EHI_146180) and heat shock protein 70 putative (EHI_052860) were decreased in abundance by comparing the two fractions. The 70 kDa heat shock protein and Rho family GTPase family proteins play important roles in the virulence of the parasite together with other identified proteins, for example, Gal/GalNAc subunit, NAD(P) transhydrogenase alpha and calreticulin [9]. From the functional classification analysis, Rho family GTPase (EHI_129750) is involved in catalytic activity and binding and increased abundance of GTPase proteins may give a possibility of effective colonization and invasion of the trophozoites in the host [10]. Soid-Raggi et al., (1998) reported that the G protein that the Rho family GTPase belongs has the possible elements of signal transduction in the trophozoite’s interaction with fibronectin [10]. Meanwhile, increased abundance of 70 kDa heat shock protein will protect amoeba because the heat shock protein (HSP) will be produced if an immediate temperature spike occurs [11].
Amoeba also contains peroxiredoxin (Prx), superoxide dismutase (EHI_159160), flavoprotein A (EHI_096710), ferredoxin (EHI_051060), thioredoxin (EHI_133970) and thioredoxin reductase for its protection against oxidative stress. Furthermore, the pathogenesis of Entamoeba has a strong association with antioxidative defense mechanisms. In this study, only the thioredoxin enzyme, which is known as a sensitive buffer was found to be increased in abundance [12]. Meanwhile, superoxide dismutase, flavoprotein A and ferredoxin were found to be decreased in abundance. Superoxide dismutase plays an important role in demolishing the cell radical of superoxide anions, which harms the E. histolytica biological system.
Another cytosolic protein, F-actin-capping protein subunit beta (EHI_005020), is a significant protein that has been detected because it takes roles in many functions including binding activities (molecular function); cellular process, biogenesis, and biological regulation (biological process); and cell/cell part (cellular component), which can inhibit the elongation of actin filaments to assure the parasite is motile [13].
Highly significant interactions (p < 3.66e × 10−11) were predicted in decreased abundance proteins when compared to increased abundance proteins (p < 1.91 × 10⁻⁷) (Figure 4A,B). This result is because all of the decreased abundance proteins are cytosolic proteins, which have been extensively studied previously. The results showed a few membrane and cytosolic proteins in the membrane fraction were predicted to be associated by the protein–protein interaction analysis.
Interesting interactions included calreticulin (EHI_136160) as a central protein, which was linked to two membrane proteins and three cytosolic proteins (Figure 4A). Calreticulin, a cytosolic protein, interacted with two membrane proteins, 70 kDa HSP (EHI_199590) and protein disulfide isomerase (EHI_071590) (Figure 4A). EhPDI (protein disulfide isomerase) belongs to the PDI family, which is known as ER’s lumen soluble marker. There was a report by Salgado et al., (2005) where a nuclear fraction of the amoeba was associated with the lack of endoplasmic reticulum (ER) markers. Calreticulin is an ER protein specifically located at the membrane of the ER periphery [14] and it promotes sites for glycosylation and calcium-binding. Overexpression of this protein in patients with amoebic liver abscess was associated with an immunogenic response at the initial stage of infection [15]. Both PDI and calreticulin associated with ER, which explains the possibility of the interaction occuring between these proteins in this study. On the other hand, calreticulin linked to other proteins such as 70 kDa HSP, actin, thioredoxin and elongation factor 1 due to these proteins being involved in similar molecular functions and biological processes categories. For instance, both 70 kDa HSP and calreticulin were involved in binding and cellular activity.

5. Conclusions

In conclusion, this study has confirmed the presence of mixed differential abundance proteins in membrane versus cytosolic fractions. Furthermore, the functional analysis and protein–protein interactions among these proteins were predicted. Several membrane and cytosolic proteins that showed significant interactions merit further investigation to confirm their localization and function on the membrane part to further our understanding of the E. histolytica pathogenesis.

Supplementary Materials

The following are available online at https://www.mdpi.com/article/10.3390/membranes11060376/s1, Supplementary file 1. Table S1. Classification of Increased Abundance Proteins by PANTHER DB. Table S2. Classification of decreased abundance proteins by PANTHER DB.

Author Contributions

Conceptualization, N.O.; methodology, N.A. and N.O.; software, N.A.; validation, N.O. and N.A.; formal analysis, N.A.; investigation, N.A.; resources, N.O.; data curation, N.A.; writing—original draft preparation, N.A.; writing—review and editing, N.O.; visualization, N.A.; supervision, N.O.; project administration, N.O.; funding acquisition, N.O. All authors have read and agreed to the published version of the manuscript.

Funding

This research was funded by Malaysian Ministry of Higher Education Fundamental Research Grant (FRGS), grant number 203.CIPPM.6711835 and Universiti Sains Malaysia.

Institutional Review Board Statement

Not applicable.

Informed Consent Statement

Not applicable.

Data Availability Statement

Not applicable.

Acknowledgments

We would like to acknowledge Malaysian Ministry of Health for providing a fellowship to Norhidayah Azmi during her study.

Conflicts of Interest

The authors declare no conflict of interest.

References

  1. Biller, L.; Matthiesen, J.; Kühne, V.; Lotter, H.; Handal, G.; Nozaki, T.; Saito-Nakano, Y.; Schümann, M.; Roeder, T.; Tannich, E.; et al. The Cell Surface Proteome of Entamoeba histolytica. Mol. Cell. Proteom. 2014, 13, 132–144. [Google Scholar] [CrossRef] [PubMed] [Green Version]
  2. Laura, M.; Upinder, S. Entamoeba histolytica: A snapshot of current research and methods for genetic analysis. Curr. Opin. Microbiol. 2012, 15, 469–475. [Google Scholar]
  3. Ibne Karim, M.A.; Rashidul, H.; Abdullah, S.; Mamun, K.; Nicholas, E.S.; Sean, A.G.; Gerard, A.C.; William, A.P., Jr. Proteomic analysis of the cyst stage of Entamoeba histolytica. PLoS Negl. Trop. Dis. 2012, 6, e1643. [Google Scholar]
  4. Krogh, A.; Larsson, B.; von Heijne, G.; Sonnhammer, E.L. Predicting transmembrane protein topology with a hidden markov model: Application to complete genomes. J. Mol. Biol. 2001, 305, 567–580. [Google Scholar] [CrossRef] [PubMed] [Green Version]
  5. Tsirigos, K. Bioinformatics Methods for Topology Prediction of Membrane Proteins. Ph.D. Thesis, Department of Biochemistry and Biophysics, Stockholm University, Stockholm, Sweden, 2017. [Google Scholar]
  6. Zhang, Q.C.; Petrey, D.; Garzón, J.I.; Deng, L.; Honig, B. PrePPI: A structure-informed database of protein–protein interactions. Nucleic Acids Res. 2012, 41, D828–D833. [Google Scholar] [CrossRef] [PubMed] [Green Version]
  7. Ujang, J.; Sani, A.A.A.; Lim, B.H.; Noordin, R.; Othman, N. Analysis of Entamoeba histolytica Membrane Proteome Using Three Extraction Methods. Proteomics 2018, 18, e1700397. [Google Scholar] [CrossRef] [PubMed]
  8. Macfarlane, R.C.; Singh, U. Identification of Differentially Expressed Genes in Virulent and Nonvirulent Entamoeba Species: Potential Implications for Amebic Pathogenesis. Infect. Immun. 2006, 74, 340–351. [Google Scholar] [CrossRef] [PubMed] [Green Version]
  9. Ng, Y.L.; Olivos-García, A.; Lim, T.K.; Noordin, R.; Lin, Q.; Othman, N. Entamoeba histolytica: Quantitative Proteomics Analysis Reveals Putative Virulence-Associated Differentially Abundant Membrane Proteins. Am. J. Trop. Med. Hyg. 2018, 99, 1518–1529. [Google Scholar] [CrossRef] [PubMed] [Green Version]
  10. Soid-Raggi, L.G.; Torres-Márquez, M.E.; Meza, I. Entamoeba histolytica: Identification of functional G(s) and G(i) proteins as possible signal transduction elements in the interaction of trophozoites with fibronectin. Exp. Parasitol. 1998, 90, 262–269. [Google Scholar] [CrossRef] [PubMed]
  11. Ximénez, C.; González, E.; Nieves, M.; Magaña, U.; Morán, P.; Gudiño-Zayas, M. Differential expression of pathogenic genes of E. histolytica versus E. dispar in a model of infection using human liver tissue explants. PLoS ONE 2017, 12, e0181962. [Google Scholar]
  12. Schlosser, S.; Leitschm, D.; Duchêne, M. Entamoeba histolytica: Identification of thioredoxin-targeted proteins and analysis of serine acetyltransferase-1 as a prototype example. Biochem. J. 2013, 451, 277–288. [Google Scholar] [CrossRef] [PubMed]
  13. Isenberg, G.; Aebi, U.; Pollard, T.D. An action-binding protein from Acanthamoeba regulates actin filament polymerization and interactions. Nature 1980, 288, 455–459. [Google Scholar] [CrossRef] [PubMed]
  14. Salgado, M.; Villagómez-Castro, J.C.; Rocha-Rodríguez, R.; Sabanero-Lopez, M.; Ramos, M.A.; Alagón, A.; López-Romero, E.; Sánchez-López, R. Entamoeba histolytica: Biochemical and molecular insights into the activities within microsomal fractions. Exp. Parasitol. 2005, 110, 363–373. [Google Scholar] [CrossRef] [PubMed]
  15. Gonzalez, E.; Rico, G.; Mendoza, G.; Ramos, F.; Garcıa, G.; Moran, P.; Valadez, A.; Melendro, E.I.; Ximenez, C. Calreticu-lin-like molecule in trophozoites of Entamoeba histolytica HM1: IMSS (Swissprot: Accession P83003). Am. J. Trop. Med. Hyg. 2002, 67, 636–639. [Google Scholar] [CrossRef] [PubMed] [Green Version]
Figure 1. The functional analysis of increased and decreased abundance proteins in the membrane versus cytosolic fractions.
Membranes 11 00376 g001
Figure 2. Functional classification analysis of increased abundance proteins according to their molecular function (A), biological process (B), and cellular component (C).
Membranes 11 00376 g002aMembranes 11 00376 g002b
Figure 3. Functional classification of decreased abundance proteins according to their molecular function (A), biological process (B) and cellular component (C).
Membranes 11 00376 g003aMembranes 11 00376 g003b
Figure 4. STRiNG generated networks of increased and decreased abundance proteins. (A) Increased abundance proteins comprised membrane and cytosolic proteins. Proteins with accession no. in the red boxes are membrane proteins. Meanwhile, proteins with accession no. without red boxes are cytosolic proteins. (B) Decreased abundance proteins comprised cytosolic proteins.
Membranes 11 00376 g004aMembranes 11 00376 g004b
Table 1. Increased and decreased abundance proteins in the membrane versus cytosolic fractions (q < 0.05) by three different methods.
Extraction MethodIncreasedDecreased
Fc > 2-Fold; q < 0.05Fc > 2-Fold; q < 0.05
Conventional Method1923
ProteoExtract Kit42
ProteoPrep Kit3120
TotalL5445
Table 2. Increased abundant membrane and cytosolic proteins in the membrane versus cytosolic fractions (q < 0.05).
TM and/or Signal PeptideFold ChangeMapped IDGene Name
-2.0141EHI_078310Uncharacterized protein
-2.3102EHI_129750Rho family GTPase
-2.0333EHI_198580Uncharacterized protein
Yes2.4443EHI_165070Estradiol 17-beta-dehydrogenase putative
-2.6115EHI_023360Alpha-amylase family protein
-3.6739EHI_065790Rab family GTPase (Fragment)
-2.3510EHI_152280Serine palmitoyltransferase putative
Yes2.6371EHI_19959070 kDa heat shock protein putative
-2.2277EHI_120360Grainin putative
-2.1083EHI_006980Gal galnac lectin subunit igl1
-2.5152EHI_102170Elongation factor 1-alpha
Yes2.0661EHI_024350Uncharacterized protein
-2.0284EHI_107290Actin
-2.6989EHI_047800Uncharacterized protein
Yes2.5246EHI_0768703-oxo 5 alpha-steroid 4-dehydrogenase domain-containing
Yes2.9713EHI_054830Calcium-transporting ATPase
-4.4102EHI_050520Uncharacterized protein
-2.8741EHI_169280EhRab7E protein
Yes3.3411EHI_014030NAD(P) transhydrogenase subunit alpha, putative
Yes2.6606EHI_025100G protein-coupled receptor 1
Yes4.1994EHI_012270170 kDa surface lectin
Yes2.3614EHI_141330Uncharacterized protein
Yes2.5185EHI_120590Uncharacterized protein
-2.0883EHI_041950Vacuolar protein sorting 35, putative
Yes2.8047EHI_164800Cysteine protease binding protein family 1
-3.411EHI_136160Calreticulin putative
Yes3.1331EHI_098510Uncharacterized protein
-4.4288EHI_192810small GTPase Rab7A
-2.9434EHI_147010Long-chain-fatty-acid—CoA ligase, putative
Yes2.3719EHI_071590Protein disulfide isomerase putative
-2.2623EHI_133970Thioredoxin putative
Yes2.8980EHI_1582403-ketoacyl-CoA synthase
Yes2.2738EHI_139030EhSyntaxin 1A (Fragment)
-2.3774EHI_107250small GTPase Rab11B
-3.3584EHI_140260Copine putative
Yes2.2996EHI_054180Protein SEY1 homolog 2
Yes3.1250EHI_200230Cell surface protease gp63 putative
-2.3851EHI_127030Uncharacterized protein
-2.4601EHI_007330Beta-hexosaminidase
Yes2.0039EHI_067090Uncharacterized protein
Yes2.5342EHI_178470Cysteine protease binding protein family 6
Yes3.1223EHI_042370Galactose-specific adhesin 170 kDa subunit, putative
Yes2.7603EHI_021410EhSyntaxin B
Yes3.8750EHI_133900Galactose-inhibitable lectin 170 kDa subunit putative
Yes3.4012EHI_148790Gal galNac lectin light subunit
-2.7452EHI_17546060S acidic ribosomal protein P0
Yes2.4905EHI_101230P-glycoprotein 6
-2.5152EH_052400Elongation factor-1-alpha
Table 3. Decreased abundance of cytosolic proteins in the membrane versus cytosolic fractions (q < 0.05). These proteins lack a transmembrane (TM) and signal peptide domain.
Mapped IDFold ChangeGene Name/SymbolPANTHER
(Family/Subfamily)
EHI_1307002.953Enolase putativeEnolase (Pthr11902:Sf1)
EHI_0528602.9703Heat shock protein 70 putativeRibosome-Associated Molecular Chaperone Ssb1-Related (Pthr19375:Sf395)
EHI_1043902.6725Actin binding protein putative-
EHI_0421703.2691Aminoacyl-histidine dipeptidase putativeCytosol Non-Specific Dipeptidase (Pthr43501:Sf1)
EHI_0483102.4029EhSec24CSecretory 24cd, Isoform C (Pthr13803:Sf38)
EHI_0231103.1633NADP-dependent Alcohol dehydrogenaseDehydrogenase 1, Putative-Related (Pthr42813:Sf4)
EHI_1258403.0822Peptidyl-prolyl cis-trans isomerasePeptidyl-Prolyl Cis-Trans Isomerase D-Related (Pthr11071:Sf380)
EHI_1668103.7550/
2.6014
Elongation factor 2Elongation Factor 2 (Pthr42908:Sf10)
EHI_0985703.1517Fructose 1 6-bisphosphate aldolase putativeD-Tagatose-1,6-Bisphosphate Aldolase Subunit Gaty-Related (Pthr30304:Sf0)
EHI_1554102.869140S ribosomal protein S11, putative40s Ribosomal Protein S11 (Pthr10744:Sf9)
EHI_1046302.5185Filamin 2 putativeZgc:100997 (Pthr19961:Sf58)
EHI_0066702.5009Uncharacterized proteinExpressed Protein (Pthr19308:Sf14)
EHI_1989303.7526Actin putativeActin-Related Protein 3b (Pthr11937:Sf31)
EHI_0213602.5234Uncharacterized proteinTranslationally Controlled Tumor Protein (Pthr11991:Sf0)
EHI_1924502.0262Rho family GTPaseRas-Related Protein Rac1-Related (Pthr24072:Sf281)
EHI_1461802.3813Rho family GTPaseRas-Related Protein Rac1-Related (Pthr24072:Sf281)
EHI_1045602.8300Cortexillin putativeCortexillin-2 (Pthr23167:Sf67)
EHI_1761402.7438/
2.4697
ProfilinProfilin (Pthr11604:Sf0)
EHI_1741802.1882Skp1 family proteinS-Phase Kinase-Associated Protein 1 (Pthr11165:Sf24)
EHI_1653502.6236Malate dehydrogenase putativeHydroxycarboxylate Dehydrogenase B-Related (Pthr11091:Sf0)
EHI_1591602.4921Superoxide dismutaseSuperoxide Dismutase [Fe] 2, Chloroplastic (Pthr42769:Sf3)
EHI_0112702.2522Uncharacterized proteinSi:Ch211-282j17.12-Related (Pthr18884:Sf83)
EHI_1789602.7608/
2.5979
Acetyl-CoA synthetase, putativeAcetate--Coa Ligase [Adp-Forming] (Pthr43334:Sf1)
EHI_1526802.1693EH-domain containing protein putativeAt21416p (Pthr11216:Sf31)
EHI_1475702.1748/
2.7106
Rho GDP exchange inhibitor, putativeLd16419p (Pthr10980:Sf3)
EHI_1933302.212360S ribosomal protein L23 putative60s Ribosomal Protein L23 (Pthr11761:Sf8)
EHI_1101802.4310Myosin heavy chainMyosin Heavy Chain, Non-Muscle (Pthr45615:Sf40)
EHI_0510603.7812Pyruvate ferredoxin oxidoreductasePyruvate-Flavodoxin Oxidoreductase-Related (Pthr32154:Sf0)
EHI_1259503.1278Alcohol dehydrogenase putativeAlcohol Dehydrogenase Yqhd (Pthr43633:Sf1)
EHI_0068102.708314-3-3 protein 314-3-3 Protein Zeta (Pthr18860:Sf106)
EHI_1526502.5095Type A flavoprotein, putativeDiflavin Flavoprotein A 2-Related (Pthr32145:Sf11)
EHI_0449703.9670Malic enzymeNadp-Dependent Malic Enzyme (Pthr43237:Sf4)
EHI_0912502.8148Arp2/3 complex 34 kDa subunitActin-Related Protein 2/3 Complex Subunit 2 (Pthr12058:Sf0)
EHI_0050202.5429F-actin-capping protein subunit betaF-Actin-Capping Protein Subunit Beta (Pthr10619:Sf0)
EHI_0095302.136Pyruvate, phosphate dikinasePyruvate, Phosphate Dikinase 1, Chloroplastic (Pthr22931:Sf9)
Table 4. Line colors explanation.
ColorEvidence
RedPresence of fusion
GreenNeighborhood
BlueCooccurrence
PurpleExperimental
YellowText mining
Light blueDatabase
BlackCoexpression
Note: Different color lines indicate types of interaction evidence used in predicting the association.
Publisher’s Note: MDPI stays neutral with regard to jurisdictional claims in published maps and institutional affiliations.

