
Prediction of Permeate Flux in Ultrafiltration Processes: A Review of Modeling Approaches

 ,
,  ,
,  and
and
Abstract
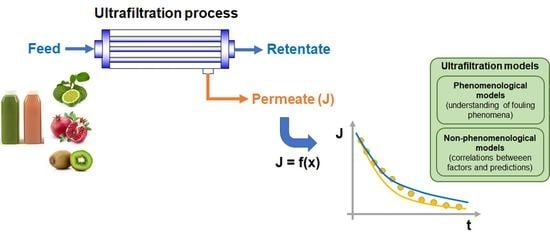
1. Introduction
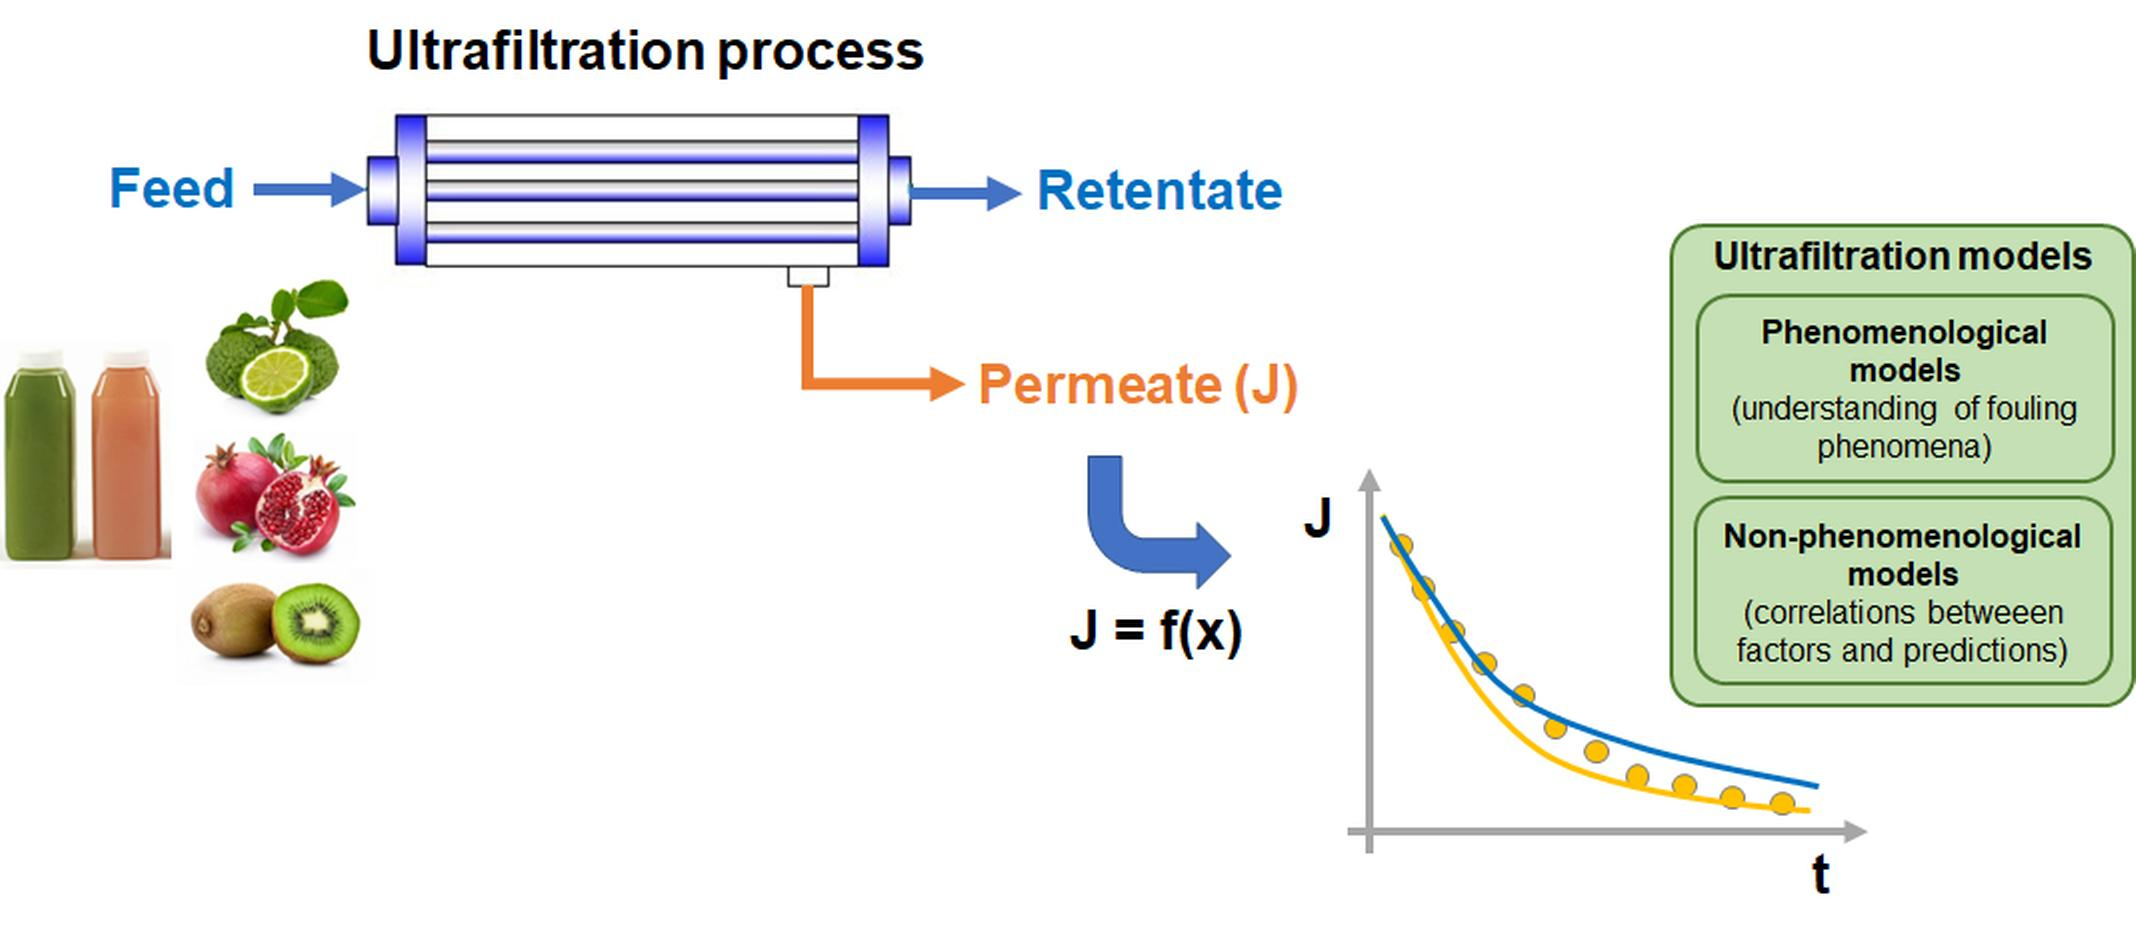
2. Theory
2.1. Concentration Polarization Models
2.2. Osmotic Pressure Models
2.3. Resistance-in-Series Models
2.4. Fouling Models
2.5. Non-Phenomenological Models
3. Analysis of Model Goodness-of-Fit
- (i)
- Type of configuration: models tested or developed for cross-flow filtration of fruit juices were selected.
- (ii)
- Validation: models with more than one validation were considered.
- (iii)
- The number of citations: models with a high number of citations were selected in order to take into account the scientific impact of each model.
- (iv)
- Membrane module: models tested or developed in fruit juice processing with hollow fiber and tubular membranes were selected.
- (v)
- Mathematical complexity: Considering the easy application of the models, the most straightforward models were preferred.
4. Results and Discussion of Selected Models’ Performance
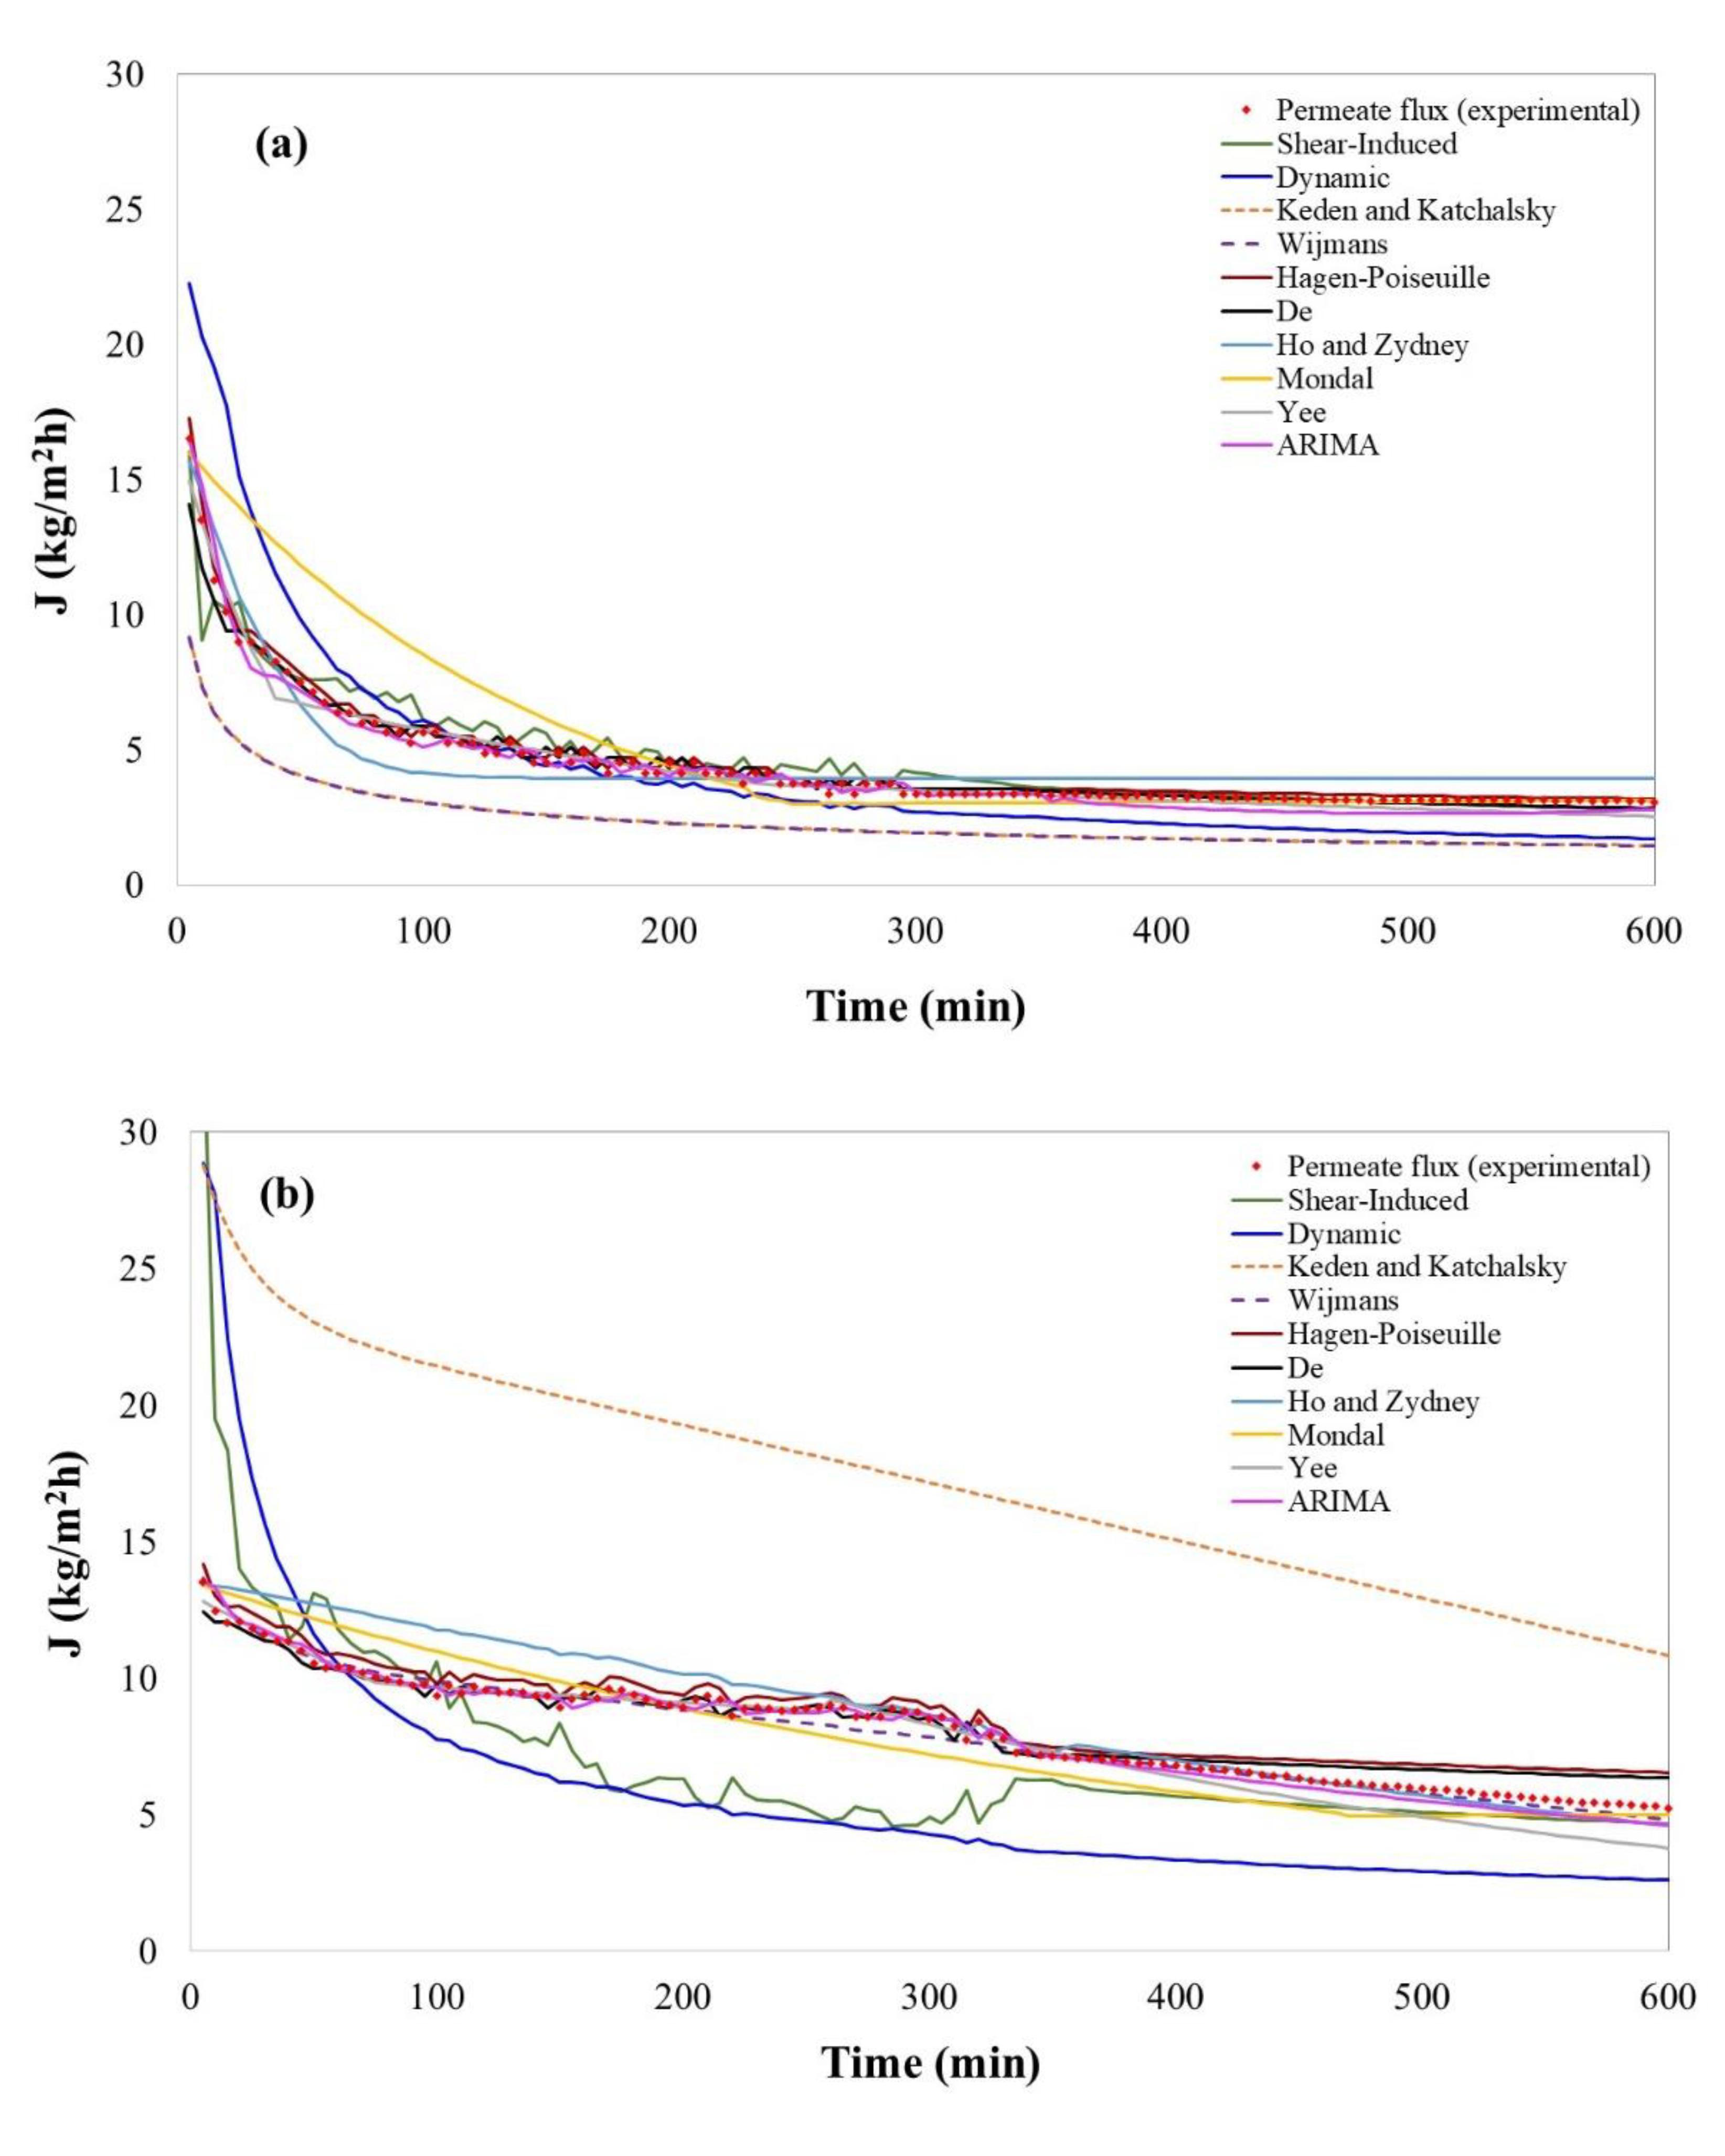
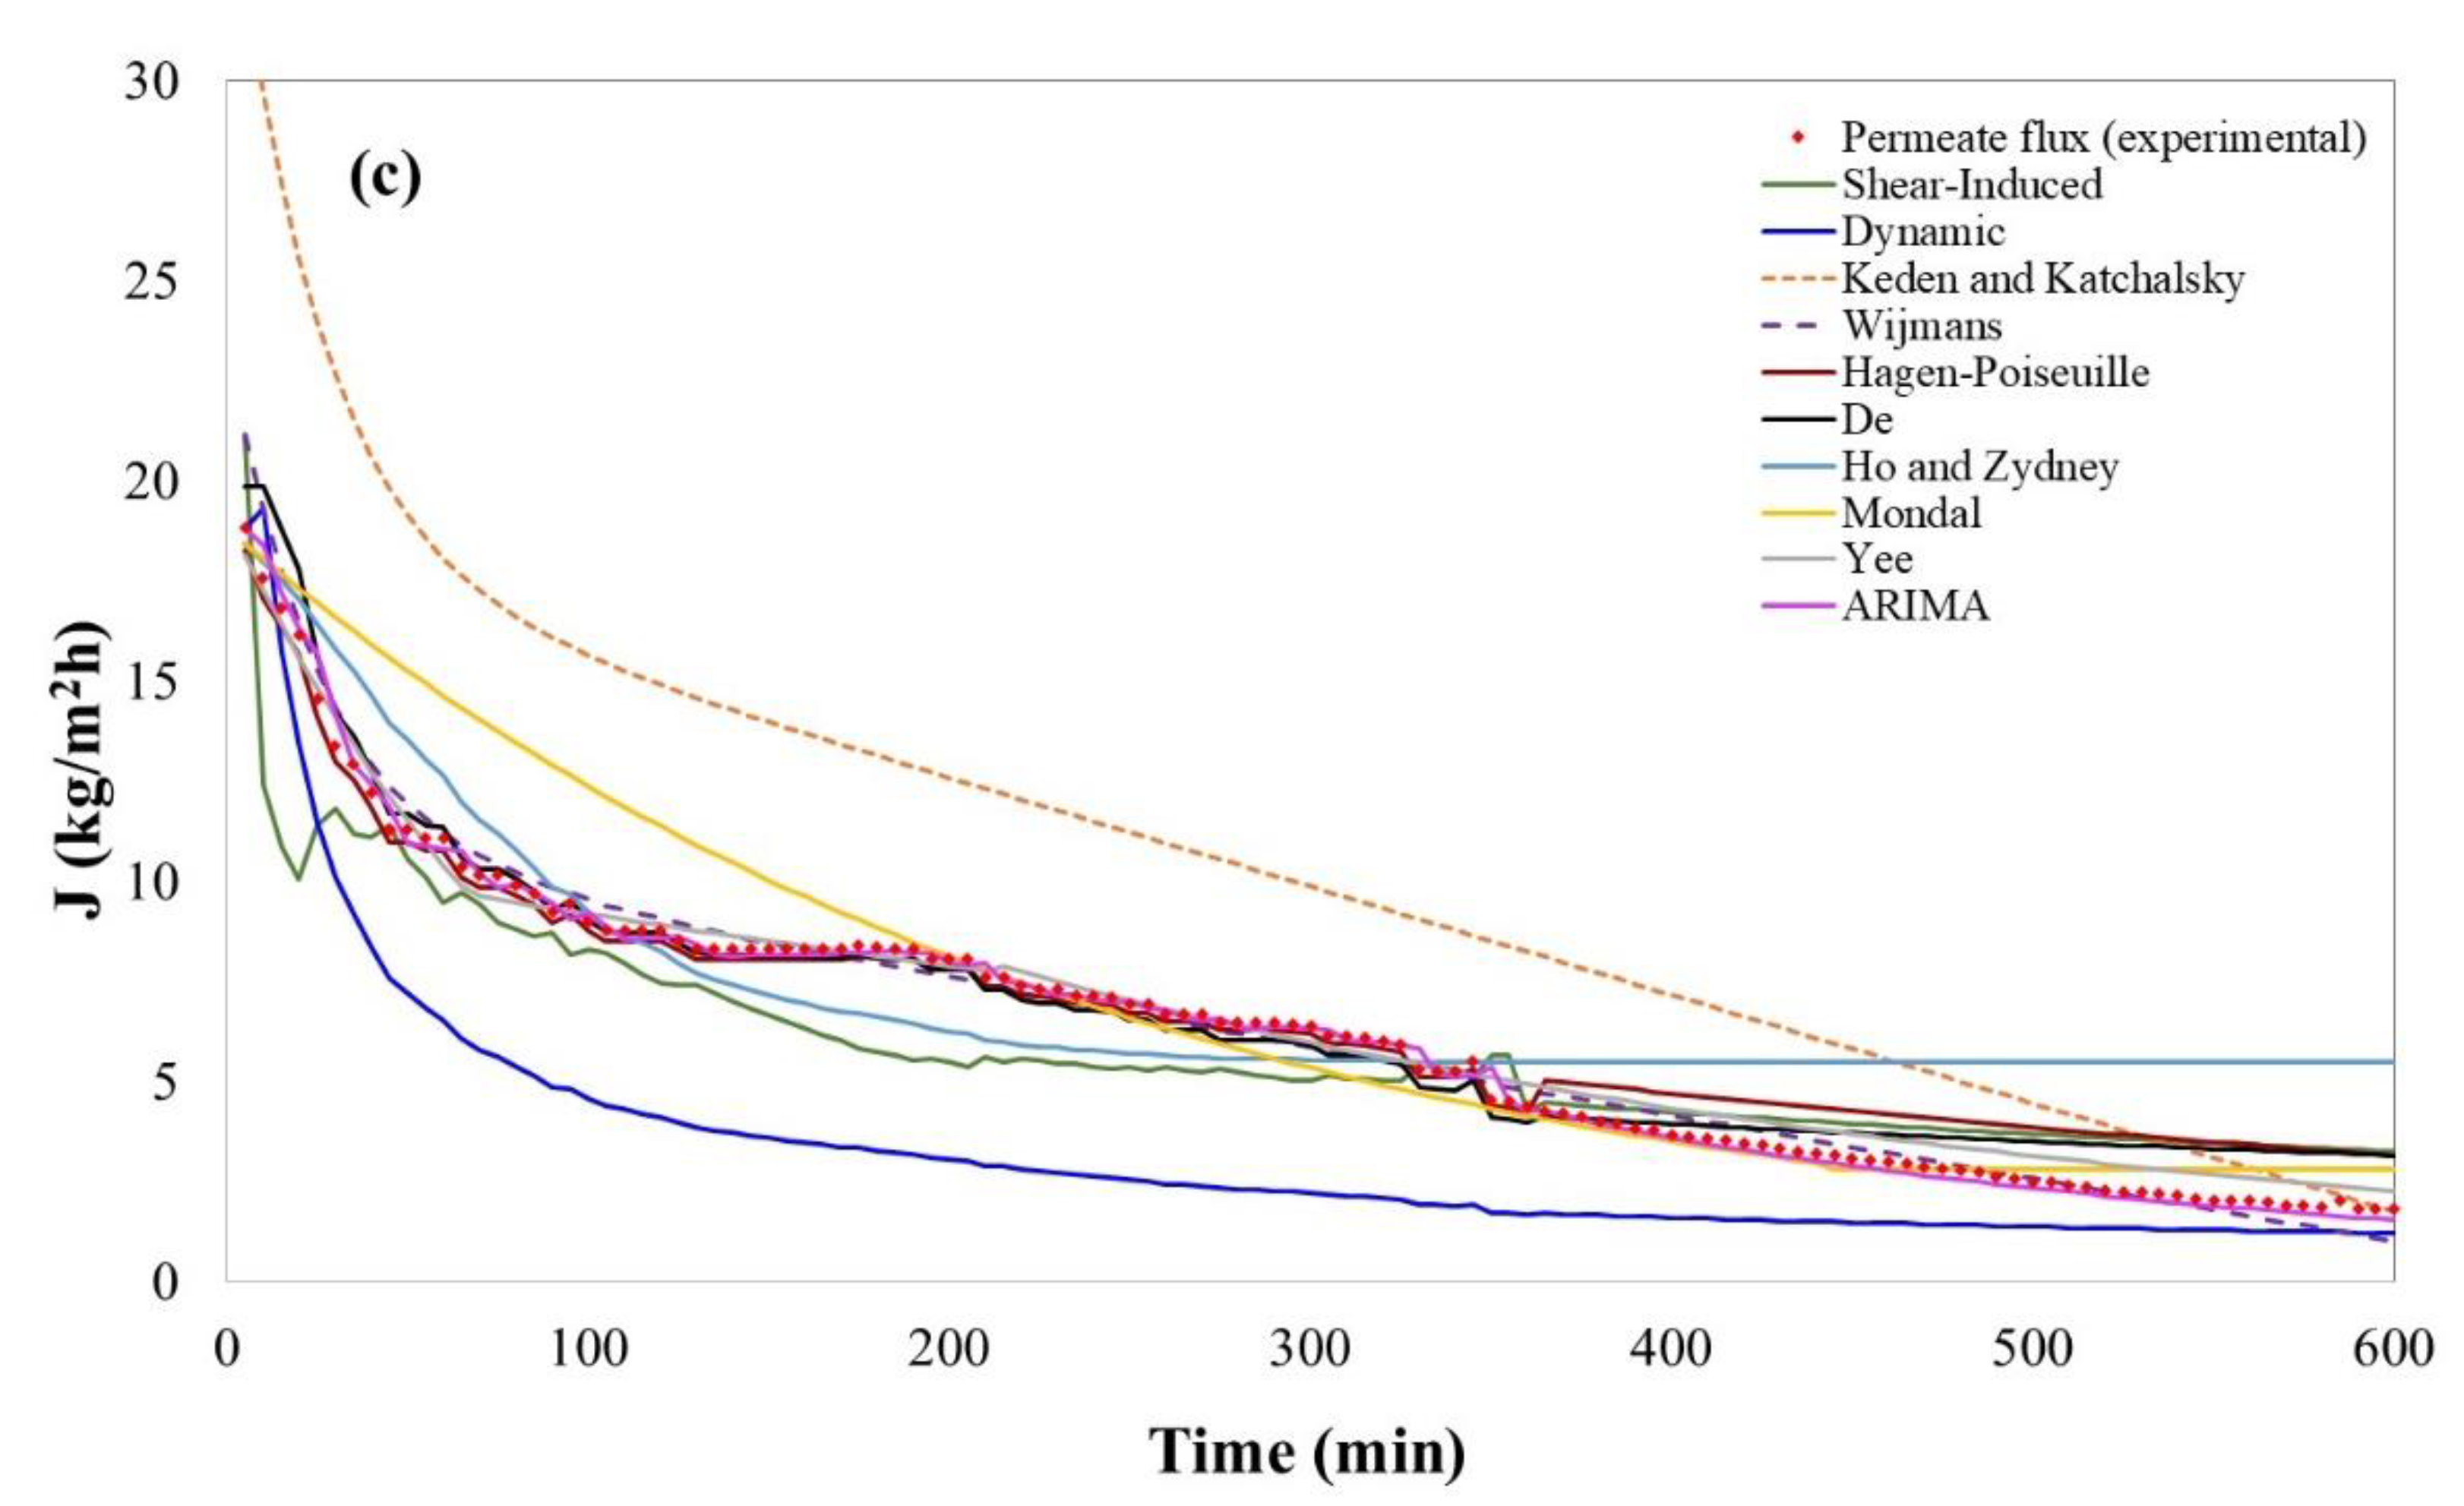
4.1. Models’ Performance in Bergamot Juice Clarification
4.2. Models’ Performance in Kiwifruit Juice Clarification
4.3. Models’ Performance in Pomegranate Juice Clarification
5. Conclusions
Supplementary Materials
Author Contributions
Funding
Institutional Review Board Statement
Informed Consent Statement
Data Availability Statement
Conflicts of Interest
Nomenclature
| A | Membrane area: m2 | Sh | Sherwood number, dimensionless |
| Ad | Membrane area in cell, m2 | Sc | Schmidt number, dimensionless |
| Cb | Bulk concentration, kgm−3 | Pe | Peclet number, dimensionless |
| CCL | Boundary layer concentration, kgm−3 | Wd | Stability factor with respect to deposition (parameter in No. 4.4, Table 4) |
| Cg | Gel concentration, kgm−3 | s | Sedimentation coefficient |
| Cgv | Concentration gel layer in volume, m3 | t | Time, s |
| Cm | Intrinsic concentration, kgm−3 | tR | Fouling phase time, s |
| Cp | Permeated concentration, kgm−3 | τ | Tortuosity, dimensionless |
| C0v | Feed concentration, kgm−3 | T | Temperature, °C |
| Dm | Equivalent diffusion diameter of macromolecules (parameter in No. 1.11), m | U | Flow velocity, ms−1 |
| D | Diffusivity, m2s−1 | U0 | Initial flow velocity, ms−1 |
| d | Diameter of the module, m | v(L) | Average permeate velocity on the length of the filter channel, ms−1 |
| dh | Hydraulic diameter, m | vf | Local filtrate velocity (parameter No. 1.8), ms−1 |
| dp | Pore diameter, m | X(t) | Position change of the equilibrium zone (parameter in No. 4.5) |
| F | Intermolecular interactions | b | Radius of the stirred cell (parameter of No. 1.8) |
| fc | Marchetti correction factor | V | Permeate volume (parameter in No. 3.10), L |
| fcp | Capilar effect | Vc | Permeate volume at the reference time point (parameter in No. 3.10), L |
| b | Inverse of the solute density (parameter of No. 1.9) | V | Permeate volume, m3 |
| H | Height of liquid over membrane (parameter of No. 1.9), m | V0 | Initial permeate volume, m3 |
| η | Non-dimensional distance (parameter of No. 1.9) = x/H | v | Specific partial volume, kgm3 |
| ϕ | Non-dimensional concentration (parameter of No. 1.9) = c/co | v0 | Specific partial initial volume, kgm3 |
| fd | Dipole effect | VRF | Volume reduction factor, dimensionless |
| fe | Steric effect | v | Kinematic viscosity, m2s−1 |
| H | Thickness of the gel layer, m | xi | Proportional parameter of permeability in No. 1.3 |
| J | Permeate flux, ms−1 | ∆x | Membrane thickness, m |
| Jf | Final permeate flux, ms−1 | X12 | Flory-Huggins parameter |
| Jlim | Limit permeate flux, ms−1 | z* | Axial position for osmotic pressure, m |
| J∞ | Saturation (equilibrium) volumetric permeate flux, m3m−2s−1 | ||
| Jss | Steady-state permeate flux, ms−1 | Greek symbols | |
| JW | Flux of pure water permeate, ms−1 | δ | Thickness of the boundary layer, m |
| J* | Hydraulic lifting speed, ms−1 | ∆π | Osmotic pressure, Pa |
| Jo | Balance between solute input and output, | γ | Shear rate, ms−1 |
| k | Mass transfer coefficient, ms−1 | γm | Shear rate at the wall (parameter in No. 1.11), s−1 |
| ko | Ideal mass transfer coefficient, ms−1 | Ɛ | Porosity of the membrane, dimensionless |
| K | Boltzmann constant (parameter in No. 1.11), Jmol−1K−1 | α | Specific resistance of the deposit on membrane, kgm2 |
| L | Length of the module, m | ϵ | Specific gel resistance, m−2 |
| Lp | Membrane permeability, mPa−1s−1 | ƐCL | Boundary layer porosity, dimensionless |
| Lph | Effective permeability reverse flow, | β | Parameter of No. 1.5 |
| mp | Deposited cake weight, kg | σ | Reflection coefficient |
| MW | Membrane cut-off limit, gmol−1 | Ɛg | Solidity of the gel layer, % |
| ∆P | Transmembrane pressure, Pa | εst | Steady-state value of the average solidity, % |
| Q | Flow rate, m3s−1 | μ0 | Initial viscosity, Pa s |
| Rm | Membrane resistance, m−1 | μb | Viscosity in the bulk, Pa s |
| RM | Fouled membrane resistance, m−1 | μ | Viscosity, Pa s |
| Rad,ss | Adsorption resistance, m−1 | ρ | Feed density, kgm−3 |
| Rcp | Concentration polarization resistance, m−1 | ρpol | Membrane polymer density, kgm−3 |
| Rcp,ss | Steady-state concentration polarization resistance, m−1 | γa | Axial speed, ms−1 |
| Re | Reynolds number, dimensionless | υpo | Osmotic pressure limiting flux (m3 m−2 s−1) |
| Rf | Irreversible resistance, m−1 | X12 | Flory–Huggins interaction parameter |
| Rg | Gel resistance, m−1 | ϕ | Volume fraction of particles at the distance x from the membrane surface |
| Rm | Hydraulic resistance, m−1 | ϕ | 1/Jlim (parameter of No. 3.11), m2sm−3 |
| Experimental resistance (constant ΔP), m−1 | |||
| Rm i−1 | Accumulated resistance at ti−1, | ||
| Concentration polarization differential resistance, dimensionless | |||
| Rt | Total resistance, m−1 | ||
| rCL | Specific resistance of the boundary layer, m−1 | ||
| ri | Cell radius, m | ||
| ro | Initial cell radius, m | ||
| rp | Particle radius, m | ||
| rpp | Membrane pore radius, m | ||
References
- Van den Berg, G.B.; Smolders, C.A. Flux decline in ultrafiltration processes. Desalination 1990. [Google Scholar] [CrossRef]
- Blatt, W.F.; Dravid, A.; Michaels, A.S.; Nelsen, L. Solute Polarization and Cake Formation in Membrane Ultrafiltration: Causes, Consequences, and Control Techniques. Membr. Sci. Technol. 1970, 47–97. [Google Scholar] [CrossRef]
- Rodgers, V.G.J. Membrane Processes, by R. Rautenbach and R. Albrecht, John Wiley & Sons, UK (1989, reprinted 1994). 459 pages. ISBN 0-47-191-1100. Dev. Chem. Eng. Miner. Process. 2008. [Google Scholar] [CrossRef]
- Lipnizki, F.; Ruby-Figueroa, R. Membrane operations in the brewing and sugar production. In Integrated Membrane Operations in the Food Production; Cassano, A., Drioli, E., Eds.; Verlag Walter de Gruyter & Co.: Berlin, Germany, 2013; pp. 163–195. ISBN 3110284677. [Google Scholar]
- Salahi, A.; Abbasi, M.; Mohammadi, T. Permeate flux decline during UF of oily wastewater: Experimental and modeling. Desalination 2010, 251, 153–160. [Google Scholar] [CrossRef]
- Ochando-Pulido, J.M.; Verardo, V.; Segura-Carretero, A.; Martinez-Ferez, A. Technical optimization of an integrated UF/NF pilot plant for conjoint batch treatment of two-phase olives and olive oil washing wastewaters. Desalination 2015, 364, 82–89. [Google Scholar] [CrossRef]
- Salahi, A.; Mohammadi, T.; Mosayebi Behbahani, R.; Hemmati, M. Asymmetric polyethersulfone ultrafiltration membranes for oily wastewater treatment: Synthesis, characterization, ANFIS modeling, and performance. J. Environ. Chem. Eng. 2015, 3, 170–178. [Google Scholar] [CrossRef]
- Zhu, Y.; Zhang, X.; Zhang, H. System dynamics modeling and simulation of a coagulation–ultrafiltration process for the treatment of drinking water. Desalin. Water Treat. 2016, 57, 505–517. [Google Scholar] [CrossRef]
- Sousa, M.R.S.; Lora-Garcia, J.; López-Pérez, M.F. Modelling approach to an ultrafiltration process for the removal of dissolved and colloidal substances from treated wastewater for reuse in recycled paper manufacturing. J. Water Process Eng. 2018, 21, 96–106. [Google Scholar] [CrossRef]
- Torkamanzadeh, M.; Jahanshahi, M.; Peyravi, M.; Rad, A.S. Comparative experimental study on fouling mechanisms in nano-porous membrane: Cheese whey ultrafiltration as a case study. Water Sci. Technol. 2016, 74, 2737–2750. [Google Scholar] [CrossRef] [PubMed][Green Version]
- Marchese, J.; Ochoa, N.A.; Pagliero, C.; Almandoz, C. Pilot-scale ultrafiltration of an emulsified oil wastewater. Environ. Sci. Technol. 2000. [Google Scholar] [CrossRef]
- Díaz, V.H.G.; Prado-Rubio, O.A.; Willis, M.J.; von Stosch, M. Dynamic Hybrid Model for Ultrafiltration Membrane Processes; Elsevier Masson SAS: Amsterdam, The Netherlands, 2017; Volume 40, ISBN 9780444639653. [Google Scholar]
- Salahi, A.; Mohammadi, T.; Behbahani, R.M.; Hemati, M. PES and PES/PAN Blend Ultrafiltration Hollow Fiber Membranes for Oily Wastewater Treatment: Preparation, Experimental Investigation, Fouling, and Modeling. Adv. Polym. Technol. 2015, 34. [Google Scholar] [CrossRef]
- Kurada, K.V.; De Tanmay, S. Modeling of cross flow hollow fiber ultrafiltration for treatment of effluent from Railway Workshop. J. Memb. Sci. 2018, 551, 223–233. [Google Scholar] [CrossRef]
- Klimkiewicz, A.; Cervera-Padrell, A.E.; van den Berg, F.W.J. Multilevel Modeling for Data Mining of Downstream Bio-Industrial Processes. Chemom. Intell. Lab. Syst. 2016, 154, 62–71. [Google Scholar] [CrossRef]
- Roa, R.; Zholkovskiy, E.K.; Nägele, G. Ultrafiltration modeling of non-ionic microgels. Soft Matter 2015, 11, 4106–4122. [Google Scholar] [CrossRef] [PubMed]
- Vincent Vela, M.C.; Álvarez Blanco, S.; Lora García, J.; Gozálvez-Zafrilla, J.M.; Bergantiños Rodríguez, E. Modelling of flux decline in crossflow ultrafiltration of macromolecules: Comparison between predicted and experimental results. Desalination 2007, 204, 328–334. [Google Scholar] [CrossRef]
- Astudillo-Castro, C.L. Limiting flux and critical transmembrane pressure determination using an exponential model: The effect of concentration factor, temperature, and cross-flow velocity during casein micelle concentration by microfiltration. Ind. Eng. Chem. Res. 2015, 54, 414–425. [Google Scholar] [CrossRef]
- Chamberland, J.; Bouyer, A.; Benoit, S.; Provault, C.; Bérubé, A.; Doyen, A.; Pouliot, Y. Efficiency assessment of water reclamation processes in milk protein concentrate manufacturing plants: A predictive analysis. J. Food Eng. 2020. [Google Scholar] [CrossRef]
- Ng, K.S.Y.; Haribabu, M.; Harvie, D.J.E.; Dunstan, D.E.; Martin, G.J.O. Mechanisms of flux decline in skim milk ultrafiltration: A review. J. Memb. Sci. 2017, 523, 144–162. [Google Scholar] [CrossRef]
- Bhattacharya, P.K.; Agarwal, S.; De, S.; Rama Gopal, U.V.S. Ultrafiltration of sugar cane juice for recovery of sugar: Analysis of flux and retention. Sep. Purif. Technol. 2001, 21, 247–259. [Google Scholar] [CrossRef]
- Vu, T.; LeBlanc, J.; Chou, C.C. Clarification of sugarcane juice by ultrafiltration membrane: Toward the direct production of refined cane sugar. J. Food Eng. 2020. [Google Scholar] [CrossRef]
- Krishna Kumar, N.S.; Yea, M.K.; Cheryan, M. Ultrafiltration of soy protein concentrate: Performance and modelling of spiral and tubular polymeric modules. J. Memb. Sci. 2004, 244, 235–242. [Google Scholar] [CrossRef]
- Bacchin, P.; Aimar, P.; Sanchez, V. Influence of surface interaction on transfer during colloid ultrafiltration. J. Memb. Sci. 1996, 115, 49–63. [Google Scholar] [CrossRef]
- Bhattacharjee, C.; Bhattacharya, P.K. Prediction of limiting flux in ultrafiltration of kraft black liquor. J. Memb. Sci. 1992, 72, 137–147. [Google Scholar] [CrossRef]
- Cassano, A.; Conidi, C.; Drioli, E. A Membrane-Based Process for the Valorization of the Bergamot Juice. Sep. Sci. Technol. 2013, 48, 537–546. [Google Scholar] [CrossRef]
- Conidi, C.; Cassano, A.; Drioli, E. A membrane-based study for the recovery of polyphenols from bergamot juice. J. Memb. Sci. 2011, 375, 182–190. [Google Scholar] [CrossRef]
- Jiraratananon, R.; Chanachai, A. A study of fouling in the ultrafiltration of passion fruit juice. J. Memb. Sci. 1996, 111, 39–48. [Google Scholar] [CrossRef]
- Rai, P.; Majumdar, G.C.; Sharma, G.; Das Gupta, S.; De, S. Effect of Various Cutoff Membranes on Permeate Flux and Quality During Filtration of Mosambi (Citrus Sinensis (L.) Osbeck) Juice. Food Bioprod. Process. 2006, 84, 213–219. [Google Scholar] [CrossRef]
- Conidi, C.; Cassano, A. Recovery of phenolic compounds from bergamot juice by nanofiltration membranes. Desalin. Water Treat. 2015, 56, 3510–3518. [Google Scholar] [CrossRef]
- Cassano, A.; Donato, L.; Drioli, E. Ultrafiltration of kiwifruit juice: Operating parameters, juice quality and membrane fouling. J. Food Eng. 2007, 79, 613–621. [Google Scholar] [CrossRef]
- Cassano, A.; Jiao, B.; Drioli, E. Production of concentrated kiwifruit juice by integrated membrane process. Food Res. Int. 2004, 37, 139–148. [Google Scholar] [CrossRef]
- Cassano, A.; Donato, L.; Conidi, C.; Drioli, E. Recovery of bioactive compounds in kiwifruit juice by ultrafiltration. Innov. Food Sci. Emerg. Technol. 2008, 9, 556–562. [Google Scholar] [CrossRef]
- Cassano, A.; Conidi, C.; Drioli, E. Clarification and concentration of pomegranate juice (Punica granatum L.) using membrane processes. J. Food Eng. 2011, 107, 366–373. [Google Scholar] [CrossRef]
- Conidi, C.; Cassano, A.; Caiazzo, F.; Drioli, E. Separation and purification of phenolic compounds from pomegranate juice by ultrafiltration and nanofiltration membranes. J. Food Eng. 2017, 195, 1–13. [Google Scholar] [CrossRef]
- Cassano, A.; Conidi, C.; Tasselli, F. Clarification of pomegranate juice (Punica granatum L.) by hollow fibre membranes: Analyses of membrane fouling and performance. J. Chem. Technol. Biotechnol. 2015, 90, 859–866. [Google Scholar] [CrossRef]
- Vladisavljević, G.T.; Vukosavljević, P.; Bukvić, B. Permeate flux and fouling resistance in ultrafiltration of depectinized apple juice using ceramic membranes. J. Food Eng. 2003, 60, 241–247. [Google Scholar] [CrossRef]
- Giuffrè, A.M. Bergamot (Citrus bergamia, Risso): The effects of cultivar and harvest date on functional properties of juice and cloudy juice. Antioxidants 2019, 8, 221. [Google Scholar] [CrossRef] [PubMed]
- Tsiokanos, E.; Tsafantakis, N.; Termentzi, A.; Aligiannis, N.; Skaltsounis, L.A.; Fokialakis, N. Phytochemical characteristics of bergamot oranges from the Ionian islands of Greece: A multi-analytical approach with emphasis in the distribution of neohesperidose flavanones. Food Chem. 2021, 343, 128400. [Google Scholar] [CrossRef] [PubMed]
- Cautela, D.; Vella, F.M.; Laratta, B. The effect of processing methods on phytochemical composition in bergamot juice. Foods 2019, 8, 474. [Google Scholar] [CrossRef]
- Hashemi, S.M.B.; Jafarpour, D. Fermentation of bergamot juice with Lactobacillus plantarum strains in pure and mixed fermentations: Chemical composition, antioxidant activity and sensorial properties. LWT 2020, 131, 109803. [Google Scholar] [CrossRef]
- Cassano, A.; Figoli, A.; Tagarelli, A.; Sindona, G.; Drioli, E. Integrated membrane process for the production of highly nutritional kiwifruit juice. Desalination 2006, 189, 21–30. [Google Scholar] [CrossRef]
- Conidi, C.; Drioli, E.; Cassano, A. Perspective of membrane technology in pomegranate juice processing: A review. Foods 2020, 9, 889. [Google Scholar] [CrossRef] [PubMed]
- Putnik, P.; Kresoja, Ž.; Bosiljkov, T.; Režek Jambrak, A.; Barba, F.J.; Lorenzo, J.M.; Roohinejad, S.; Granato, D.; Žuntar, I.; Bursać Kovačević, D. Comparing the effects of thermal and non-thermal technologies on pomegranate juice quality: A review. Food Chem. 2019, 279, 150–161. [Google Scholar] [CrossRef] [PubMed]
- Vela, M.C.V.; Blanco, S.Á.; García, J.L.; Rodríguez, E.B. Permeate flux decline prediction in the ultrafiltration of macromolecules with empirical estimation of the gel layer concentration. Desalination 2008, 221, 390–394. [Google Scholar] [CrossRef]
- Cheryan, M. Ultrafiltration and Microfiltration Handbook; CRC Press: Boca Raton, FL, USA, 1998; ISBN 9781566765985. [Google Scholar]
- Saad, M.A. Early discovery of RO membrane fouling and real-time monitoring of plant performance for optimizing cost of water. Desalination 2004, 165, 183–191. [Google Scholar] [CrossRef]
- Yu, C.H.; Fang, L.C.; Lateef, S.K.; Wu, C.H.; Lin, C.F. Enzymatic treatment for controlling irreversible membrane fouling in cross-flow humic acid-fed ultrafiltration. J. Hazard. Mater. 2010, 177, 1153–1158. [Google Scholar] [CrossRef]
- Belfort, G.; Davis, R.H.; Zydney, A.L. The behavior of suspensions and macromolecular solutions in crossflow microfiltration. J. Memb. Sci. 1994, 96, 1–58. [Google Scholar] [CrossRef]
- Zeman, L.J.; Zydney, A.L.; Dekker, M. Microfiltration and Ultrafiltration—Principles and Aplications. Chemie Ing. Tech. 1996, 1479. [Google Scholar] [CrossRef]
- Tarleton, E.S.; Wakeman, R.J. Understanding flux decline in crossflow microfiltration: Part I—Effects of particle and pore size. Chem. Eng. Res. Des. 1993, 71, 399–410. [Google Scholar]
- Wetterau, G.E.; Clark, M.M.; Anselme, C. A dynamic model for predicting fouling effects during the ultrafiltration of a groundwater. J. Memb. Sci. 1996, 109, 185–204. [Google Scholar] [CrossRef]
- Crozes, G.F.; Jacangelo, J.G.; Anselme, C.; Laîné, J.M. Impact of ultrafiltration operating conditions on membrane irreversible fouling. J. Memb. Sci. 1997, 124, 63–76. [Google Scholar] [CrossRef]
- Sablani, S.; Goosen, M.; Al-Belushi, R.; Wilf, M. Concentration polarization in ultrafiltration and reverse osmosis: A critical review. Desalination 2001, 141, 269–289. [Google Scholar] [CrossRef]
- Vincent Vela, M.C.; Rodríguez, E.B.; Álvarez Blanco, S.; Lora García, J. Validation of dynamic models to predict flux decline in the ultrafiltration of macromolecules. Desalination 2007, 204, 344–350. [Google Scholar] [CrossRef]
- Strathmann, H.; Giorno, L.; Drioli, E. An introduction to membrane science and technology. J. Proteome Res. 2006, 10. [Google Scholar] [CrossRef]
- Davis, R. Modeling of fouling of crossflow microfiltration membranes. Sep. Purif. Rev. 1992, 21, 75–126. [Google Scholar] [CrossRef]
- Bhattacharjee, S.; Bhattacharya, P.K. Flux decline behaviour with low molecular weight solutes during ultrafiltration in an unstirred batch cell. J. Memb. Sci. 1992, 72, 149–161. [Google Scholar] [CrossRef]
- Mallubhotla, H.; Belfort, G. Semiempirical modeling of cross-flow microfiltration with periodic reverse filtration. Ind. Eng. Chem. Res. 1996, 35, 2920–2928. [Google Scholar] [CrossRef]
- Hermia, J. Constant Pressure Blocking Filtration Laws-Application to Power-Law Non-Newtonian Fluids. Trans. Inst. Chem. Eng. 1982, 60, 183–187. [Google Scholar]
- Mondal, S.; Cassano, A.; Conidi, C.; De, S. Modeling of gel layer transport during ultrafiltration of fruit juice with non-Newtonian fluid rheology. Food Bioprod. Process. 2016, 100, 72–84. [Google Scholar] [CrossRef]
- Trettin, D.R.; Doshi, M.R. Ultrafiltration in an unstirred batch cell. Reply to comments. Ind. Eng. Chem. Fundam. 2005. [Google Scholar] [CrossRef]
- Zydney, A.L.; Colton, C.K. A Concentration Polarization Model for the Filtrate Flux in Cross-Flow Microfiltration of Particulate Suspensions. Chem. Eng. Commun. 1986, 47, 1–21. [Google Scholar] [CrossRef]
- Singh, V.; Jain, P.K.; Das, C. Performance of spiral wound ultrafiltration membrane module for with and without permeate recycle: Experimental and theoretical consideration. Desalination 2013, 322, 94–103. [Google Scholar] [CrossRef]
- Field, R.W.; Wu, D.; Howell, J.A.; Gupta, B.B. Critical flux concept for microfiltration fouling. J. Memb. Sci. 1995, 100, 259–272. [Google Scholar] [CrossRef]
- Ho, C.C.; Zydney, A.L. A combined pore blockage and cake filtration model for protein fouling during microfiltration. J. Colloid Interface Sci. 2000, 232, 389–399. [Google Scholar] [CrossRef]
- Furukawa, T.; Kokubo, K.; Nakamura, K.; Matsumoto, K. Modeling of the permeate flux decline during MF and UF cross-flow filtration of soy sauce lees. J. Memb. Sci. 2008, 322, 491–502. [Google Scholar] [CrossRef]
- Soler-Cabezas, J.L.; Torà-Grau, M.; Vincent-Vela, M.C.; Mendoza-Roca, J.A.; Martínez-Francisco, F.J. Ultrafiltration of municipal wastewater: Study on fouling models and fouling mechanisms. Desalin. Water Treat. 2015, 56, 3427–3437. [Google Scholar] [CrossRef]
- Ruby-Figueroa, R.; Saavedra, J.; Bahamonde, N.; Cassano, A. Permeate flux prediction in the ultrafiltration of fruit juices by ARIMA models. J. Memb. Sci. 2017, 524, 108–116. [Google Scholar] [CrossRef]
- Vincent Vela, M.C.; Álvarez Blanco, S.; Lora García, J.; Gozálvez-Zafrilla, J.M.; Bergantiños Rodríguez, E. Utilization of a shear induced diffusion model to predict permeate flux in the crossflow ultrafiltration of macromolecules. Desalination 2007, 206, 61–68. [Google Scholar] [CrossRef]
- Ren, L.; Yu, S.; Li, J.; Li, L. Pilot study on the effects of operating parameters on membrane fouling during ultrafiltration of alkali/surfactant/polymer flooding wastewater: Optimization and modeling. RSC Adv. 2019, 9, 11111–11122. [Google Scholar] [CrossRef]
- Corbatón-Báguena, M.J.; Vincent-Vela, M.C.; Gozálvez-Zafrilla, J.M.; Álvarez-Blanco, S.; Lora-García, J.; Catalán-Martínez, D. Comparison between artificial neural networks and Hermia’s models to assess ultrafiltration performance. Sep. Purif. Technol. 2016, 170, 434–444. [Google Scholar] [CrossRef]
- Prado-Rubio, O.A.; von Stosch, M. Towards Sustainable Flux Determination for Dynamic Ultrafiltration through Multivariable System Identification. In Computer Aided Chemical Engineering; Elsevier B.V.: Amsterdam, The Netherlands, 2017. [Google Scholar]
- Chew, C.M.; Aroua, M.K.; Hussain, M.A.; Ismail, W.M.Z.W. Practical performance analysis of an industrial-scale ultrafiltration membrane water treatment plant. J. Taiwan Inst. Chem. Eng. 2015, 46, 132–139. [Google Scholar] [CrossRef]
- Carman, P. Fluid flow through a granular bed. Trans. Inst. Chem. Eng J. 1937, 15, 150–156. [Google Scholar] [CrossRef]
- Carman, P. Fundamental principles of industrial filtration. Trans. Inst. Chem. Eng J. 1938, 16, 168–188. [Google Scholar]
- Li, W.; Xing, W.; Xu, N. Modeling of relationship between water permeability and microstructure parameters of ceramic membranes. Desalination 2006, 192, 340–345. [Google Scholar] [CrossRef]
- Mulder, M. Basic Principles of Membrane Technology; Kluwer Academic Publishers: London, UK, 1996; ISBN 0-7923-4247-X (HB). [Google Scholar]
- Scott, K.; Hughes, R.; Staude, E. Industrial Membrane Separation Technology; Blackie Academic and Professional: london, UK, 1997; Volume 130, ISBN 0751403385. [Google Scholar]
- Cheng, T.W.; Wu, J.G. Modified boundary layer resistance model for membrane ultrafiltration. Tamkang J. Sci. Eng. 2001, 4, 111–117. [Google Scholar]
- Ohanessian, K.; Monnot, M.; Moulin, P.; Ferrasse, J.H.; Barca, C.; Soric, A.; Boutin, O. Dead-end and crossflow ultrafiltration process modelling: Application on chemical mechanical polishing wastewaters. Chem. Eng. Res. Des. 2020, 158, 164–176. [Google Scholar] [CrossRef]
- Cheng, T.W.; Yeh, H.M. Complete momentum-balance analysis of permeate flux for ultrafiltration in hollow-fiber modules. Tamkang J. Sci. Eng. 2008, 11, 239–246. [Google Scholar]
- Beicha, A.; Zaamouch, R.; Sulaiman, N.M. Permeate Flux in Ultrafiltration Membrane: A Review. J. Appl. Membr. Sci. Technol. 2017, 14. [Google Scholar] [CrossRef]
- Bhattacharjee, C.; Datta, S. Simulation of continuous stirred ultrafiltration process: An approach based on analytical solution coupled with turbulent back transport. J. Chem. Technol. Biotechnol. 2003, 78, 1135–1141. [Google Scholar] [CrossRef]
- Aimar, P.; Sanchez, V. A novel approach to transfer limiting phenomena during ultrafiitration of macromolecules. Ind. Eng. Chem. Fundam. 1986, 25, 789–798. [Google Scholar] [CrossRef]
- Field, R.W. A theoretical viscosity correction factor for heat transfer and friction in pipe flow. Chem. Eng. Sci. 1990, 45, 1343–1347. [Google Scholar] [CrossRef]
- Fane, A.G.; Fell, C.J.D.; Waters, A.G. The relationship between membrane surface pore characteristics and flux for ultrafiltration membranes. J. Memb. Sci. 1981. [Google Scholar] [CrossRef]
- Jonsson, G. Transport Phenomena in Ultrafiltration: Membrane Selectivity and Boundary Layer Phenomena. Pure Appl. Chem. 1986, 58, 1647–1656. [Google Scholar] [CrossRef][Green Version]
- Bakhshayeshi, M.; Zhou, H.; Olsen, C.; Yuan, W.; Zydney, A.L. Understanding dextran retention data for hollow fiber ultrafiltration membranes. J. Memb. Sci. 2011, 385–386, 243–250. [Google Scholar] [CrossRef]
- Song, L.; Elimelech, M. Theory of concentration polarization in crossflow filtration. J. Chem. Soc. Faraday Trans. 1995. [Google Scholar] [CrossRef]
- Vela, M.C.V.; Bergantiños-Rodríguez, E.; Blanco, S.Á.; García, J.L. Influence of feed concentration on the accuracy of permeate flux decline prediction in ultrafiltration. Desalination 2008, 221, 383–389. [Google Scholar] [CrossRef]
- Jönsson, A.S.; Jönsson, B. Ultrafiltration of colloidal dispersions—A theoretical model of the concentration polarization phenomena. J. Colloid Interface Sci. 1996, 180, 504–518. [Google Scholar] [CrossRef]
- Saksena, S.; Zydney, A.L. Influence of protein-protein interactions on bulk mass transport during ultrafiltration. J. Memb. Sci. 1997, 125, 93–108. [Google Scholar] [CrossRef]
- Bhattacharjee, C.; Datta, S. A numerical simulation for the prediction of flux and rejection during ultrafiltration in unstirred batch cell using variable diffusivity concept. Sep. Purif. Technol. 2001, 24, 13–22. [Google Scholar] [CrossRef]
- Konieczny, K. Modelling of membrane filtration of natural water for potable purposes. Desalination 2002, 143, 123–139. [Google Scholar] [CrossRef]
- Rajca, M.; Bodzek, M.; Konieczny, K. Application of mathematical models to the calculation of ultrafiltration flux in water treatment. Desalination 2009, 239, 100–110. [Google Scholar] [CrossRef]
- Neggaz, Y.; Vargas, M.L.; Dris, A.O.; Riera, F.; Alvarez, R. A combination of serial resistances and concentration polarization models along the membrane in ultrafiltration of pectin and albumin solutions. Sep. Purif. Technol. 2007, 54, 18–27. [Google Scholar] [CrossRef]
- Michaels, A.S. New Separation Technique for the CPl. Chern. Eng. Prog. 1968, 64, 31–43. [Google Scholar]
- Porter, M.C. Concentration Polarization with Membrane Ultrafiltration. Ind. Eng. Chem. Prod. Res. Dev. 1972, 11, 234–248. [Google Scholar] [CrossRef]
- Shen, J.J.S.; Probsteln, R.F. On the Prediction of Limiting Flux in Laminar Ultrafiltration of Macromolecular Solutions. Ind. Eng. Chem. Fundam. 1977, 16, 459–465. [Google Scholar] [CrossRef]
- Probstein, R.F.; Shen, J.S.; Leung, W.F. Ultrafiltration of macromolecular solutions at high polarization in laminar channel flow. Desalination 1977, 24, 1–16. [Google Scholar] [CrossRef]
- Probstein, R.F.; Leung, W.F.; Alliance, Y. Determination of diffusivity and gel concentration in macromolecular solutions by ultrafiltration. J. Phys. Chem. 1979. [Google Scholar] [CrossRef]
- Ganguly, S.; Bhattacharya, P.K. Development of concentration profile and prediction of flux for ultrafiltration in a radial cross-flow cell. J. Memb. Sci. 1994. [Google Scholar] [CrossRef]
- Ghose, S.; Bhattacharjee, C.; Datta, S. Simulation of unstirred batch ultrafiltration process based on a reversible pore-plugging model. J. Memb. Sci. 2000. [Google Scholar] [CrossRef]
- Trettin, D.R.; Doshi, M.R. Limiting flux in ultrafiltration of macromolecular solutions. Chem. Eng. Commun. 1980. [Google Scholar] [CrossRef]
- Davis, R.H.; Leighton, D.T. Shear-induced transport of a particle layer along a porous wall. Chem. Eng. Sci. 1987. [Google Scholar] [CrossRef]
- Romero, C.A.; Davis, R.H. Global model of crossflow microfiltration based on hydrodynamic particle diffusion. J. Memb. Sci. 1988. [Google Scholar] [CrossRef]
- Song, L. Flux decline in crossflow microfiltration and ultrafiltration: Mechanisms and modeling of membrane fouling. J. Memb. Sci. 1998, 139, 183–200. [Google Scholar] [CrossRef]
- Vincent Vela, M.C.; Blanco, S.Á.; García, J.L.; Rodríguez, E.B. Application of a dynamic model for predicting flux decline in crossflow ultrafiltration. Desalination 2006. [Google Scholar] [CrossRef]
- Zhang, M.; Song, L. Mechanisms and parameters affecting flux decline in cross-flow microfiltration and ultrafiltration of colloids. Environ. Sci. Technol. 2000. [Google Scholar] [CrossRef]
- Wijmans, J.G.; Nakao, S.; Smolders, C.A. Flux limitation in ultrafiltration: Osmotic pressure model and gel layer model. J. Memb. Sci. 1984, 20, 115–124. [Google Scholar] [CrossRef]
- Kedem, O.; Katchalsky, A. Thermodynamic analysis of the permeability of biological membranes to non-electrolytes. Biochim. Biophys. Acta 1958, 27, 229–246. [Google Scholar] [CrossRef]
- Huter, J. Model-Based Design and Process Optimization of Continuous Single Pass Tangential Flow Filtration Focusing on Continuous Bioprocessing. Processes 2019, 7, 781. [Google Scholar] [CrossRef]
- Nakao, S.-I.; Kimura, S. Analysis of solutes rejection in ultrafiltration. J. Chem. Eng. Japan 1981, 14, 32–37. [Google Scholar] [CrossRef]
- Guadix, A.; Sørensen, E.; Papageorgiou, L.G.; Guadix, E.M. Optimal design and operation of continuous ultrafiltration plants. J. Memb. Sci. 2004, 235, 131–138. [Google Scholar] [CrossRef]
- Matos, M.; Gutiérrez, G.; Lobo, A.; Coca, J.; Pazos, C.; Benito, J.M. Surfactant effect on the ultrafiltration of oil-in-water emulsions using ceramic membranes. J. Memb. Sci. 2016, 520, 749–759. [Google Scholar] [CrossRef]
- Chakraborty, D.; Naskar, M.; Sarkar, D.; Bhattacharjee, C. Performance characterization and steady-state modelling of spinning basket membrane module. Sep. Sci. Technol. 2017, 52, 2173–2189. [Google Scholar] [CrossRef]
- Goldsmith, R.L. Macromolecular Ultrafiltration with Microporous Membranes. Ind. Eng. Chem. Fundam. 1971, 10, 113–120. [Google Scholar] [CrossRef]
- Wijmans, J.G.; Nakao, S.; Van Den Berg, J.W.A.; Troelstra, F.R.; Smolders, C.A. Hydrodynamic resistance of concentration polarization boundary layers in ultrafiltration. J. Memb. Sci. 1985. [Google Scholar] [CrossRef]
- Baptista, E.A.; Pinto, P.C.R.; Mota, I.F.; Loureiro, J.M.; Rodrigues, A.E. Ultrafiltration of ethanol/water extract of Eucalyptus globulus bark: Resistance and cake build up analysis. Sep. Purif. Technol. 2015, 144, 256–266. [Google Scholar] [CrossRef]
- Kanani, D.M.; Ghosh, R. A constant flux based mathematical model for predicting permeate flux decline in constant pressure protein ultrafiltration. J. Memb. Sci. 2007, 290, 207–215. [Google Scholar] [CrossRef]
- Sarkar, D.; Bhattacharya, A.; Bhattacharjee, C. Modeling the performance of a standard single stirred ultrafiltration cell using variable velocity back transport flux. Desalination 2010, 261, 89–98. [Google Scholar] [CrossRef]
- Binabaji, E.; Ma, J.; Rao, S.; Zydney, A.L. Theoretical analysis of the ultrafiltration behavior of highly concentrated protein solutions. J. Memb. Sci. 2015, 494, 216–223. [Google Scholar] [CrossRef]
- Markels, J.H.; Lynn, S.; Radke, C.J. Cross-flow ultrafiltration of micellar surfactant solutions. AIChE J. 1995. [Google Scholar] [CrossRef]
- Noor, S.A.M.M.S. Resistance in Series Model for Ultrafiltration Xylose Reductase from Product Mixtures. J. Appl. Sci. Agric. 2014, 10, 222–227. [Google Scholar]
- Azimah, S.; Mimi Sakinah, A. Resistance in Series Model for Ultrafiltration Betacyanin From Hylocereus Polyhizus Peels. J. Appl. Sci. 2014, 14, 1343–1346. [Google Scholar] [CrossRef][Green Version]
- Huisman, I.H.; Dutré, B.; Persson, K.M.; Trägårdh, G. Water permeability in ultrafiltration and microfiltration: Viscous and electroviscous effects. Desalination 1997, 113, 95–103. [Google Scholar] [CrossRef]
- Marcos, B.; Moresoli, C.; Skorepova, J.; Vaughan, B. CFD modeling of a transient hollow fiber ultrafiltration system for protein concentration. J. Memb. Sci. 2009, 337, 136–144. [Google Scholar] [CrossRef]
- Das, B.; Bhattacharjee, S.; Bhattacharjee, C. Recovery of Whey Proteins and Enzymatic Hydrolysis of Lactose Derived from Casein Whey Using a Tangential Flow Ultrafiltration Module. J. Inst. Eng. Ser. E 2013, 94, 79–84. [Google Scholar] [CrossRef]
- Cai, M.; Lv, Y.; Luo, S.; Liu, Y.; Sun, P. Fouling Behavior of Polyphenols during Model Juice Ultrafiltration: Effect of Membrane Properties. Food Bioprocess Technol. 2018, 11, 1787–1793. [Google Scholar] [CrossRef]
- Mondal, M.; De, S. Purification of Polyphenols from Green Tea Leaves and Performance Prediction Using the Blend Hollow Fiber Ultrafiltration Membrane. Food Bioprocess Technol. 2019, 933–953. [Google Scholar] [CrossRef]
- Serra, C.; Clifton, M.J.; Moulin, P.; Rouch, J.C.; Aptel, P. Dead-end ultrafiltration in hollow fiber modules: Module design and process simulation. J. Memb. Sci. 1998, 145, 159–172. [Google Scholar] [CrossRef]
- Marchetti, P.; Butté, A.; Livingston, A.G. An improved phenomenological model for prediction of solvent permeation through ceramic NF and UF membranes. J. Memb. Sci. 2012, 415–416, 444–458. [Google Scholar] [CrossRef]
- Ghotbi, S.; Pirzadeh, B.; Mohebbi-Kalhori, D.; Abdollahi, A. Numerical investigation of UF membrane to reduce energy consumption using double porosity approach. Water Sci. Technol. 2018, 77, 2907–2916. [Google Scholar] [CrossRef]
- Chudacek, M.W.; Fane, A.G. The dynamics of polarisation in unstirred and stirred ultrafiltration. J. Memb. Sci. 1984, 21, 145–160. [Google Scholar] [CrossRef]
- Gekas, V.; Aimar, P.; Lafaille, J.P.; Sanchez, V. A simulation study of the adsorption-concentration polarisation interplay in protein ultrafiltration. Chem. Eng. Sci. 1993, 48, 2753–2765. [Google Scholar] [CrossRef]
- De, S.; Bhattacharya, P.K. Modeling of ultrafiltration process for a two-component aqueous solution of low and high (gel-forming) molecular weight solutes. J. Memb. Sci. 1997, 136, 57–69. [Google Scholar] [CrossRef]
- Rai, P.; Majumdar, G.C.; DasGupta, S.; De, S. Modeling of permeate flux of synthetic fruit juice and mosambi juice (Citrus sinensis (L.) Osbeck) in stirred continuous ultrafiltration. LWT-Food Sci. Technol. 2007, 40, 1765–1773. [Google Scholar] [CrossRef]
- Banerjee, S.; De, S. An analytical solution of Sherwood number in a stirred continuous cell during steady state ultrafiltration. J. Memb. Sci. 2012, 389, 188–196. [Google Scholar] [CrossRef]
- Sharma, P.; Sarkar, B. Prediction of Permeate Flux During Ultrafiltration of Polysaccharide in a Stirred Batch Cell. Food Bioprocess Technol. 2013, 6, 3634–3643. [Google Scholar] [CrossRef]
- Mondal, S.; Mukherjee, R.; De, S. Process modeling for the removal of phenolic compounds from industrial wastewater using a mixed-matrix membrane. Ind. Eng. Chem. Res. 2015, 54, 514–521. [Google Scholar] [CrossRef]
- Paris, J.; Guichardon, P.; Charbit, F. Transport phenomena in ultrafiltration: A new two-dimensional model compared with classical models. J. Memb. Sci. 2002, 207, 43–58. [Google Scholar] [CrossRef]
- Ghadge, S.; Chavan, M.; Divekar, A.; Vibhandik, A.; Pawar, S.; Marathe, K. Mathematical Modelling for Removal of Mixture of Heavy Metal Ions from Waste-Water Using Micellar Enhanced Ultrafiltration (MEUF) Process. Sep. Sci. Technol. 2015, 50, 365–372. [Google Scholar] [CrossRef]
- Bhattacharjee, C.; Datta, S. Analysis of polarized layer resistance during ultrafiltration of PEG-6000: An approach based on filtration theory. Sep. Purif. Technol. 2003. [Google Scholar] [CrossRef]
- Chang, S.; Fane, A.G.; Waite, T.D. Analysis of constant permeate flow filtration using dead-end hollow fiber membranes. J. Memb. Sci. 2006, 268, 132–141. [Google Scholar] [CrossRef]
- Mohammadi, T.; Kohpeyma, A.; Sadrzadeh, M. Mathematical modeling of flux decline in ultrafiltration. Desalination 2005, 184, 367–375. [Google Scholar] [CrossRef]
- Yeh, H.M.; Chen, Y.F. Modified analysis of permeate flux for ultrafiltration in a solid-rod tubular membrane. J. Memb. Sci. 2005, 251, 255–261. [Google Scholar] [CrossRef]
- Yeh, H.M. Exponential model analysis of permeate flux for ultrafiltration in hollow-fiber modules by momentum balance. Chem. Eng. J. 2009, 147, 202–209. [Google Scholar] [CrossRef]
- Cuellar, M.C.; Zijlmans, T.W.; Straathof, A.J.J.; Heijnen, J.J.; van der Wielen, L.A.M. Model-based evaluation of cell retention by crossflow ultrafiltration during fed-batch fermentations with Escherichia coli. Biochem. Eng. J. 2009, 44, 280–288. [Google Scholar] [CrossRef]
- Yeh, H.M.; Lin, Z.Y.; Li, C.H. Permeate-flux declination for ultrafiltration along membrane tubes. Sep. Sci. Technol. 2010, 45, 1995–2003. [Google Scholar] [CrossRef]
- Corbatón-Báguena, M.J.; Álvarez-Blanco, S.; Vincent-Vela, M.C. Evaluation of fouling resistances during the ultrafiltration of whey model solutions. J. Clean. Prod. 2018, 172, 358–367. [Google Scholar] [CrossRef]
- Chakraborty, D.; Sarkar, D.; Bhattacharjee, C. Modeling and Simulation of Rotating Disk-Membrane Module in Ultrafiltration of Bovine Serum Albumin. Sep. Sci. Technol. 2013, 48, 2549–2566. [Google Scholar] [CrossRef]
- Sarkar, D.; Bhattacharjee, C. Modeling and analytical simulation of rotating disk ultrafiltration module. J. Memb. Sci. 2008, 320, 344–355. [Google Scholar] [CrossRef]
- Bhattacharjee, S.; Sharma, A.; Bhattacharya, P.K. A unified model for flux prediction during batch cell ultrafiltration. J. Memb. Sci. 1996. [Google Scholar] [CrossRef]
- Gaddis, J.L.; Jernigan, D.A.; Spencer, H.G. Determination of Gel Volume Deposited on Ultrafiltration Membranes; ACS Symposium Series; ACS Publications: Washington, DC, USA, 1985; Volume 281, pp. 415–427. [Google Scholar]
- Nakao, S.; Wijmans, J.G.; Smolders, C.A. Resistance to the permeate flux in unstirred ultrafiltration of dissolved macromolecular solutions. J. Memb. Sci. 1986, 26, 165–178. [Google Scholar] [CrossRef]
- Mondal, S.; De Chhaya, S. Modeling of cross flow ultrafiltration of stevia extract in a rectangular cell. J. Food Eng. 2012, 112, 326–337. [Google Scholar] [CrossRef]
- Huang, L.; Morrissey, M.T. Fouling of membranes during microfiltration of surimi wash water: Roles of pore blocking and surface cake formation. J. Memb. Sci. 1998. [Google Scholar] [CrossRef]
- Sarkar, D.; Chakraborty, D.; Naskar, M.; Bhattacharjee, C. Characterization and modeling of radial flow membrane (RFM) module in ultrafiltration. Desalination 2014, 354, 76–86. [Google Scholar] [CrossRef]
- Daufin, G.; Merin, U.; Labbé, J.P.; Quémerais, A.; Kerhervé, F.L. Cleaning of inorganic membranes after whey and milk ultrafiltration. Biotechnol. Bioeng. 1991, 38, 82–89. [Google Scholar] [CrossRef]
- Aryanti, N.; Wardhani, D.H.; Supandi, S. Flux profiles and mathematical modeling of fouling mechanism for ultrafiltration of konjac glucomannan. Sci. Study Res. Chem. Chem. Eng. Biotechnol. Food Ind. 2016, 17, 125–137. [Google Scholar]
- Cohen, R.; Probstein, R.F. Colloidal fouling of reverse osmosis membranes. J. Colloid Interface Sci. 1986, 114, 194–207. [Google Scholar] [CrossRef]
- Kirschner, A.Y.; Cheng, Y.-H.; Paul, D.R.; Field, R.W.; Freeman, B.D. Fouling mechanisms in constant flux crossflow ultrafiltration. J. Memb. Sci. 2019, 574, 65–75. [Google Scholar] [CrossRef]
- Mondal, S.; Rai, C.; De, S. Identification of Fouling Mechanism During Ultrafiltration of Stevia Extract. Food Bioprocess Technol. 2013, 6, 931–940. [Google Scholar] [CrossRef]
- Emani, S.; Uppaluri, R.; Purkait, M.K. Preparation and characterization of low cost ceramic membranes for mosambi juice clarification. Desalination 2013, 317, 32–40. [Google Scholar] [CrossRef]
- Morão, A.; Nunes, J.C.; Sousa, F.; de Amorim, M.T.P.; Escobar, I.C.; Queiroz, J.A. Development of a model for membrane filtration of long and flexible macromolecules: Application to predict dextran and linear DNA rejections in ultrafiltration. J. Memb. Sci. 2009, 336, 61–70. [Google Scholar] [CrossRef]
- De Barros, S.T.D.; Andrade, C.M.G.; Mendes, E.S.; Peres, L. Study of fouling mechanism in pineapple juice clarification by ultrafiltration. J. Memb. Sci. 2003, 215, 213–224. [Google Scholar] [CrossRef]
- Cassano, A.; Marchio, M.; Drioli, E. Clarification of blood orange juice by ultrafiltration: Analyses of operating parameters, membrane fouling and juice quality. Desalination 2007, 212, 15–27. [Google Scholar] [CrossRef]
- Corbatón-Báguena, M.J.; Álvarez-Blanco, S.; Vincent-Vela, M.C. Ultrafiltration of whey: Membrane performance and modelling using a combined pore blocking–cake formation model. J. Chem. Technol. Biotechnol. 2018. [Google Scholar] [CrossRef]
- Wang, L.; Song, L. Flux decline in crossflow microfiltration and ultrafiltration: Experimental verification of fouling dynamics. J. Memb. Sci. 1999. [Google Scholar] [CrossRef]
- Corbatón-Báguena, M.J.; Vincent-Vela, M.C.; Álvarez-Blanco, S.; Lora-García, J. Analysis of Two Ultrafiltration Fouling Models and Estimation of Model Parameters as a Function of Operational Conditions. Transp. Porous Media 2013, 99, 391–411. [Google Scholar] [CrossRef]
- Darnon, E.; Belleville, M.P.; Rios, G.M. Modeling ultrafiltration of complex biological solutions. AIChE J. 2002, 48, 1727–1736. [Google Scholar] [CrossRef]
- Bolton, G.; LaCasse, D.; Kuriyel, R. Combined models of membrane fouling: Development and application to microfiltration and ultrafiltration of biological fluids. J. Memb. Sci. 2006, 277, 75–84. [Google Scholar] [CrossRef]
- Duclos-Orsello, C.; Li, W.; Ho, C.C. A three mechanism model to describe fouling of microfiltration membranes. J. Memb. Sci. 2006, 280, 856–866. [Google Scholar] [CrossRef]
- Lin, S.H.; Hung, C.L.; Juang, R.S. Applicability of the exponential time dependence of flux decline during dead-end ultrafiltration of binary protein solutions. Chem. Eng. J. 2008, 145, 211–217. [Google Scholar] [CrossRef]
- Mondal, S.; De, S. Generalized criteria for identification of fouling mechanism under steady state membrane filtration. J. Memb. Sci. 2009, 344, 6–13. [Google Scholar] [CrossRef]
- Mondal, S.; De, S. A fouling model for steady state crossflow membrane filtration considering sequential intermediate pore blocking and cake formation. Sep. Purif. Technol. 2010, 75, 222–228. [Google Scholar] [CrossRef]
- Wang, X.; Huang, D.; Wang, L.; Meng, X.; Lv, Y.; Xia, S. Modeling of the fouling of inside-out hollow fiber UF Membranes. Water Sci. Technol. Water Supply 2017, 17, 300–310. [Google Scholar] [CrossRef]
- Ko l tuniewicz, A. Predicting permeate flux in ultrafiltration on the basis of surface renewal concept. J. Memb. Sci. 1992, 68, 107–118. [Google Scholar] [CrossRef]
- Saltık, M.B.; Özkan, L.; Jacobs, M.; van der Padt, A. Dynamic modeling of ultrafiltration membranes for whey separation processes. Comput. Chem. Eng. 2017, 99, 280–295. [Google Scholar] [CrossRef]
- Basheer, I.A.; Hajmeer, M. Artificial neural networks: Fundamentals, computing, design, and application. J. Microbiol. Methods 2000. [Google Scholar] [CrossRef]
- Paliwal, M.; Kumar, U.A. Neural networks and statistical techniques: A review of applications. Expert Syst. Appl. 2009, 36, 2–17. [Google Scholar] [CrossRef]
- Misra, J.; Saha, I. Artificial neural networks in hardware: A survey of two decades of progress. Neurocomputing 2010, 74, 239–255. [Google Scholar] [CrossRef]
- Nourbakhsh, H.; Emam-Djomeh, Z.; Omid, M.; Mirsaeedghazi, H.; Moini, S. Prediction of red plum juice permeate flux during membrane processing with ANN optimized using RSM. Comput. Electron. Agric. 2014, 102, 1–9. [Google Scholar] [CrossRef]
- Dasgupta, J.; Sikder, J.; Mandal, D. Modeling and optimization of polymer enhanced ultrafiltration using hybrid neural-genetic algorithm based evolutionary approach. Appl. Soft Comput. J. 2017, 55, 108–126. [Google Scholar] [CrossRef]
- Ruby Figueroa, R.A.; Cassano, A.; Drioli, E. Ultrafiltration of orange press liquor: Optimization for permeate flux and fouling index by response surface methodology. Sep. Purif. Technol. 2011, 80, 1–10. [Google Scholar] [CrossRef]
- Ruby-Figueroa, R.; Nardi, M.; Sindona, G.; Conidi, C.; Cassano, A. A Multivariate Statistical Analyses of Membrane Performance in the Clarification of Citrus Press Liquor. ChemEngineering 2019, 3, 10. [Google Scholar] [CrossRef]
- Klimkiewicz, A.; Cervera-Padrell, A.E.; Van Den Berg, F. Modeling of the Flux Decline in a Continuous Ultrafiltration System with Multiblock Partial Least Squares. Ind. Eng. Chem. Res. 2016, 55, 10690–10698. [Google Scholar] [CrossRef]
- Zhang, W.; Ding, L.; Zhang, Z.; Wei, J.; Jaffrin, M.Y.; Huang, G. Threshold flux and limiting flux for micellar enhanced ultrafiltration as affected by feed water: Experimental and modeling studies. J. Clean. Prod. 2016, 112, 1241–1251. [Google Scholar] [CrossRef]
- Hasan, A.; Peluso, C.R.; Hull, T.S.; Fieschko, J.; Chatterjee, S.G. A surface-renewal model of cross-flow microfiltration. Braz. J. Chem. Eng. 2013, 30, 167–186. [Google Scholar] [CrossRef]
- Yee, K.W.K.; Wiley, D.E.; Bao, J. A unified model of the time dependence of flux decline for the long-term ultrafiltration of whey. J. Memb. Sci. 2009, 332, 69–80. [Google Scholar] [CrossRef]
- Clever, M.; Jordt, F.; Knauf, R.; Räbiger, N.R.; Rtidebusch, M.; Hilker-Scheibel, R. Process water production from river water by ultrafiltration and reverse osmosis. Desalination 2000, 131, 325–336. [Google Scholar] [CrossRef]
- Qin, G.; Lü, X.; Wei, W.; Li, J.; Cui, R.; Hu, S. Microfiltration of kiwifruit juice and fouling mechanism using fly-ash-based ceramic membranes. Food Bioprod. Process. 2015, 96, 278–284. [Google Scholar] [CrossRef]
- Riyahi, R.; Rafiee, S.; Dalvand, M.J.; Keyhani, A. Some physical characteristics of pomegranate, seeds and arils. J. Agric. Technol. 2011, 7, 1523–1537. [Google Scholar]
- Tapia Duran, M.P. Estudio de Factores Fisiólogicos del Kiwi (Actinidia Deliciosa) Variedad Hayward, y sus Efectos en la Textura Durante el Almacenamiento. Bachelor’s Thesis, Universidad de Chile, Santiago, Chile, 2012. [Google Scholar]
- Magerramov, M.A.; Abdulagatov, A.I.; Azizov, N.D.; Abdulagatov, I.M. Effect of temperature, concentration, and pressure on the viscosity of pomegranate and pear juice concentrates. J. Food Eng. 2007, 80, 476–489. [Google Scholar] [CrossRef]
- Baker, R.W. Membrane Technology and Applications; Wiley: Hoboken, NJ, USA, 2004; ISBN 0 07 135440 9. [Google Scholar]
- Mexis, S.F.; Kontominas, M.G. Effect of oxygen absorber, nitrogen flushing, packaging material oxygen transmission rate and storage conditions on quality retention of raw whole unpeeled almond kernels (Prunus dulcis). LWT-Food Sci. Technol. 2010, 43, 1–11. [Google Scholar] [CrossRef]
- Gill, W.N.; Wiley, D.E.; Fell, C.J.D.; Fane, A.G. Effect of viscosity on concentration polarization in ultrafiltration. AIChE J. 1988, 34, 1563–1567. [Google Scholar] [CrossRef]
- Denisov, G.A. Theory of concentration polarization in cross-flow ultrafiltration: Gel-layer model and osmotic-pressure model. J. Memb. Sci. 1994, 91, 173–187. [Google Scholar] [CrossRef]
- Bhattacharjee, S.; Kim, A.S.; Elimelech, M. Concentration polarization of interacting solute particles in cross-flow membrane filtration. J. Colloid Interface Sci. 1999, 212, 81–99. [Google Scholar] [CrossRef]
- Gekas, V.; Olund, K. Mass transfer in the membrane concentration polarization layer under turbulent cross flow. I Sherwood Correlations. J. Memb. Sci. 1988, 37, 145–163. [Google Scholar] [CrossRef]
- van den Berg, G.B.; Rácz, I.G.; Smolders, C.A. Mass transfer coefficients in cross-flow ultrafiltration. J. Memb. Sci. 1989, 47, 25–51. [Google Scholar] [CrossRef]
- Mondal, S.; Cassano, A.; Tasselli, F.; De, S. A generalized model for clarification of fruit juice during ultrafiltration under total recycle and batch mode. J. Memb. Sci. 2011, 366, 295–303. [Google Scholar] [CrossRef]
- Muthukumaran, S.; Kentish, S.E.; Ashokkumar, M.; Stevens, G.W. Mechanisms for the ultrasonic enhancement of dairy whey ultrafiltration. J. Membr. Sci. 2005, 258, 106–114. [Google Scholar] [CrossRef]
- Peng, H.; Tremblay, A.Y. Membrane regeneration and filtration modeling in treating oily wastewaters. J. Memb. Sci. 2008. [Google Scholar] [CrossRef]
- Nguyen, T.A.; Yoshikawa, S.; Karasu, K.; Ookawara, S. A simple combination model for filtrate flux in cross-flow ultrafiltration of protein suspension. J. Memb. Sci. 2012. [Google Scholar] [CrossRef]
- Ho, S.L.; Xie, M. The use of ARIMA models for reliability forecasting and analysis. Comput. Ind. Eng. 1998, 35, 213–216. [Google Scholar] [CrossRef]
- Rinaldoni, A.N.; Tarazaga, C.C.; Campderrós, M.E.; Padilla, A.P. Assessing performance of skim milk ultrafiltration by using technical parameters. J. Food Eng. 2009. [Google Scholar] [CrossRef]
- Mora, F.; Pérez, K.; Quezada, C.; Herrera, C.; Cassano, A.; Ruby-Figueroa, R. Impact of membrane pore size on the clarification performance of grape marc extract by microfiltration. Membranes 2019, 9, 146. [Google Scholar] [CrossRef] [PubMed]


| No. | Model | Authors | Ref. | Validation Matrix | Main Transport Mechanism | Configuration | Module Type | Number of Citations | Model Validation in Publications |
|---|---|---|---|---|---|---|---|---|---|
| (1.1) | Film theory | [46] | - | Diffusive | Cross-flow | - | - | [14,89] | |
| (1.2) | Trettin and Doshi (1980) | [62] | BSA | Diffusive | Dead-end | Unstirred cell | 76 | - | |
| (1.3) | Modified gel-polarization Fane et al. (1981) | [87] | Gamma Globulin BSA | Diffusive-Convective | - | - | 164 | - | |
| (1.4) | Zydney and Colton (1986) | [63] | Blood | Diffusive | Cross-flow | - | 274 | - | |
| (1.5) | Shear-induced diffusion Davis (1992) | [57] | PEG | Diffusive-Convective | Cross-flow | Tubular | 158 | [70] | |
| (1.6) | Song and Elimelech (1995) | [90] | - | Diffusive-Convective | Cross-flow | Rectangular channel | 246 | [91] | |
| (1.7) | Jonsson and Jonsson (1996) | [92] | Silica sol | Diffusive-Convective | Cross-flow | - | 71 | - | |
| (1.8) | Saksena and Zydney (1997) | [93] | BSA and IgG | Diffusive-Convective | Dead-end | Stirred cell | 51 | - | |
| (1.9) | Bhattacharjee and Datta (1991) | [94] | PEG-6000 | Diffusive-Convective | Dead-end | Unstirred cell | 9 | - | |
| (1.10) | The relaxation model Konieczny (2002) | [95] | Water potable | Diffusive-Convective | Cross-flow | Tubular | 22 | [96] | |
| (1.11) | Model parameter: | Neggaz et al. (2007) | [97] | Pectin Albumin | Diffusive-Convective | Cross-flow | Hollow fiber | 6 | - |
| (1.12) | ; Brownian diffusion ; Shear induced diffusion ; Combined diffusion | Singh et al. (2013) | [64] | Synthetic Fruit juice | Diffusive-Convective | Cross-flow | Spiral-wound | 10 | - |
| No. | Model | Authors | Ref. | Validation Matrix | Main Transport Mechanism | Configuration | Module Type | Number of Citations | Model Validation in Publications |
|---|---|---|---|---|---|---|---|---|---|
| (2.1) | Osmotic pressure Keden and Katchalsky (1958) | [112] | Water | Convective | Dead-end | - | 442 | [113,114,115,116,117] | |
| (2.2) | Goldsmith (1971) | [118] | Dextran fractions (polysaccharides) | - | Cross-flow Dead-end | Tubular Stirred cell | 138 | - | |
| (2.3) | Model parameters: a, n | Wijmans et al. (1984) | [111] | - | - | - | - | 201 | [80,119] |
| (2.4) | Bhattacharjee and Bhattacharya (1992) | [58] | BSA | Convective | Dead-end | Unstirred cell | 36 | [17] | |
| (2.5) | Model parameter: α | Bhattacharjee and Bhattacharya (1992) | [25] | PEG | Convective | Dead-end | Unstirred cell | 50 | - |
| (2.6) | Model parameters: , K1 | Bhattacharya et al. (2001) | [21] | Sugar cane | Convective | Dead-end | Stirred cell | 42 | [120] |
| (2.7) | Model parameters: tR, mi | Kanani and Ghosh (2007) | [121] | HSA | Convective | Dead-end | Stirred cell | 28 | - |
| (2.8) | Model parameters: α, n, X12 | Sarkar et al. (2010) | [122] | PEG-6000 | Diffusive-Convective | Dead-end | Stirred cell | 2 | - |
| (2.9) | Binabaji et al. (2015) | [123] | Protein solution | Diffusive | Cross-flow | Tangential flow filtration (TFF) Cassette | 6 | - |
| No. | Model | Authors | Ref. | Validation Matrix | Main Transport Mechanism | Configuration | Module Type | Number of Citations | Model Validation in Publications |
|---|---|---|---|---|---|---|---|---|---|
| (3.1) | Resistance Darcy’s law | - | - | Convective | Dead-end Cross-flow | Tubular | - | [12,23,128,129,130,131] | |
| (3.2) | Hagen-Poiseuille | - | Solvent | Convective | Dead-end Cross-flow | Tubular | - | [71,132,133,134] | |
| (3.3) | Model parameters: Jss, α | Agitation resistance Chudacek and Fane (1984) | [135] | Silica sol Albumin Dextran | Convective | Dead-end Cross-flow | Unstirred cell | 167 | - |
| (3.5) | Adsorption resistance Gekas et al. (1993) | [136] | BSA | Convective | Cross-flow | Plate type | 44 | - | |
| (3.6) | De and Bhattacharya (1997) | [137] | Mixture of sucrose and poly(vinyl alcohol) | Diffusive-Convective | Cross-flow | Stirred cell | 66 | [61,131,138,139,140,141] | |
| (3.7) | Paris et al. (2002) | [142] | Dextran T500 | Diffusive-Convective | Cross-flow | Tubular | 45 | [143] | |
| (3.8) | Model parameters: Pm, kb, ω | Bhattacharjee and Datta (2003) | [144] | PEG-6000 | Diffusive-Convective | Dead-end | Stirred cell | 31 | - |
| (3.9) | Chang et al. (2005) | [145] | Polystyrene latex | Convective | Dead-end | Hollow fiber | 54 | - | |
| (3.10) | Model parameters: A, β, | Mohammadi et al. (2005) | [146] | Emulsion of oil and gelatin | Diffusive-Convective | Cross-flow | Plate and frame | 26 | - |
| (3.11) | Yeh and Chen (2005) | [147] | Dextran T500 | Convective | Cross-flow | Tubular | 6 | - | |
| (3.12) | Yeh (2008) | [148] | Dextran T500 | Convective | Cross-flow | Hollow fiber | 8 | - | |
| (3.13) | Model parameters: PTM, α, | Cuellar et al. (2009) | [149] | E. coli cells | Convective | Cross-flow | Hollow fiber | 7 | - |
| (3.14) | Model parameters: , A, B, C, n | Yeh et al. (2010) | [150] | Dextran T500 | Convective | Cross-flow | Tubular | 1 | - |
| (3.15) | Marchetti et al. (2012) | [133] | Water Ethanol Acetone DMF | Convective | Cross-flow | Tubular | 37 | - | |
| (3.16) | Model parameters: σ, b | Corbatón-Báguena et al. (2018) | [151] | Whey model solution | Diffusive-Convective | Cross-flow | Tubular Flat sheet | 6 | - |
| No. | Model | Authors | Ref. | Validation Matrix | Main Transport Mechanism | Configuration | Module Type | Number of Citations | Model Validation in Publications |
|---|---|---|---|---|---|---|---|---|---|
| (4.1) | Hermia (1982) | [60] | - | Convective | Dead-end | - | - | [13,14,164,165] | |
| (4.2) | Nakao and Kinura (1981) | [114] | PEG | Convective | Dead-end | Tubular | 32 | [166] | |
| (4.3) | ; Complete blocking ; Intermediate blocking ; Standard blocking ; Gel layer formation | Cros-flow HermianField et al. (1995) | [65] | Dodecane-water emulsion | Convective | Cross-flow | Flat-sheet | 945 | [9,167,168,169] |
| (4.4) | Bacchin et al. (1996) | [24] | Clay suspensions | Diffusive | Cross-flow | Hollow fiber | 88 | [6] | |
| (4.5) | When t < tss When t > tss | Dynamic model Song (1998) | [108] | - | Diffusive-Convective | Cross-flow | - | 253 | [45,55] |
| Wang and Song (1999) | [170] | Silica colloids | Diffusive-Convective | Cross-flow | Tubular | 62 | - | ||
| (4.6) | Ho and Zydney (2000) | [66] | BSA | Convective | Cross-flow | Stirred cell | 434 | [10,171,172,173] | |
| (4.7) | Model parameters: , SD, SF | Darnon et al. (2002) | [172] | Β-Lactoglobulin and yeast extract | Diffusive-Convective | Cross-flow | Tubular | 12 | - |
| (4.8) | Cake-complete Cake-intermediate Complete-standard Intermediate-standard Cake-standard Model parameters: Kb, kc, ki, ks, α, β | Bolton et al. (2004) | [173] | IgG BSA | Convective | Cross-flow | Tubular | 201 | - |
| (4.9) | Model parameters: α, β, tp, f′, R′ | Duclos-Orsello et al. (2006) | [174] | BSA | Convective | Dead-end | Stirred cell | 152 | - |
| (4.10) | Furukawa et al. (2008) | [67] | Soy less | Diffusive-Convective | Dead-end Cross-flow | Tubular | 27 | - | |
| (4.11) | Model parameter: b | Lin et al. (2008) | [175] | BSA Hemoglobin | Diffusive-Convective | Dead-end | Stirred glass cell | 21 | - |
| (4.12) | Model parameter: | Mondal and De (2009) | [176] | Pineapple juice | Convective | Cross-flow | Hollow fiber | 29 | [177] |
| (4.13) | Model parameter: σ | Wang et al. (2017) | [178] | Aqueous solutions | Diffusive-Convective | Cross-flow | Hollow fiber | 1 | - |
| No. | Model | Authors | Ref. | Validation Matrix | Main Transport Mechanism | Configuration | Module Type | Number of Citations | Model Validation in Publications | |
|---|---|---|---|---|---|---|---|---|---|---|
| (5.1) | Model parameter: J0 | Surface renovation theory Koltuniewicz (1992) | [179] | BSA | Diffusive-Convective | Cross-flow | - | 44 | - | |
| (5.2) | Threshold model Ochando-Pulido et al. (2015) | [6] | - | Diffusive-Convective | Cross-flow | - | 192 | [59,189] | ||
| (5.3) | Model parameters: S*, tp | Surface renovation theory Hasan et al. (2013) | [190] | Fermentation broths | Diffusive-Convective | Cross-flow | Unstirred cell | 16 | [120] | |
| (5.4) | Yee et al. (2009) | [191] | PEG | Diffusive-Convective | Cross-flow | Tubular | 30 | [171] | ||
| (5.5) | Model parameter: A1, A2 | Empirical model Mallubhotla and Belfort (1996) | [59] | Yeast | - | Dead-end | Unstirred cell | 29 | [68] | |
| (5.6) | Modified Mallubhotla and Belfort | Modification empirical model Soler-Cabezas et al. (2015) | [68] | Waster water | - | Cross-flow | Hollow fiber | 11 | - | |
| Inverse Tangential | ||||||||||
| Exponential quadratic | ||||||||||
| Inverse logarithmic | ||||||||||
| Exponential double | ||||||||||
| Model parameters: B, C, D, E, F | ||||||||||
| (5.7) | Computational model of system dynamics (SD) | Zhu et al. (2016) | [8] | Raw water | - | Cross-flow | Stirred cell | 0 | - | |
| (5.8) | Adaptive neuro-diffusive inference system model (ANFIS) | Salahi et al. (2015) | [7] | Wastewater | - | Cross-flow | Hollow fiber | - | - | |
| (5.9) | PCA model of simultaneous multilevel analysis of components with invariant patterns (MSCA-P) | Modeling for Data Mining Klimkiewicz et al. (2016) | [15] | Enzymes | - | - | - | 1 | - | |
| (5.10) | Neural network (ANN’s) per layer | Corbatón-Báguena et al. (2016) | [72] | PEG | - | Cross-flow | Tubular | 6 | - | |
| (5.11) | Neural network (ANN’s) per layer | Díaz et al. (2017) | [12] | Water | - | Cross-flow | Tubular | 0 | - | |
| (5.12) | AR | ARIMA Ruby-Figueroa et al. (2017) | [69] | Fruit juices | - | Cross-flow | Tubular Hollow fiber | 6 | - | |
| I | ||||||||||
| MA | ||||||||||
| Bergamot | Kiwi Fruit | Pomegranate | Reference | |
|---|---|---|---|---|
| DCQ II-006C | Koch Series-Cor TM HFM 251 | FUC 1582 | ||
| Membrane characteristics and operation | ||||
| Membrane material | Polysulfone (PS) | Polyvinylidene fluoride (PVDF) | Triacetate cellulose (CTA) | - |
| Configuration | Hollow Fiber | Tubular | Hollow Fiber | - |
| Area (m2) | 0.16 | 0.23 | 0.26 | - |
| MWCO (kDa) | 100 | 100 | 150 | - |
| ΔP (bar) | 1 | 0.85 | 0.6 | - |
| Temperature (°C) | 20 | 25 | 25 | - |
| Flow (Lh−1) | 114 | 800 | 400 | - |
| Porosity (dimensionless) | 0.0057 | 1.1 | 0.0007 | |
| Tortuosity (dimensionless) | 3 | 3 | 0.03 | - |
| Membrane thickness (m) | 4.7 × 10⁻⁷ | 2.0 × 10⁻⁶ | 0.00023 | [34] |
| Pore density, N (number of pores m−1) | 6.0 × 10¹² | 4.0 × 10¹⁶ | 1.0 × 10¹³ | [46] |
| Module length, L (mm) | 330 | 406 | 136 | [61] |
| Module diameter (m) | 0.0021 | 0.025 | 0.0008 | [30,46,192] |
| Hydraulic resistance (m−1) | 3.6 × 10¹² | 1.6 × 10¹² | 2.1 × 10¹² | - |
| Hydraulic permeability (mPa−1s−1) | 2.7 × 10⁻¹⁰ | 5.9 × 10⁻¹⁰ | 4.6 × 10⁻¹⁰ | - |
| Fruit juices characteristics | ||||
| Total soluble solids (°Brix) | 9.4 | 12.6 | 18.7 | [30,38,43,193] |
| Titratable Acidity | 53.86 (gL−1) | - | 1.04 (% citric acid) | [30,38,43,193] |
| pH | 2.40 | 3.19 | 3.61 | [30,38,43,193] |
| Total phenolic compounds | 660 (mg/L) | 421.6 (mg/L) | 1930 (mg GAE/100 L) | [30,38,43,193] |
| Turbidity (%) | 33.67 | - | [30,38,43,193] | |
| Feed density, ρ (kgm−3) | 1091 | 1070 | 1131 | [194,195] |
| Feed viscosity, μ (Pa s) | 0.0019 | 0.0014 | 0.0017 | [31,196] |
| Concentration in food (%) | 12 | 10.08 | 4.9 | [27,33,36] |
| Models | RMSE | MAPE | R2 | S-W | K-W | |
|---|---|---|---|---|---|---|
| Concentration polarization model | Davis (1992)/Shear-Induced Diffusion | 0.80 | 11.76 | 91.08 | 0.00 | 0.10365 |
| Osmotic pressure models | Keden & Katchalsky (1958) | 0.25 | 5.70 | 99.17 | 0.0117 | 0.05 |
| Wijmanset al. (1984) | 0.49 | 11.70 | 99.22 | 0.6855 | 0.0004 | |
| Resistance in series models | Hagen-Poiseuille (1839) | 0.22 | 3.99 | 99.78 | 0.00034 | 0.8364 |
| De et al. (1997) | 0.36 | 4.81 | 97.47 | 0.00 | 0.8692 | |
| Fouling and adsorption models | Ho and Zydney (2000) | 1.64 | 31.52 | 90.25 | 1.554 × 10⁻¹⁵ | 0.00 |
| Song (1998)/Dynamic model | 1.51 | 35.90 | 97.56 | 0.00 | 0.00 | |
| Mondal et al (2009) | 1.76 | 18.23 | 87.01 | 0.0 | 0.00002 | |
| Non-Phenomenological models | Yee et al. (2009) | 2.03 | 28.91 | 84.91 | 0.000088 | 0.1038 |
| Ruby-Figueroa et al. (2017)/ARIMA models | 0.40 | 8.24 | 97.92 | 2.99 × 10⁻¹⁵ | 0.056 | |
| Models | RMSE | MAPE | R2 | S-W | K-W | |
|---|---|---|---|---|---|---|
| Concentration polarization models | Davis (1992)/Shear-Induced Diffusion | 2.91 | 22.35 | 52.86 | 0.00 | 1.213 × 10⁻¹⁰ |
| Osmotic pressure models | Keden and Katchalsky (1958) | 9.51 | 115.03 | 97.76 | 0.002 | 0.00 |
| Wijmanset al. (1984) | 0.33 | 3.14 | 97.98 | 0.075 | 0.45 | |
| Resistance in series models | Hagen-Poiseuille (1839) | 0.64 | 8.21 | 98.45 | 0.00 | 0.0032 |
| De et al. (1997) | 0.48 | 5.46 | 97.43 | 0.0012 | 0.2238 | |
| Fouling and adsorption models | Ho and Zydney (2000) | 1.07 | 8.92 | 95.95 | 4.152 × 10⁻¹² | 0.1015 |
| Song (1998)/Dynamic model | 3.94 | 43.51 | 67.94 | 0.00 | 0.00 | |
| Mondal et al (2009) | 0.96 | 11.17 | 93.18 | 0.0 | 0.058 | |
| Non-Phenomenological models | Yee et al. (2009) | 0.64 | 7.16 | 97.67 | 1.438 × 10⁻¹³ | 0.2047 |
| Ruby-Figueroa et al. (2017)/ARIMA models | 0.33 | 3.74 | 98.98 | 0.0250 | 0.3801 | |
| Models | RMSE | MAPE | R2 | S-W | K-W | |
|---|---|---|---|---|---|---|
| Concentration polarization models | Davis (1992)/Shear-Induced Diffusion | 1.64 | 27.56 | 85.58 | 2.22 × 10⁻⁹ | 0.8234 |
| Osmotic pressure models | Keden and Katchalsky (1958) | 4.89 | 67.03 | 98.92 | 0.0001 | 3.581 × 10⁻⁹ |
| Wijmanset al. (1984) | 0.49 | 7.85 | 98.91 | 0.00 | 0.964 | |
| Resistance in series models | Hagen-Poiseuille (1839) | 0.81 | 21.00 | 98.28 | 0.00 | 0.1974 |
| De et al. (1997) | 0.72 | 16.64 | 96.73 | 2.33× 10⁻¹³ | 0.37255 | |
| Fouling and adsorption models | Ho & Zydney (2000) | 2.01 | 51.69 | 75.91 | 2.93× 10⁻¹² | 0.088 |
| Song (1998)/Dynamic model | 3.41 | 50.78 | 80.64 | 1.154 × 10⁻¹⁴ | 0.00 | |
| Mondal et al (2009) | 1.60 | 17.45 | 92.40 | 0.0 | 0.3804 | |
| Non-Phenomenological models | Yee et al. (2009) | 0.46 | 11.09 | 99.20 | 2.991× 10⁻¹² | 0.2262 |
| Ruby-Figueroa et al. (2017)/ARIMA models | 0.25 | 4.08 | 99.70 | 0.00 | 0.6320 | |
Publisher’s Note: MDPI stays neutral with regard to jurisdictional claims in published maps and institutional affiliations. |
© 2021 by the authors. Licensee MDPI, Basel, Switzerland. This article is an open access article distributed under the terms and conditions of the Creative Commons Attribution (CC BY) license (https://creativecommons.org/licenses/by/4.0/).
Share and Cite
Quezada, C.; Estay, H.; Cassano, A.; Troncoso, E.; Ruby-Figueroa, R. Prediction of Permeate Flux in Ultrafiltration Processes: A Review of Modeling Approaches. Membranes 2021, 11, 368. https://doi.org/10.3390/membranes11050368
Quezada C, Estay H, Cassano A, Troncoso E, Ruby-Figueroa R. Prediction of Permeate Flux in Ultrafiltration Processes: A Review of Modeling Approaches. Membranes. 2021; 11(5):368. https://doi.org/10.3390/membranes11050368
Chicago/Turabian StyleQuezada, Carolina, Humberto Estay, Alfredo Cassano, Elizabeth Troncoso, and René Ruby-Figueroa. 2021. "Prediction of Permeate Flux in Ultrafiltration Processes: A Review of Modeling Approaches" Membranes 11, no. 5: 368. https://doi.org/10.3390/membranes11050368
APA StyleQuezada, C., Estay, H., Cassano, A., Troncoso, E., & Ruby-Figueroa, R. (2021). Prediction of Permeate Flux in Ultrafiltration Processes: A Review of Modeling Approaches. Membranes, 11(5), 368. https://doi.org/10.3390/membranes11050368