Alkali Attack on Cation-Exchange Membranes with Polyvinyl Chloride Backing and Binder: Comparison with Anion-Exchange Membranes

Abstract
1. Introduction
2. Materials and Methods
2.1. Sample Membrane
2.2. Estimation of Hydroxyl Ion Concentration in CMX and AMX
2.3. Alkaline Immersion Test
2.3.1. Low OH Concentration Test
2.3.2. High OH Concentration Test
2.4. Chemical Analysis
2.5. Characterization of Membrane Properties
3. Results and Discussion
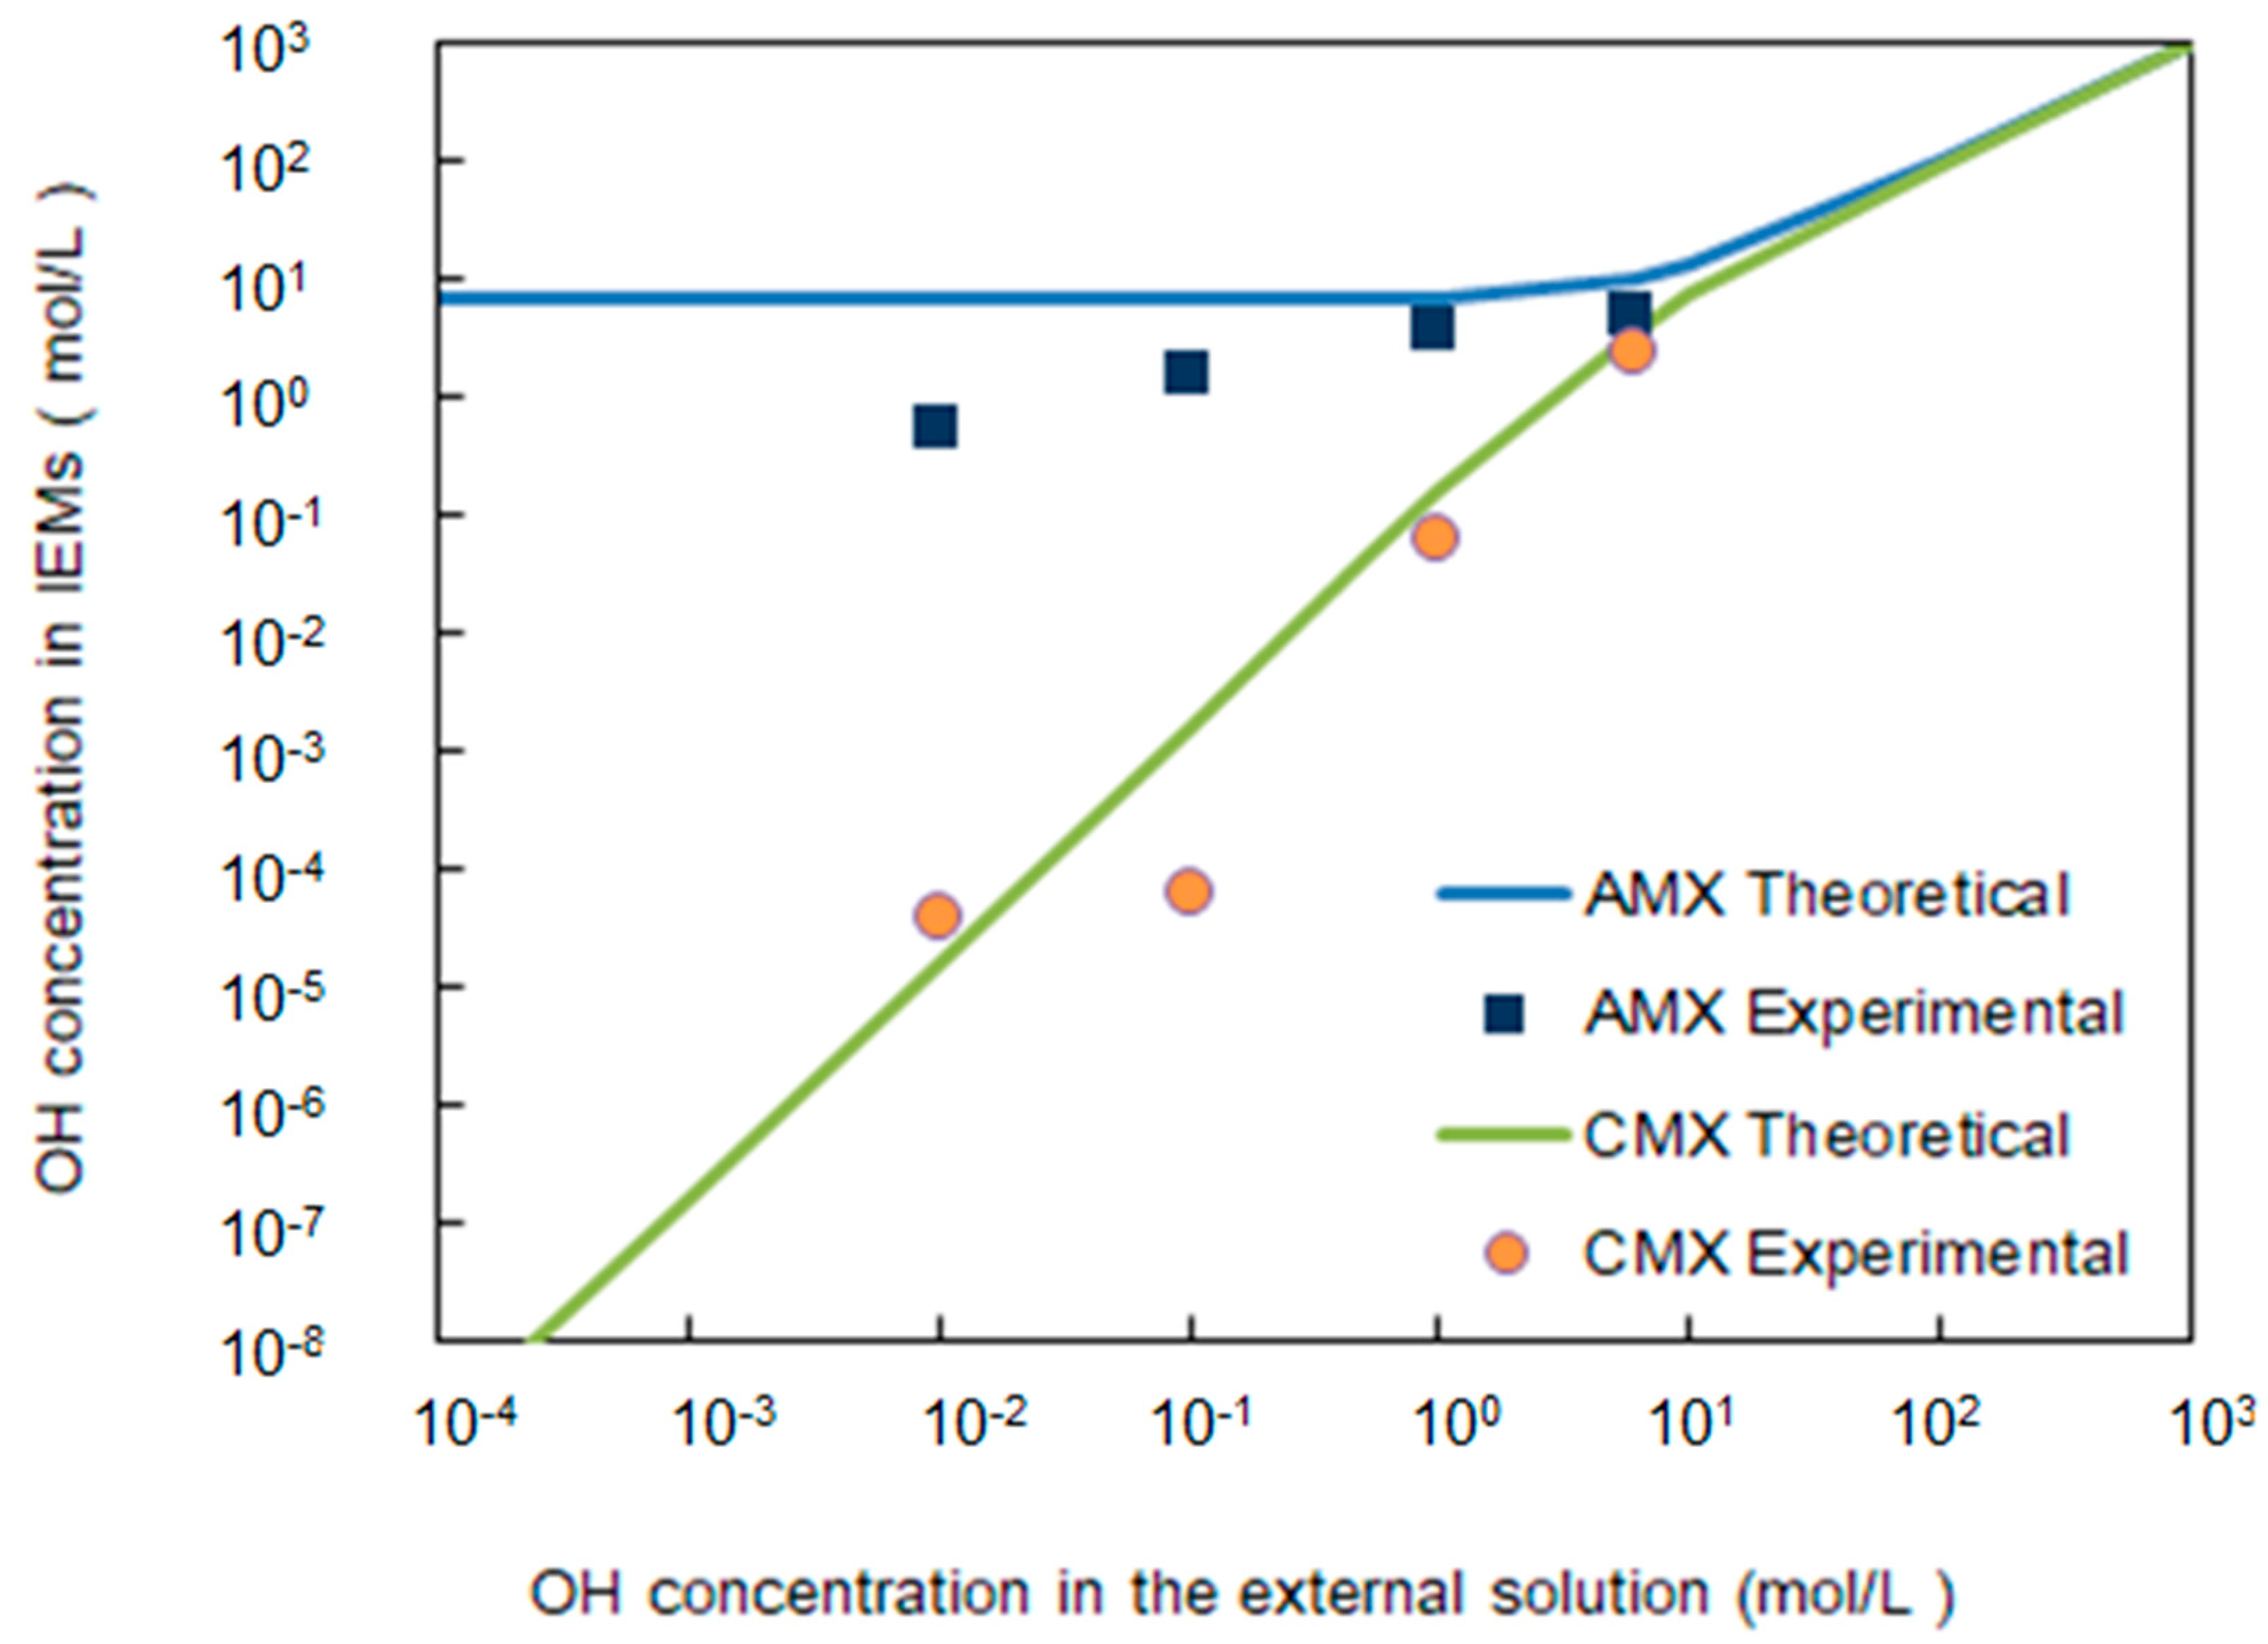
3.1. Measurement of Alkali Concentration in CMX and AMX
3.2. Systematic Alkaline Immersion Test (Low OH Concentration Test)
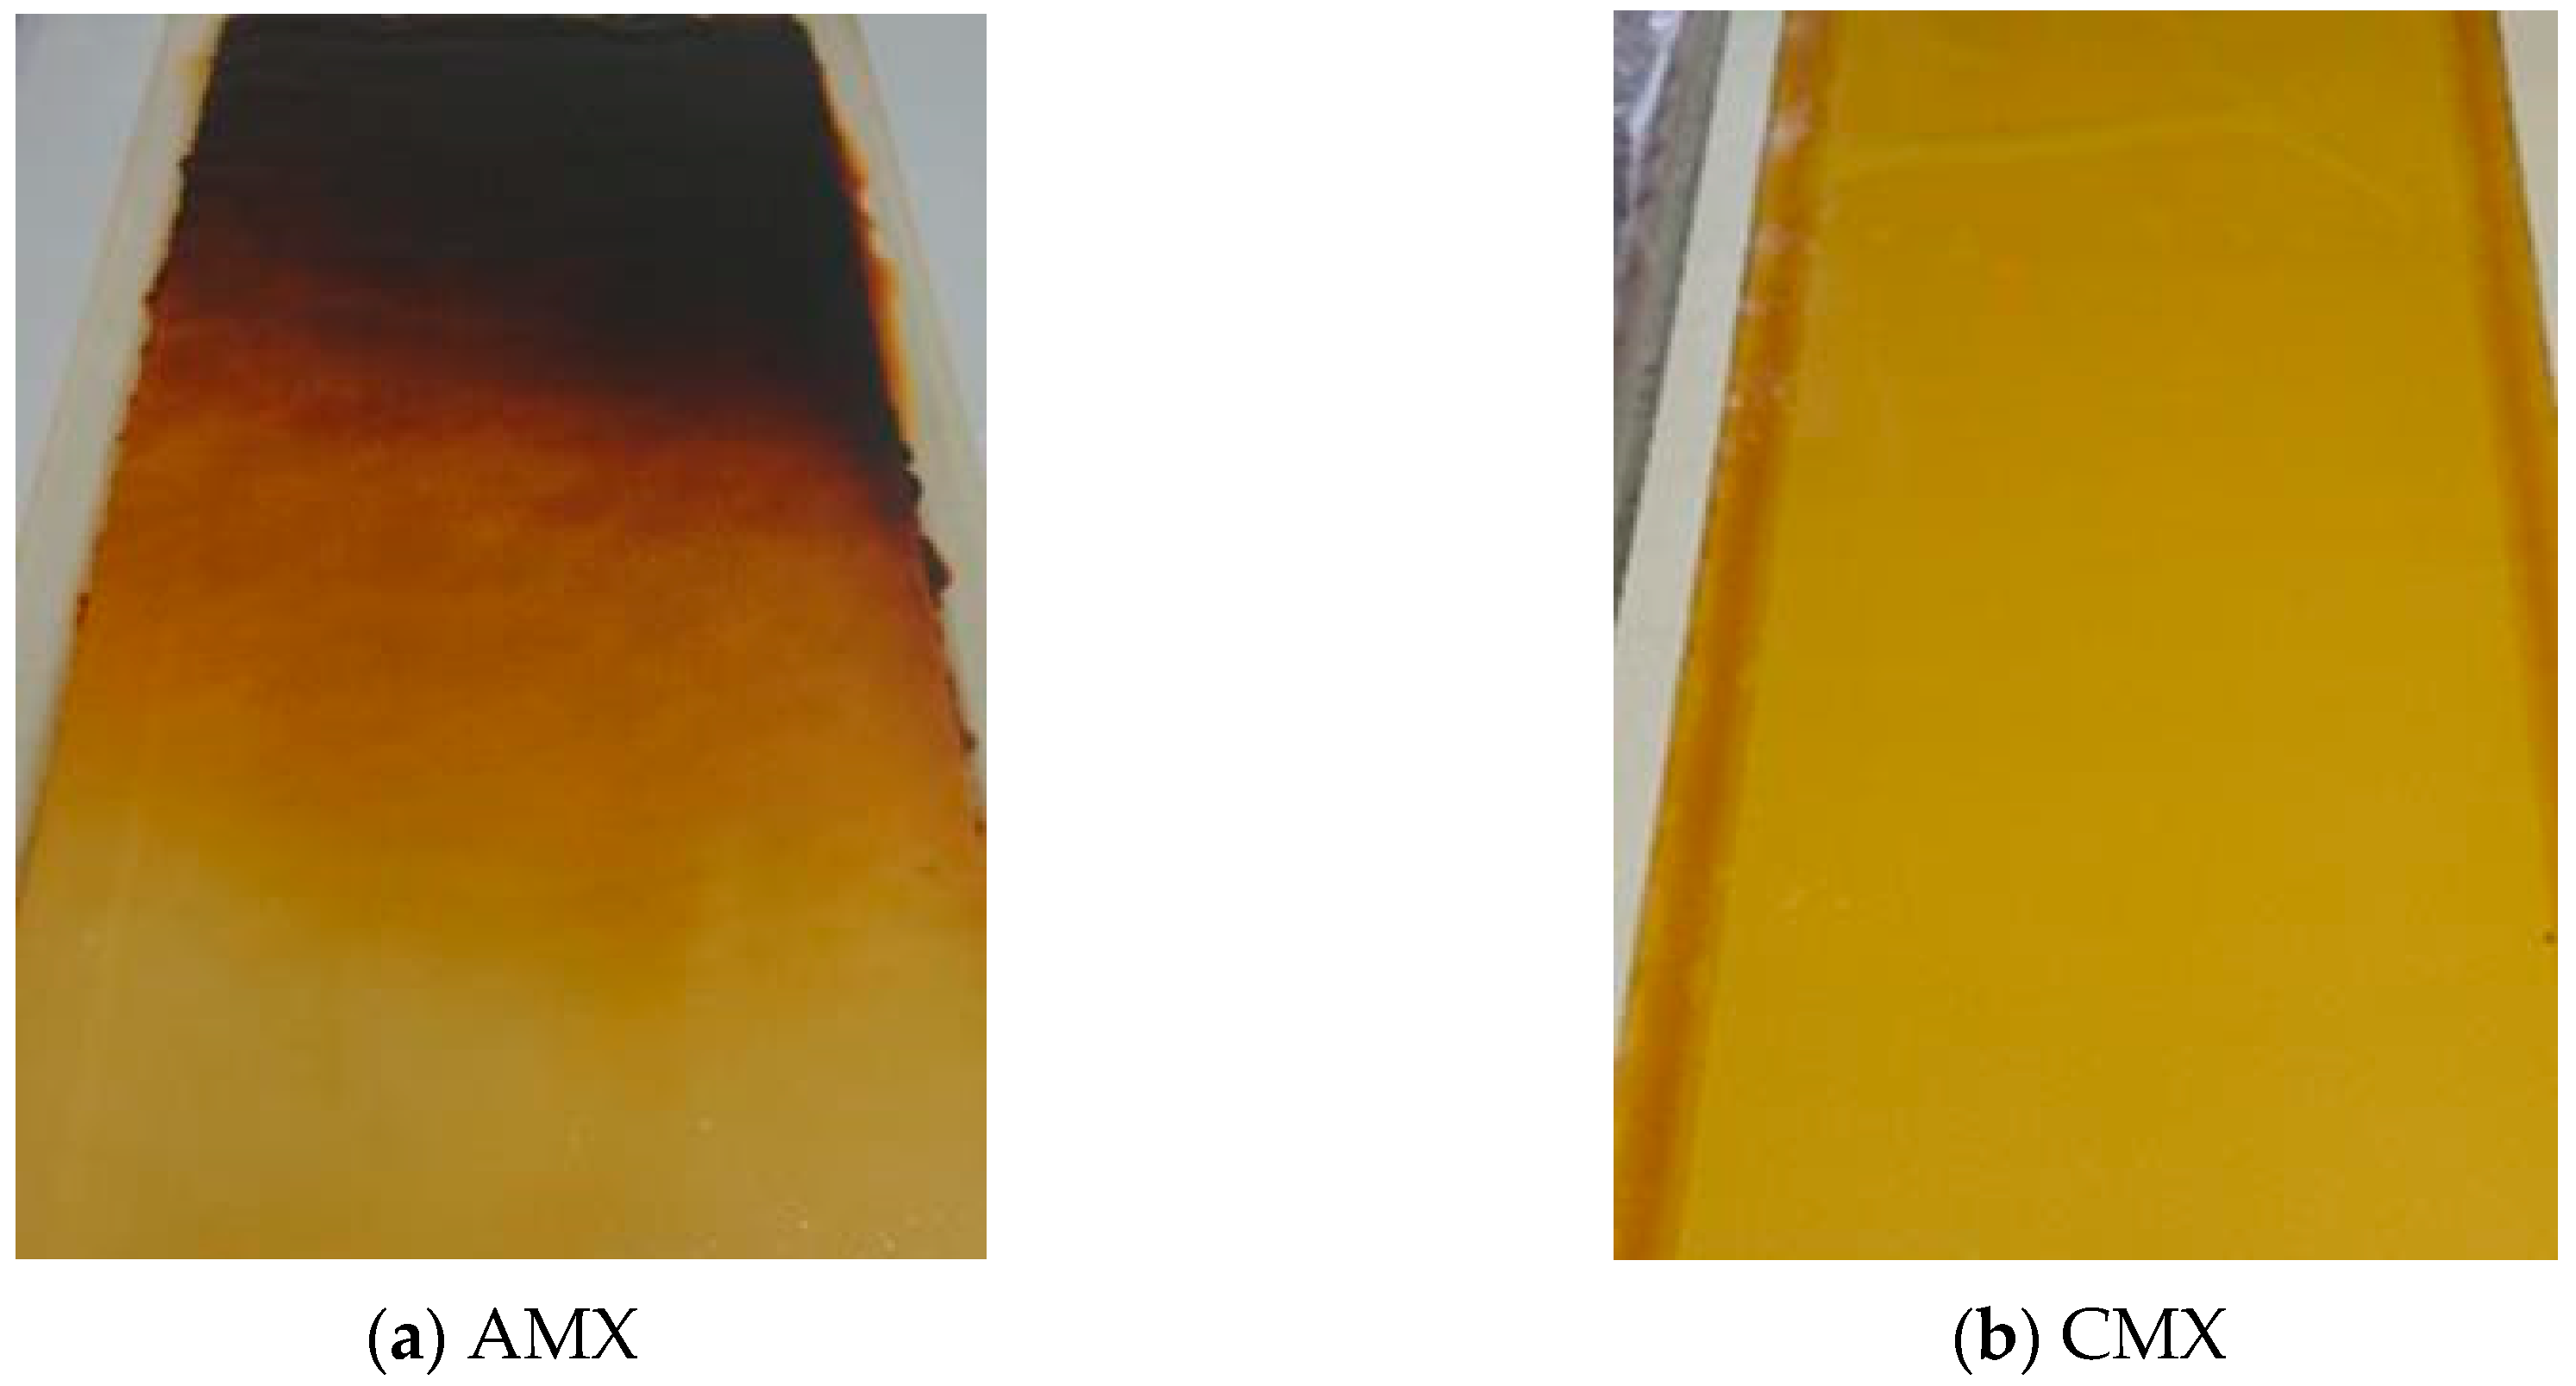
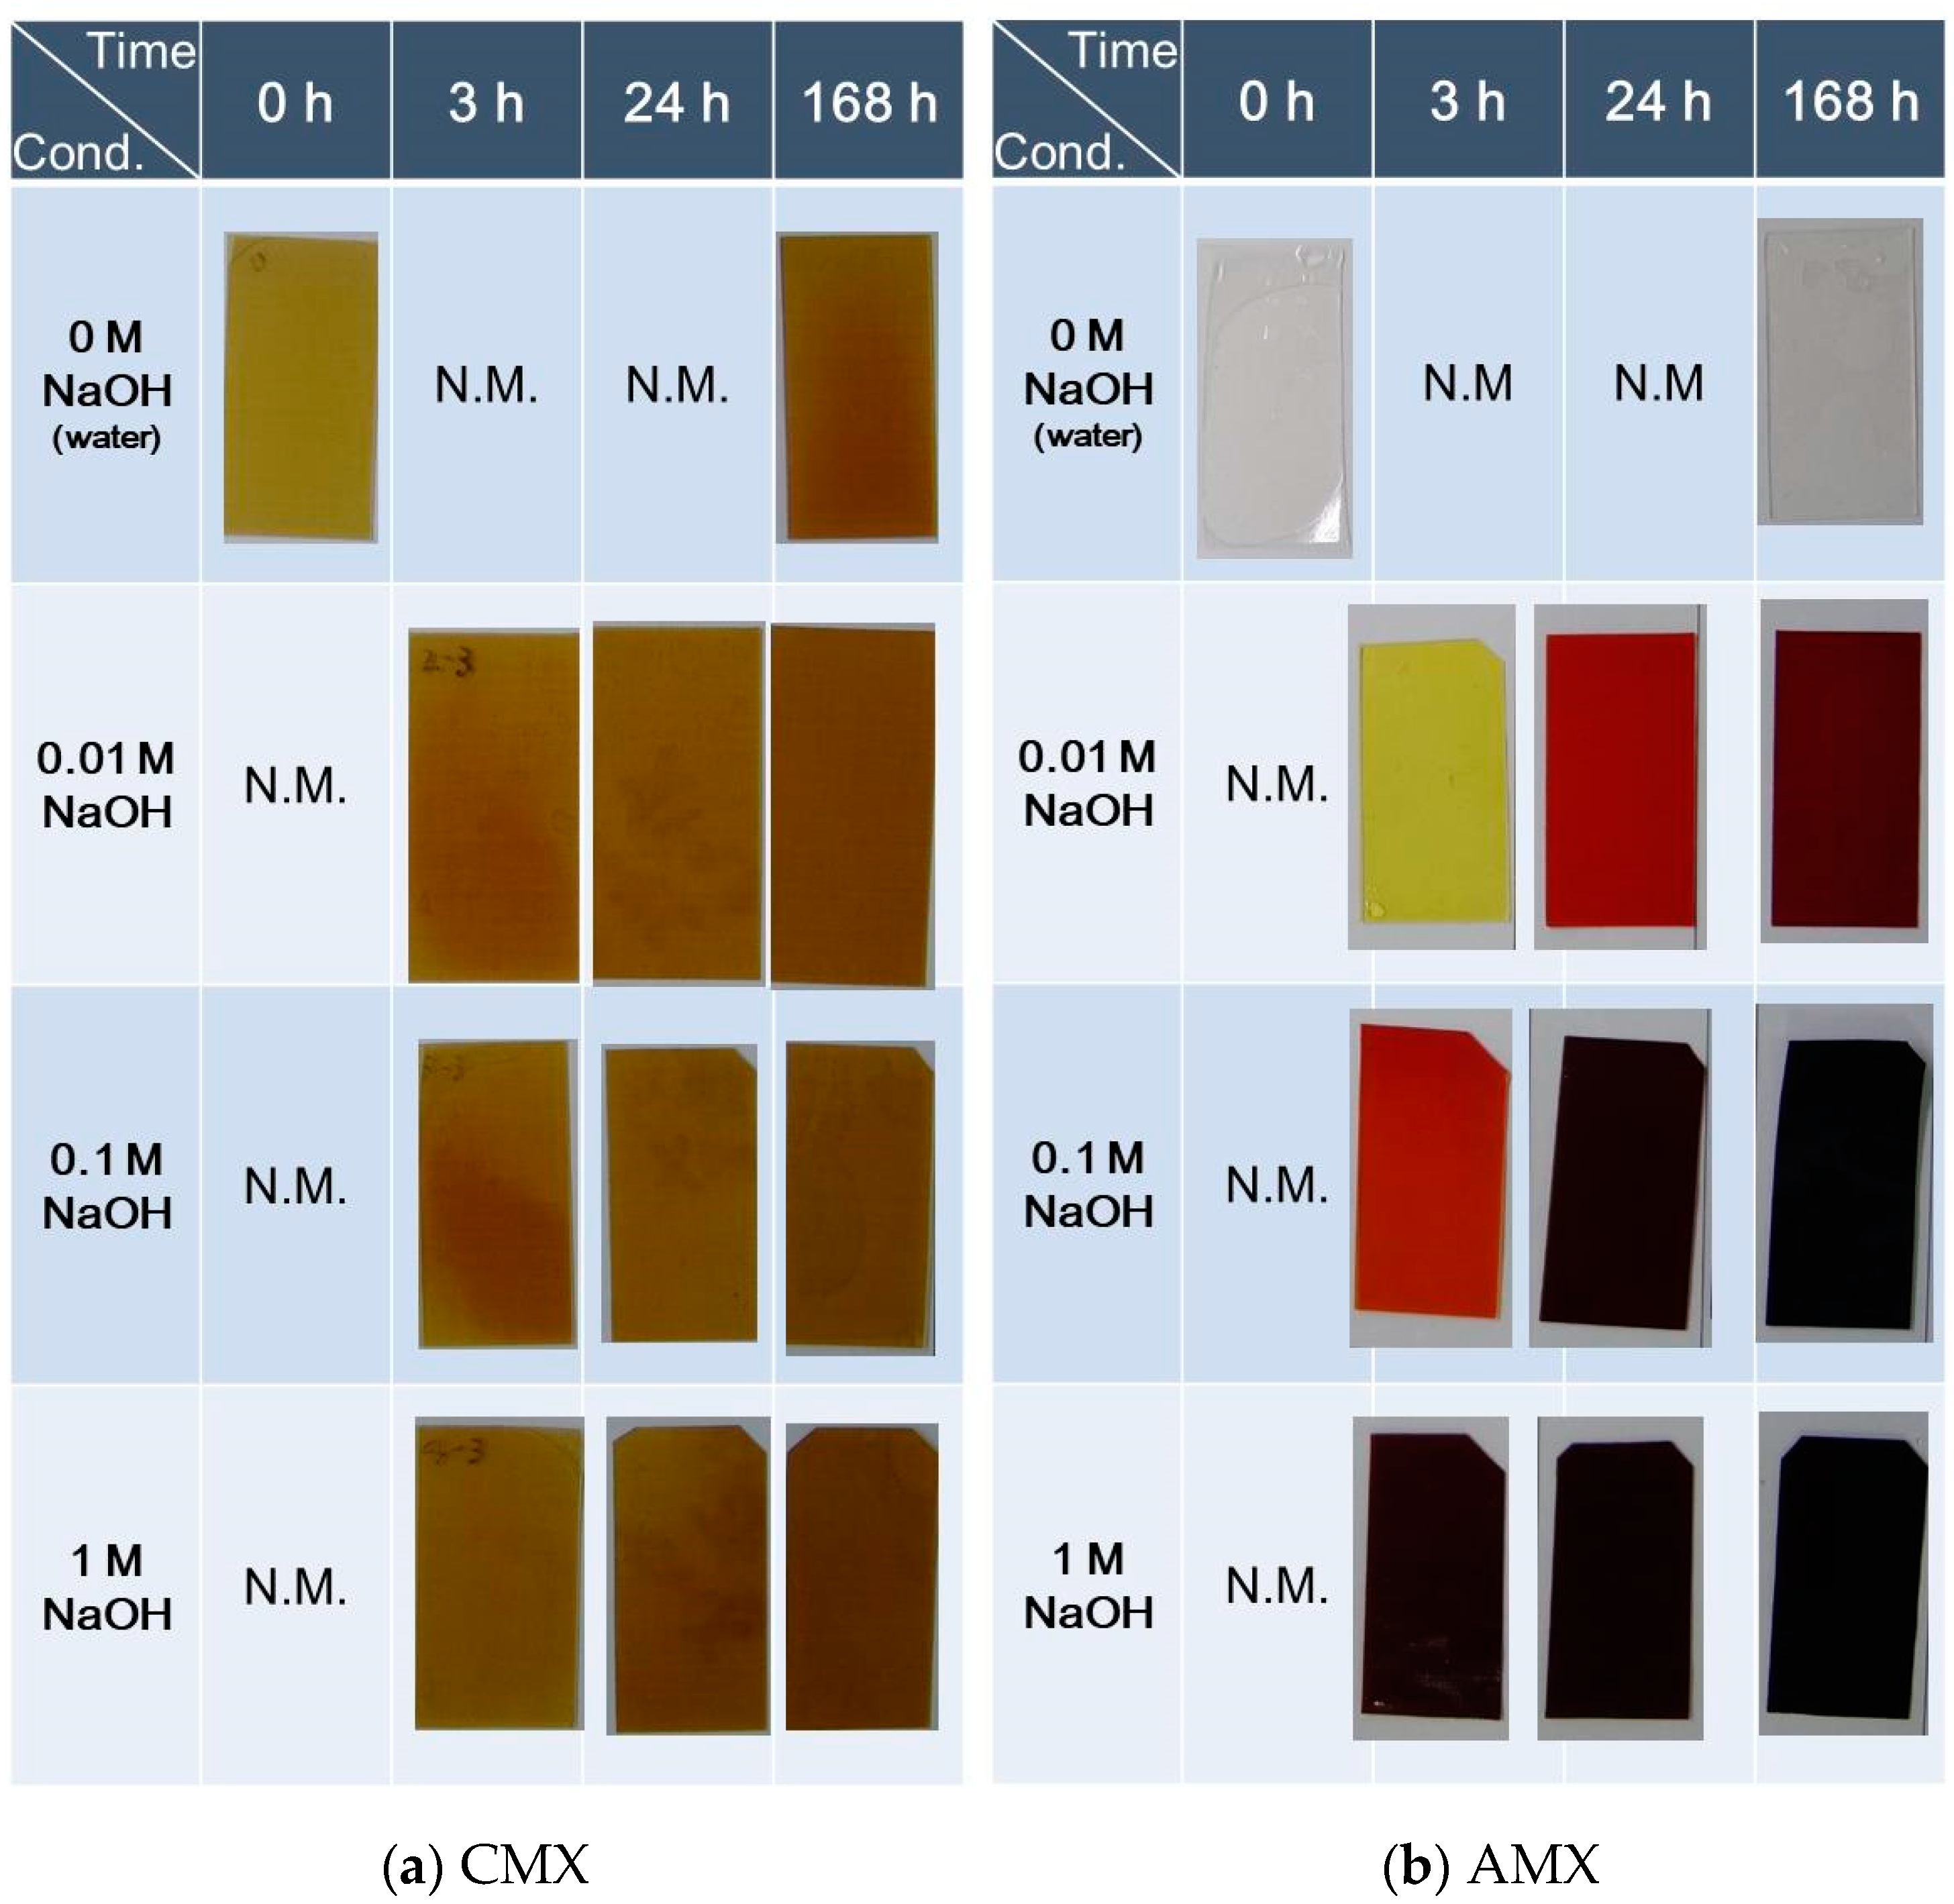
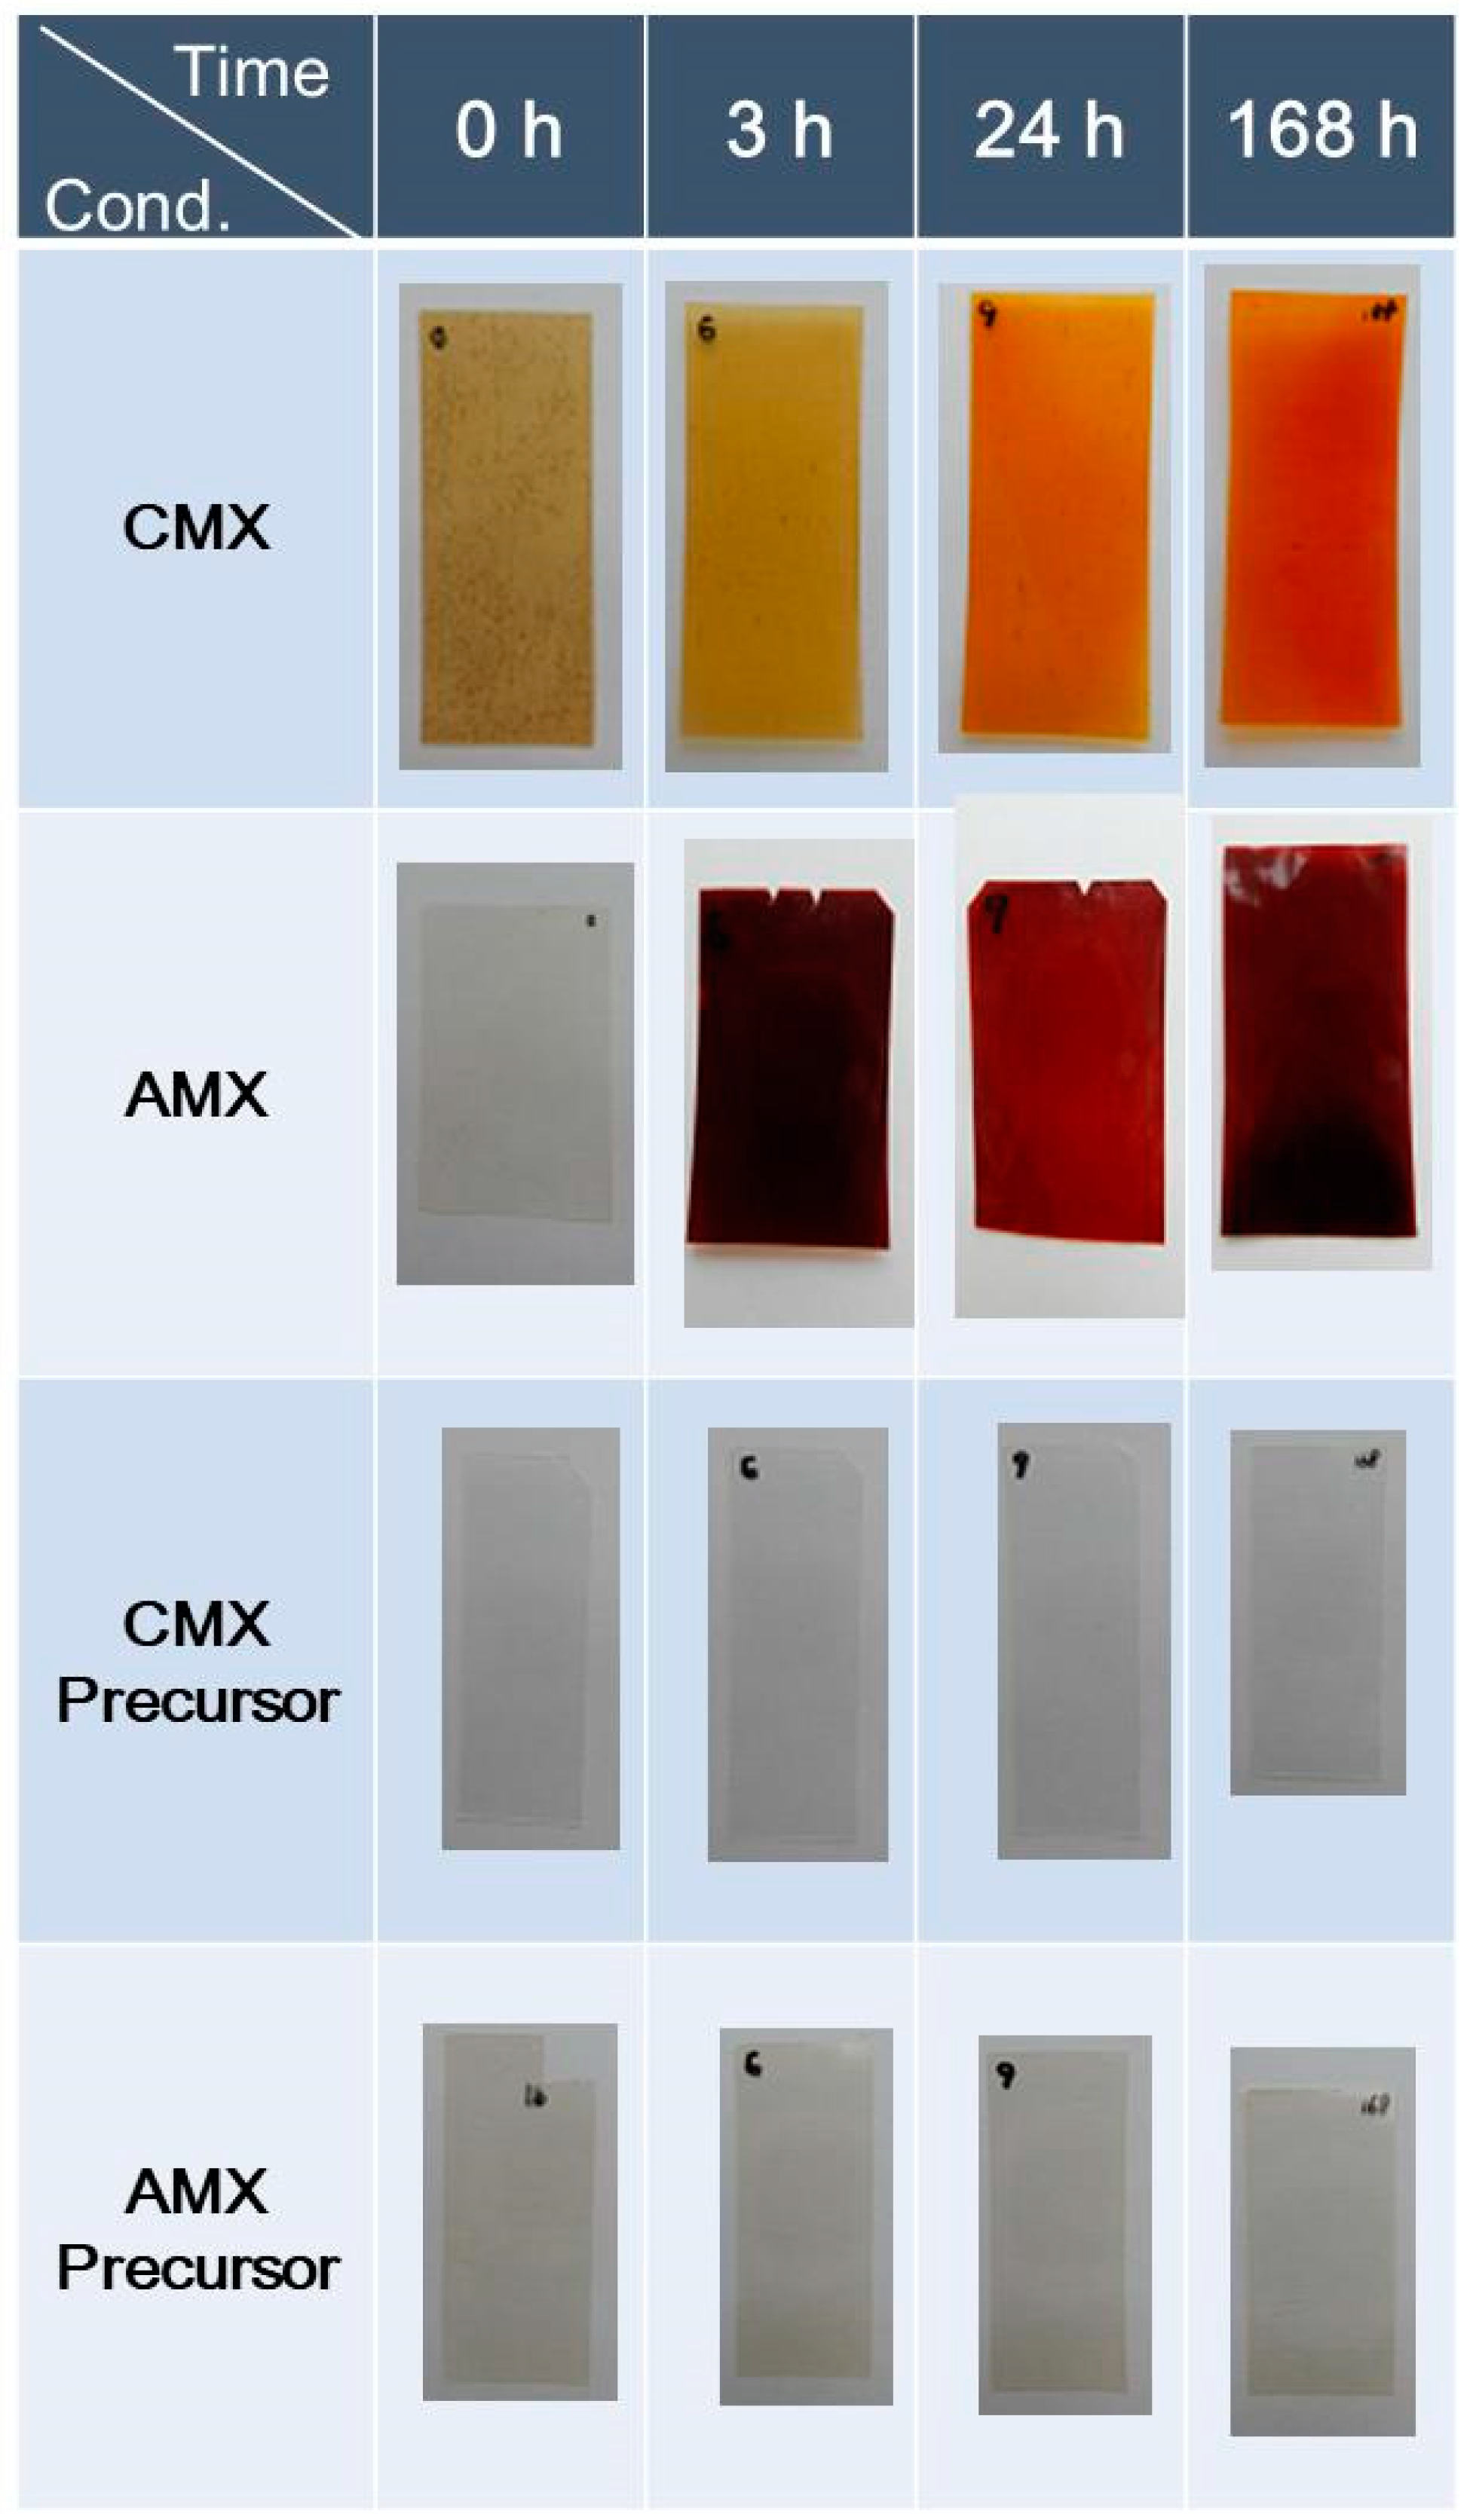
3.2.1. Color Change
3.2.2. Chemical Analysis
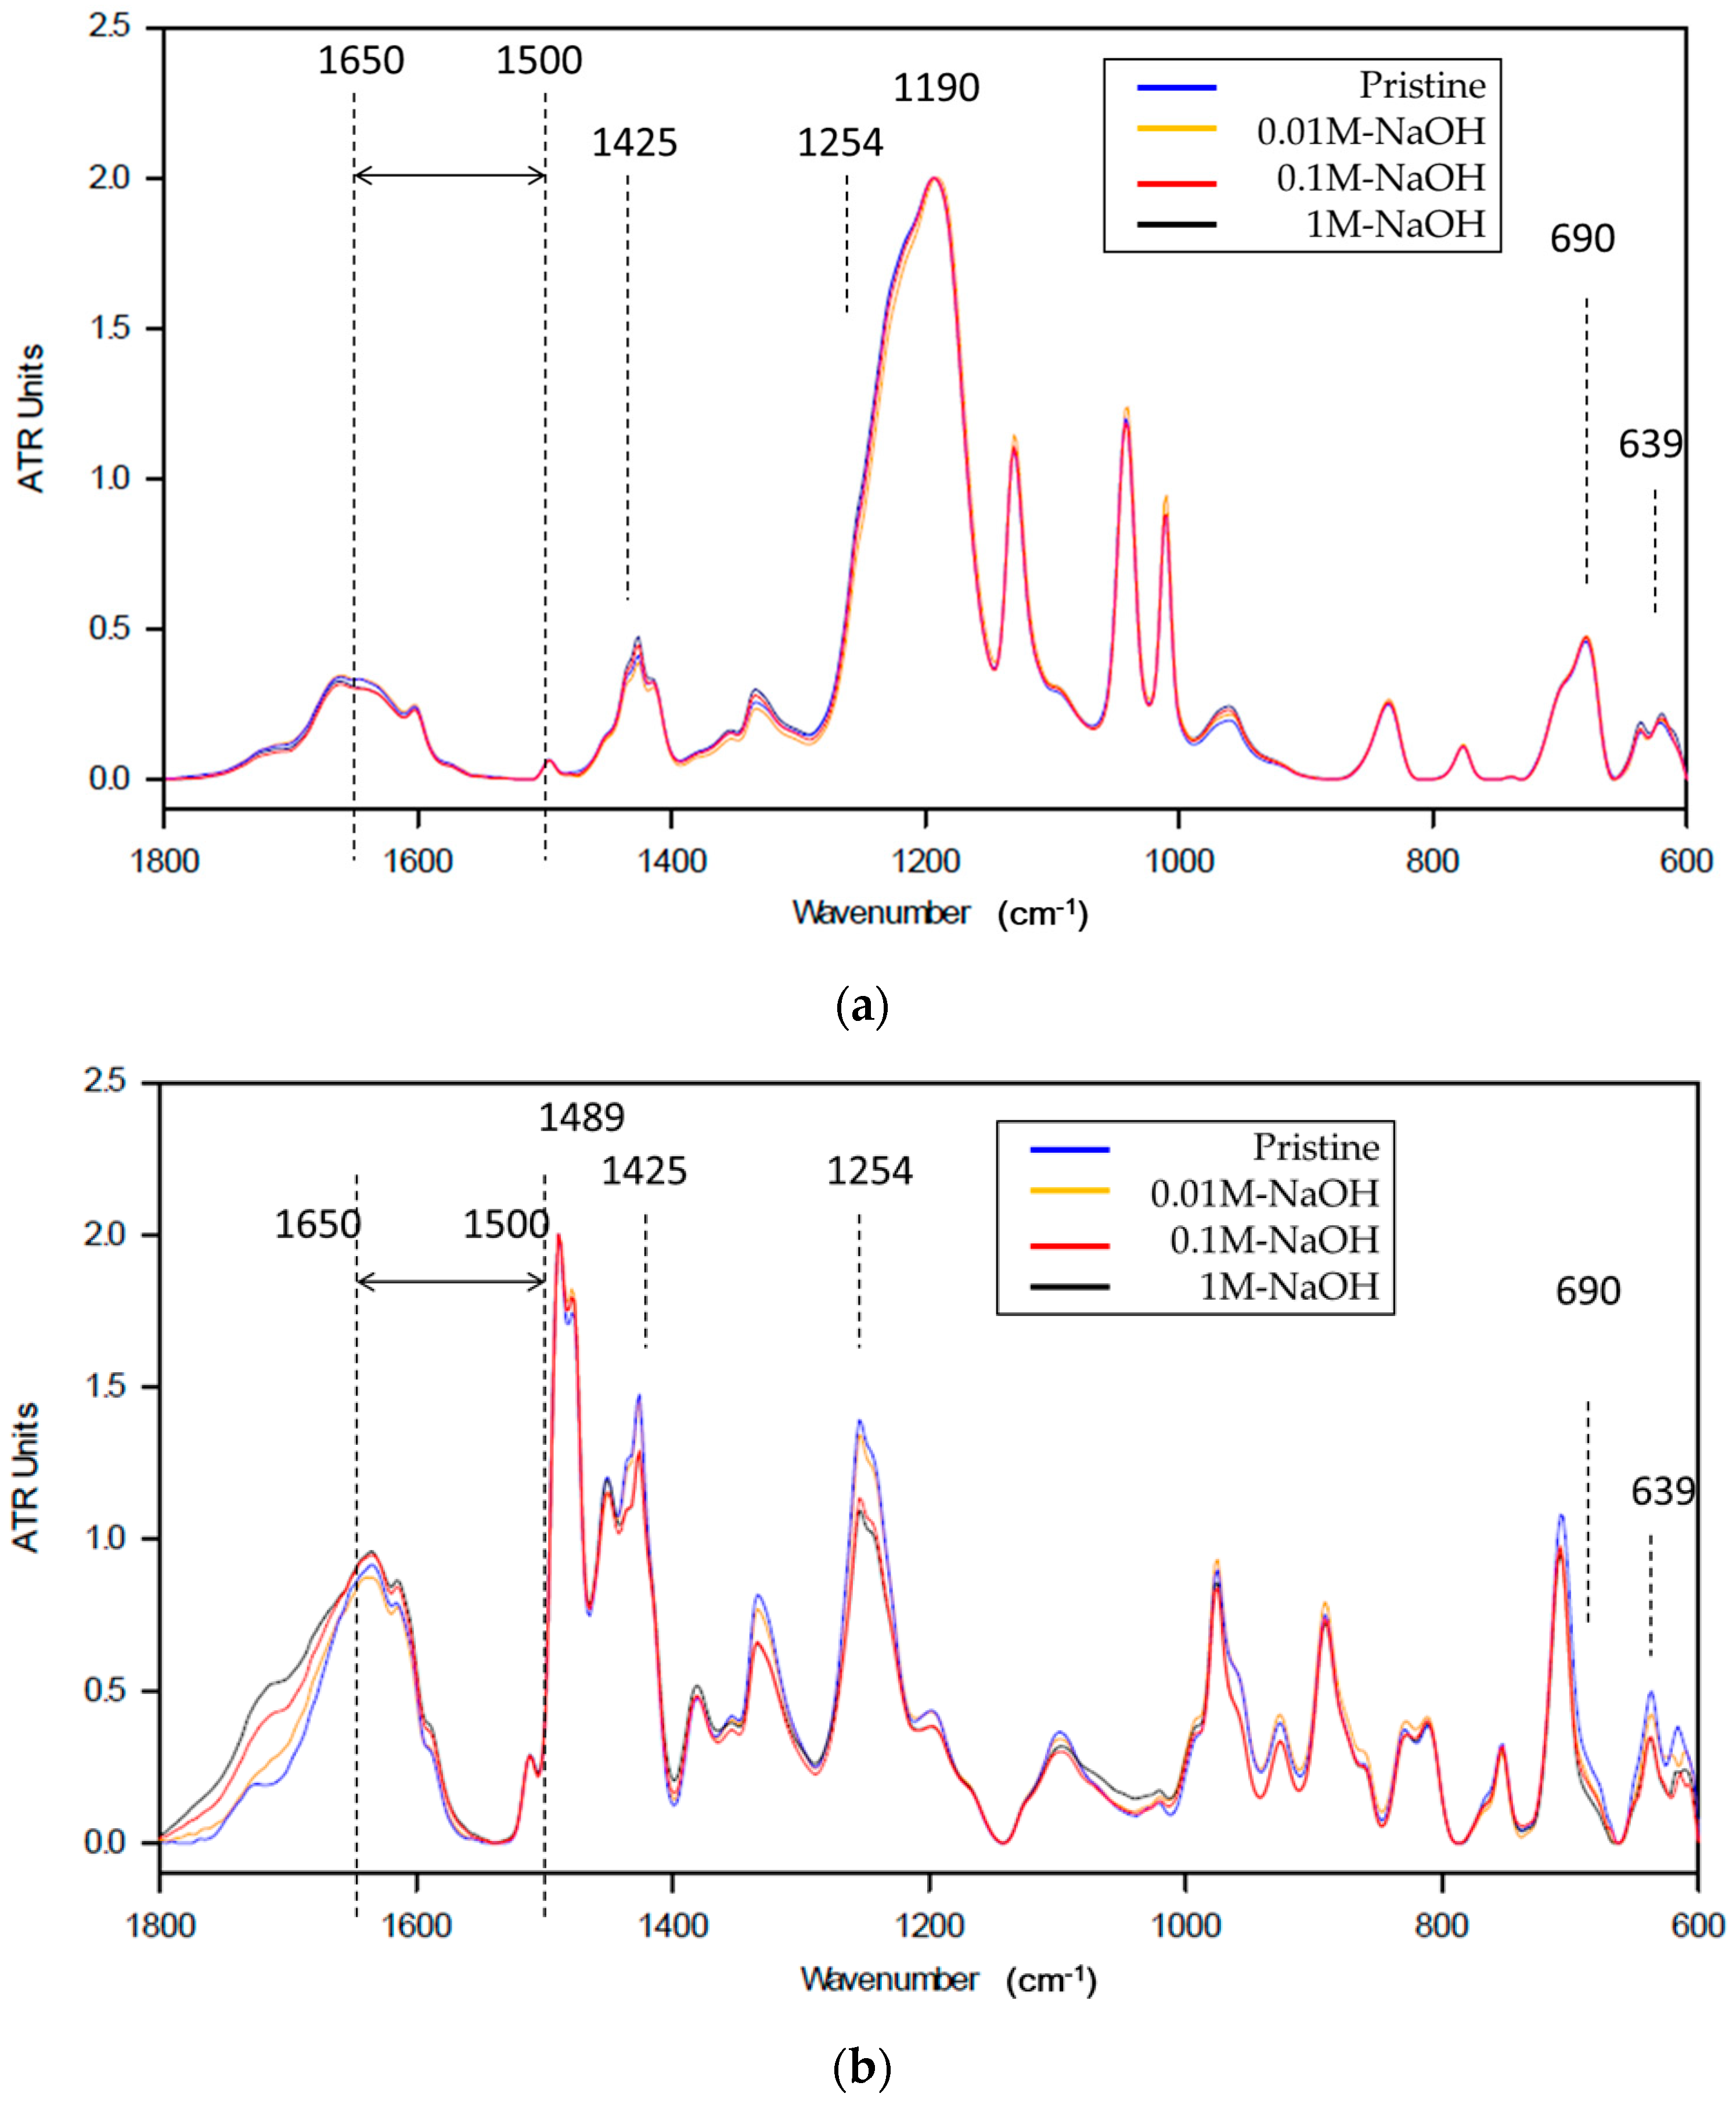
ATR-FTIR Measurement
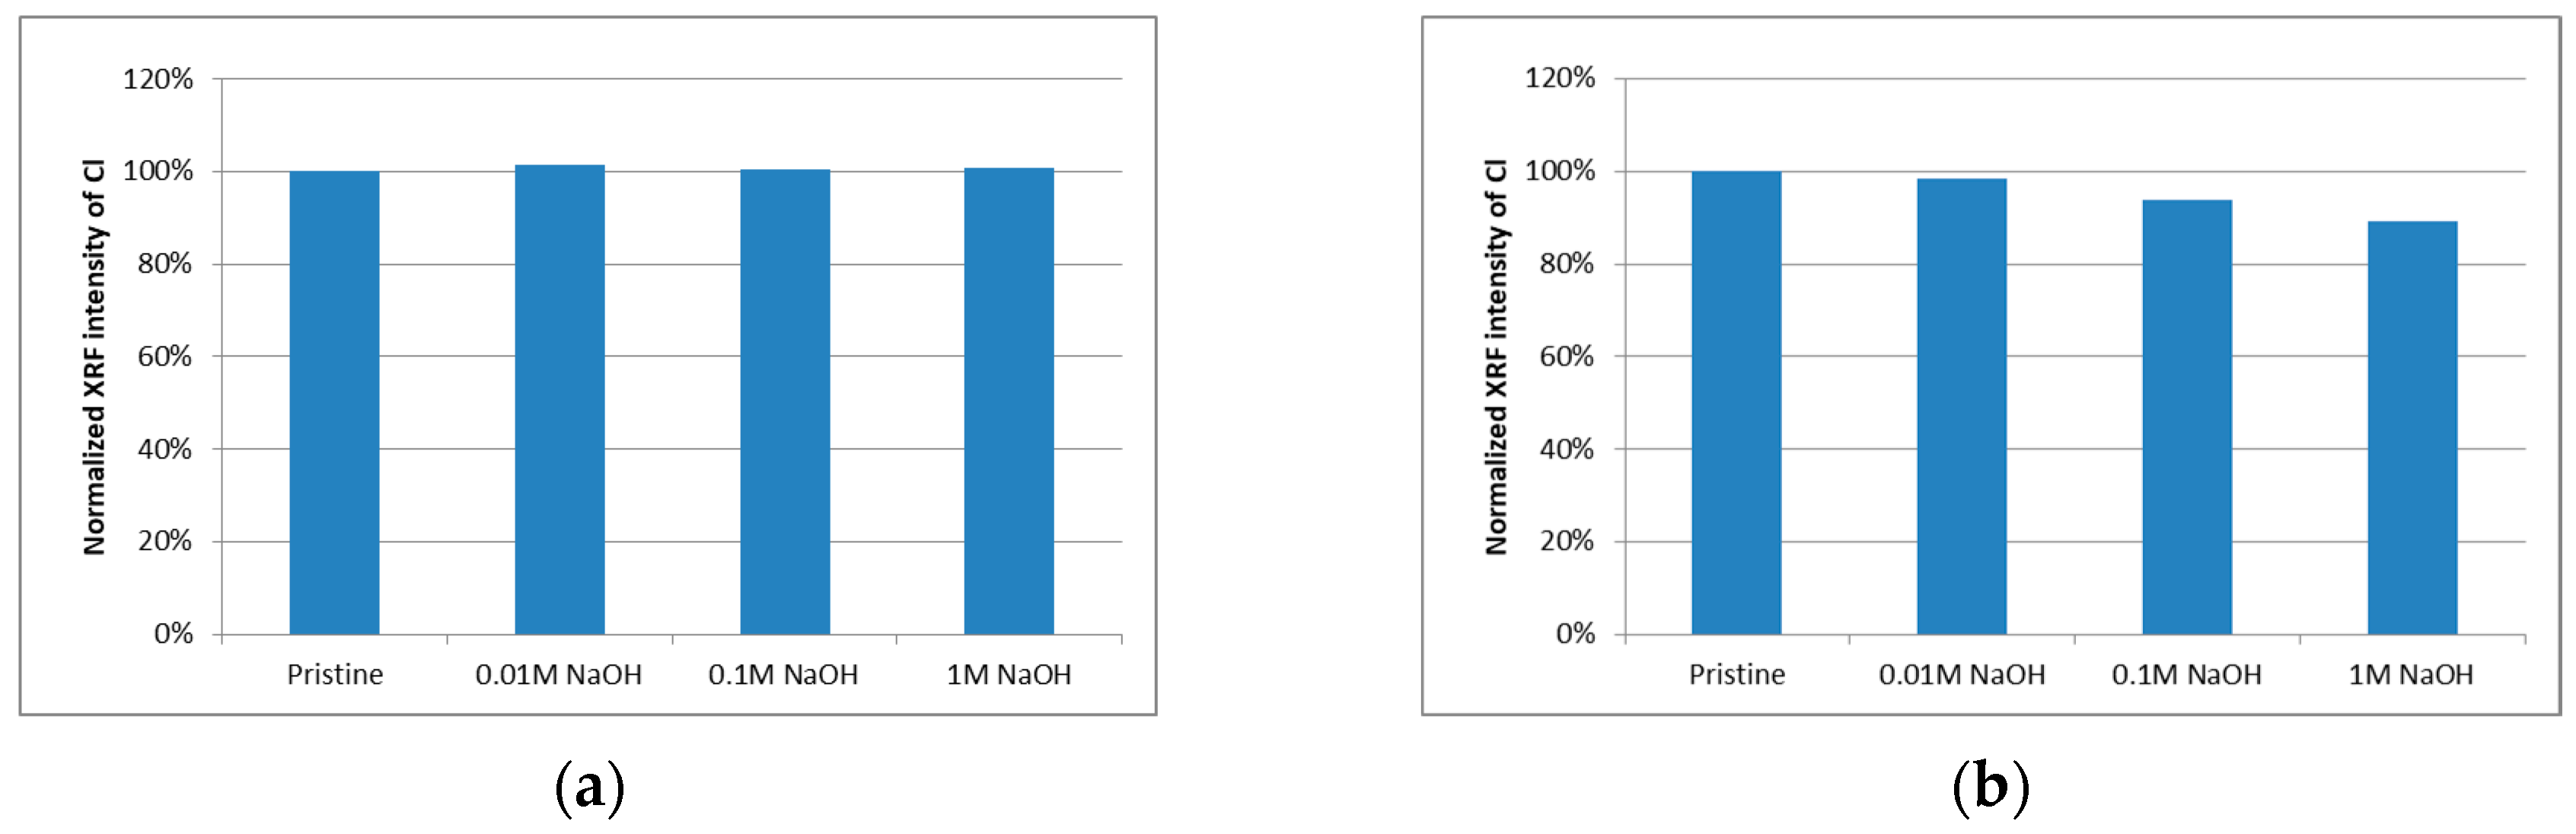
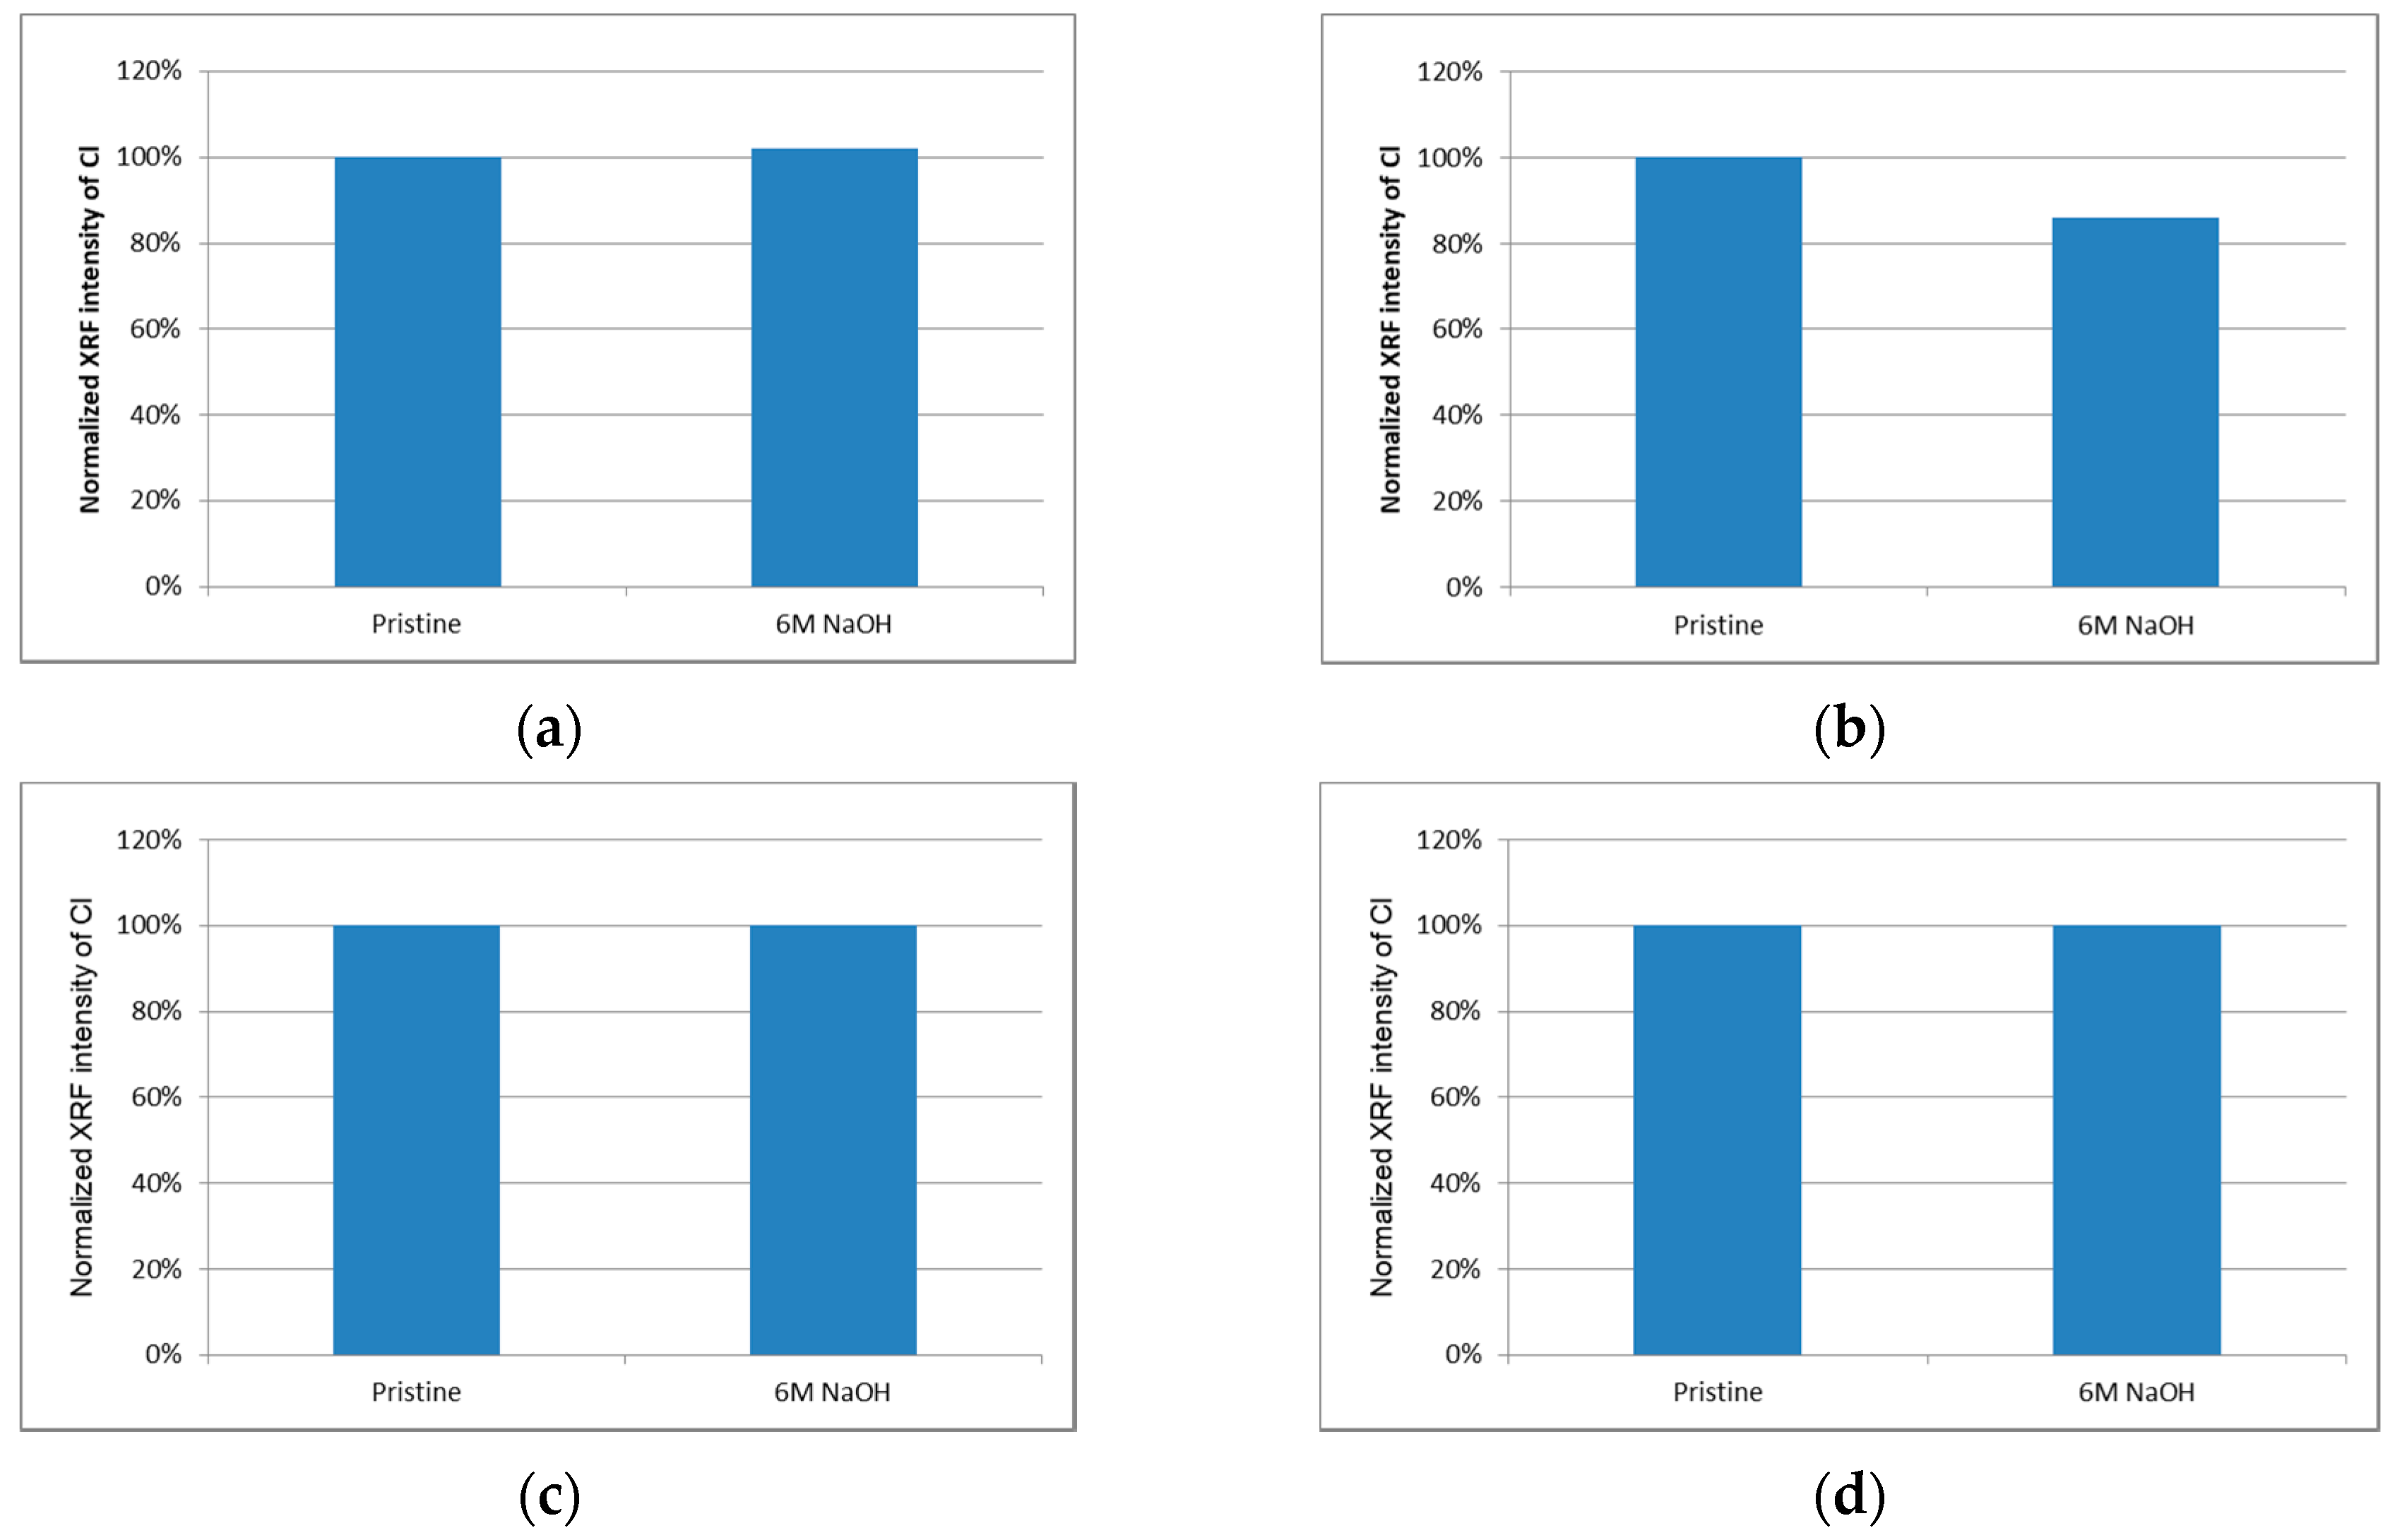
XRF
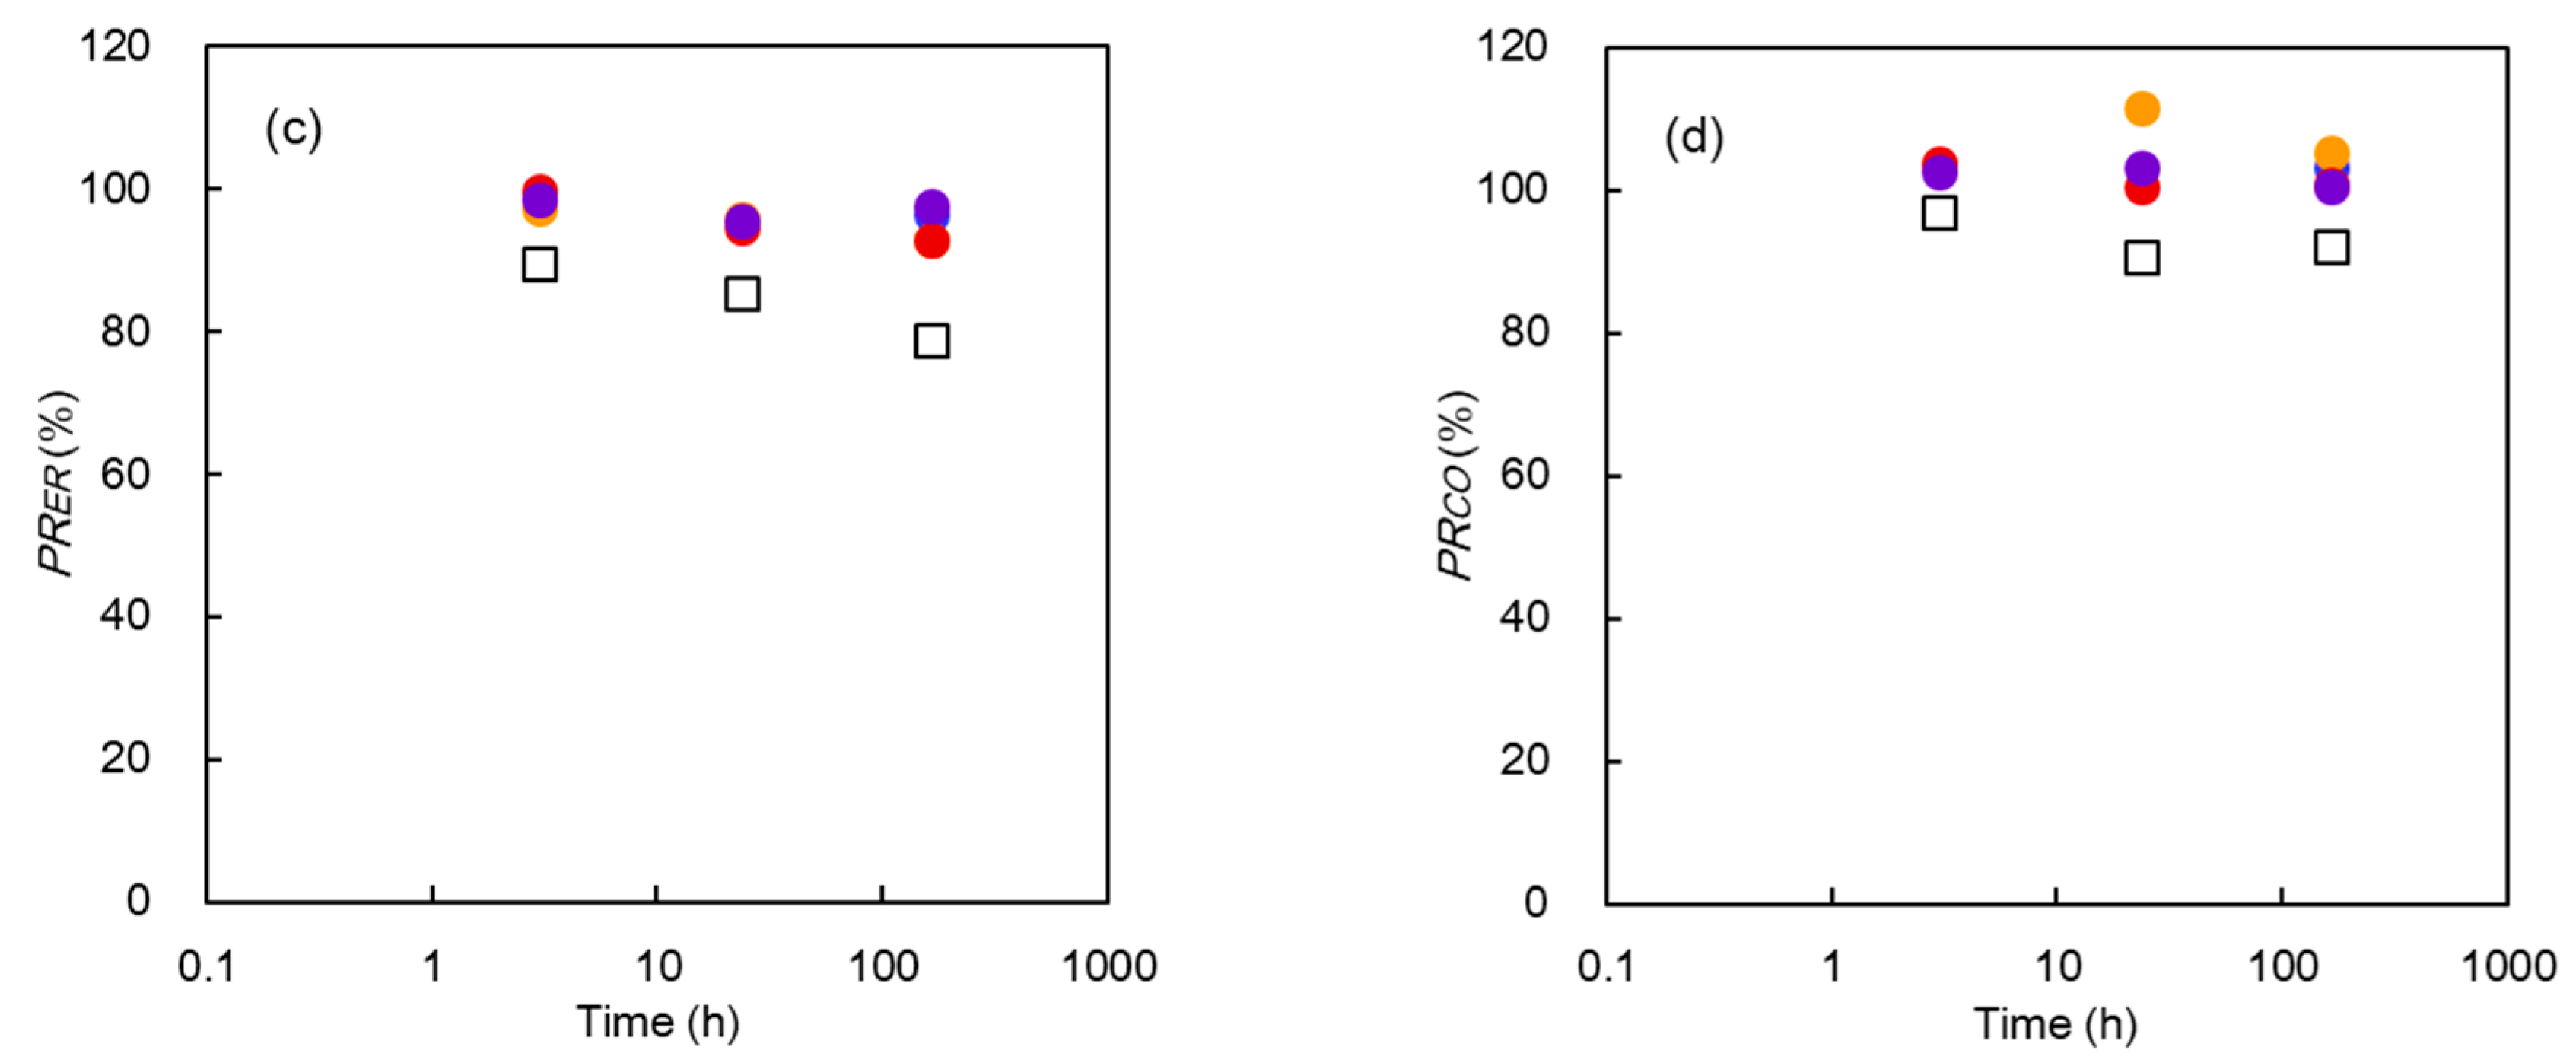
3.2.3. Characterization of Membrane Properties
3.3. Systematic Alkaline Immersion Test (High OH Concentration Test)
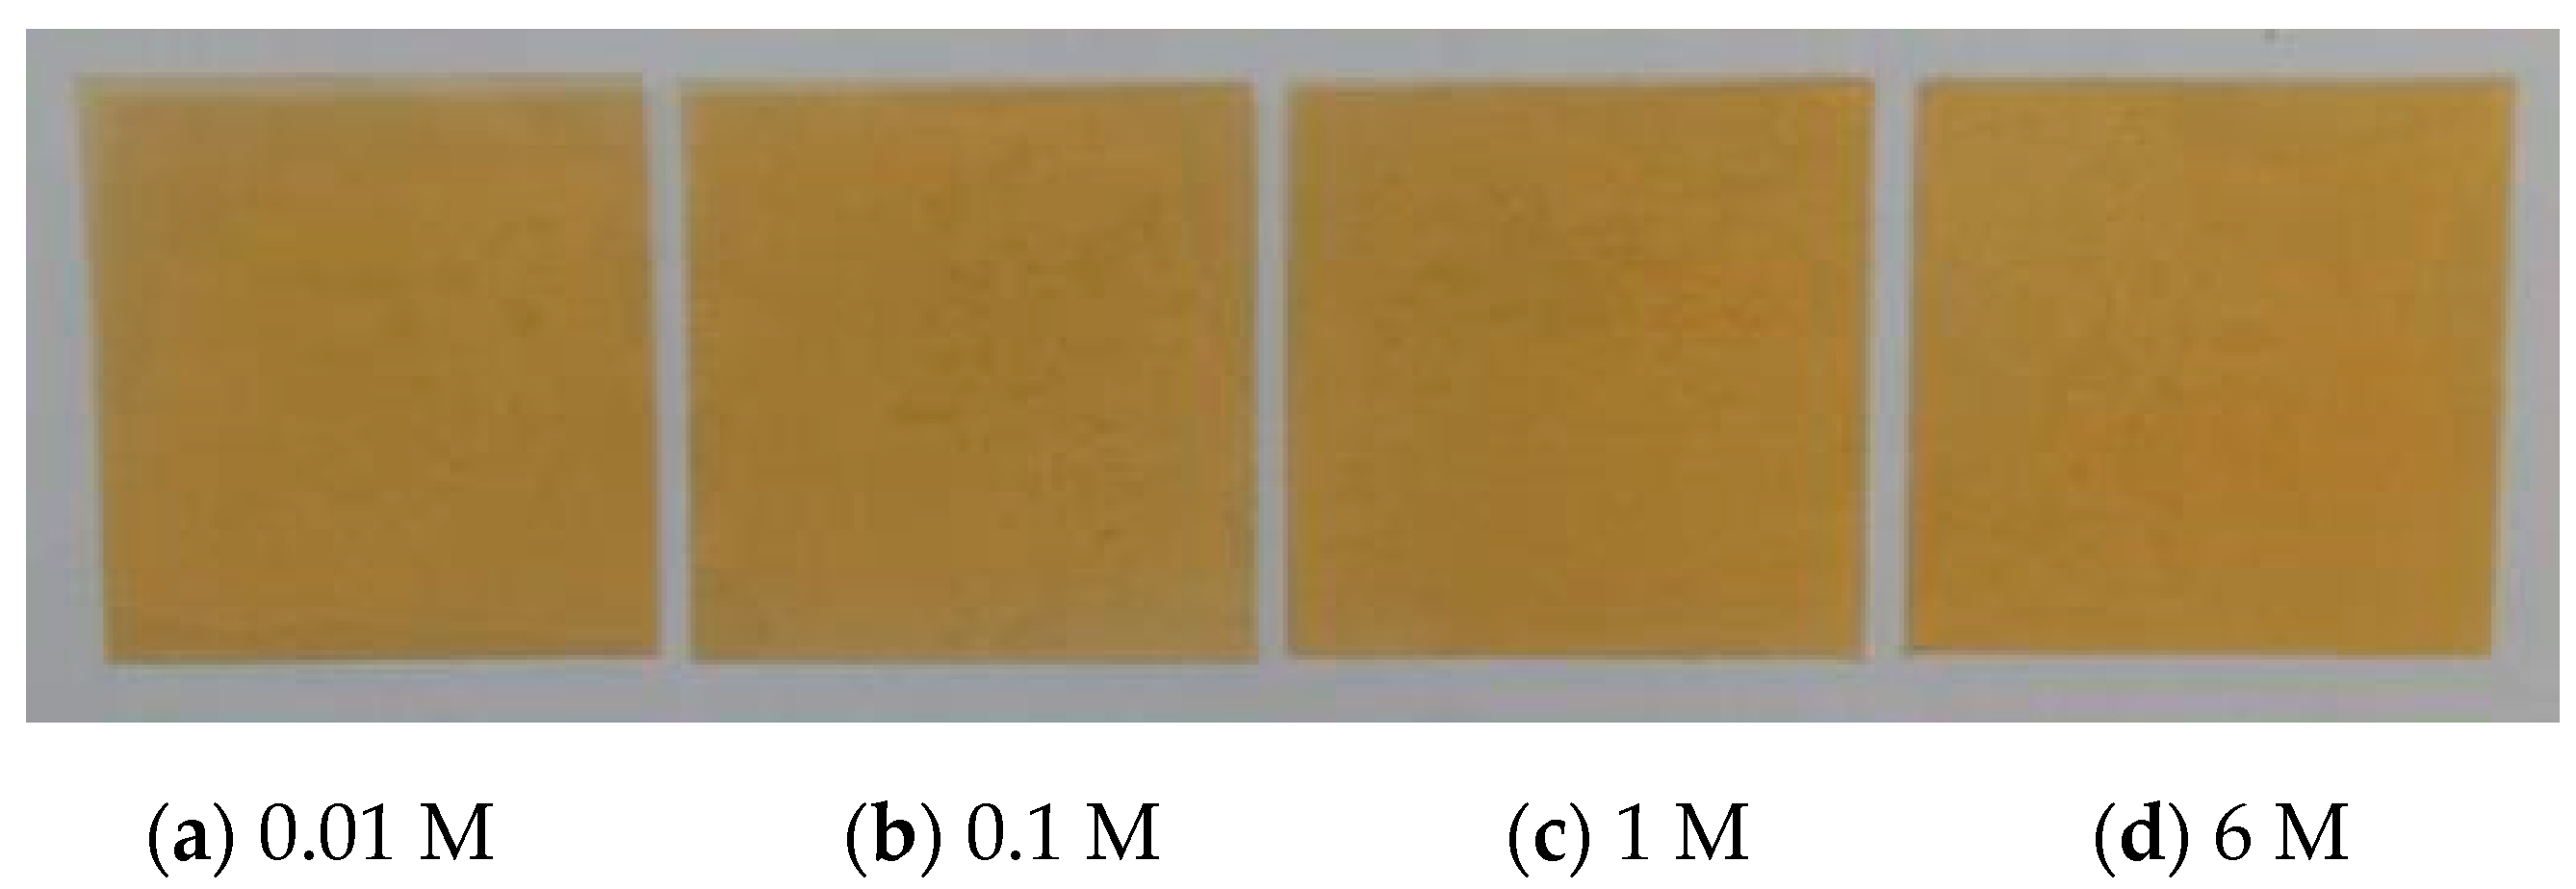
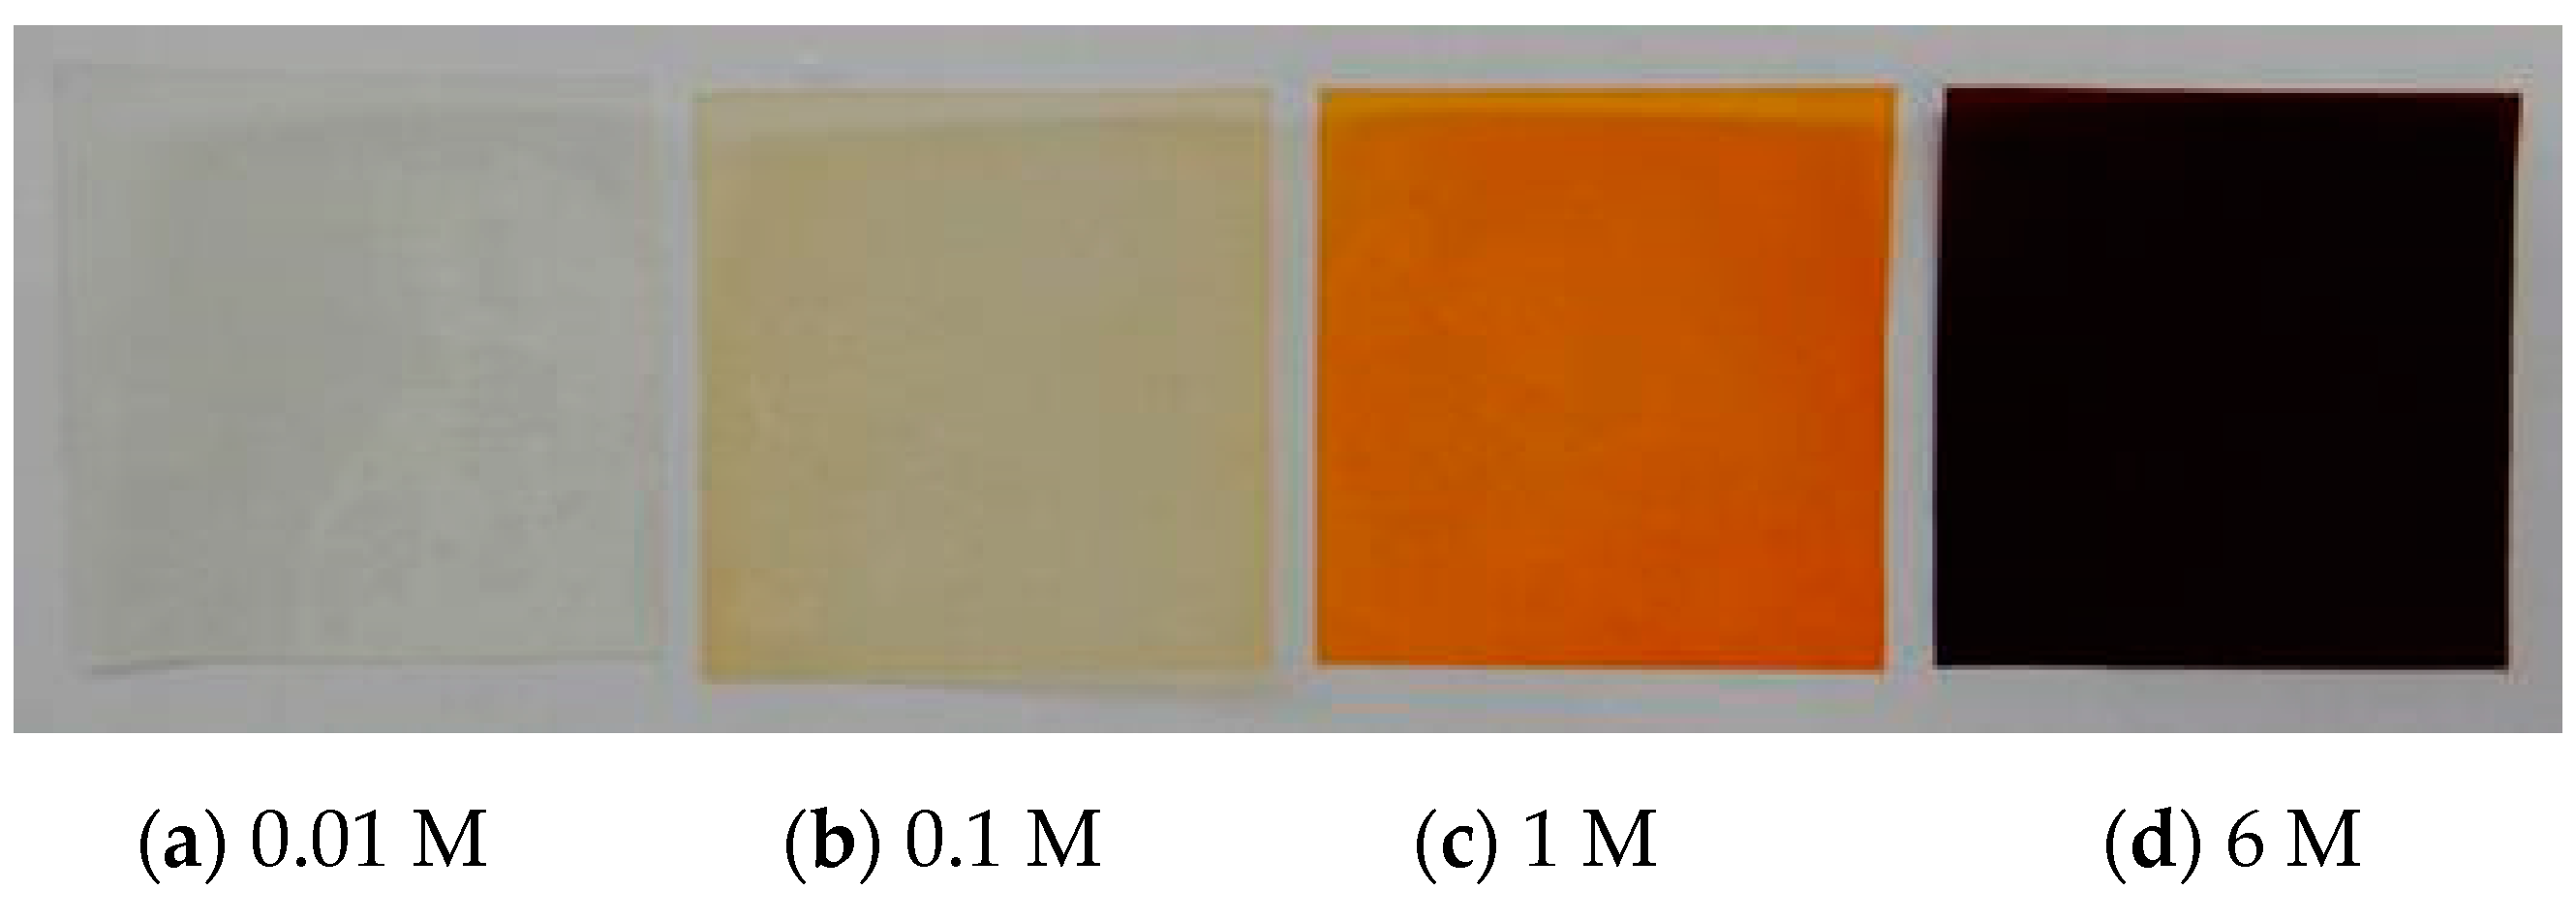
3.3.1. Color Change
3.3.2. Chemical Analysis
ATR-FTIR Measurement
XRF Measurement
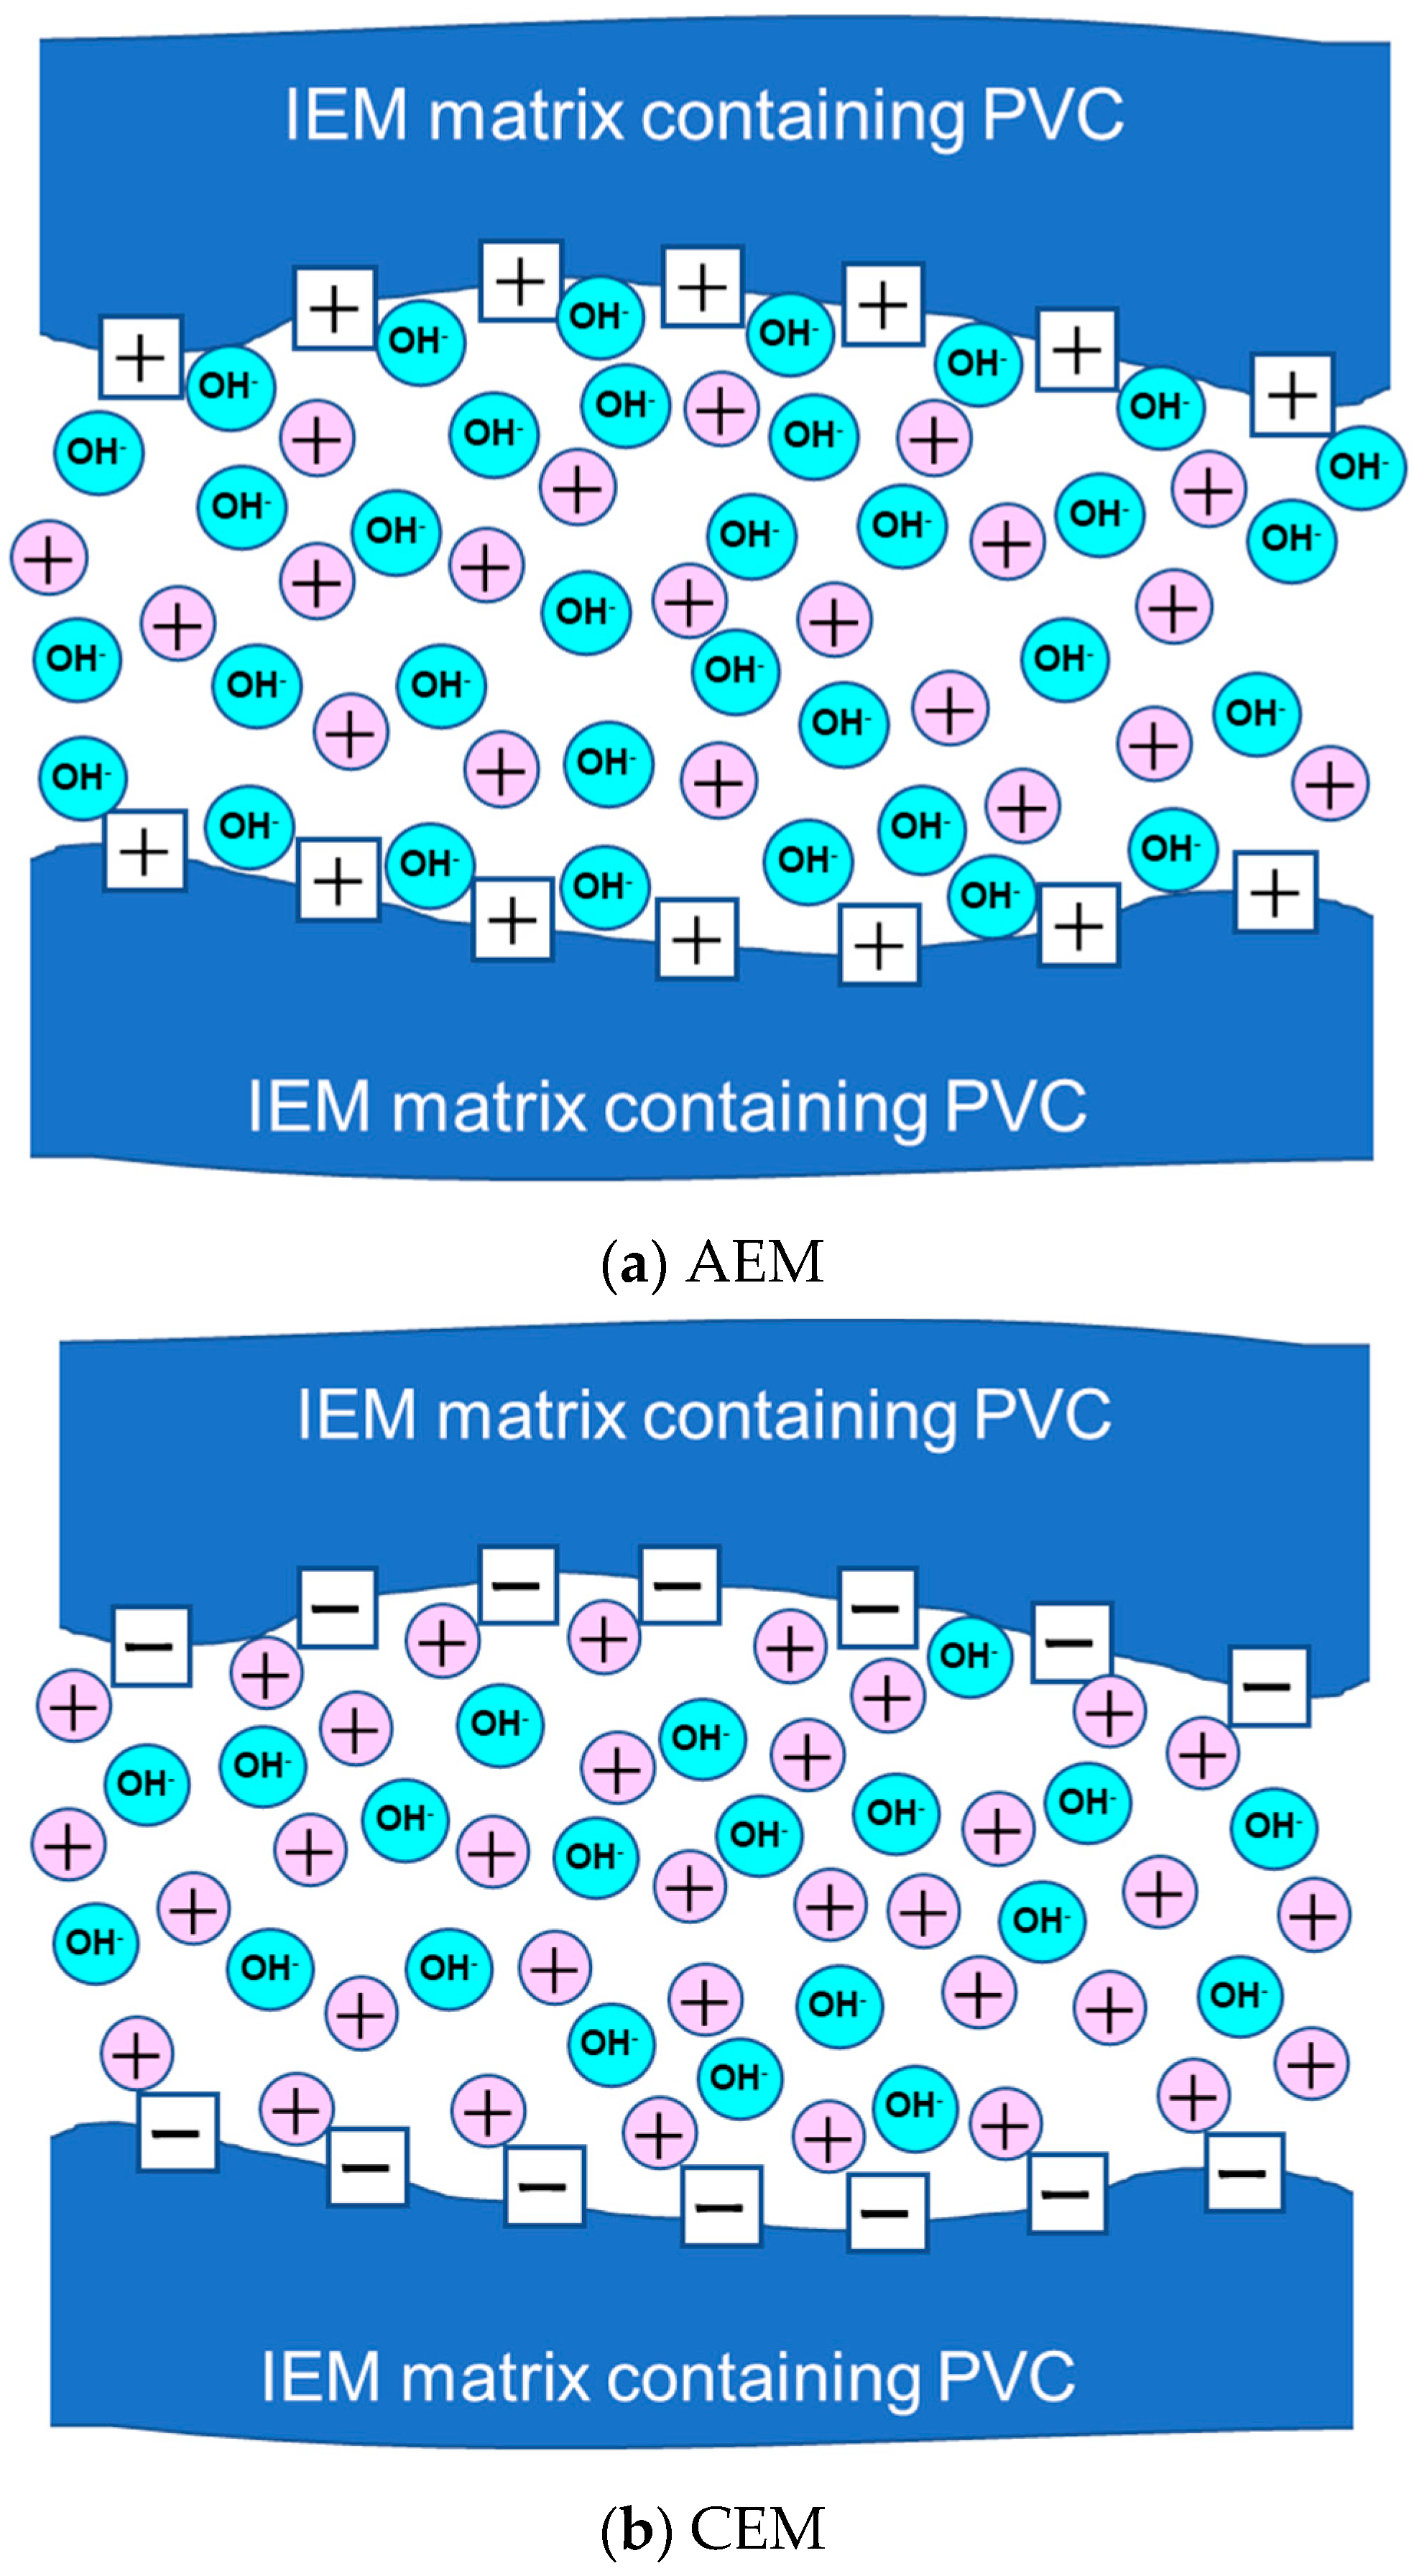
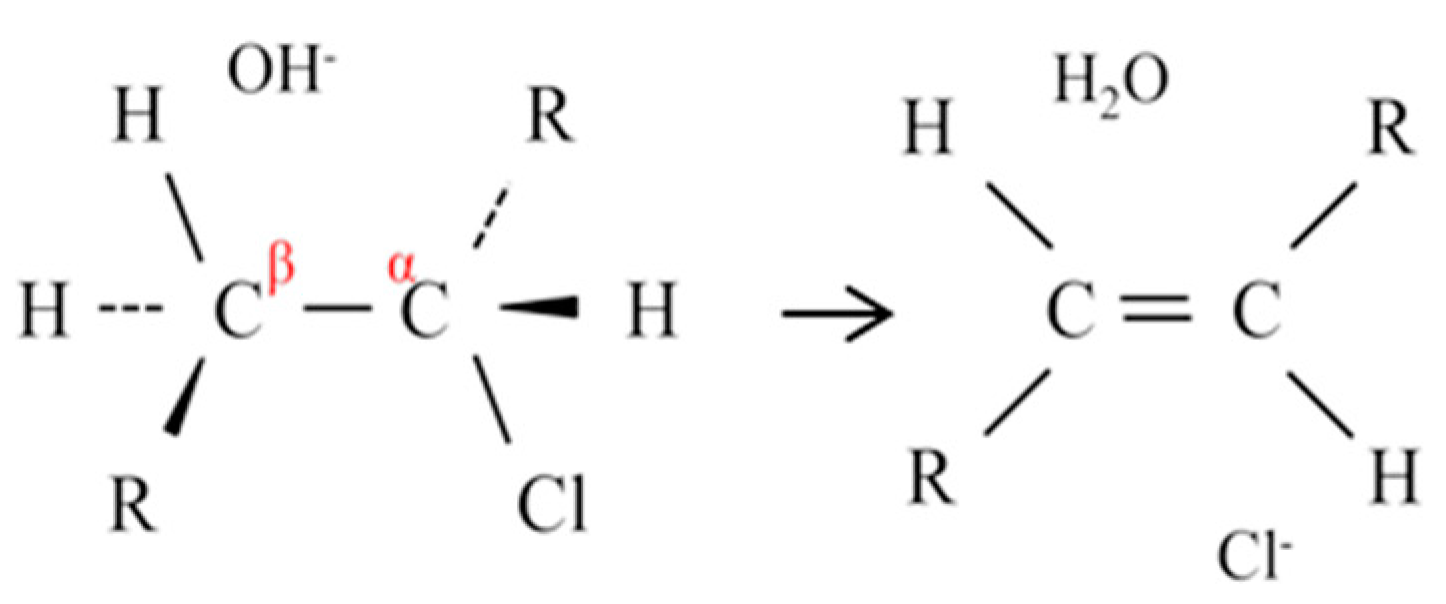
3.4. Discussion
AMX:
CMX:
4. Conclusions
Author Contributions
Funding
Acknowledgments
Conflicts of Interest
Appendix A

References
- Tanaka, Y. Ion exchange membranes, Preparation, Characterization, Modification and Application; Royal Society of Chemistry: London, UK, 2004; p. 3. [Google Scholar]
- Xu, X.; He, Q.; Ma, G.; Wang, H.; Nirmalakhandan, N.; Xu, P. Selective separation of mono- and di-valent cations in electrodialysis during brackish water desalination: Bench and pilot-scale studies. Desalination 2018, 428, 146–160. [Google Scholar] [CrossRef]
- Selvaraj, H.; Aravind, P.; Sundaram, M. Four compartment mono selective electrodialysis for separation of sodium formate from industry wastewater. Chem. Eng. J. 2018, 333, 162–169. [Google Scholar] [CrossRef]
- Babilas, D.; Dydo, P. Selective zinc recovery from electroplating wastewaters by electrodialysis enhanced with complex formation. Sep. Purif. Technol. 2018, 192, 419–428. [Google Scholar] [CrossRef]
- Mei, Y.; Tang, C.Y. Recent developments and future perspectives of reverse electrodialysis technology: A review. Desalination 2018, 425, 156–174. [Google Scholar] [CrossRef]
- Tufa, R.A.; Pawlowski, S.; Veerman, J.; Bouzek, K.; Fontananova, E.; di Profio, G.; Velizarov, S.; Crespo, J.G.; Nijmeijer, K.; Curcio, E. Progress and prospects in reverse electrodialysis for salinity gradient energy conversion and storage. Appl. Energy 2018, 225, 290–331. [Google Scholar] [CrossRef]
- Mehdizadeh, S.; Kuno, M.; Yasukawa, M.; Kawabata, Y.; Higa, M. Evaluation of Energy Harvesting from Discharged Solutions in a Salt Production Plant by Reverse Electrodialysis (RED). Desalination 2019, 467, 95–102. [Google Scholar] [CrossRef]
- Abo, T.; Mehdizadeh, S.; Kakihana, Y.; Yasukawa, M.; Higa, M. Power generation performance of a pilot-scale reverse electrodialysis (RED) stack. Bull. Soc. Sea Water Sci. Jpn. 2019, 73, 96–97. [Google Scholar]
- Mehdizadeh, S.; Yasukawa, M.; Abo, T.; Kakihana, Y.; Higa, M. Effect of spacer geometry on membrane and solution compartment resistances in reverse electrodialysis. J. Membr. Sci. 2019, 572, 271–280. [Google Scholar] [CrossRef]
- Ghalloussi, R.; Garcia-Vasquez, W.; Bellakhal, N.; Larchet, C.; Dammak, L.; Huguet, P.; Grande, D. Ageing of ion-exchange membranes used in electro-dialysis: Investigation of static parameters, electrolyte permeability and tensile strength. Sep. Purif. Technol. 2011, 80, 270–275. [Google Scholar] [CrossRef]
- Ghalloussi, R.; Garcia-Vasquez, W.; Chaabane, L.; Dammak, L.; Larchet, C.; Deabate, S.V.; Nevakshenova, E.; Nikonenko, V.; Grande, D. Ageing of ion-exchange membranes in electrodialysis: A structural and physicochemical investigation. J. Membr. Sci. 2013, 436, 68–78. [Google Scholar] [CrossRef]
- Garcia-Vasquez, W.; Dammak, L.; Larchet, C.; Nikonenko, V.; Pismenskaya, N.; Grande, D. Evolution of anion-exchange membrane properties in a full scale electrodialysis stack. J. Membr. Sci. 2013, 446, 255–265. [Google Scholar] [CrossRef]
- Ghalloussi, R.; Chaabane, L.; Larchet, C.; Dammak, L.; Grande, D. Structural and physicochemical investigation of ageing of ion-exchange membranes in electrodialysis for food industry. Sep. Purif. Technol. 2014, 123, 229–234. [Google Scholar] [CrossRef]
- Garcia-Vasquez, W.; Ghalloussi, R.; Dammak, L.; Larchet, C.; Nikonenko, V.; Grande, D. Structure and properties of heterogeneous and homogeneous ion-exchange membranes subjected to ageing in sodium hypochlorite. J. Membr. Sci. 2014, 452, 104–116. [Google Scholar] [CrossRef]
- Garcia-Vasquez, W.; Dammak, L.; Larchet, C.; Nikonenko, V.; Grande, D. Effects of acid-base cleaning procedure on structure and properties of anion-exchange membranes used in Electrodialysis. J. Membr. Sci. 2016, 507, 12–23. [Google Scholar] [CrossRef]
- Mizutani, Y.; Yamane, R.; Ihara, H.; Motomura, H. Studies of ion exchange membranes. XVI. The preparation of ion exchange membranes by the “Paste Method”. Bull. Chem. Soc. Jpn. 1963, 36, 361–366. [Google Scholar] [CrossRef]
- Mizutani, Y.; Yamane, R.; Motomura, H. Studies of ion exchange membranes. XXII. Semicontinuous preparation of ion exchange membranes by the “Paste Method”. Bull. Chem. Soc. Jpn. 1965, 38, 689–694. [Google Scholar] [CrossRef]
- Doi, S.; Yasukawa, H.; Kakihana, Y.; Higa, M. Alkali attack on anion exchange membranes with PVC backing and binder: Effect on performance and correlation between them. J. Membr. Sci. 2019, 573, 85–96. [Google Scholar] [CrossRef]
- Doi, S.; Kinoshita, M.; Yasukawa, M.; Higa, M. Alkali attack on anion exchange membranes with PVC backing and binder: II Prediction of electrical and mechanical performances from simple optical analyses. Membranes 2018, 8, 84. [Google Scholar] [CrossRef]
- Zabolotsky, V.I.; Nikonenko, V.V. Effect of structural membrane inhomogeneity on transport properties. J. Membr. Sci. 1993, 79, 181–198. [Google Scholar] [CrossRef]
- Sarapulova, V.; Shkorkina, I.; Mareev, S.; Pismenskaya, N.; Kononenko, N.; Larchet, C.; Dammak, L.; Nikonenko, V. Transport characteristics of fujifilm ion-exchange membranes as compared to homogeneous membranes AMX and CMX and to heterogeneous membranes MK-40 and MA-41. Membranes 2019, 9, 84. [Google Scholar] [CrossRef]
- Higa, M.; Tanaka, N.; Nagase, M.; Yutani, K.; Kameyama, T.; Takamura, K.; Kakihana, Y. Electrodialytic properties of aromatic and aliphatic type hydrocarbonbased anion-exchange membranes with various anion-exchange groups. Polymer 2014, 55, 3951–3960. [Google Scholar] [CrossRef]
- Tanaka, N.; Nagase, M.; Higa, M. Preparation of aliphatic-hydrocarbon-based anion-exchange membranes and their anti-organic-fouling properties. J. Membr. Sci. 2011, 384, 27–36. [Google Scholar] [CrossRef]
- Danno, T.; Kondoh, H.; Furuhata, K.I.; Miyasaka, K. Synthesis, Structure, and Properties of Conjugated Polyene Films by Dehydrochlorination of PVC Films. J. Appl. Polym. Sci. 1984, 29, 3171–3184. [Google Scholar] [CrossRef]


| Backing | Binder | Thickness (mm) | Ion-Exchange Capacity (meq./g-Dry-Membrane) | Water Content (%) | Fixed Charge Density (meq./g-Water) | |
|---|---|---|---|---|---|---|
| CMX | PVC | PVC | 0.169 | 1.73 | 28.6 | 6.0 |
| AMX | PVC | PVC | 0.143 | 1.47 | 20.9 | 7.0 |
© 2020 by the authors. Licensee MDPI, Basel, Switzerland. This article is an open access article distributed under the terms and conditions of the Creative Commons Attribution (CC BY) license (http://creativecommons.org/licenses/by/4.0/).
Share and Cite
Doi, S.; Takumi, N.; Kakihana, Y.; Higa, M. Alkali Attack on Cation-Exchange Membranes with Polyvinyl Chloride Backing and Binder: Comparison with Anion-Exchange Membranes. Membranes 2020, 10, 228. https://doi.org/10.3390/membranes10090228
Doi S, Takumi N, Kakihana Y, Higa M. Alkali Attack on Cation-Exchange Membranes with Polyvinyl Chloride Backing and Binder: Comparison with Anion-Exchange Membranes. Membranes. 2020; 10(9):228. https://doi.org/10.3390/membranes10090228
Chicago/Turabian StyleDoi, Shoichi, Nobuya Takumi, Yuriko Kakihana, and Mitsuru Higa. 2020. "Alkali Attack on Cation-Exchange Membranes with Polyvinyl Chloride Backing and Binder: Comparison with Anion-Exchange Membranes" Membranes 10, no. 9: 228. https://doi.org/10.3390/membranes10090228
APA StyleDoi, S., Takumi, N., Kakihana, Y., & Higa, M. (2020). Alkali Attack on Cation-Exchange Membranes with Polyvinyl Chloride Backing and Binder: Comparison with Anion-Exchange Membranes. Membranes, 10(9), 228. https://doi.org/10.3390/membranes10090228