How Overlimiting Current Condition Influences Lactic Acid Recovery and Demineralization by Electrodialysis with Nanofiltration Membrane: Comparison with Conventional Electrodialysis


Abstract

1. Introduction
2. Materials and Methods
2.1. Whey
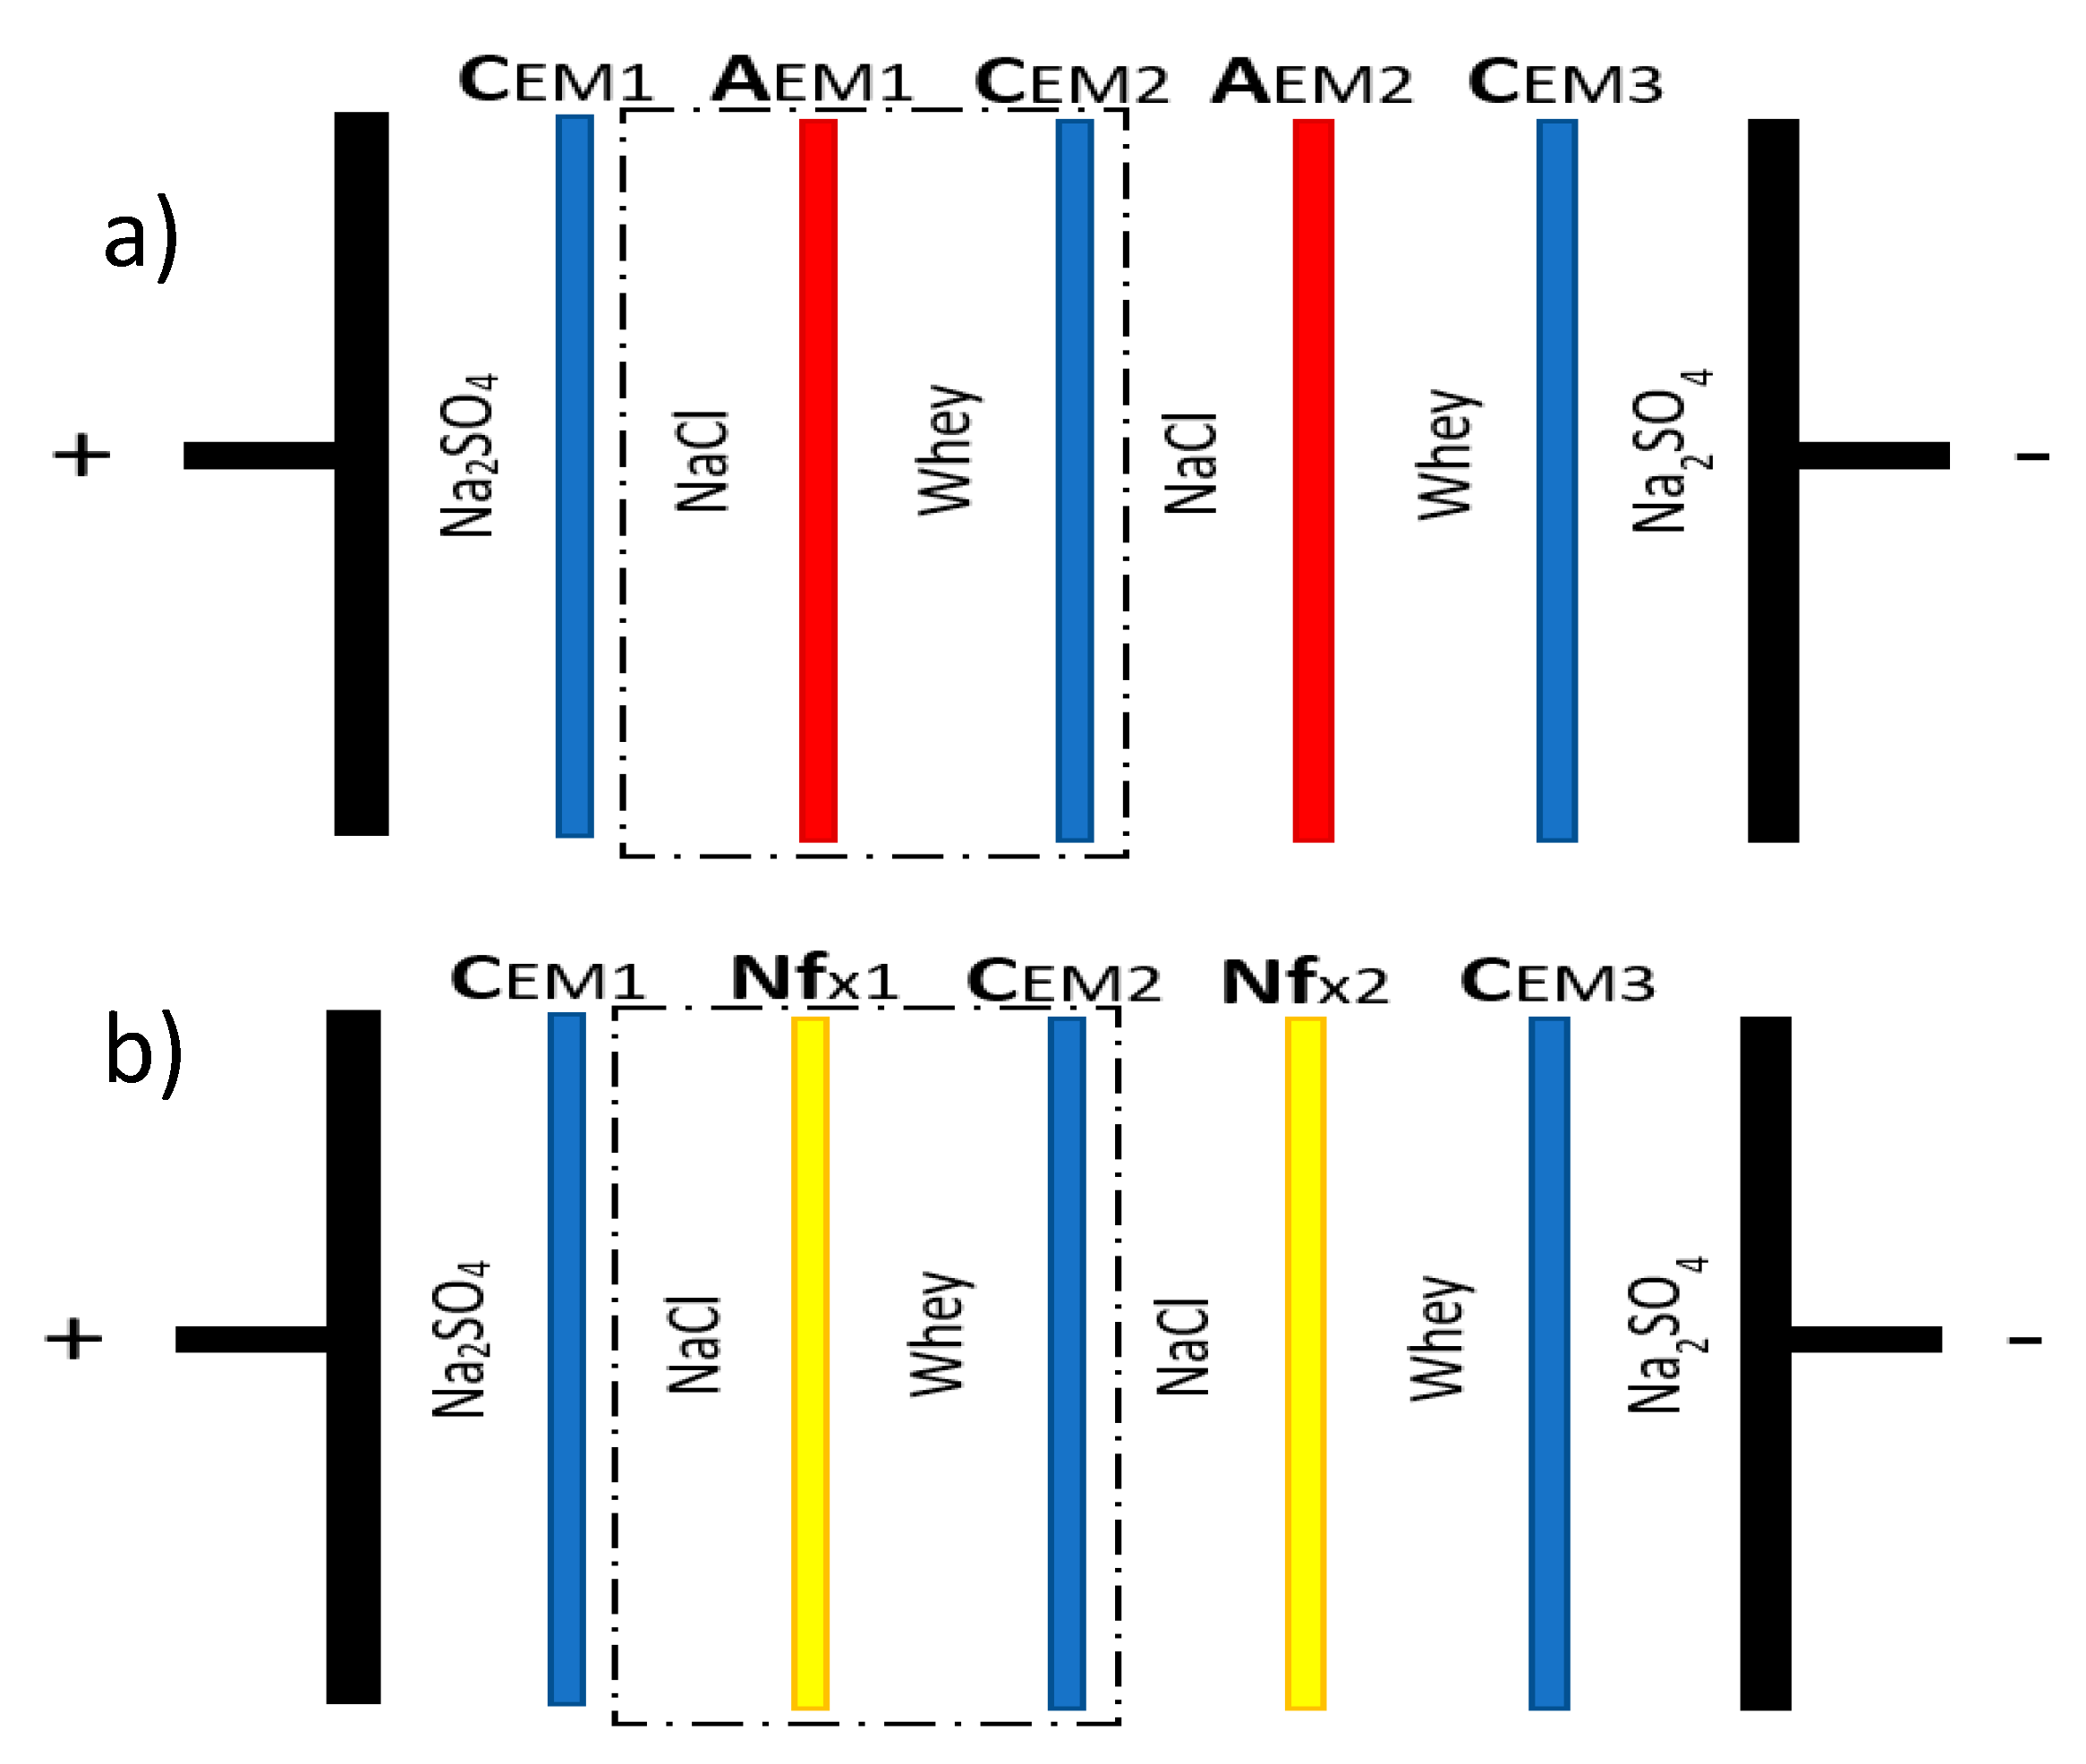
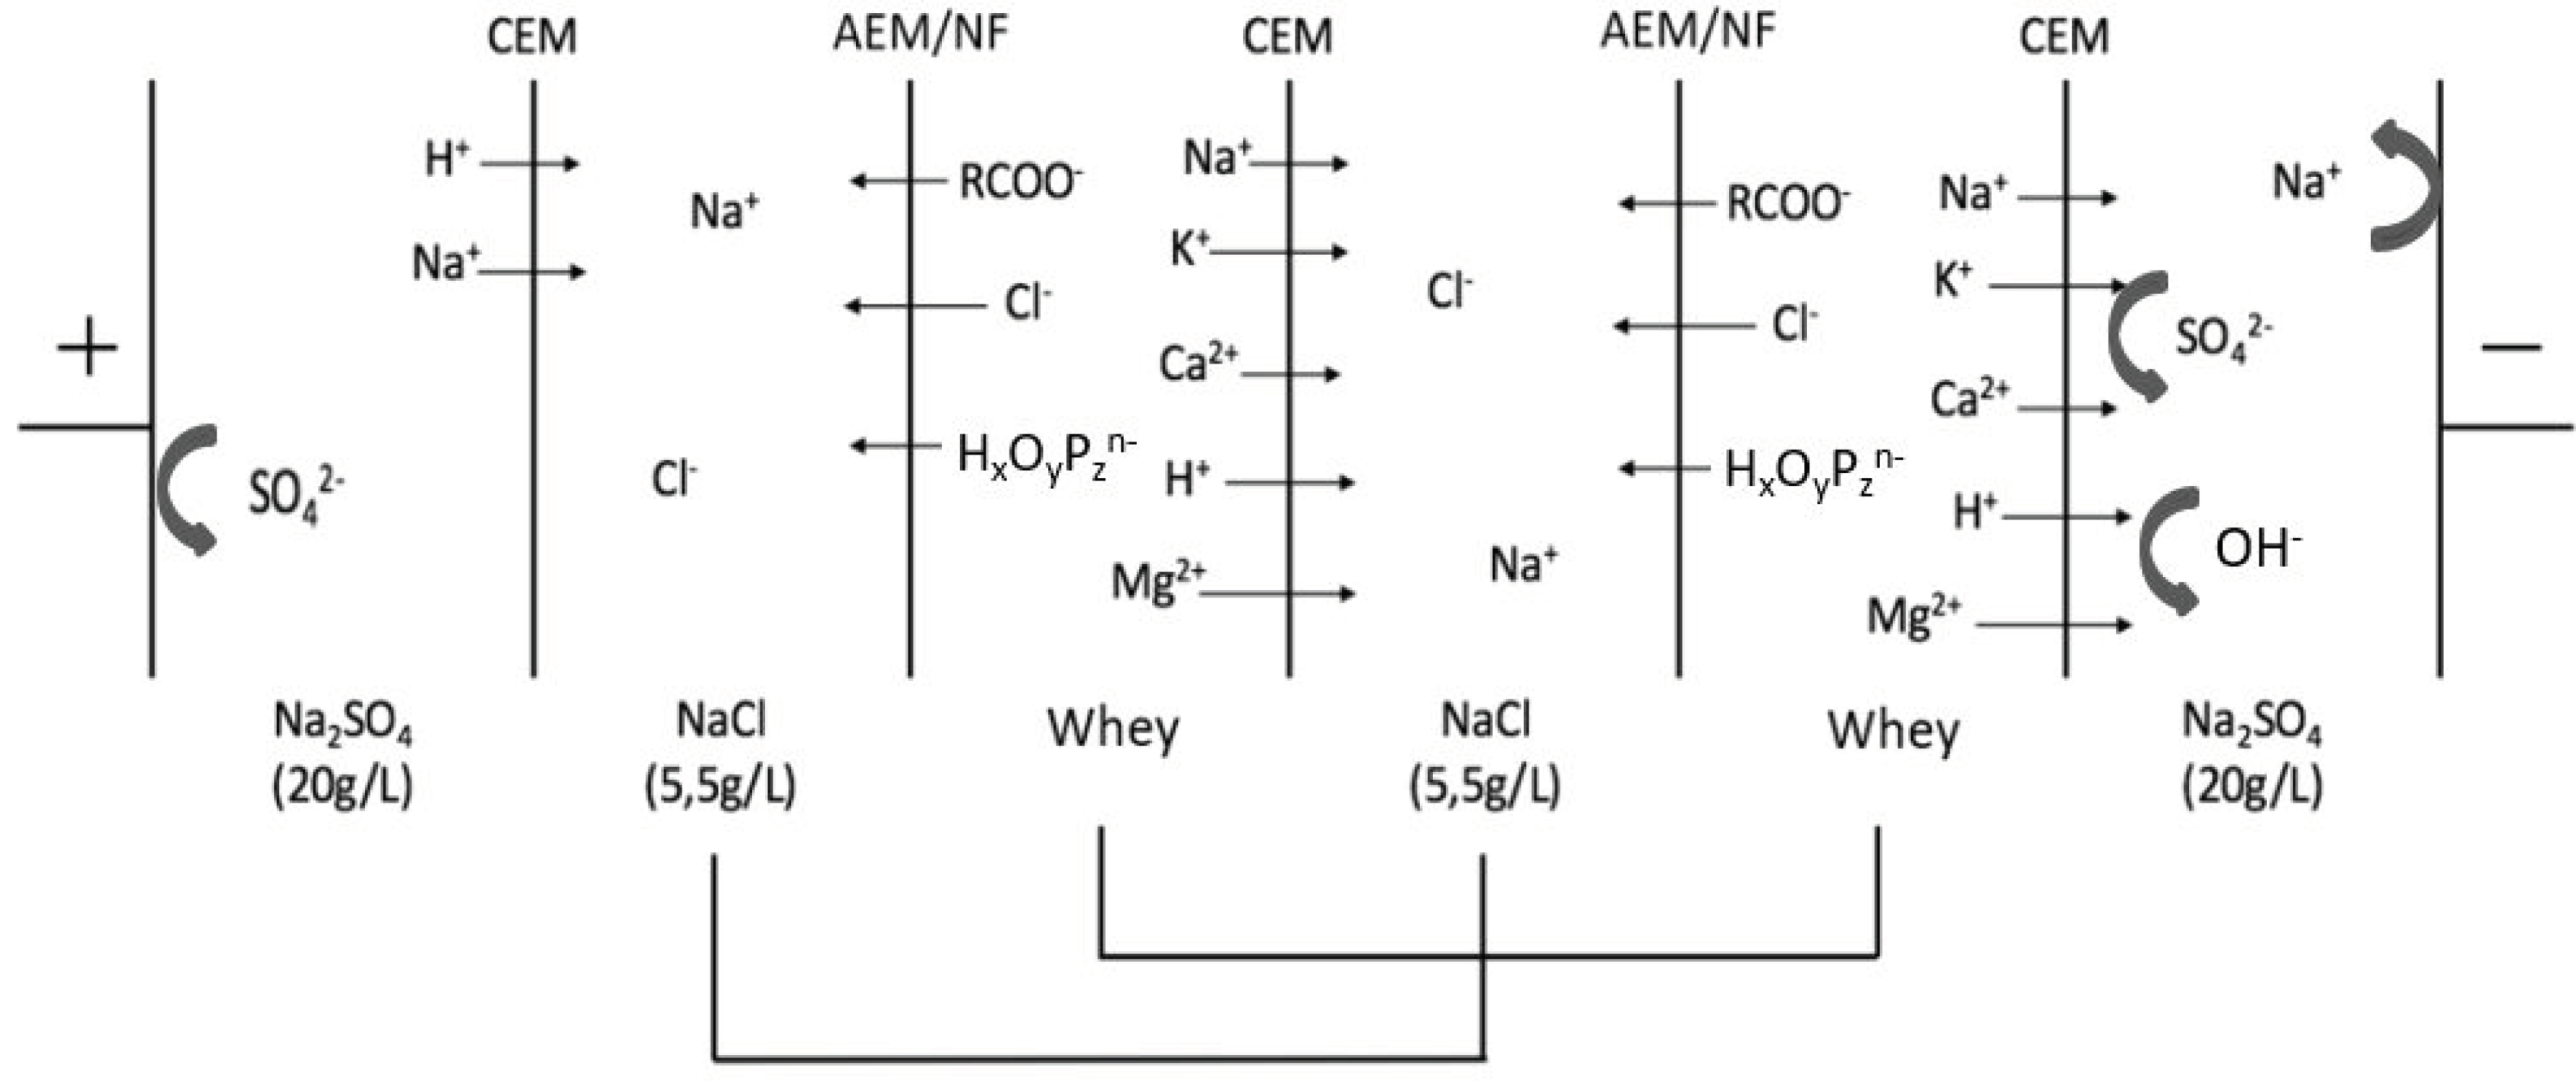
2.2. Electrodialysis Cell
2.3. Protocol
2.4. Analysis Methods
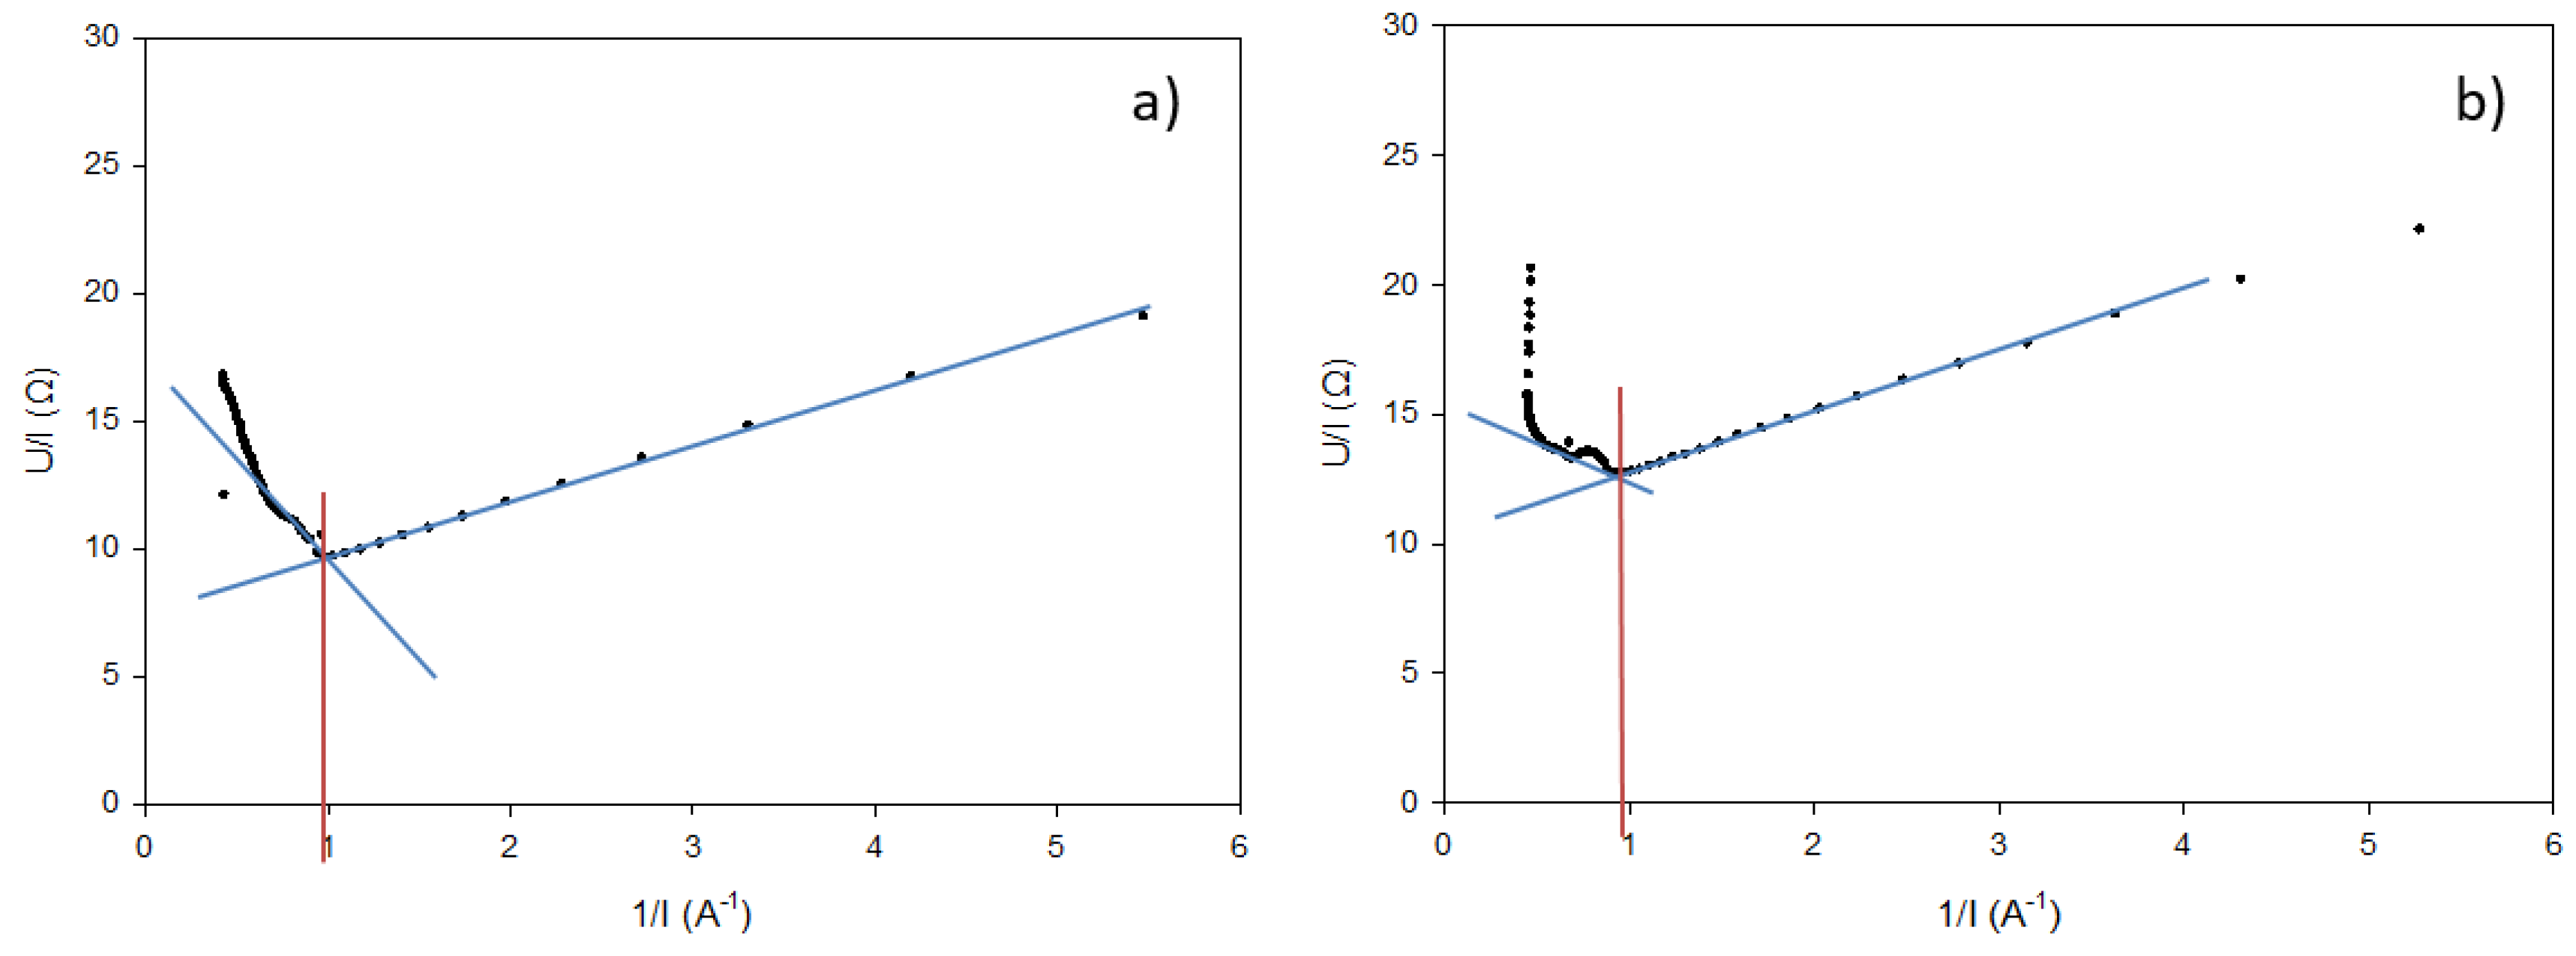
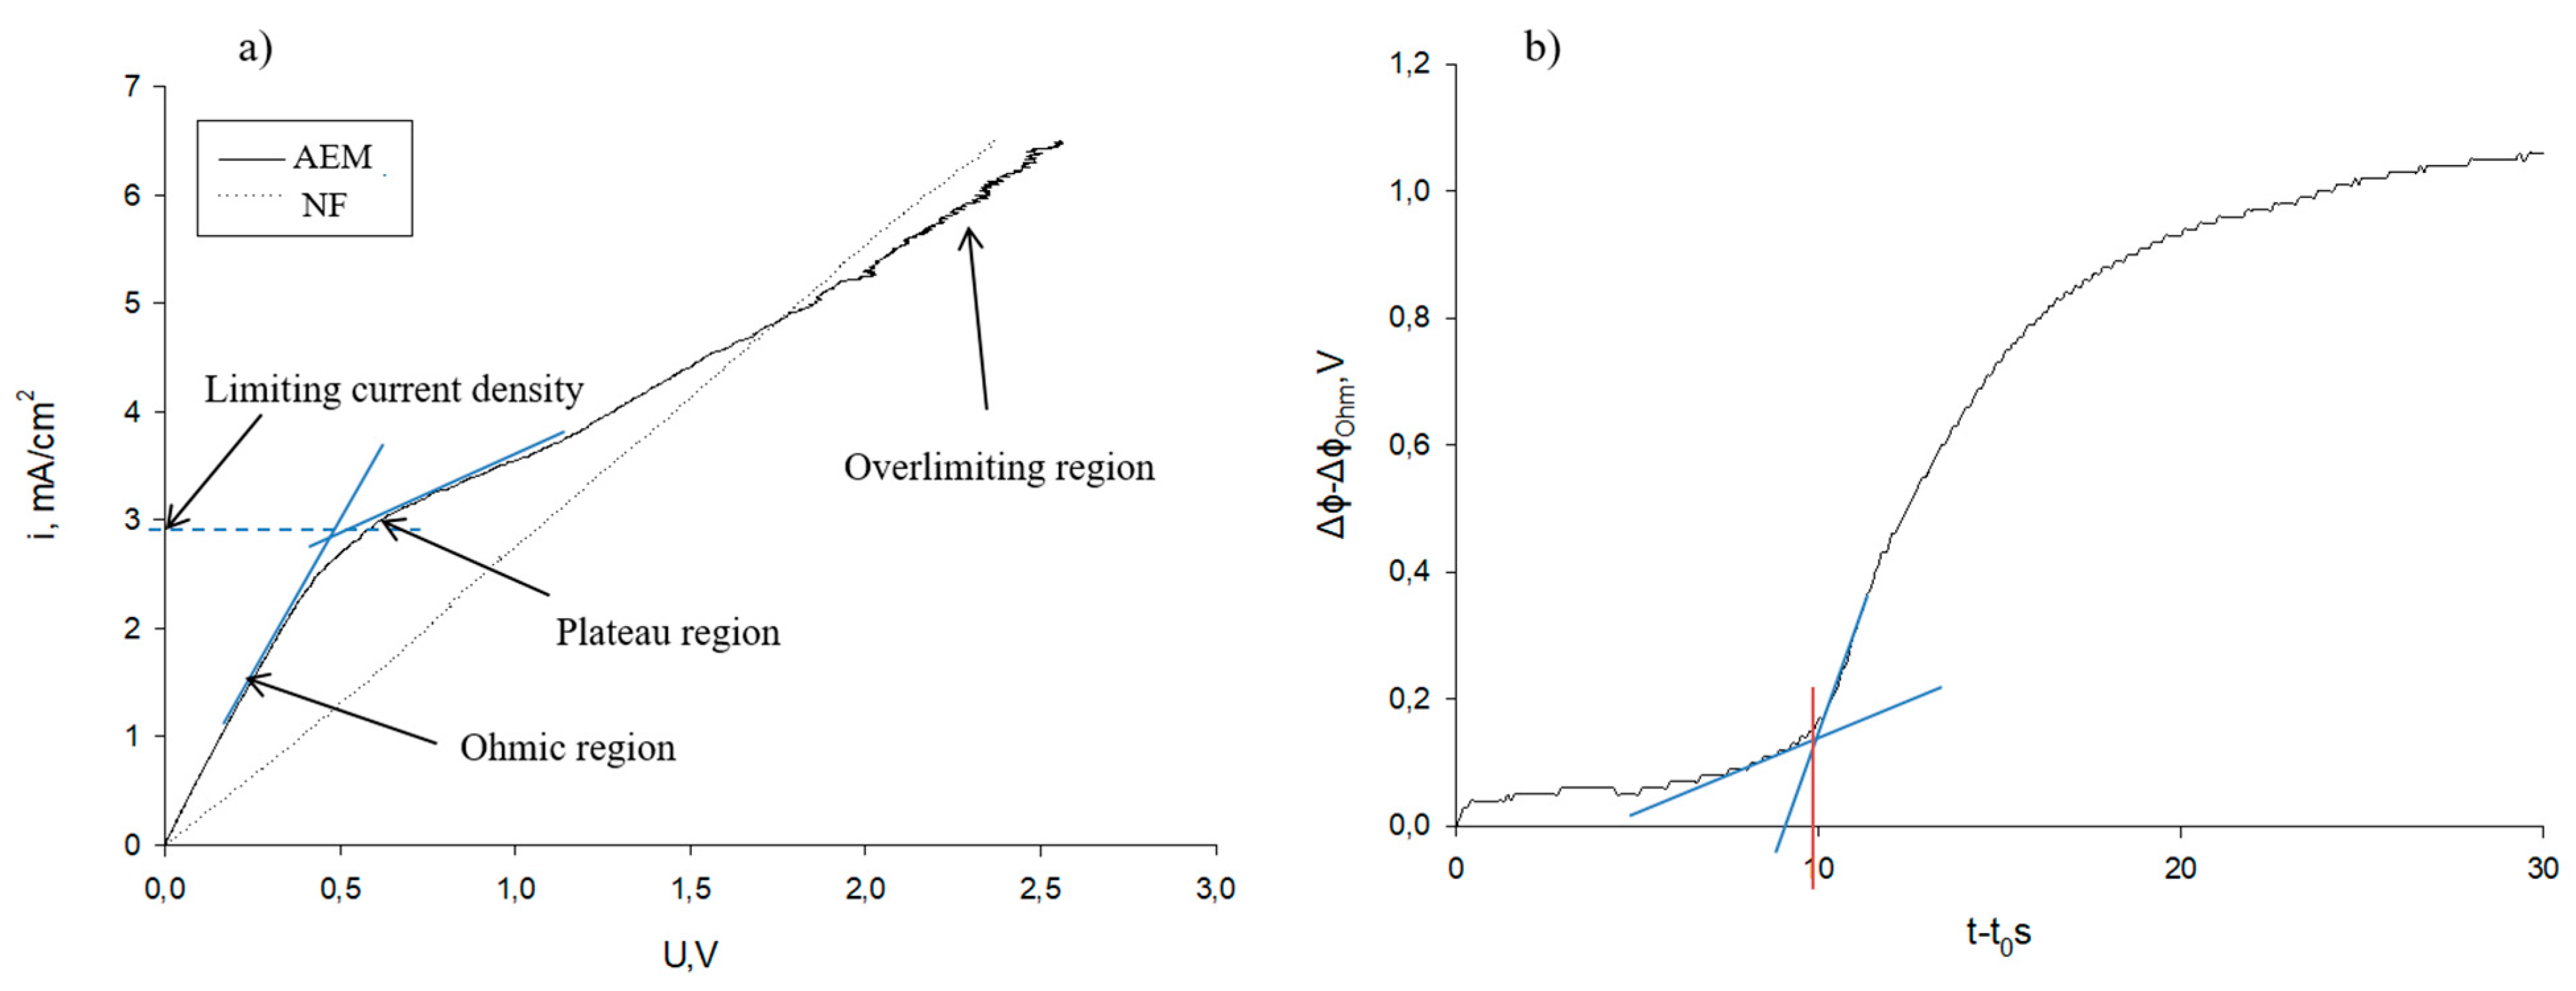
2.4.1. Membrane Electrochemical Characteristics
2.4.2. pH
2.4.3. Lactic Acid and Lactose Contents
2.4.4. Conductivity
2.4.5. Mineral Content
2.4.6. Overall System Resistance
2.4.7. Energy Consumption
2.5. Statistical Analyses
3. Results and Discussion
3.1. Electrochemical Characterization of Membranes
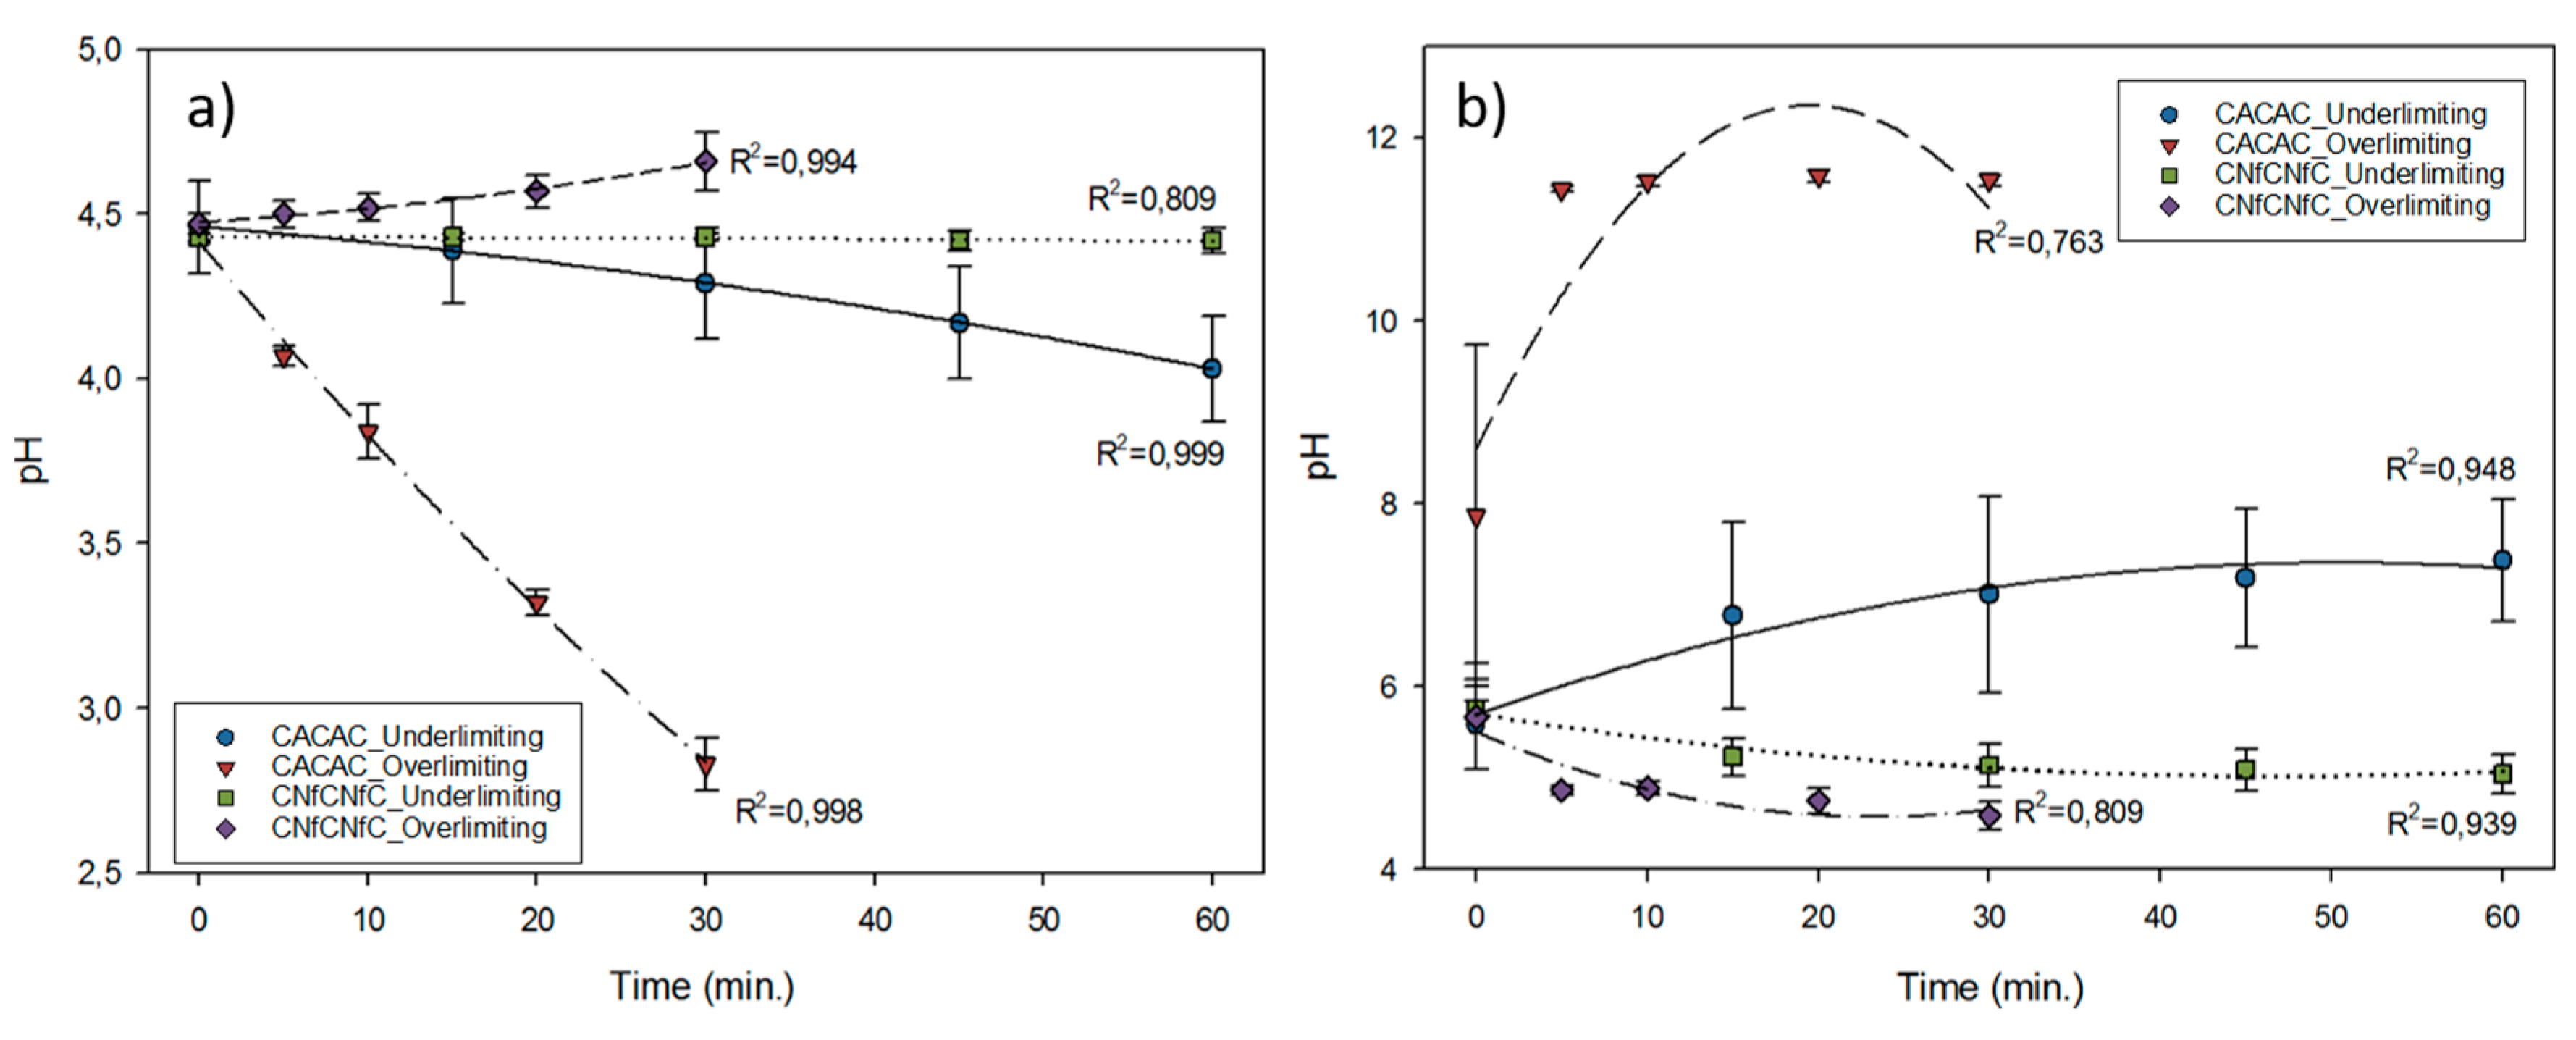
3.2. pH Evolution
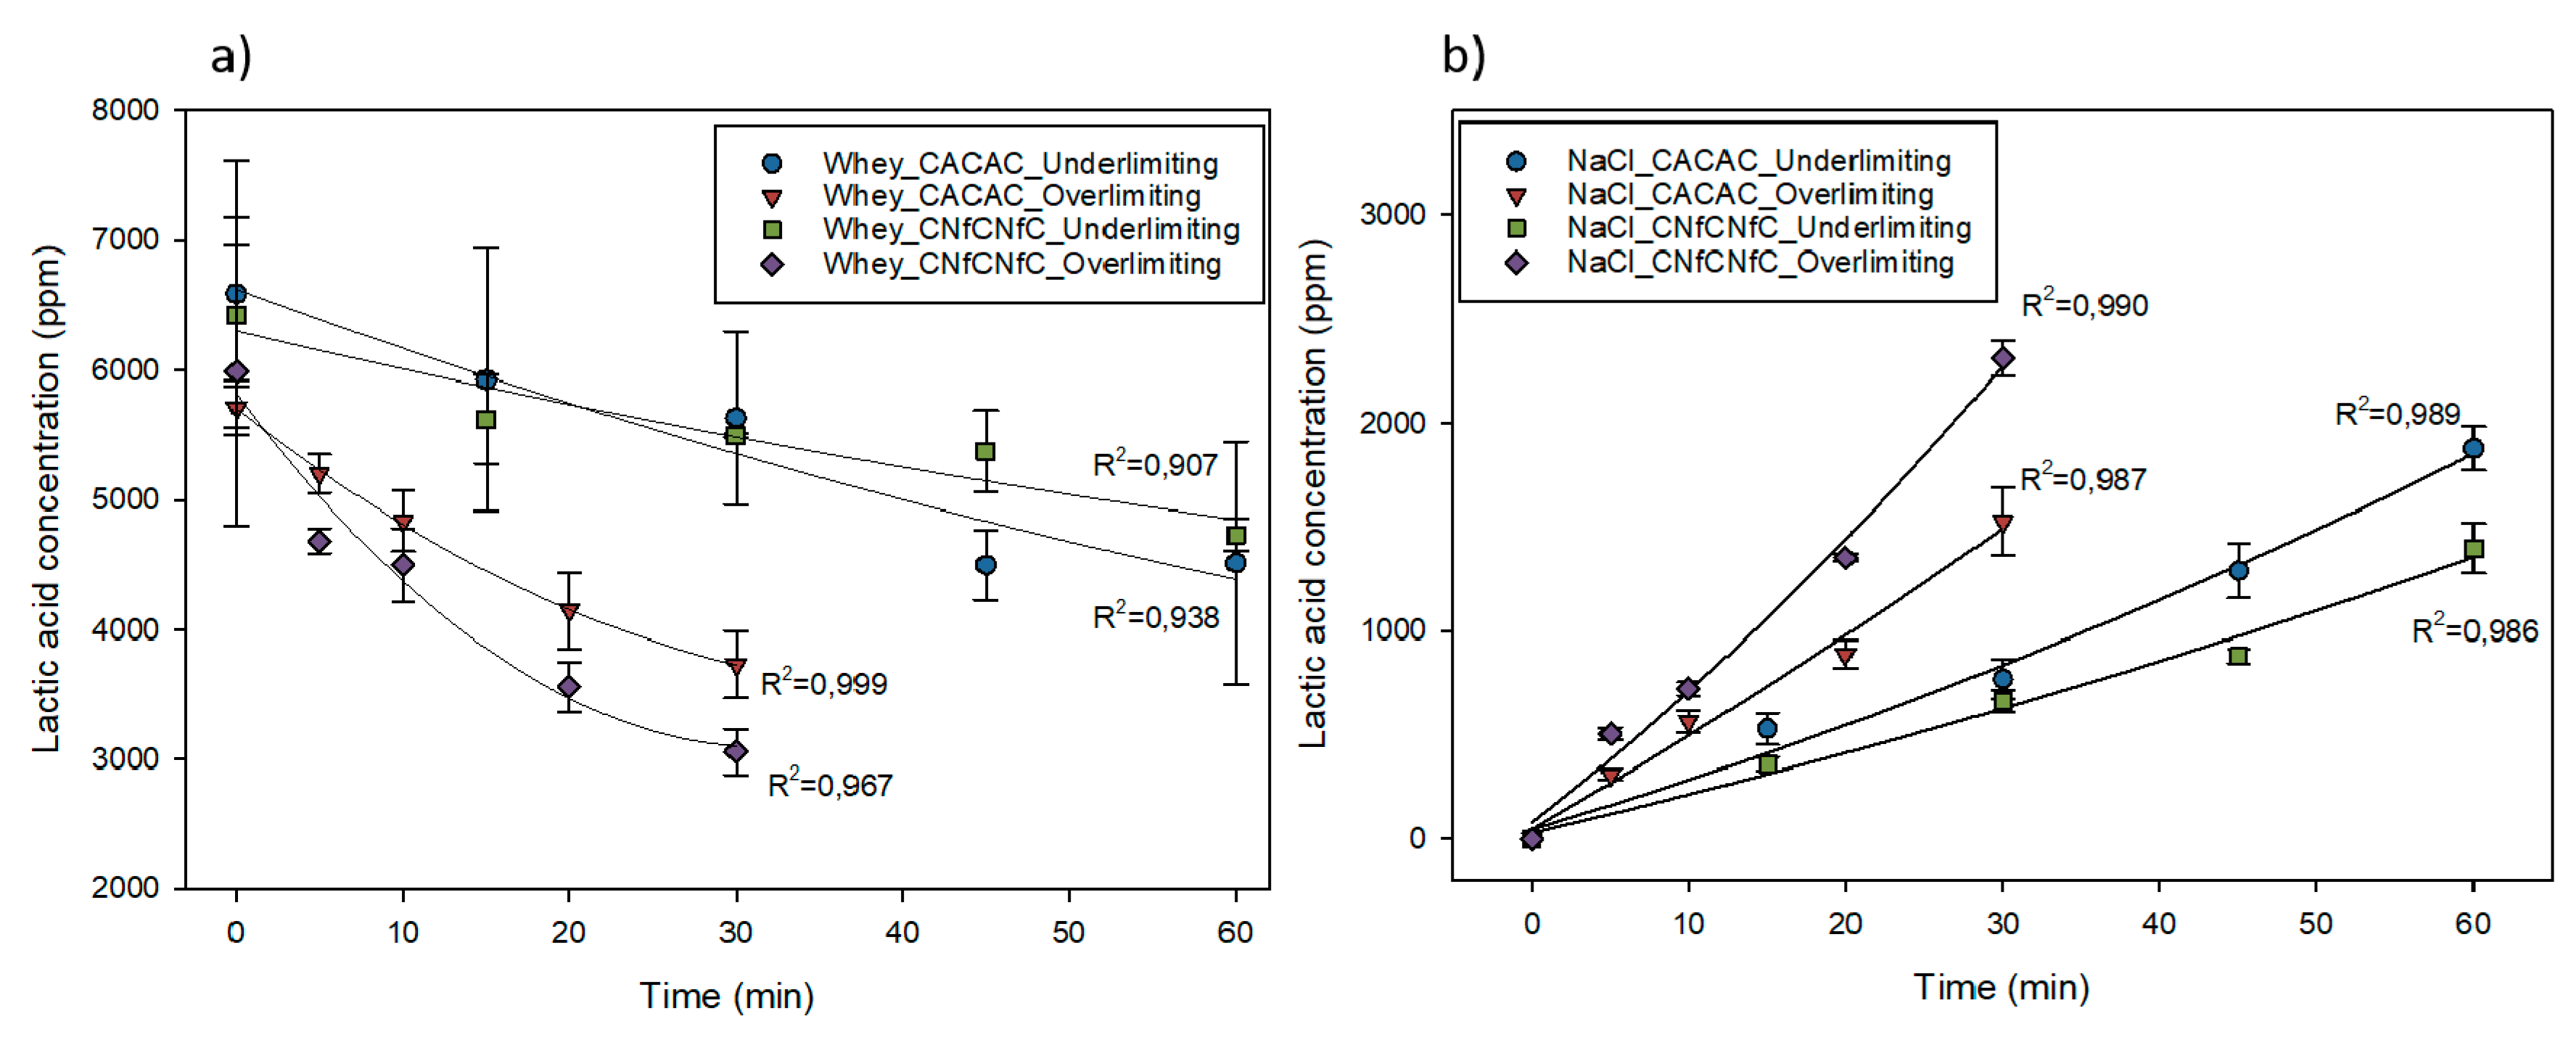
3.3. Deacidification and Lactic Acid Migration
3.4. Lactose Evolution
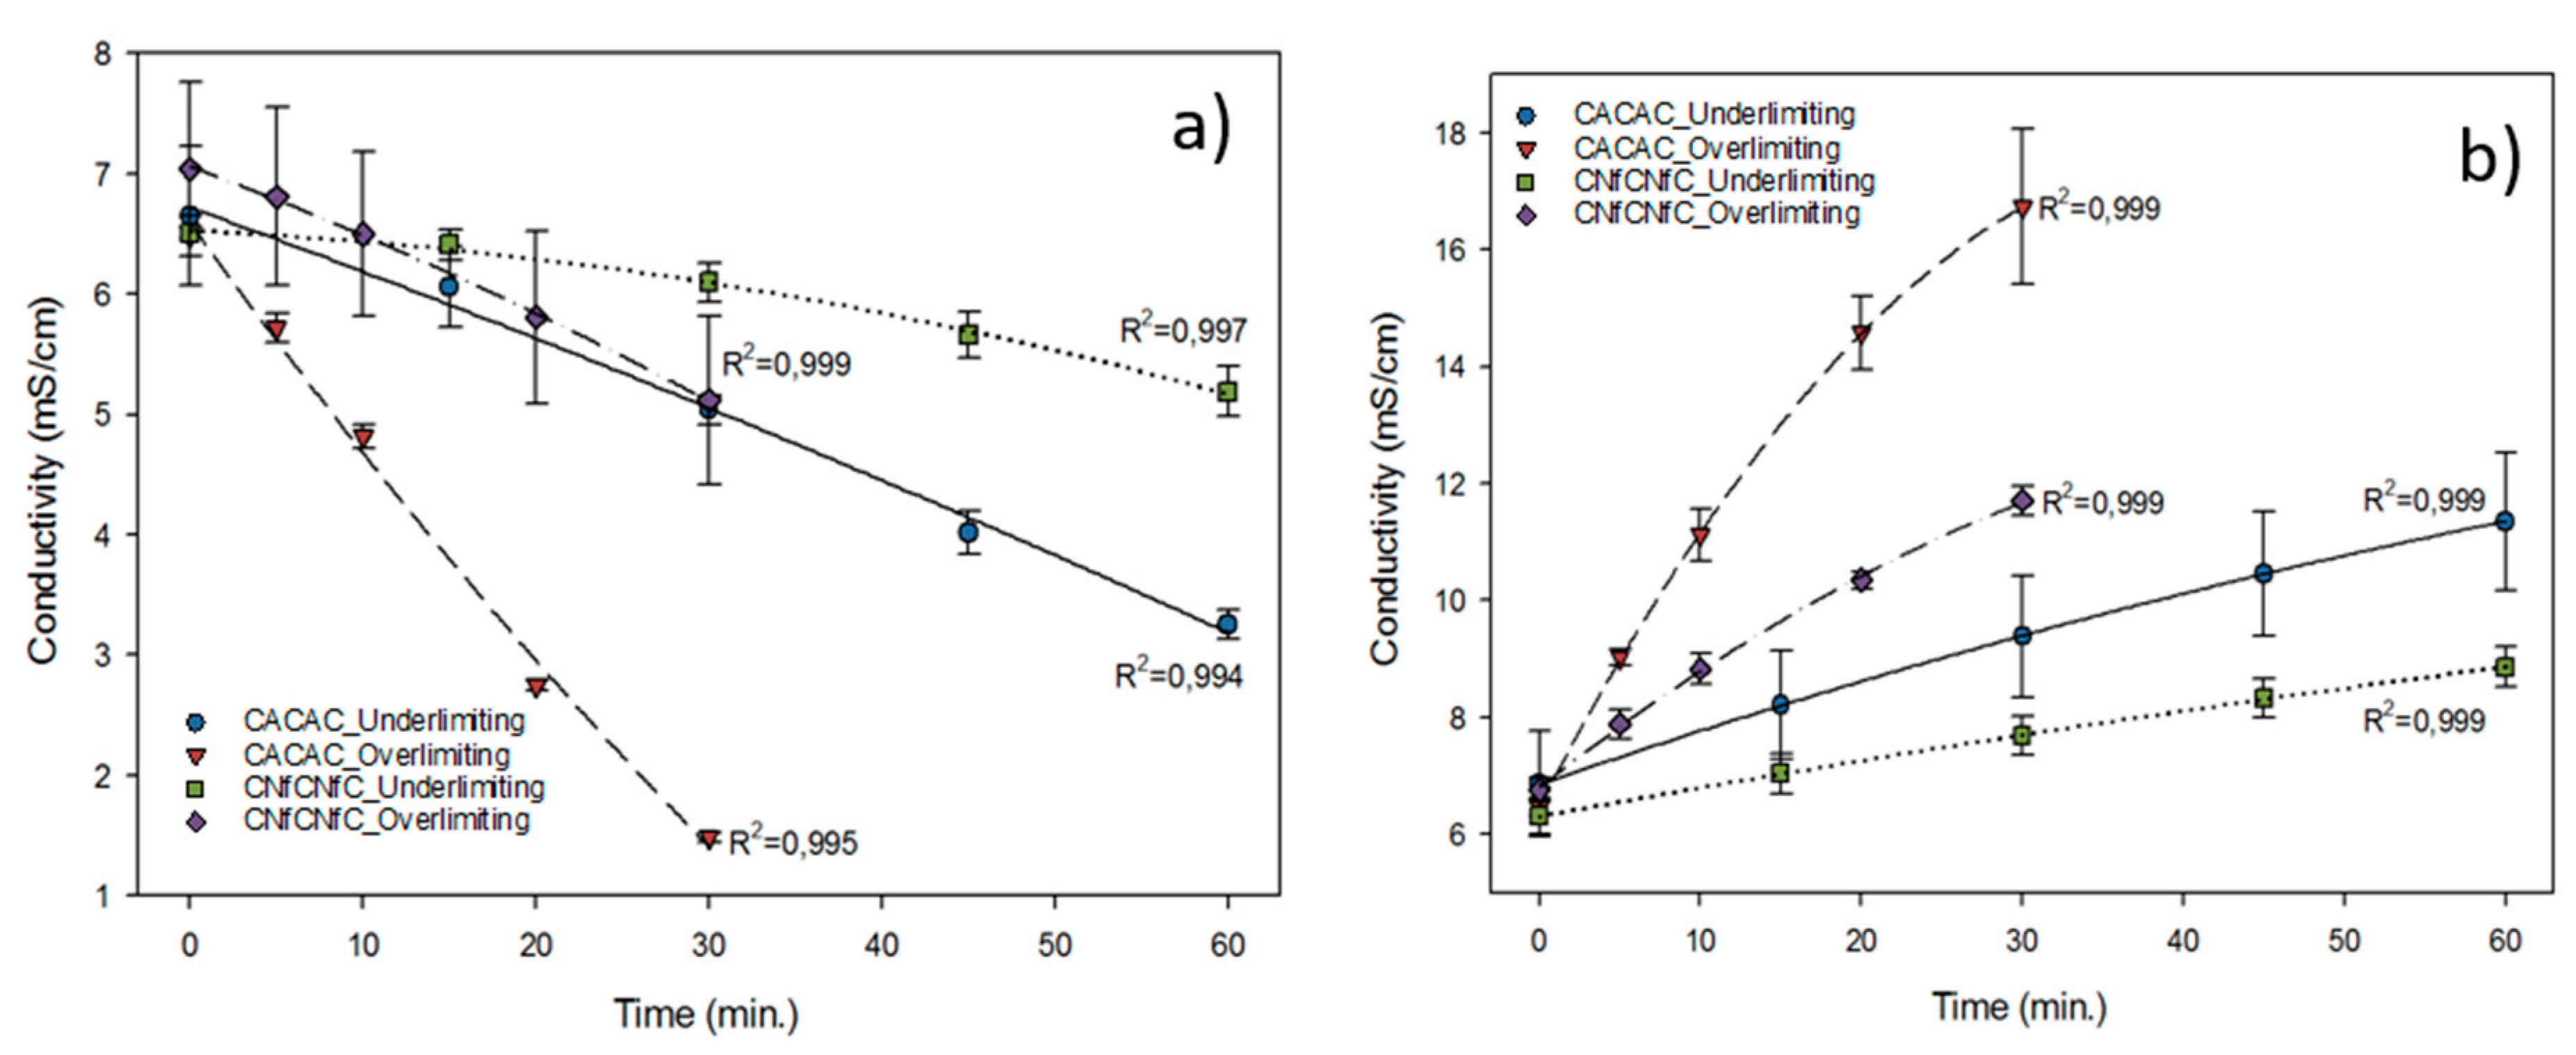
3.5. Conductivity Evolution and Demineralisation
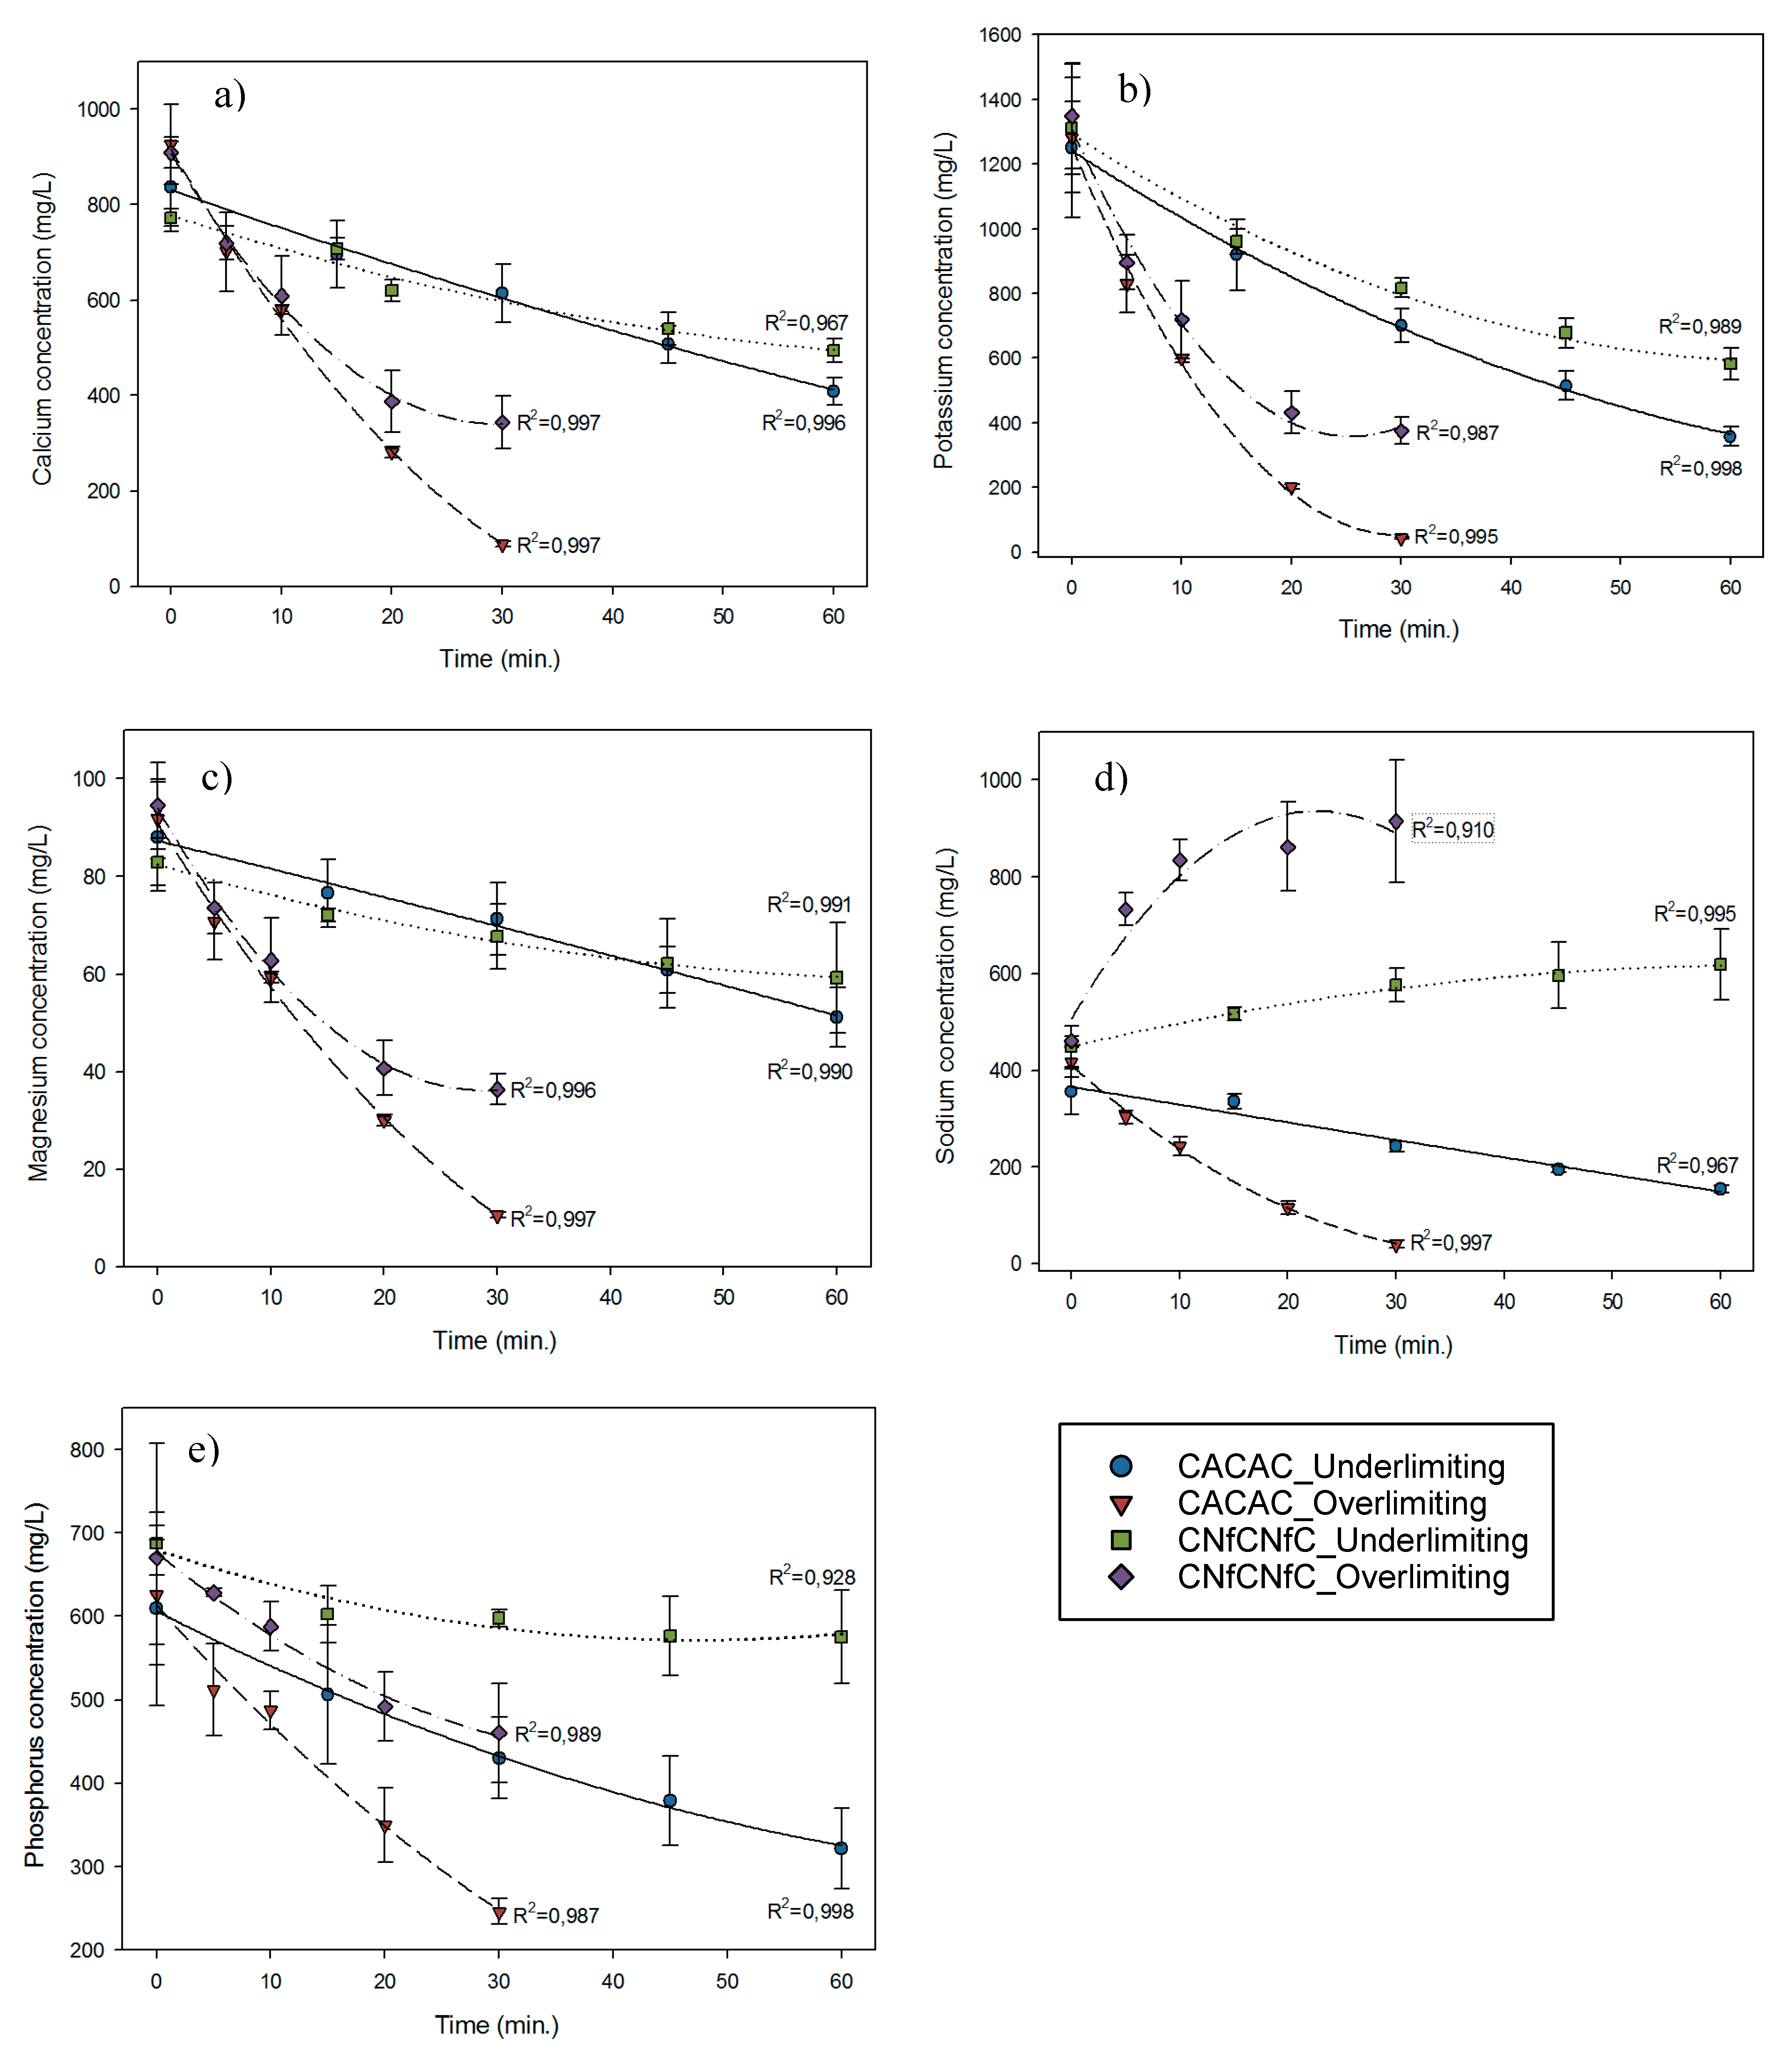
3.6. Ion Migration
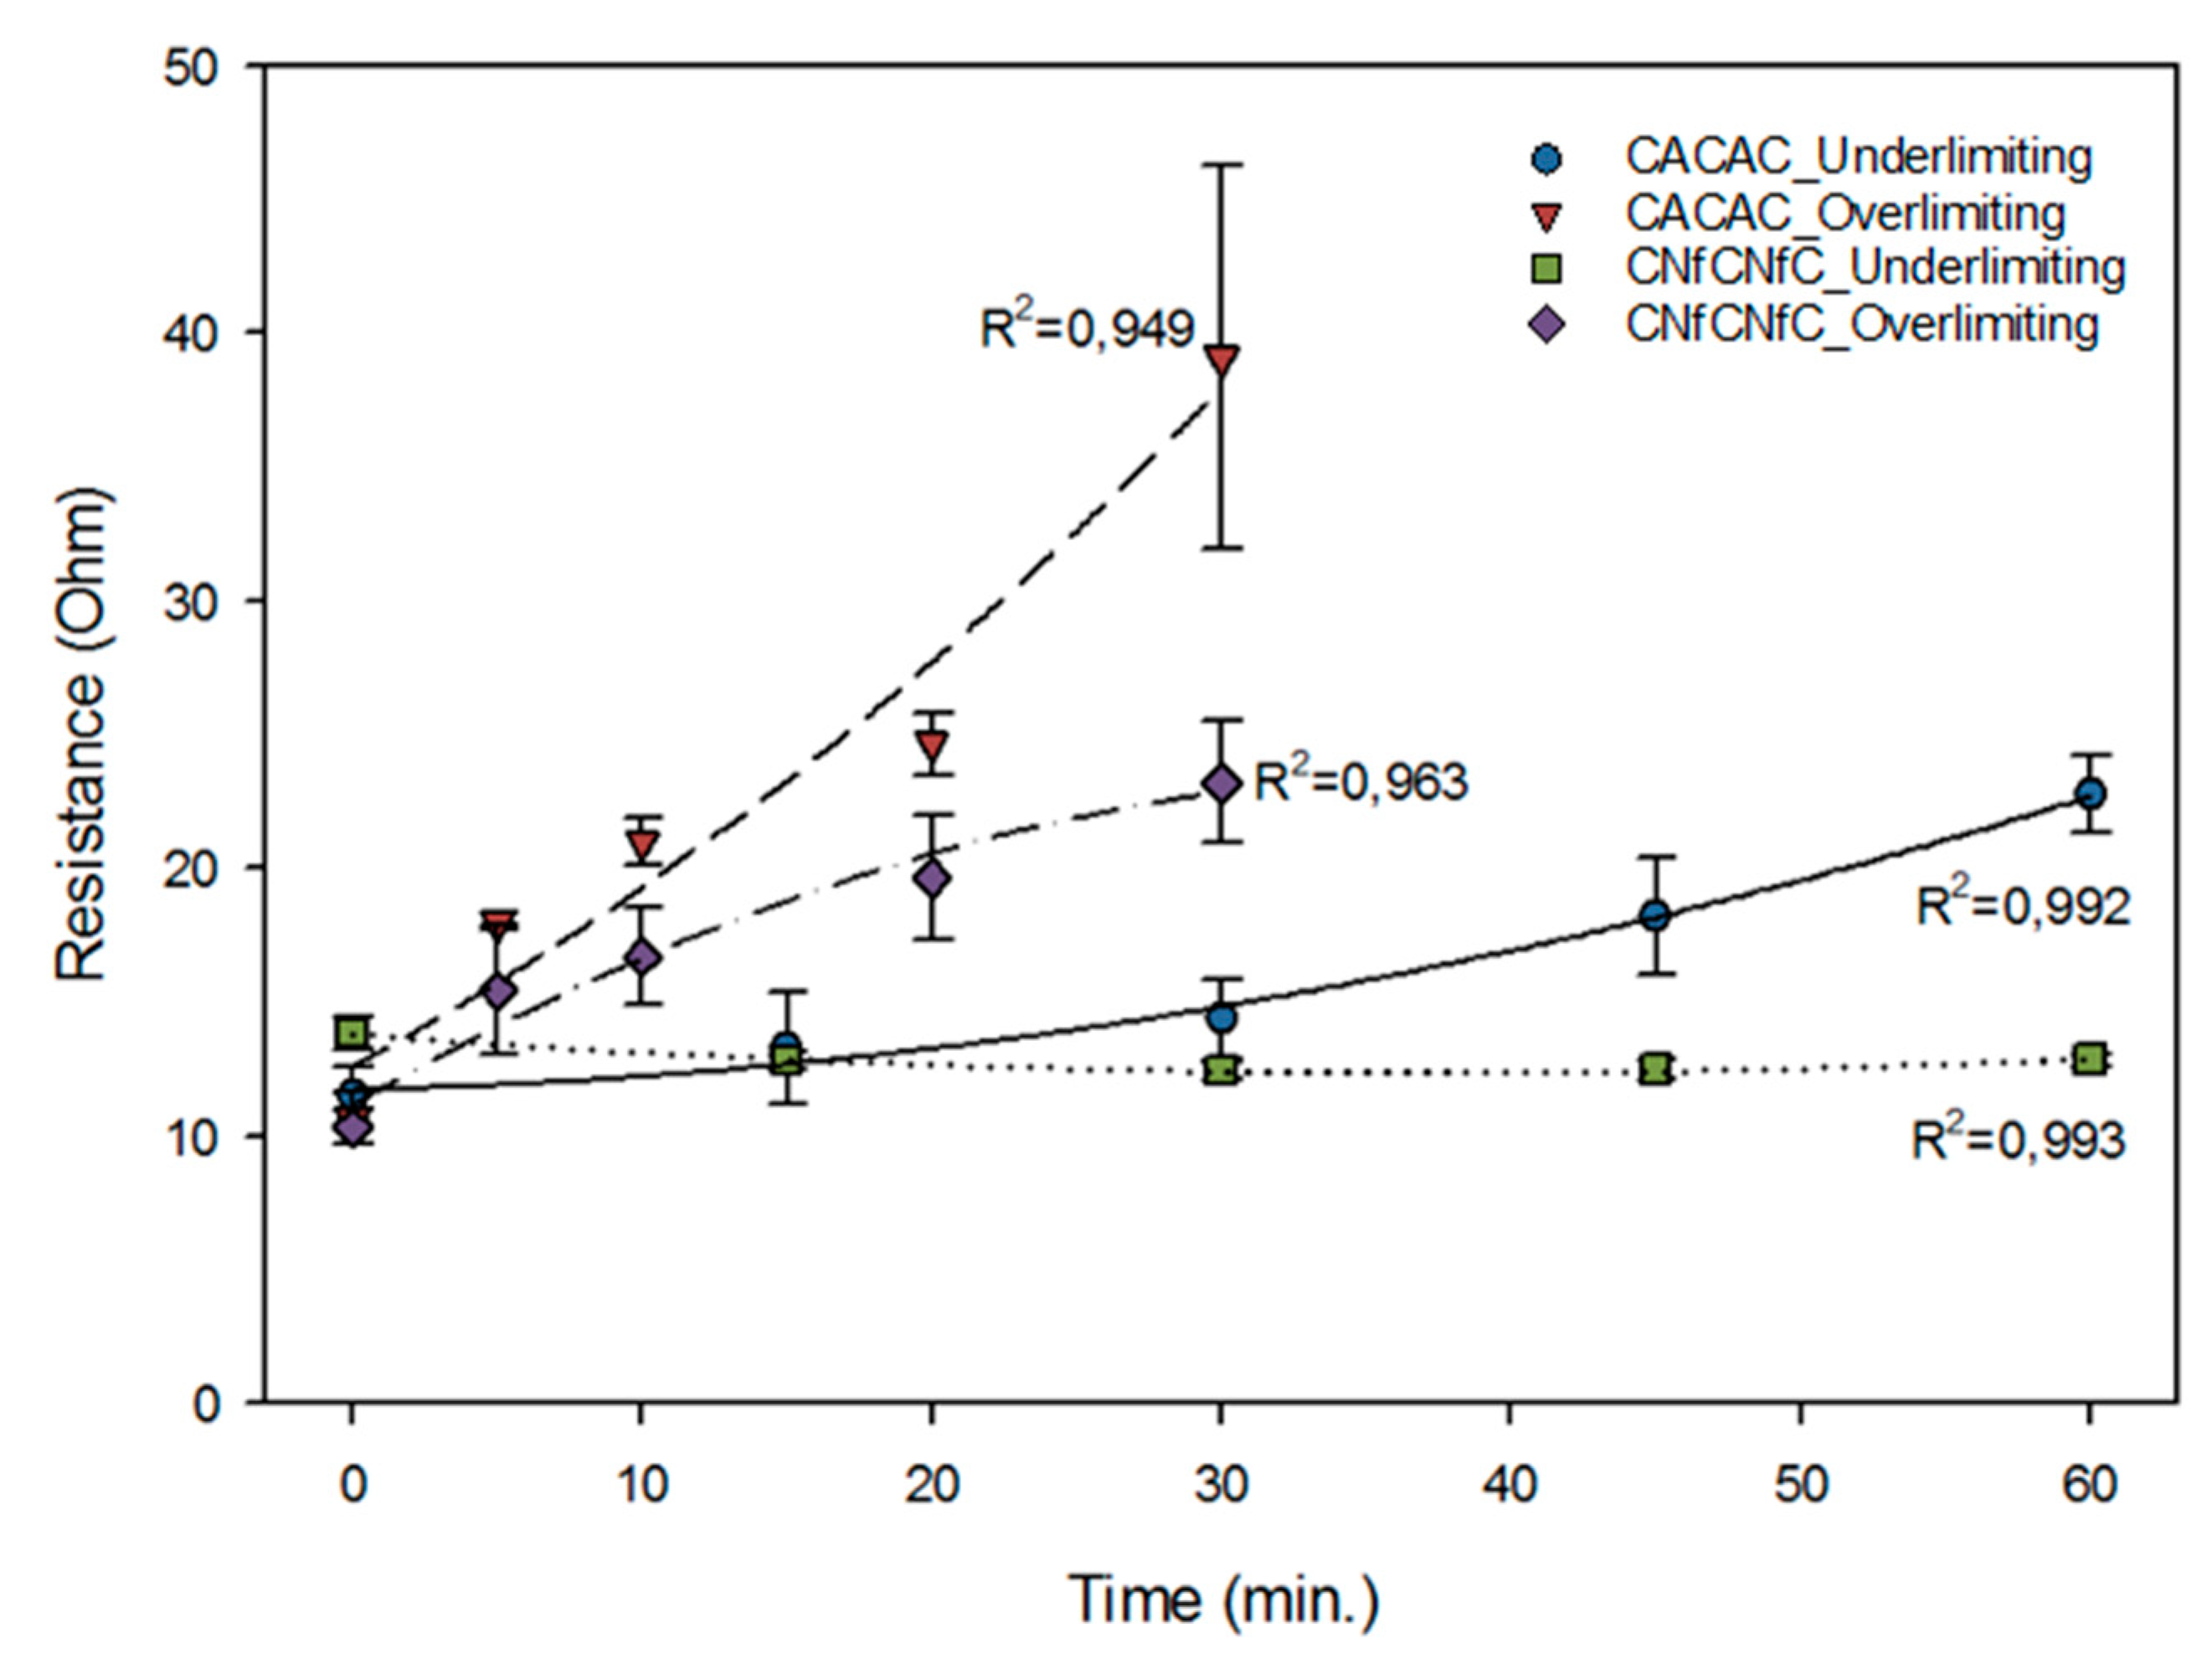
3.7. Overall System Resistance
3.8. Energy Consumption
4. Conclusions
Author Contributions
Funding
Acknowledgments
Conflicts of Interest
Abbreviations
| AEM | anion-exchange membrane |
| CEM | cation-exchange membrane |
| CV | Current-Voltage |
| ED | electrodialysis |
| EDNF | ElectroDialysis with nanofiltration membrane |
| IEM | ion exchange membrane |
| EVs | electroconvective vortices |
| NF | nanofiltration |
References
- Rajeshwari, K.; Balakrishnan, M.; Kansal, A.; Lata, K.; Kishore, V. State-of-the-art of anaerobic digestion technology for industrial wastewater treatment. Renew. Sustain. Energy Rev. 2000, 4, 135–156. [Google Scholar] [CrossRef]
- Prazeres, A.R.; Carvalho, F.; Rivas, J. Cheese whey management: A review. J. Environ. Manag. 2012, 110, 48–68. [Google Scholar] [CrossRef]
- Siso, M.I.G. The biotechnological utilization of cheese whey: A review. Bioresour. Technol. 1996, 57, 1–11. [Google Scholar] [CrossRef]
- Ryan, M.P.; Walsh, G. The biotechnological potential of whey. Rev. Environ. Sci. Bio/Technol. 2016, 15, 479–498. [Google Scholar] [CrossRef]
- Tsakali, E.; Petrotos, K.; D’Allessandro, A.; Goulas, P. A review on whey composition and the methods used for its utulisation for food and pharmaceutical productcs. In Proceedings of the 6th International Conference on Simulation and Modelling Food Bioind, Braganca, Portugal, 24–26 June 2010. [Google Scholar]
- Saffari, M.; Langrish, T. Effect of lactic acid in-process crystallization of lactose/protein powders during spray drying. J. Food Eng. 2014, 137, 88–94. [Google Scholar] [CrossRef]
- Chandrapala, J.; Vasiljevic, T. Properties of spray dried lactose powders influenced by presence of lactic acid and calcium. J. Food Eng. 2017, 198, 63–71. [Google Scholar] [CrossRef]
- Chandrapala, J.; Chen, G.Q.; Kezia, K.; Bowman, E.G.; Vasiljevic, T.; Kentish, S.E. Removal of lactate from acid whey using nanofiltration. J. Food Eng. 2016, 177, 59–64. [Google Scholar] [CrossRef]
- Greiter, M.; Novalin, S.; Wendland, M.; Kulbe, K.-D.; Fischer, J. Desalination of whey by electrodialysis and ion exchange resins: Analysis of both processes with regard to sustainability by calculating their cumulative energy demand. J. Membr. Sci. 2002, 210, 91–102. [Google Scholar] [CrossRef]
- Hoppe, G.K.; Higgins, J.J. Demineralization, in Whey and Lactose Processing; Zadow, J.G., Ed.; Elsevier Applied Science: London, UK, 1992. [Google Scholar]
- Bédas, M.; Tanguy, G.; Dolivet, A.; Méjean, S.; Gaucheron, F.; Garric, G.; Senard, G.; Jeantet, R.; Schuck, P. Nanofiltration of lactic acid whey prior to spray drying: Scaling up to a semi-industrial scale. LWT-Food Sci. Technol. 2017, 79, 355–360. [Google Scholar]
- Kelly, P.M.; Kelly, J.; Mehra, R.; Oldfield, D.J.; Raggett, E.; O’Kennedy, B.T. Implementation of integrated membrane processes for pilot scale development of fractionated milk components. Le Lait 2000, 80, 139–153. [Google Scholar] [CrossRef]
- Chen, Q.; Xue, C.; Zhang, W.-M.; Song, W.-G.; Wan, L.-J.; Ma, K.-S. Green production of ultrahigh-basicity polyaluminum salts with maximum atomic economy by ultrafiltration and electrodialysis with bipolar membranes. Ind. Eng. Chem. Res. 2014, 53, 13467–13474. [Google Scholar] [CrossRef]
- Mikhaylin, S.; Bazinet, L. Fouling on ion-exchange membranes: Classification, characterization and strategies of prevention and control. Adv. Colloid Interface Sci. 2016, 229, 34–56. [Google Scholar] [CrossRef] [PubMed]
- Balster, J.; Stamatialis, D.F.; Wessling, M. Towards spacer free electrodialysis. J. Membr. Sci. 2009, 341, 131–138. [Google Scholar] [CrossRef]
- Chao, Y.-M.; Liang, T.M. A feasibility study of industrial wastewater recovery using electrodialysis reversal. Desalination 2008, 221, 433–439. [Google Scholar] [CrossRef]
- Mulyati, S.; Takagi, R.; Fujii, A.; Ohmukai, Y.; Matsuyama, H. Simultaneous improvement of the monovalent anion selectivity and antifouling properties of an anion exchange membrane in an electrodialysis process, using polyelectrolyte multilayer deposition. J. Membr. Sci. 2013, 431, 113–120. [Google Scholar] [CrossRef]
- Lee, H.J.; Moon, S.H. Enhancement of electrodialysis performances using pulsing electric fields during extended period operation. J. Colloid Interface Sci. 2005, 287, 597–603. [Google Scholar] [CrossRef]
- Nikonenko, V.V.; Kovalenko, A.V.; Urtenov, M.K.; Pismenskaya, N.D.; Han, J.; Sistat, P.; Pourcelly, G. Desalination at overlimiting currents: State-of-the-art and perspectives. Desalination 2014, 342, 85–106. [Google Scholar] [CrossRef]
- Barros, K.S.; Scarazzato, T.; Pérez-Herranz, V.; Espinosa, D.C.R. Treatment of Cyanide-Free Wastewater from Brass Electrodeposition with EDTA by Electrodialysis: Evaluation of Underlimiting and Overlimiting Operations. Membranes 2020, 10, 69. [Google Scholar] [CrossRef]
- Bukhovets, A.; Eliseeva, T.; Dalthrope, N.; Oren, Y. The influence of current density on the electrochemical properties of anion-exchange membranes in electrodialysis of phenylalanine solution. Electrochim. Acta 2011, 56, 10283–10287. [Google Scholar] [CrossRef]
- Mikhaylin, S.; Nikonenko, V.; Pismenskaya, N.; Pourcelly, G.; Choi, S.; Kwon, H.J.; Han, J.; Bazinet, L. How physico-chemical and surface properties of cation-exchange membrane affect membrane scaling and electroconvective vortices: Influence on performance of electrodialysis with pulsed electric field. Desalination 2016, 393, 102–114. [Google Scholar] [CrossRef]
- Persico, M.; Mikhaylin, S.; Doyen, A.; Firdaous, L.; Nikonenko, V.; Pismenskaya, N.; Bazinet, L. Prevention of peptide fouling on ion-exchange membranes during electrodialysis in overlimiting conditions. J. Membr. Sci. 2017, 543, 212–221. [Google Scholar] [CrossRef]
- Bazinet, L.; Moalic, M. Coupling of porous filtration and ion-exchange membranes in an electrodialysis stack and impact on cation selectivity: A novel approach for sea water demineralization and the production of physiological water. Desalination 2011, 277, 356–363. [Google Scholar] [CrossRef]
- Ge, L.; Wu, B.; Li, Q.; Wang, Y.; Yu, D.; Wu, L.; Pan, J.; Miao, J.; Xu, T. Electrodialysis with nanofiltration membrane (EDNF) for high-efficiency cations fractionation. J. Membr. Sci. 2016, 498, 192–200. [Google Scholar] [CrossRef]
- Chen, G.Q.; Eschbach, F.I.I.; Weeks, M.; Gras, S.L.; Kentish, S.E. Removal of lactic acid from acid whey using electrodialysis. Sep. Purif. Technol. 2016, 158, 230–237. [Google Scholar] [CrossRef]
- Dufton, G.; Mikhaylin, S.; Gaaloul, S.; Bazinet, L. How electrodialysis configuration influences acid whey deacidification and membrane scaling. J. Dairy Sci. 2018, 101, 7833–7850. [Google Scholar] [CrossRef] [PubMed]
- Cowan, D.A.; Brown, J.H. Effect of turbulence on limiting current in electrodialysis cells. Ind. Eng. Chem. 1959, 51, 1445–1448. [Google Scholar] [CrossRef]
- Villeneuve, W.; Perreault, V.; Chevallier, P.; Mikhaylin, S.; Bazinet, L. Use of cation-coated filtration membranes for demineralization by electrodialysis. Sep. Purif. Technol. 2019, 218, 70–80. [Google Scholar] [CrossRef]
- Lemay, N.; Mikhaylin, S.; Mareev, S.; Pismenskaya, N.; Nikonenko, V.; Bazinet, L. How demineralization duration by electrodialysis under high frequency pulsed electric field can be the same as in continuous current condition and that for better performances? J. Membr. Sci. 2020, 603, 117878. [Google Scholar] [CrossRef]
- Melnikova, E.; Pismenskaya, N.; Bazinet, L.; Mikhaylin, S.; Nikonenko, V. Effect of ampholyte nature on current-voltage characteristic of anion-exchange membrane. Electrochim. Acta 2018, 285, 185–191. [Google Scholar] [CrossRef]
- Nikonenko, V.; Zabolotskii, V.; Gnusin, N. Effect of stationary external electric-fields on ion-exchange membrane selectivity. Sov. Electrochem. 1980, 16, 472–479. [Google Scholar]
- Nikonenko, V.V.; Pismenskaya, N.D.; Belova, E.I.; Sistat, P.; Huguet, P.; Pourcelly, G.; Larchet, C. Intensive current transfer in membrane systems: Modelling, mechanisms and application in electrodialysis. Adv. Colloid Interface Sci. 2010, 160, 101–123. [Google Scholar] [CrossRef] [PubMed]
- Lemay, N.; Mikhaylin, S.; Bazinet, L. Voltage spike and electroconvective vortices generation during electrodialysis under pulsed electric field: Impact on demineralization process efficiency and energy consumption. Innov. Food Sci. Emerg. Technol. 2019, 52, 221–231. [Google Scholar] [CrossRef]
- Dufton, G.; Mikhaylin, S.; Gaaloul, S.; Bazinet, L. Positive impact of pulsed electric field on lactic acid removal, demineralization and membrane scaling during acid whey electrodialysis. Int. J. Mol. Sci. 2019, 20, 797. [Google Scholar] [CrossRef] [PubMed]
- Rautenbach, R.; Gröschl, A. Separation potential of nanofiltration membranes. Desalination 1990, 77, 73–84. [Google Scholar] [CrossRef]
- Cuartas-Uribe, B.; Alcaina-Miranda, M.; Soriano-Costa, E.; Mendoza-Roca, J.; Iborra-Clar, M.; Lora-García, J. A study of the separation of lactose from whey ultrafiltration permeate using nanofiltration. Desalination 2009, 241, 244–255. [Google Scholar] [CrossRef]
- Serre, E.; Rozoy, E.; Pedneault, K.; Lacour, S.; Bazinet, L. Deacidification of cranberry juice by electrodialysis: Impact of membrane types and configurations on acid migration and juice physicochemical characteristics. Sep. Purif. Technol. 2016, 163, 228–237. [Google Scholar] [CrossRef]
- Talebi, S.; Suarez, F.; Chen, G.Q.; Chen, X.; Bathurst, K.; Kentish, S.E. Pilot Study on the Removal of Lactic Acid and Minerals from Acid Whey Using Membrane Technology. ACS Sustain. Chem. Eng. 2020, 8, 2742–2752. [Google Scholar] [CrossRef]
- Salaün, F.; Mietton, B.; Gaucheron, F. Buffering capacity of dairy products. Int. Dairy J. 2005, 15, 95–109. [Google Scholar] [CrossRef]
- Dufton, G.; Mikhaylin, S.; Gaaloul, S.; Bazinet, L. Systematic Study of the Impact of Pulsed Electric Field Parameters (Pulse/Pause Duration and Frequency) on ED Performances during Acid Whey Treatment. Membranes 2020, 10, 14. [Google Scholar] [CrossRef]
- Lin Teng Shee, F.; Angers, P.; Bazinet, L. Relationship between electrical conductivity and demineralization rate during electroacidification of cheddar cheese whey. J. Membr. Sci. 2005, 262, 100–106. [Google Scholar] [CrossRef]
- Xu, X.; He, Q.; Ma, G.; Wang, H.; Nirmalakhandan, N.; Xu, P. Selective separation of mono-and di-valent cations in electrodialysis during brackish water desalination: Bench and pilot-scale studies. Desalination 2018, 428, 146–160. [Google Scholar] [CrossRef]
- Kim, Y.; Walker, W.S.; Lawler, D.F. Competitive separation of di-vs. mono-valent cations in electrodialysis: Effects of the boundary layer properties. Water Res. 2012, 46, 2042–2056. [Google Scholar] [CrossRef] [PubMed]
- Firdaous, L.; Malériat, J.P.; Schlumpf, J.P.; Quéméneur, F. Transfer of Monovalent and Divalent Cations in Salt Solutions by Electrodialysis. Sep. Sci. Technol. 2007, 42, 931–948. [Google Scholar] [CrossRef]


| Analysis | Units | Raw Acid Whey |
|---|---|---|
| Total solid | g/L | 42.50 ± 2.90 |
| Total protein | g/L | 7.15 ± 0.41 |
| Lactose | g/L | 30.48 ± 1.42 |
| Lactic acid | g/L | 6.18 ± 0.40 |
| Ca | g/L | 0.86 ± 0.07 |
| Mg | g/L | 0.09 ± 0.01 |
| Na | g/L | 0.42 ± 0.65 |
| K | g/L | 1.30 ± 0.04 |
| P | g/L | 0.65 ± 0.04 |
| pH | - | 4.45 ± 0.02 |
| Conductivity | mS/cm | 6.54 ± 0.45 |
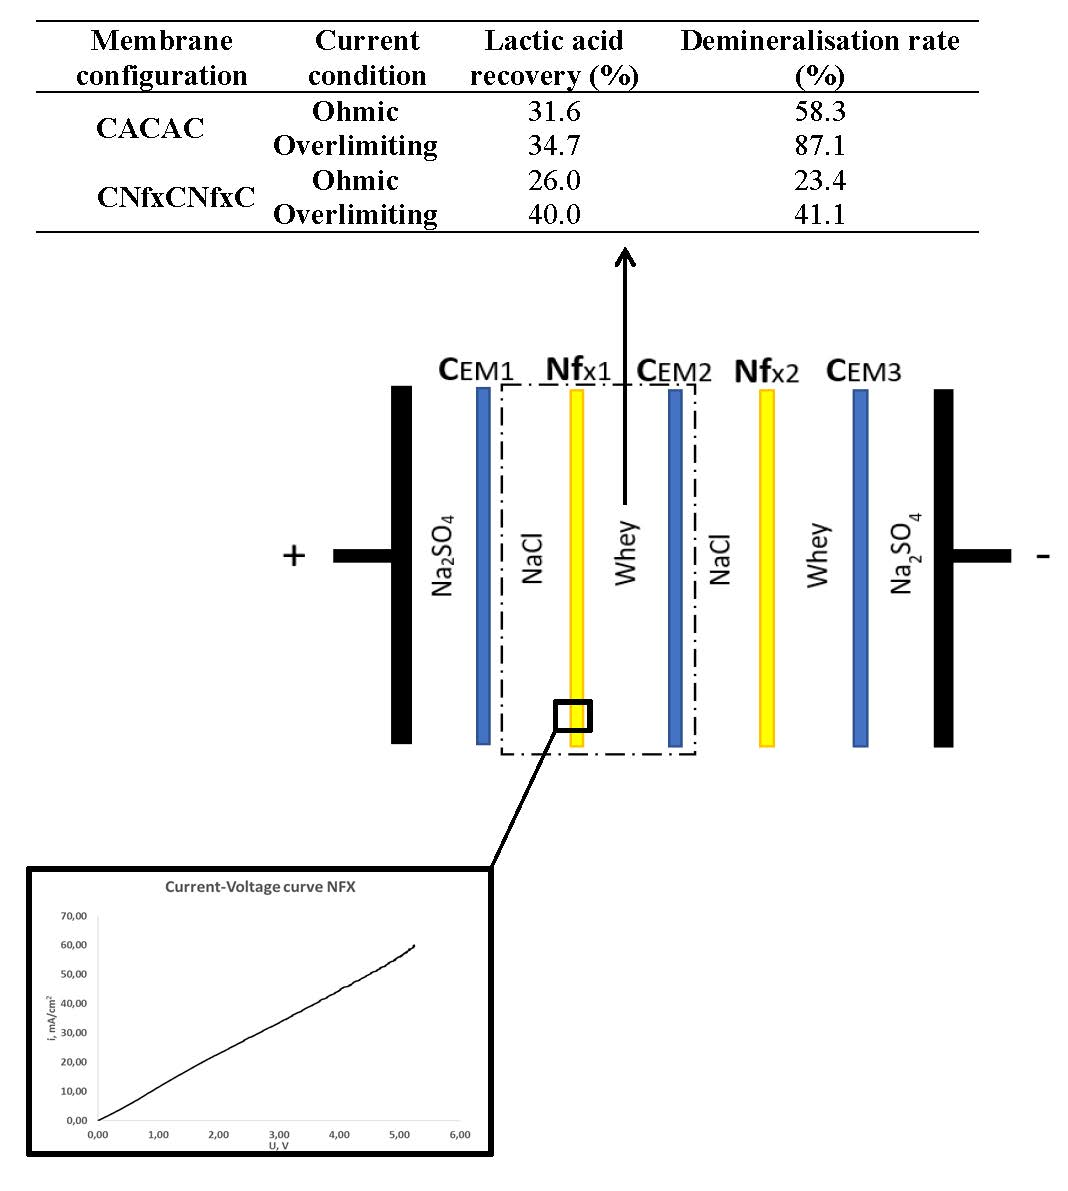
| Membrane Configuration | Current Condition | Deacidification | Time of Treatment |
|---|---|---|---|
| % | min | ||
| CACAC | Underlimiting | 31.66 ± 6.46 A | 60 |
| Overlimiting | 34.70 ± 3.17 A | 30 | |
| CNfCNfC | Underlimiting | 26.03 ± 4.93 A | 60 |
| Overlimiting | 40.00 ± 4.33 B | 30 |
| Membrane Configuration | Demineralization Rate Based on Conductivity Measurement | Demineralization Rate Based on Total Cations Concentration (See Section 3.7) | Time of Treatment | |
|---|---|---|---|---|
| % | % | min | ||
| CACAC | Underlimiting | 50.82 ± 5.48 C | 58.33 ± 2.59 C | 60 |
| Overlimiting | 77.23 ± 0.96 D | 87.12 ± 1.51 D | 30 | |
| CNfCNfC | Underlimiting | 20.32 ± 3.01 A | 23.40 ± 3.55 A | 60 |
| Overlimiting | 27.51 ± 2.68 B | 41.10 ± 6.69 B | 30 | |
| Membrane Configuration | Current Condition | Ca | K | Mg | Na | P |
|---|---|---|---|---|---|---|
| g/100 mL of Whey | ||||||
| CACAC | Underlimiting | 51.1 ± 2.1 A | 71.1 ± 3.6 C | 41.4 ± 9.3 B | 55.2 ± 3.1 B | 46.7 ± 3.4 C |
| Overlimiting | 90.4 ± 1.4 C | 96.7 ± 0.5 D | 88.4 ± 1.6 D | 90.3 ± 2.5 C | 60.4 ± 4.4 D | |
| CNfCNfC | Underlimiting | 41.3 ± 8.2 A | 54.9 ± 7.9 A | 28.9 ± 9.4 A | −39.4 ± 28.1 A | 13.8 ± 3.3 A |
| Overlimiting | 63.1 ± 9.2 B | 67.8 ± 13.5 B | 61.5 ± 9.5 C | −69.2 ± 30.9 A | 29.6 ± 10.4 B | |
| Membrane Configuration | Current Condition | Deacidification | Demineralization |
|---|---|---|---|
| Wh/g Lactate Migrated from Whey | Wh/g K+ Migrated from Whey | ||
| CACAC | Underlimiting | 9.29 ± 1.70 A | 19.78 ± 6.99 A |
| Overlimiting | 109.48 ± 13.61 C | 174.41 ± 7.50 B | |
| CNfCNfC | Underlimiting | 7.90 ± 1.50 A | 20.99 ± 1.72 A |
| Overlimiting | 65.14 ± 13.55 B | 152.02 ± 27.62 B |
© 2020 by the authors. Licensee MDPI, Basel, Switzerland. This article is an open access article distributed under the terms and conditions of the Creative Commons Attribution (CC BY) license (http://creativecommons.org/licenses/by/4.0/).
Share and Cite
Beaulieu, M.; Perreault, V.; Mikhaylin, S.; Bazinet, L. How Overlimiting Current Condition Influences Lactic Acid Recovery and Demineralization by Electrodialysis with Nanofiltration Membrane: Comparison with Conventional Electrodialysis. Membranes 2020, 10, 113. https://doi.org/10.3390/membranes10060113
Beaulieu M, Perreault V, Mikhaylin S, Bazinet L. How Overlimiting Current Condition Influences Lactic Acid Recovery and Demineralization by Electrodialysis with Nanofiltration Membrane: Comparison with Conventional Electrodialysis. Membranes. 2020; 10(6):113. https://doi.org/10.3390/membranes10060113
Chicago/Turabian StyleBeaulieu, Marielle, Véronique Perreault, Sergey Mikhaylin, and Laurent Bazinet. 2020. "How Overlimiting Current Condition Influences Lactic Acid Recovery and Demineralization by Electrodialysis with Nanofiltration Membrane: Comparison with Conventional Electrodialysis" Membranes 10, no. 6: 113. https://doi.org/10.3390/membranes10060113
APA StyleBeaulieu, M., Perreault, V., Mikhaylin, S., & Bazinet, L. (2020). How Overlimiting Current Condition Influences Lactic Acid Recovery and Demineralization by Electrodialysis with Nanofiltration Membrane: Comparison with Conventional Electrodialysis. Membranes, 10(6), 113. https://doi.org/10.3390/membranes10060113