Scaling Risk Assessment in Nanofiltration of Mine Waters


Abstract
1. Introduction
2. Materials and Methods
2.1. Chemistry of Raw Water
2.2. NF Membranes
2.3. Experimental Procedure
- Place the freshly cut membrane in the membrane module.
- Pour 300 mL of deionized water (Millipore Elix 10 system, conductivity 0.066 µS) into the feed/retentate chamber of the membrane module.
- Start the filtration; note the time required to collect every 30 mL of permeate. If the pure water flux at constant pressure doesn’t change between each 30 mL of permeate collected, the membrane is assumed as conditioned. If not, go back to step 2.
- Pour out the retentate, fill the feed/retentate chamber with the tested solution.
- Start the filtration and collect 30 mL of permeate. Pour out the retentate and permeate out; fill the feed/retentate chamber with 300 mL of tested solution.
- Start the filtration and collect 90 mL of permeate. Stop the filtration, recycle the collected permeate back to the feed/retentate chamber, and collect the feed sample for analysis.
- Start the filtration. Collect each 30 mL of permeate into a separate sample container.
2.4. Modeling
3. Results and Discussion
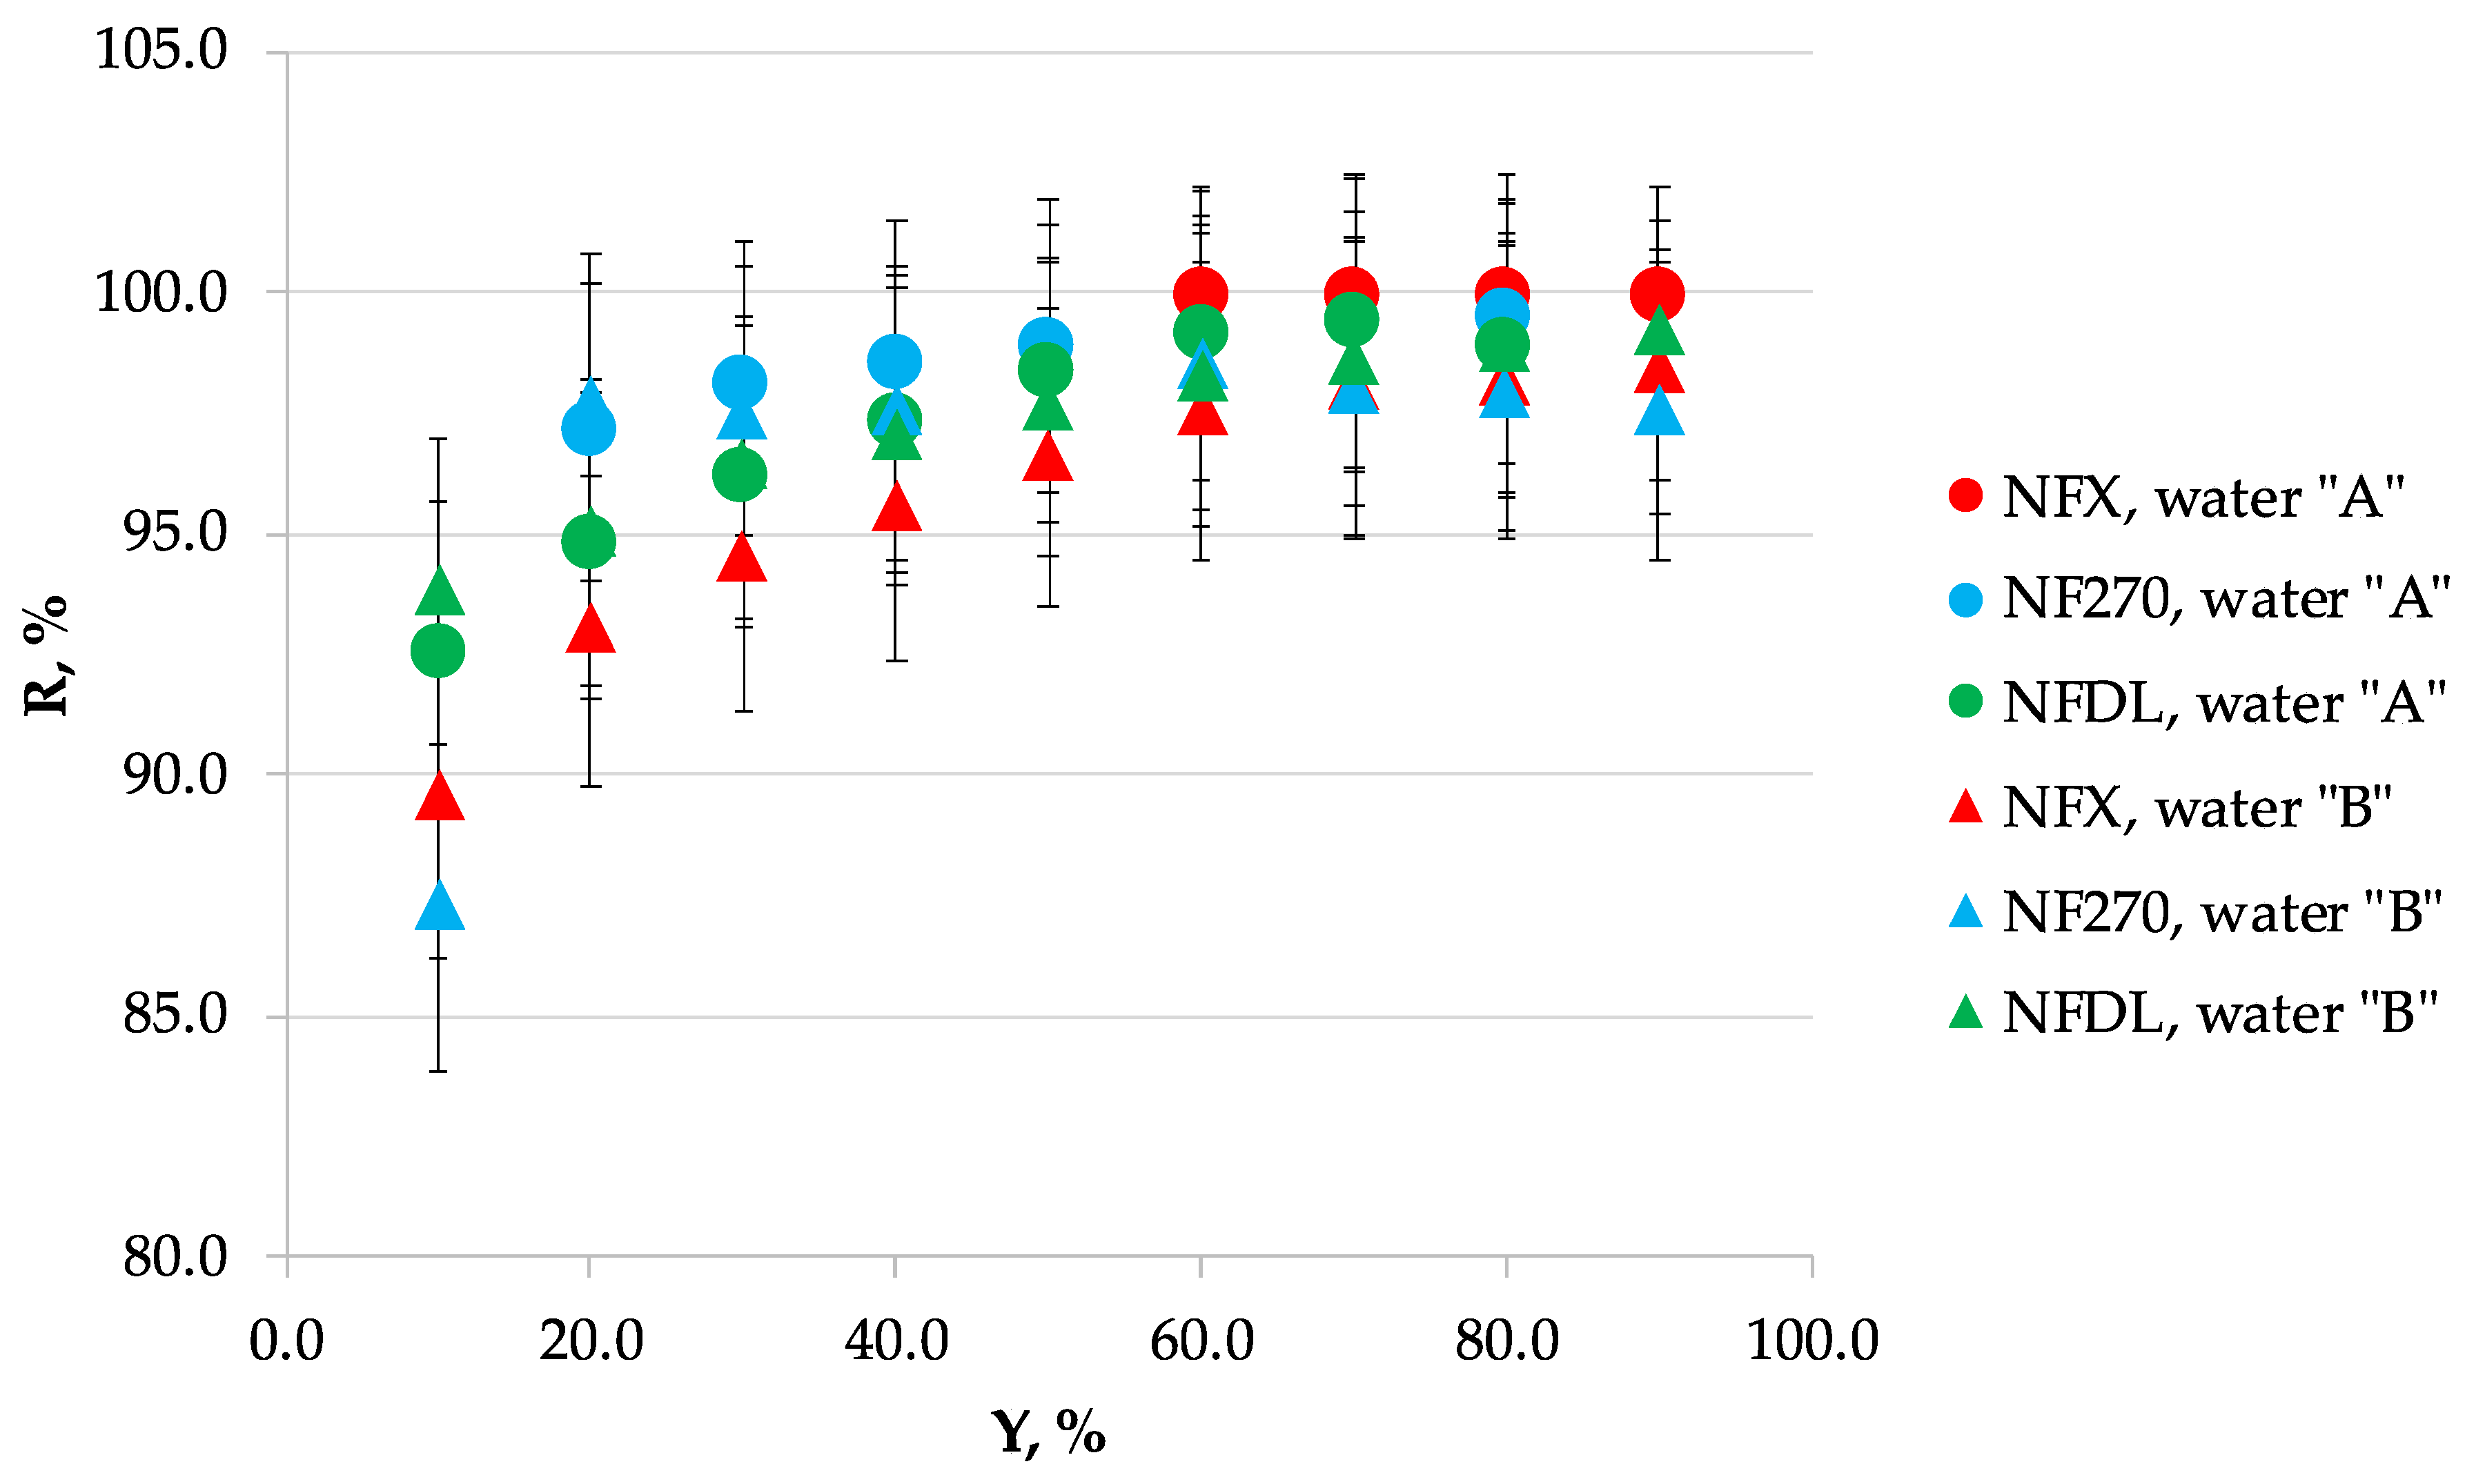
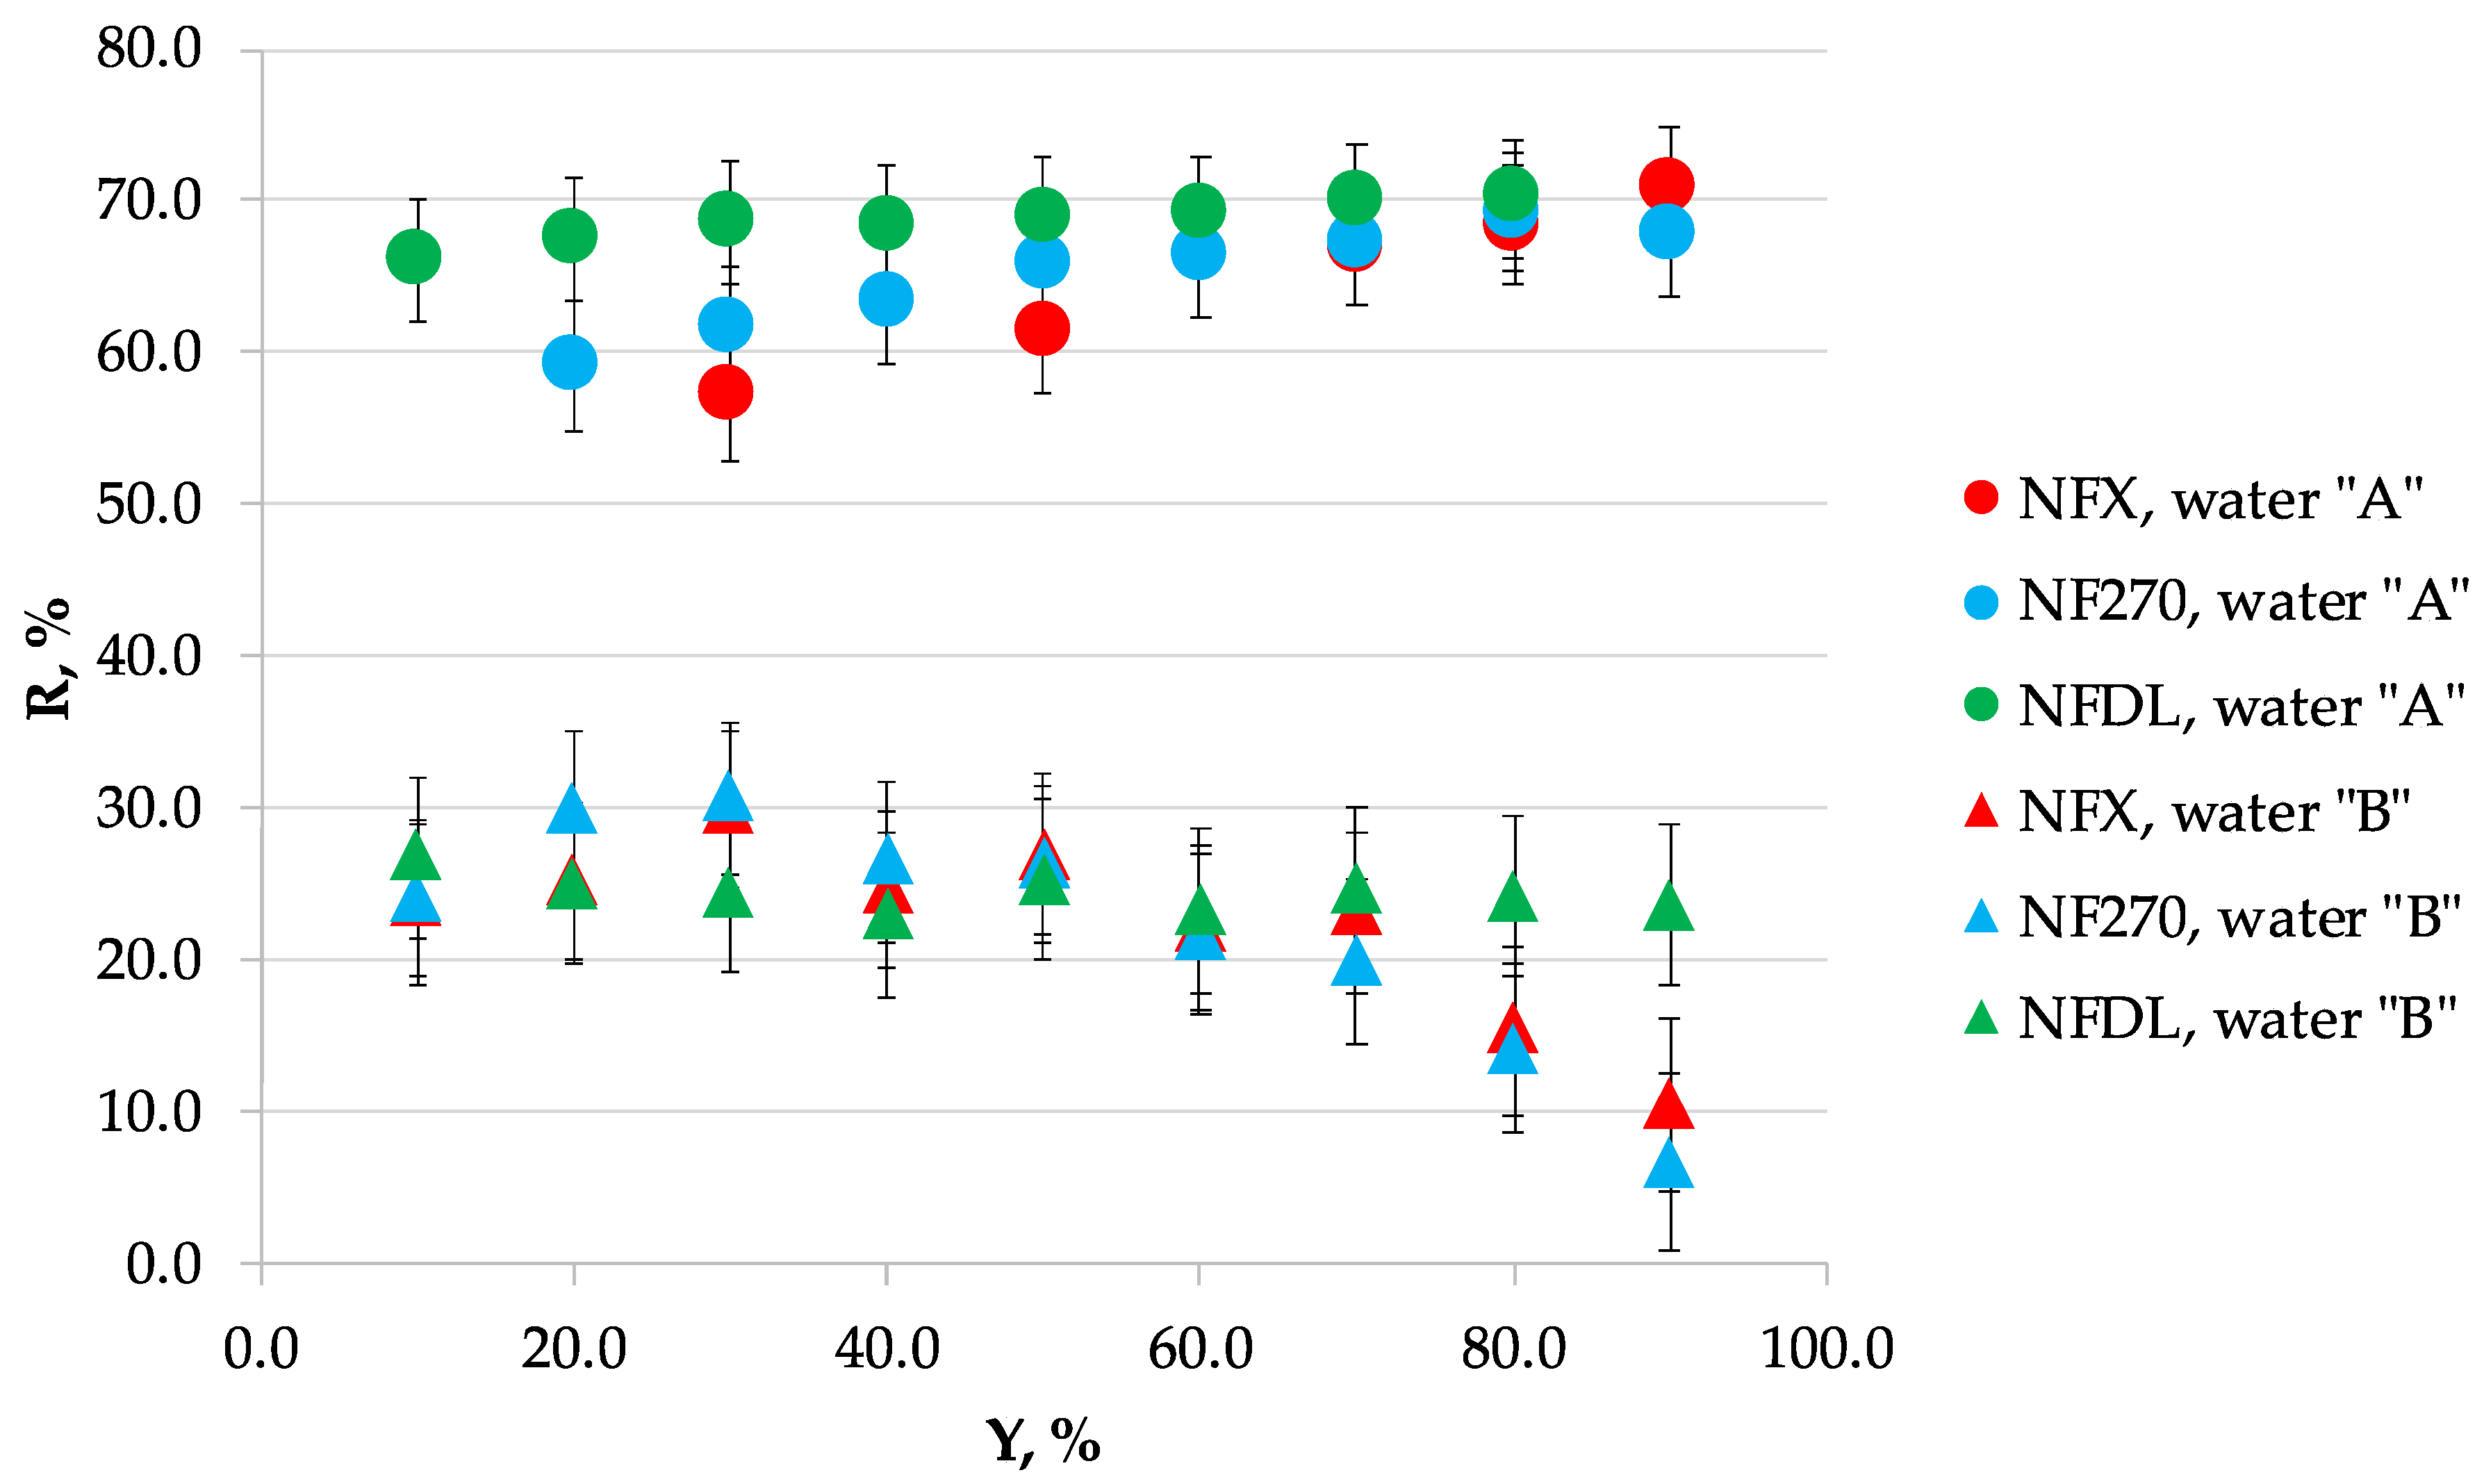
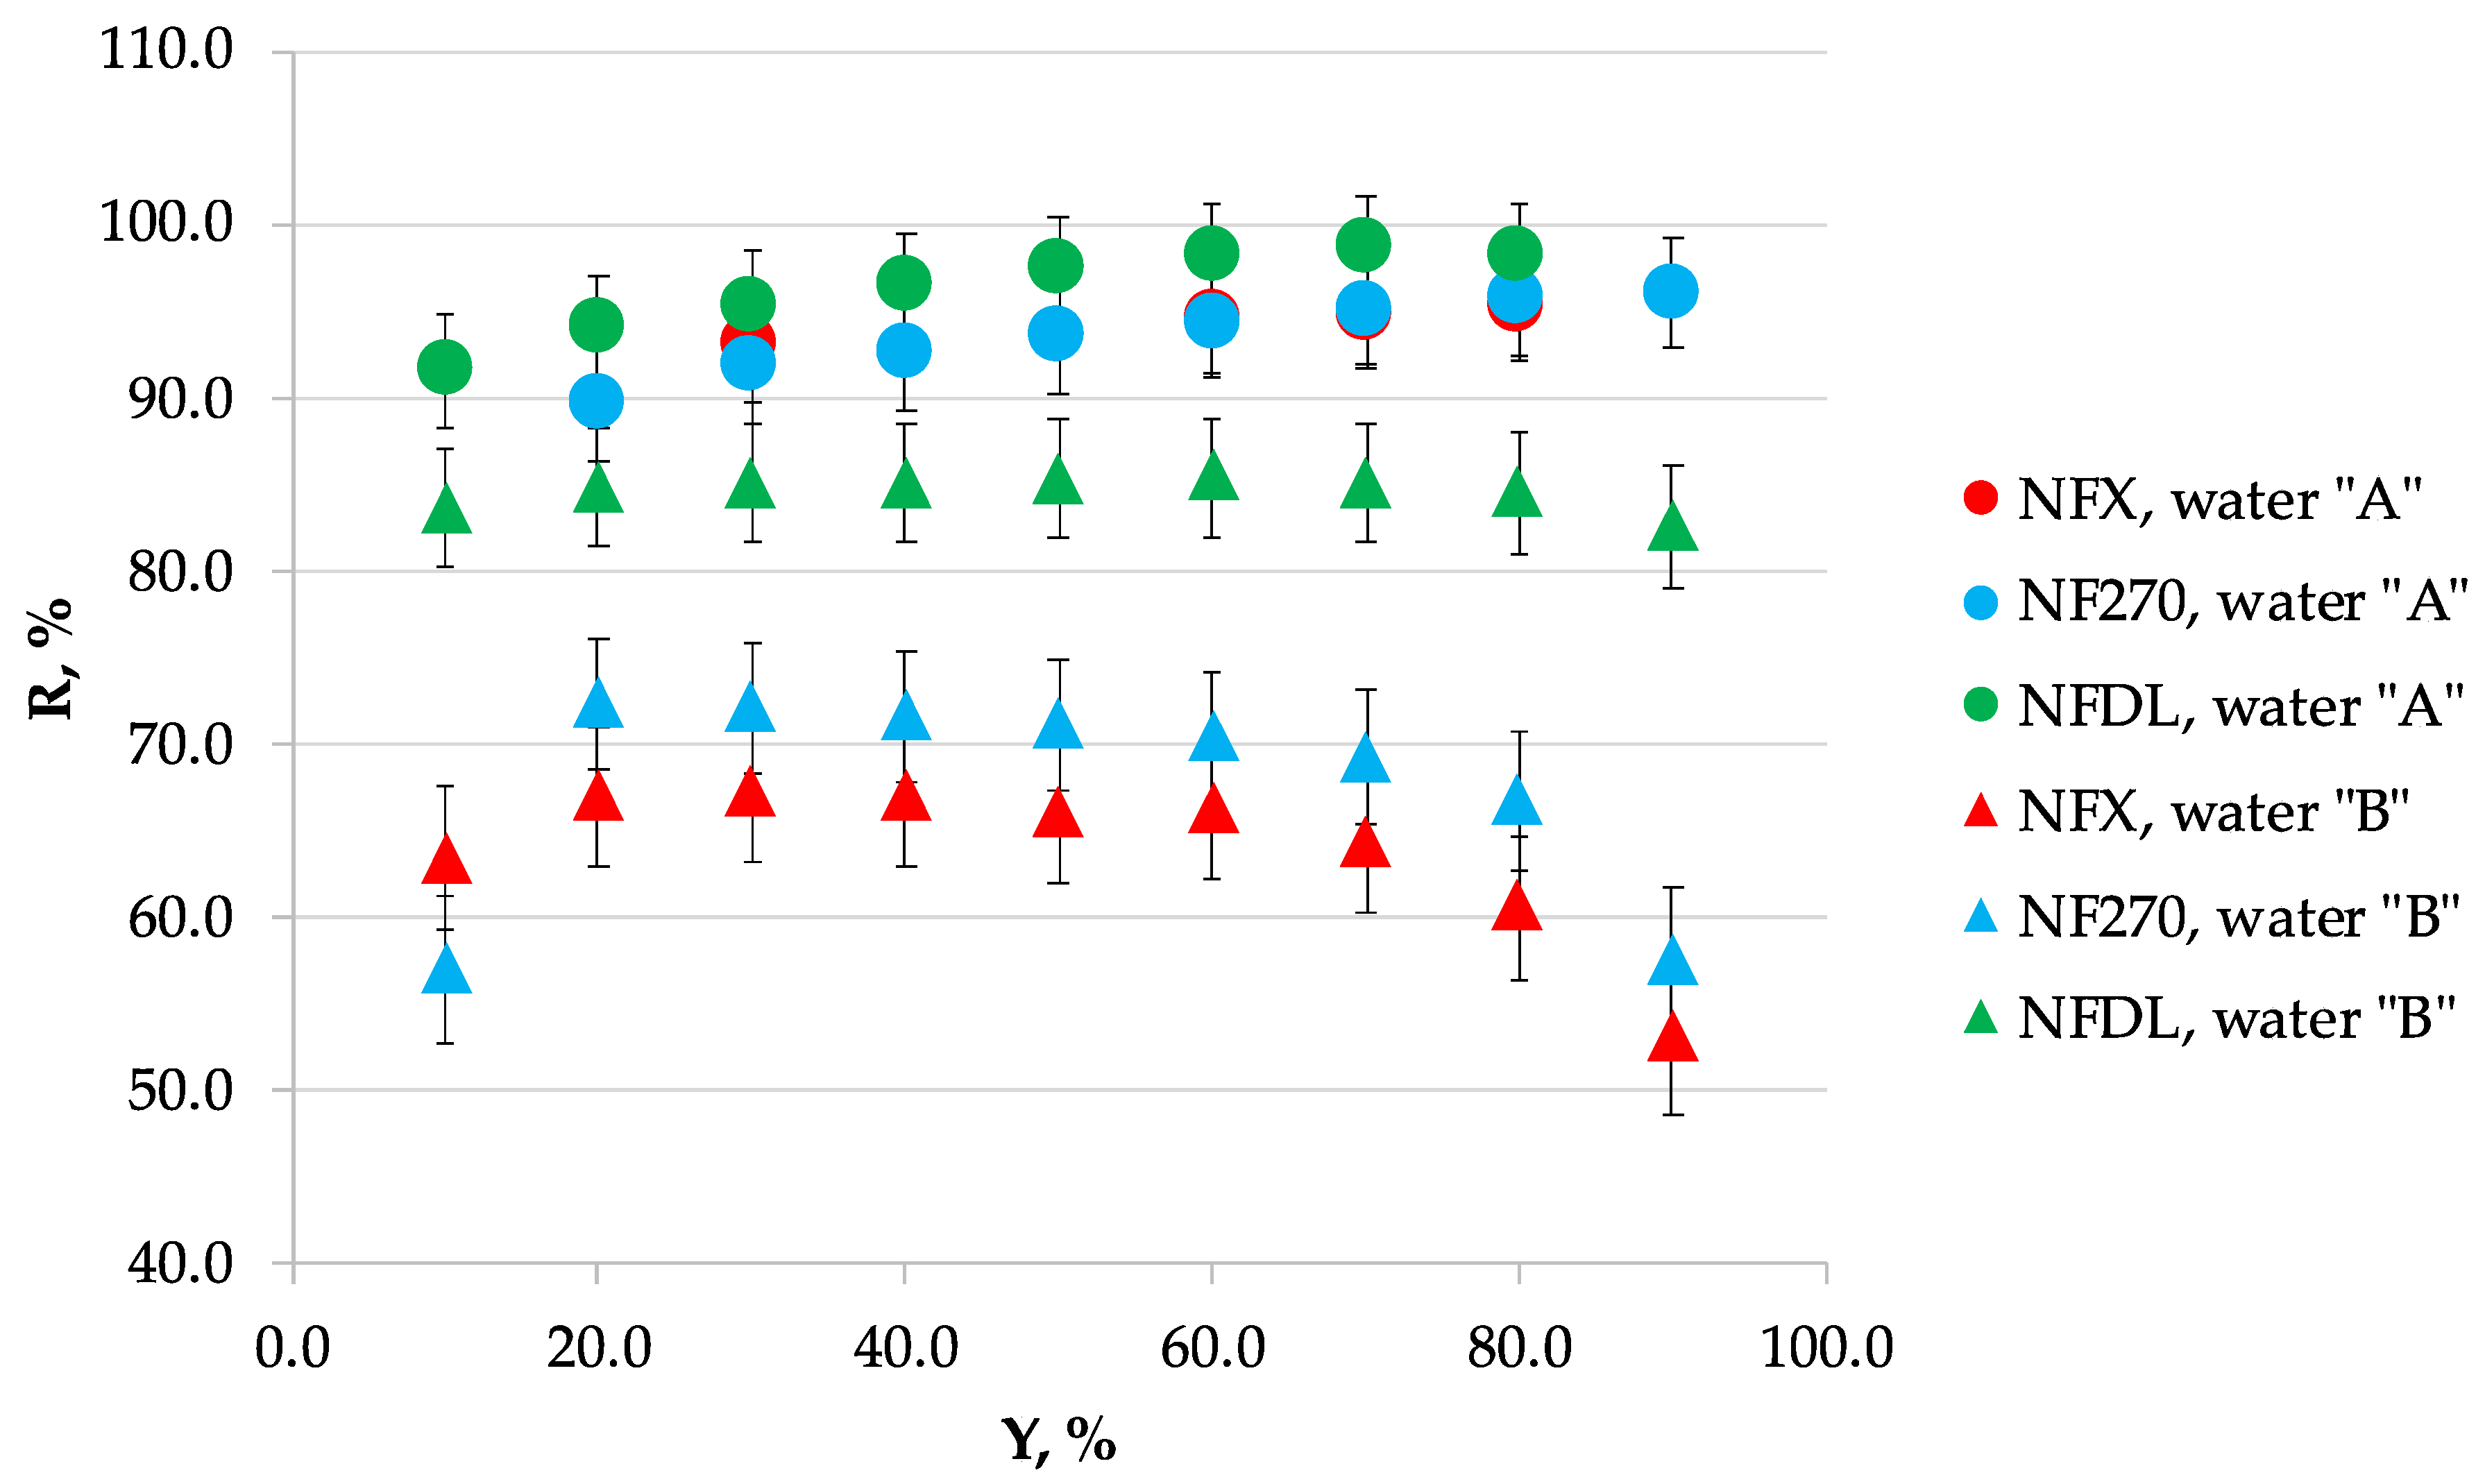
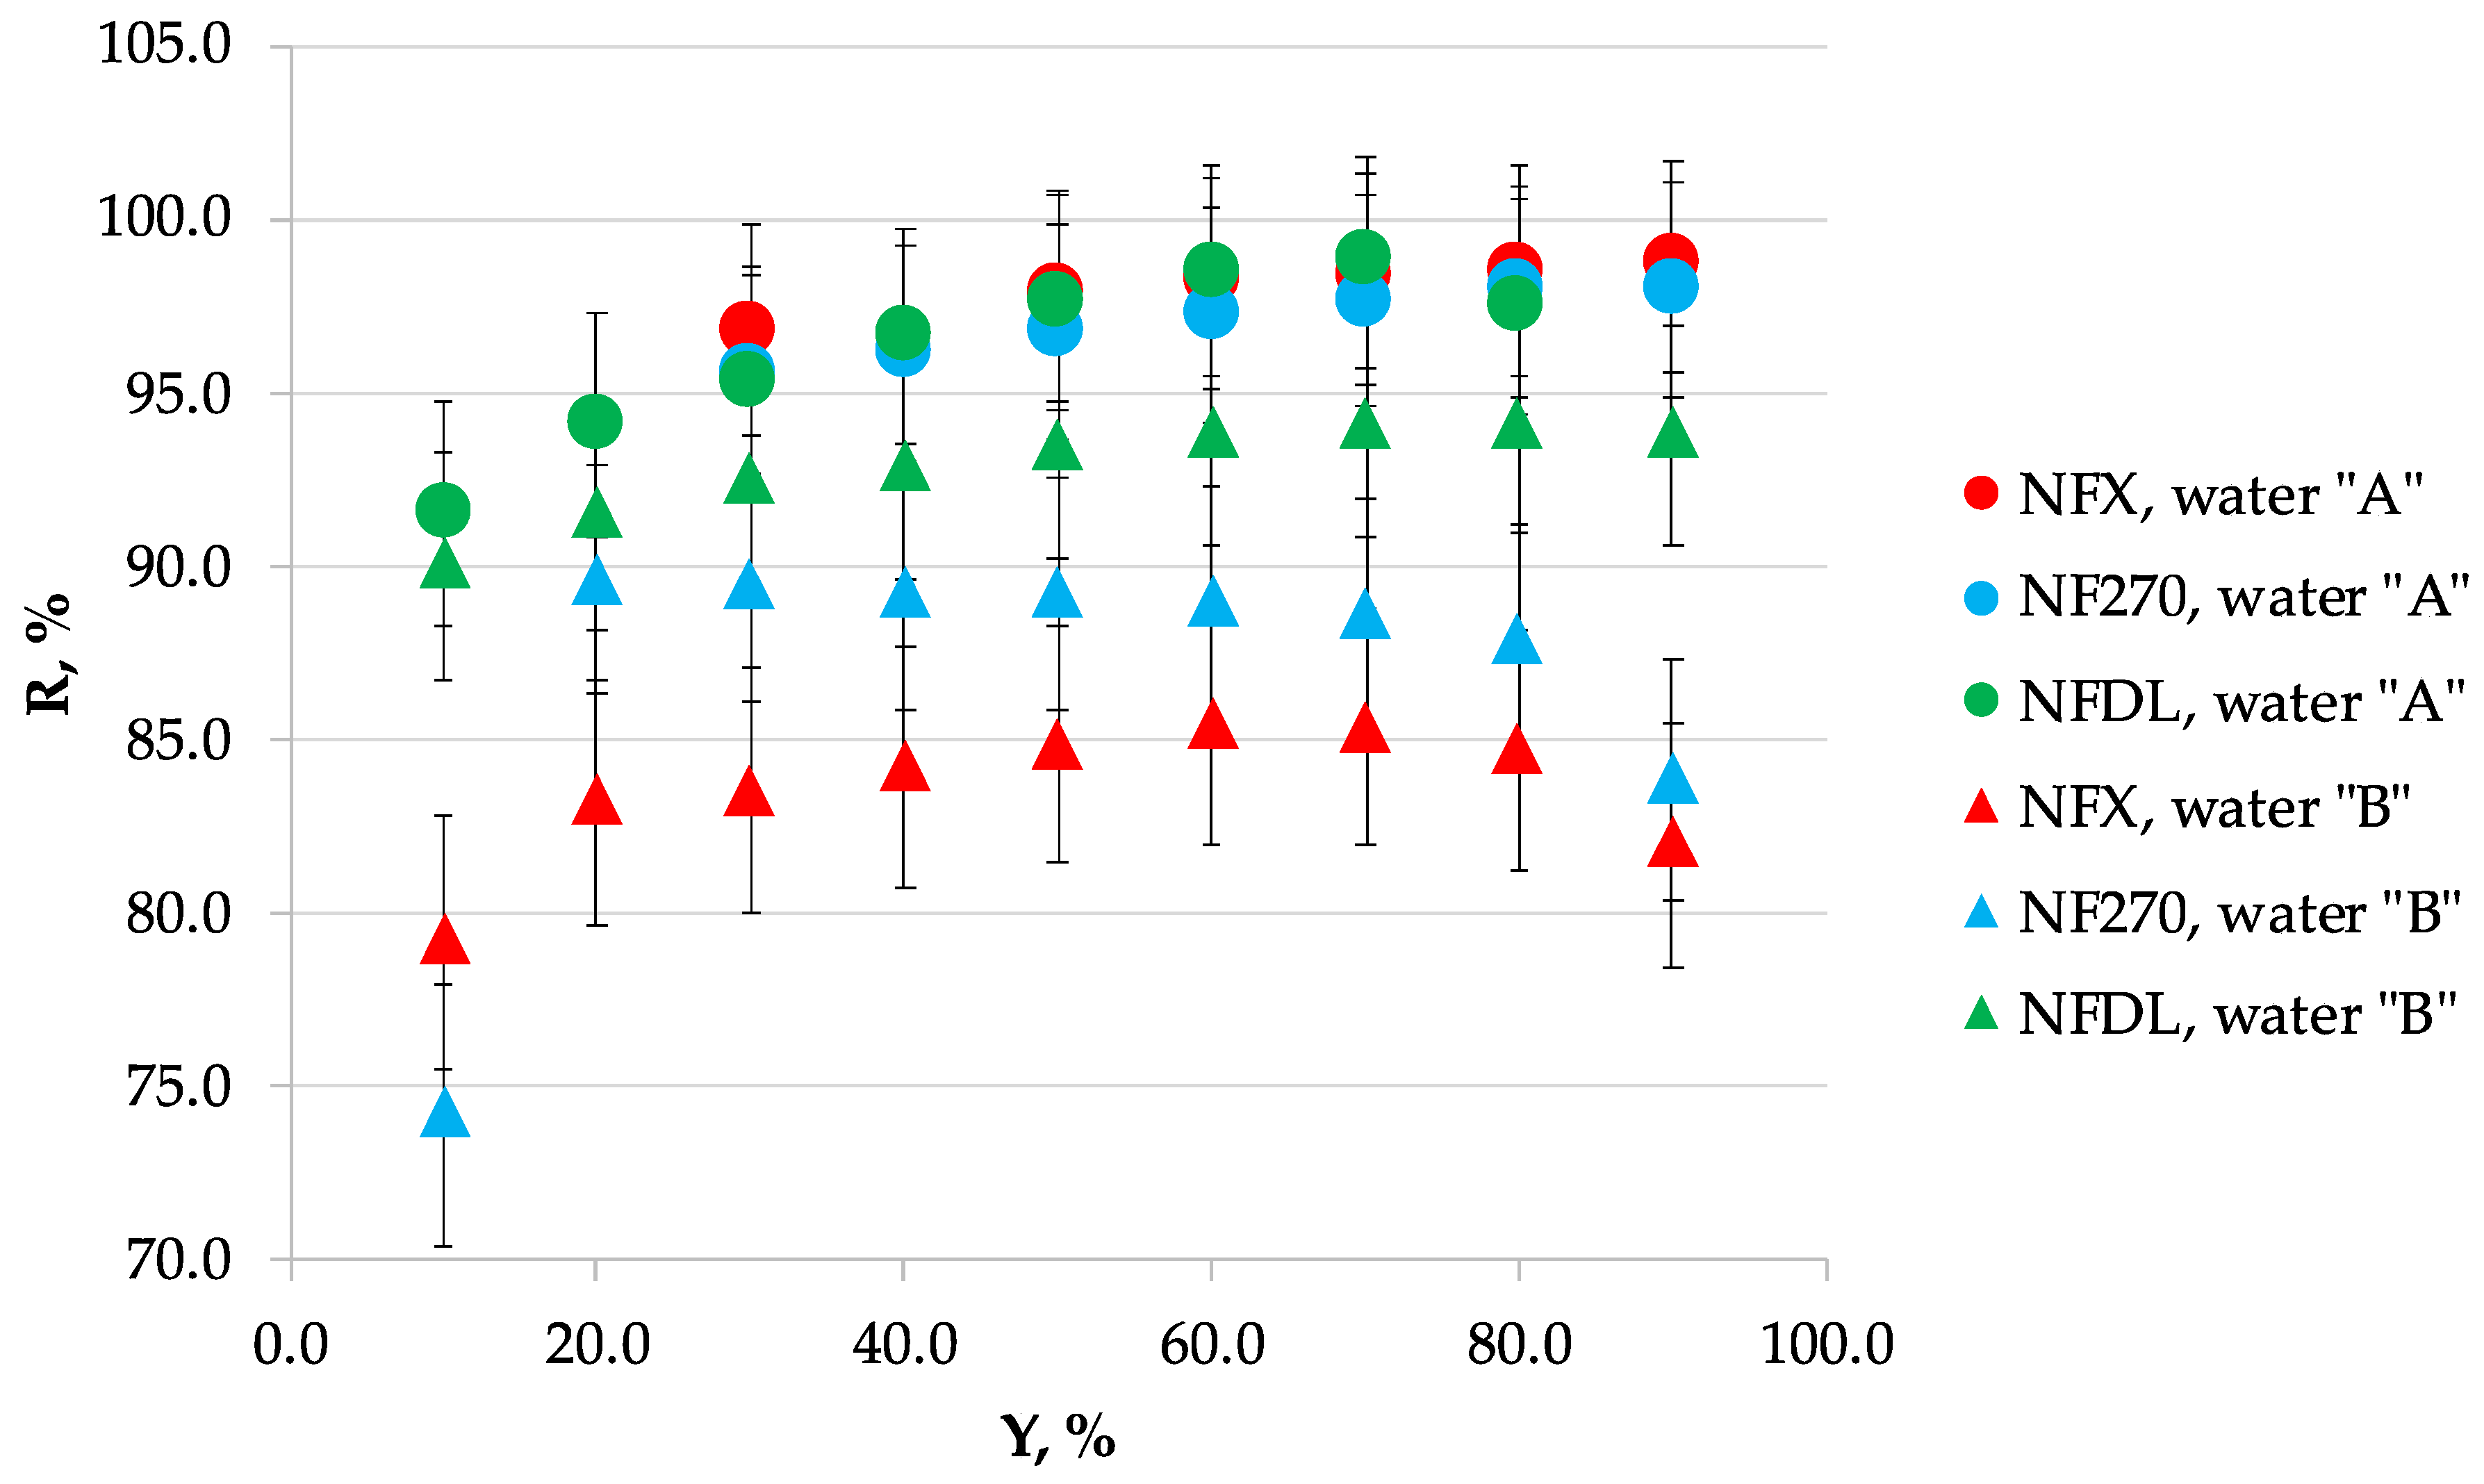
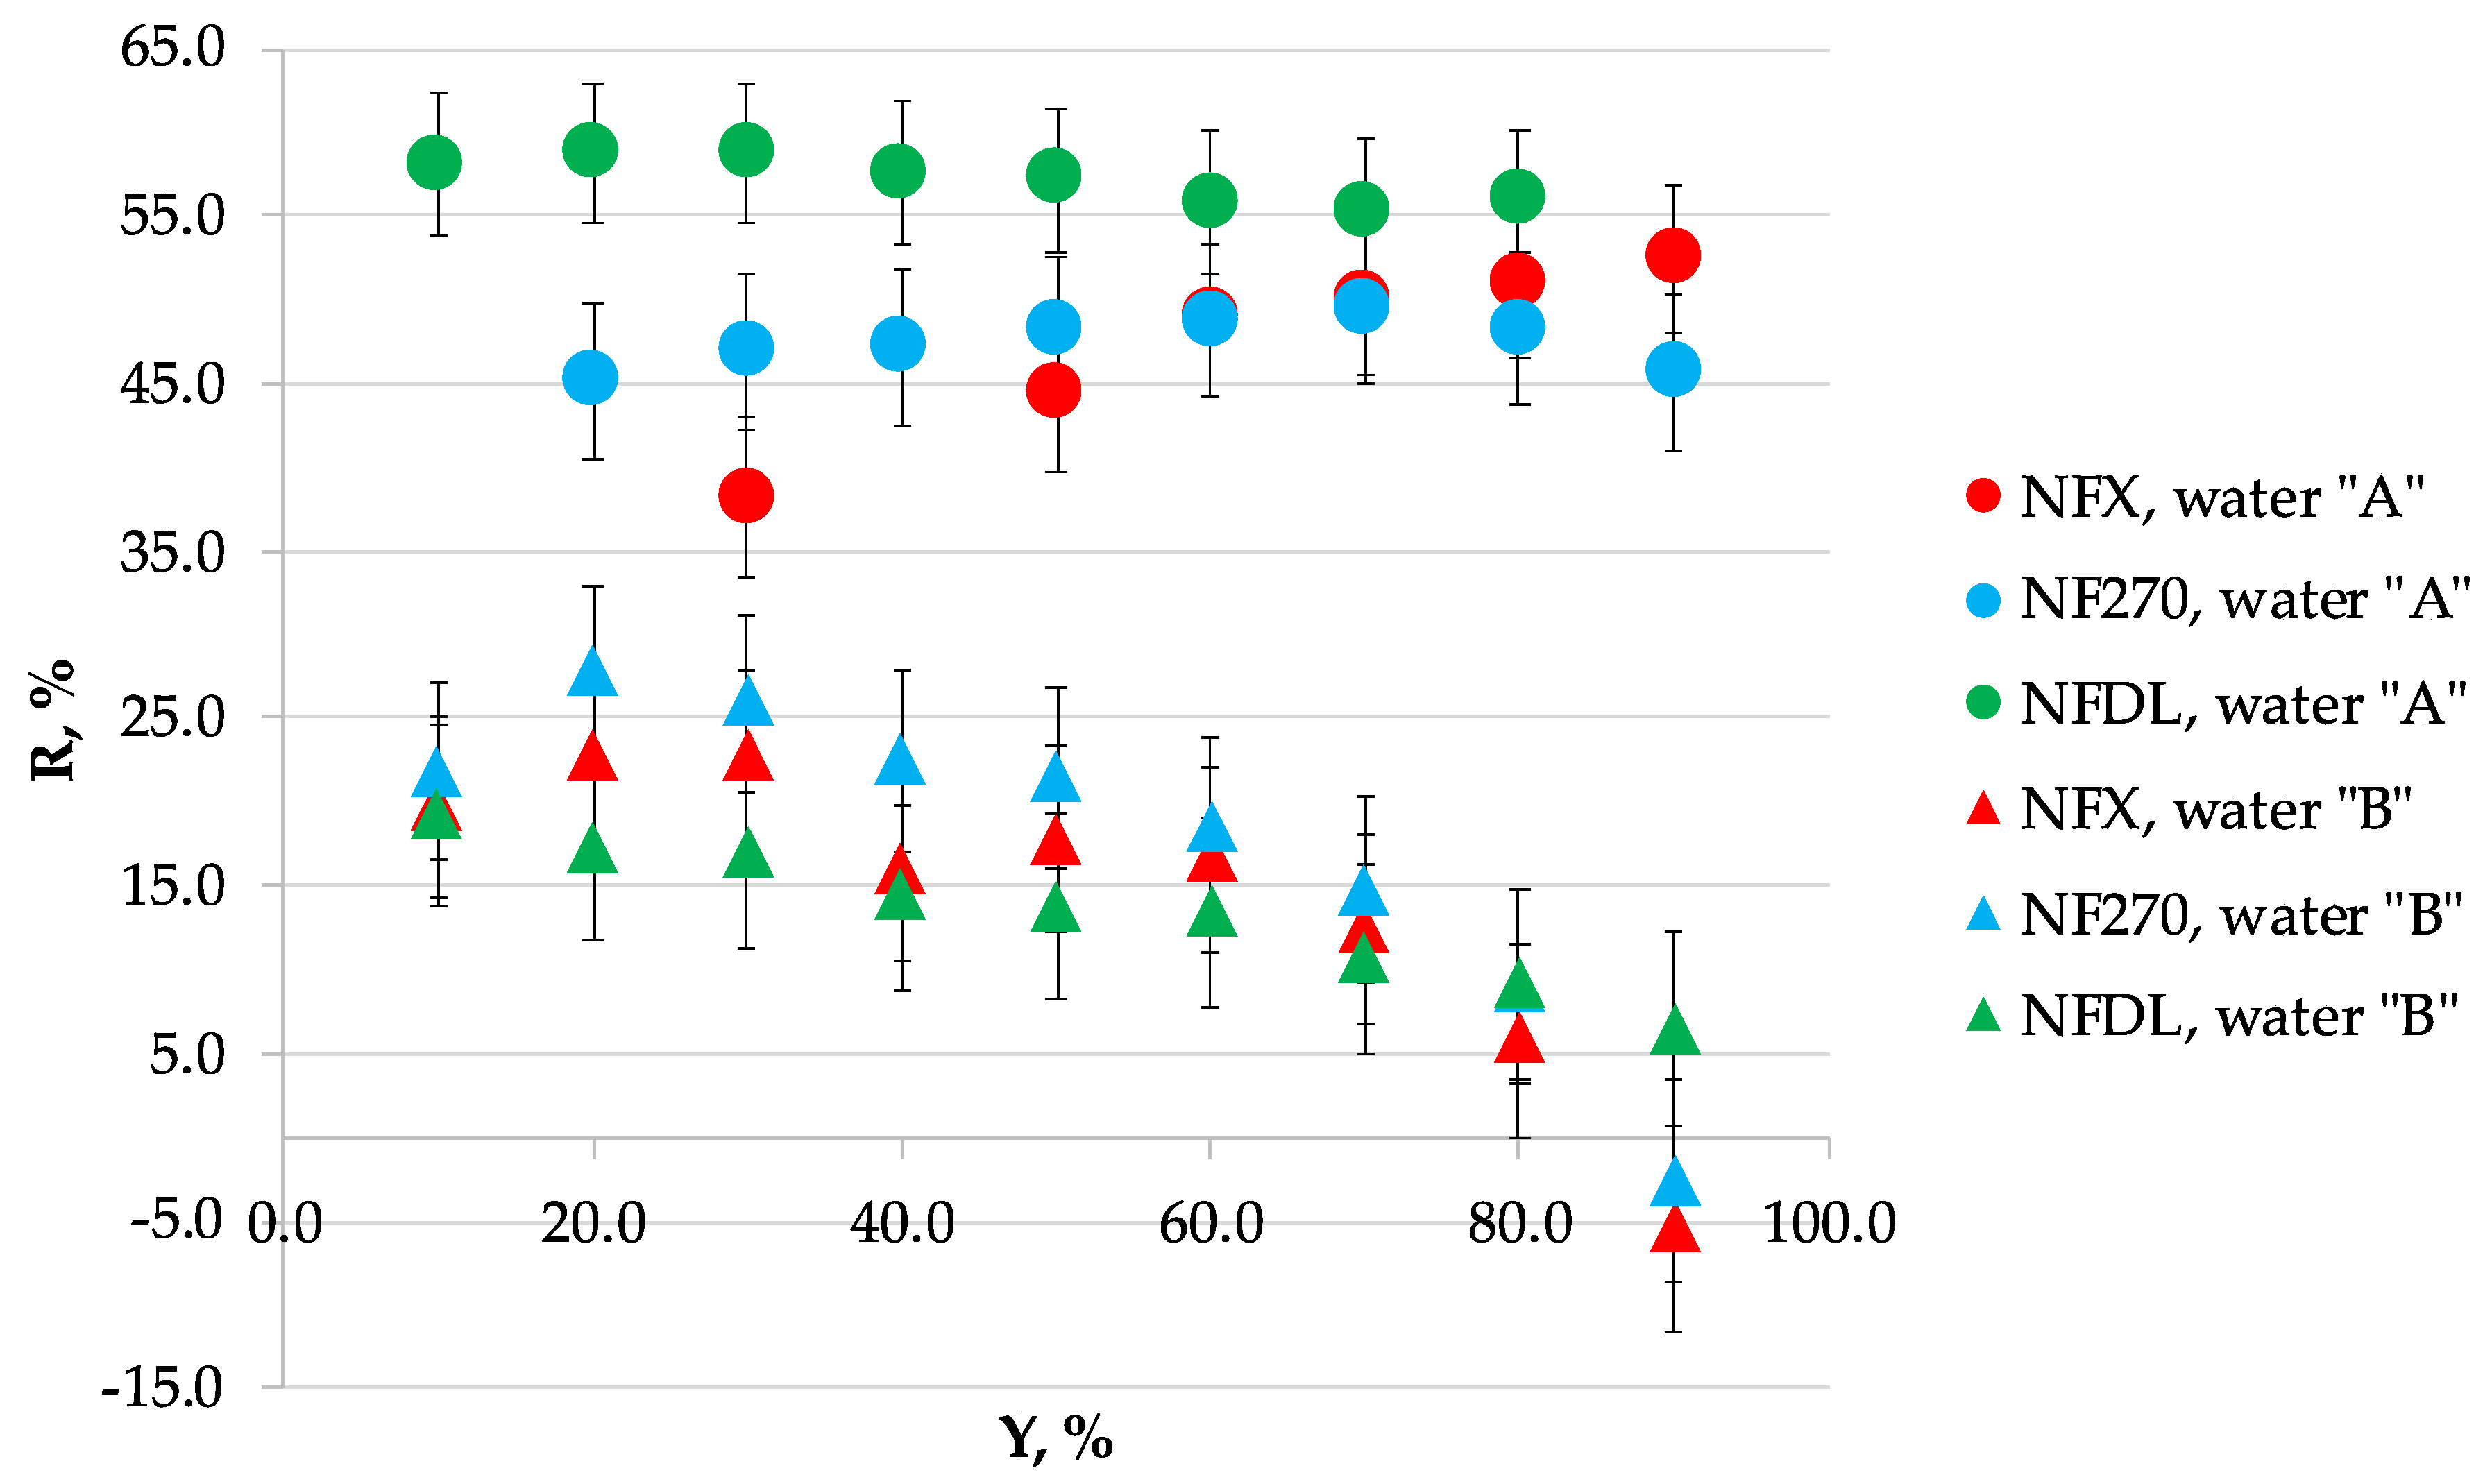
3.1. Nanofiltration
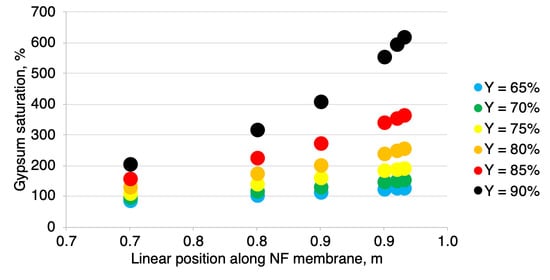
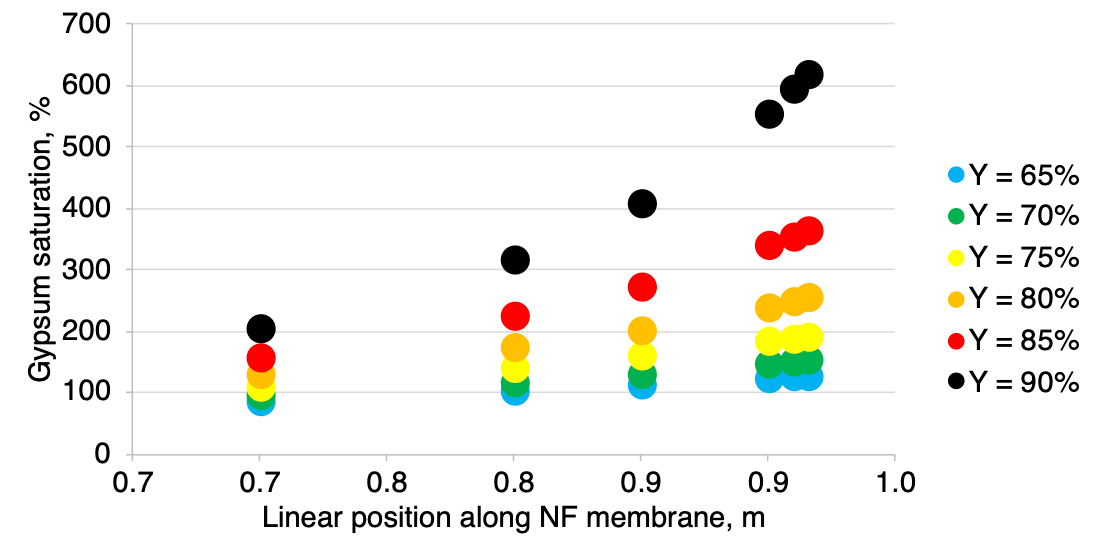
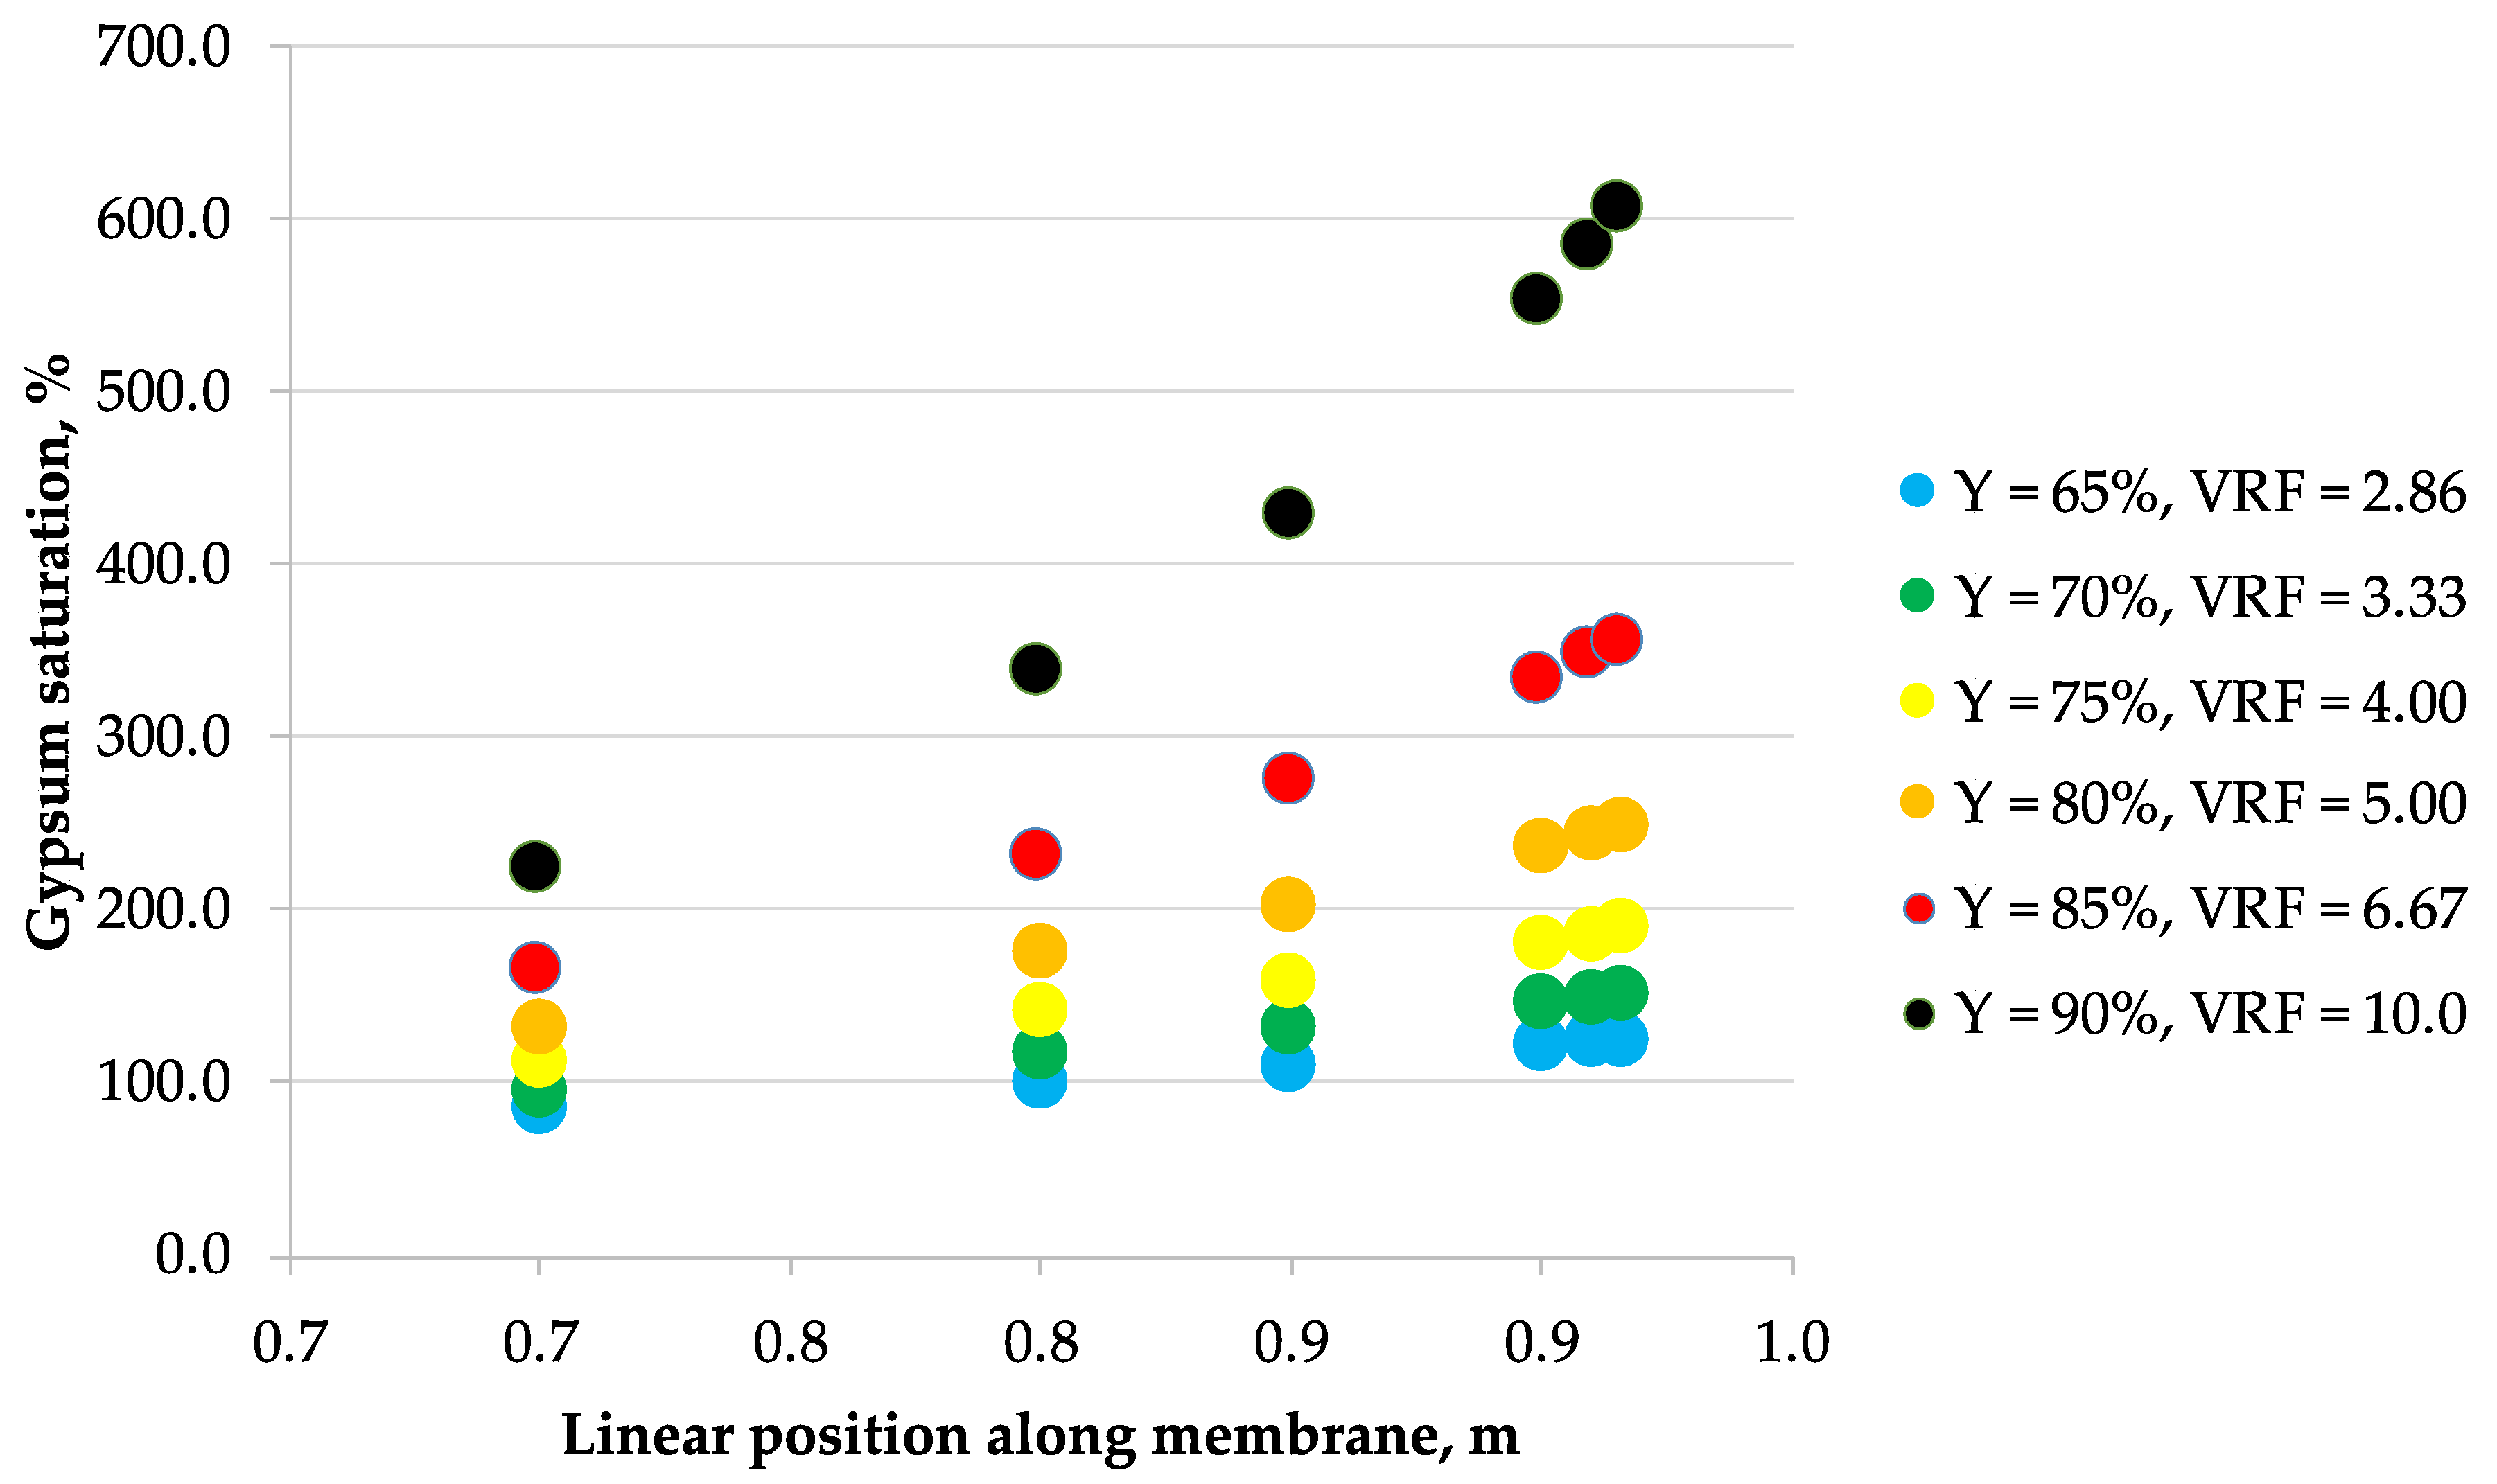
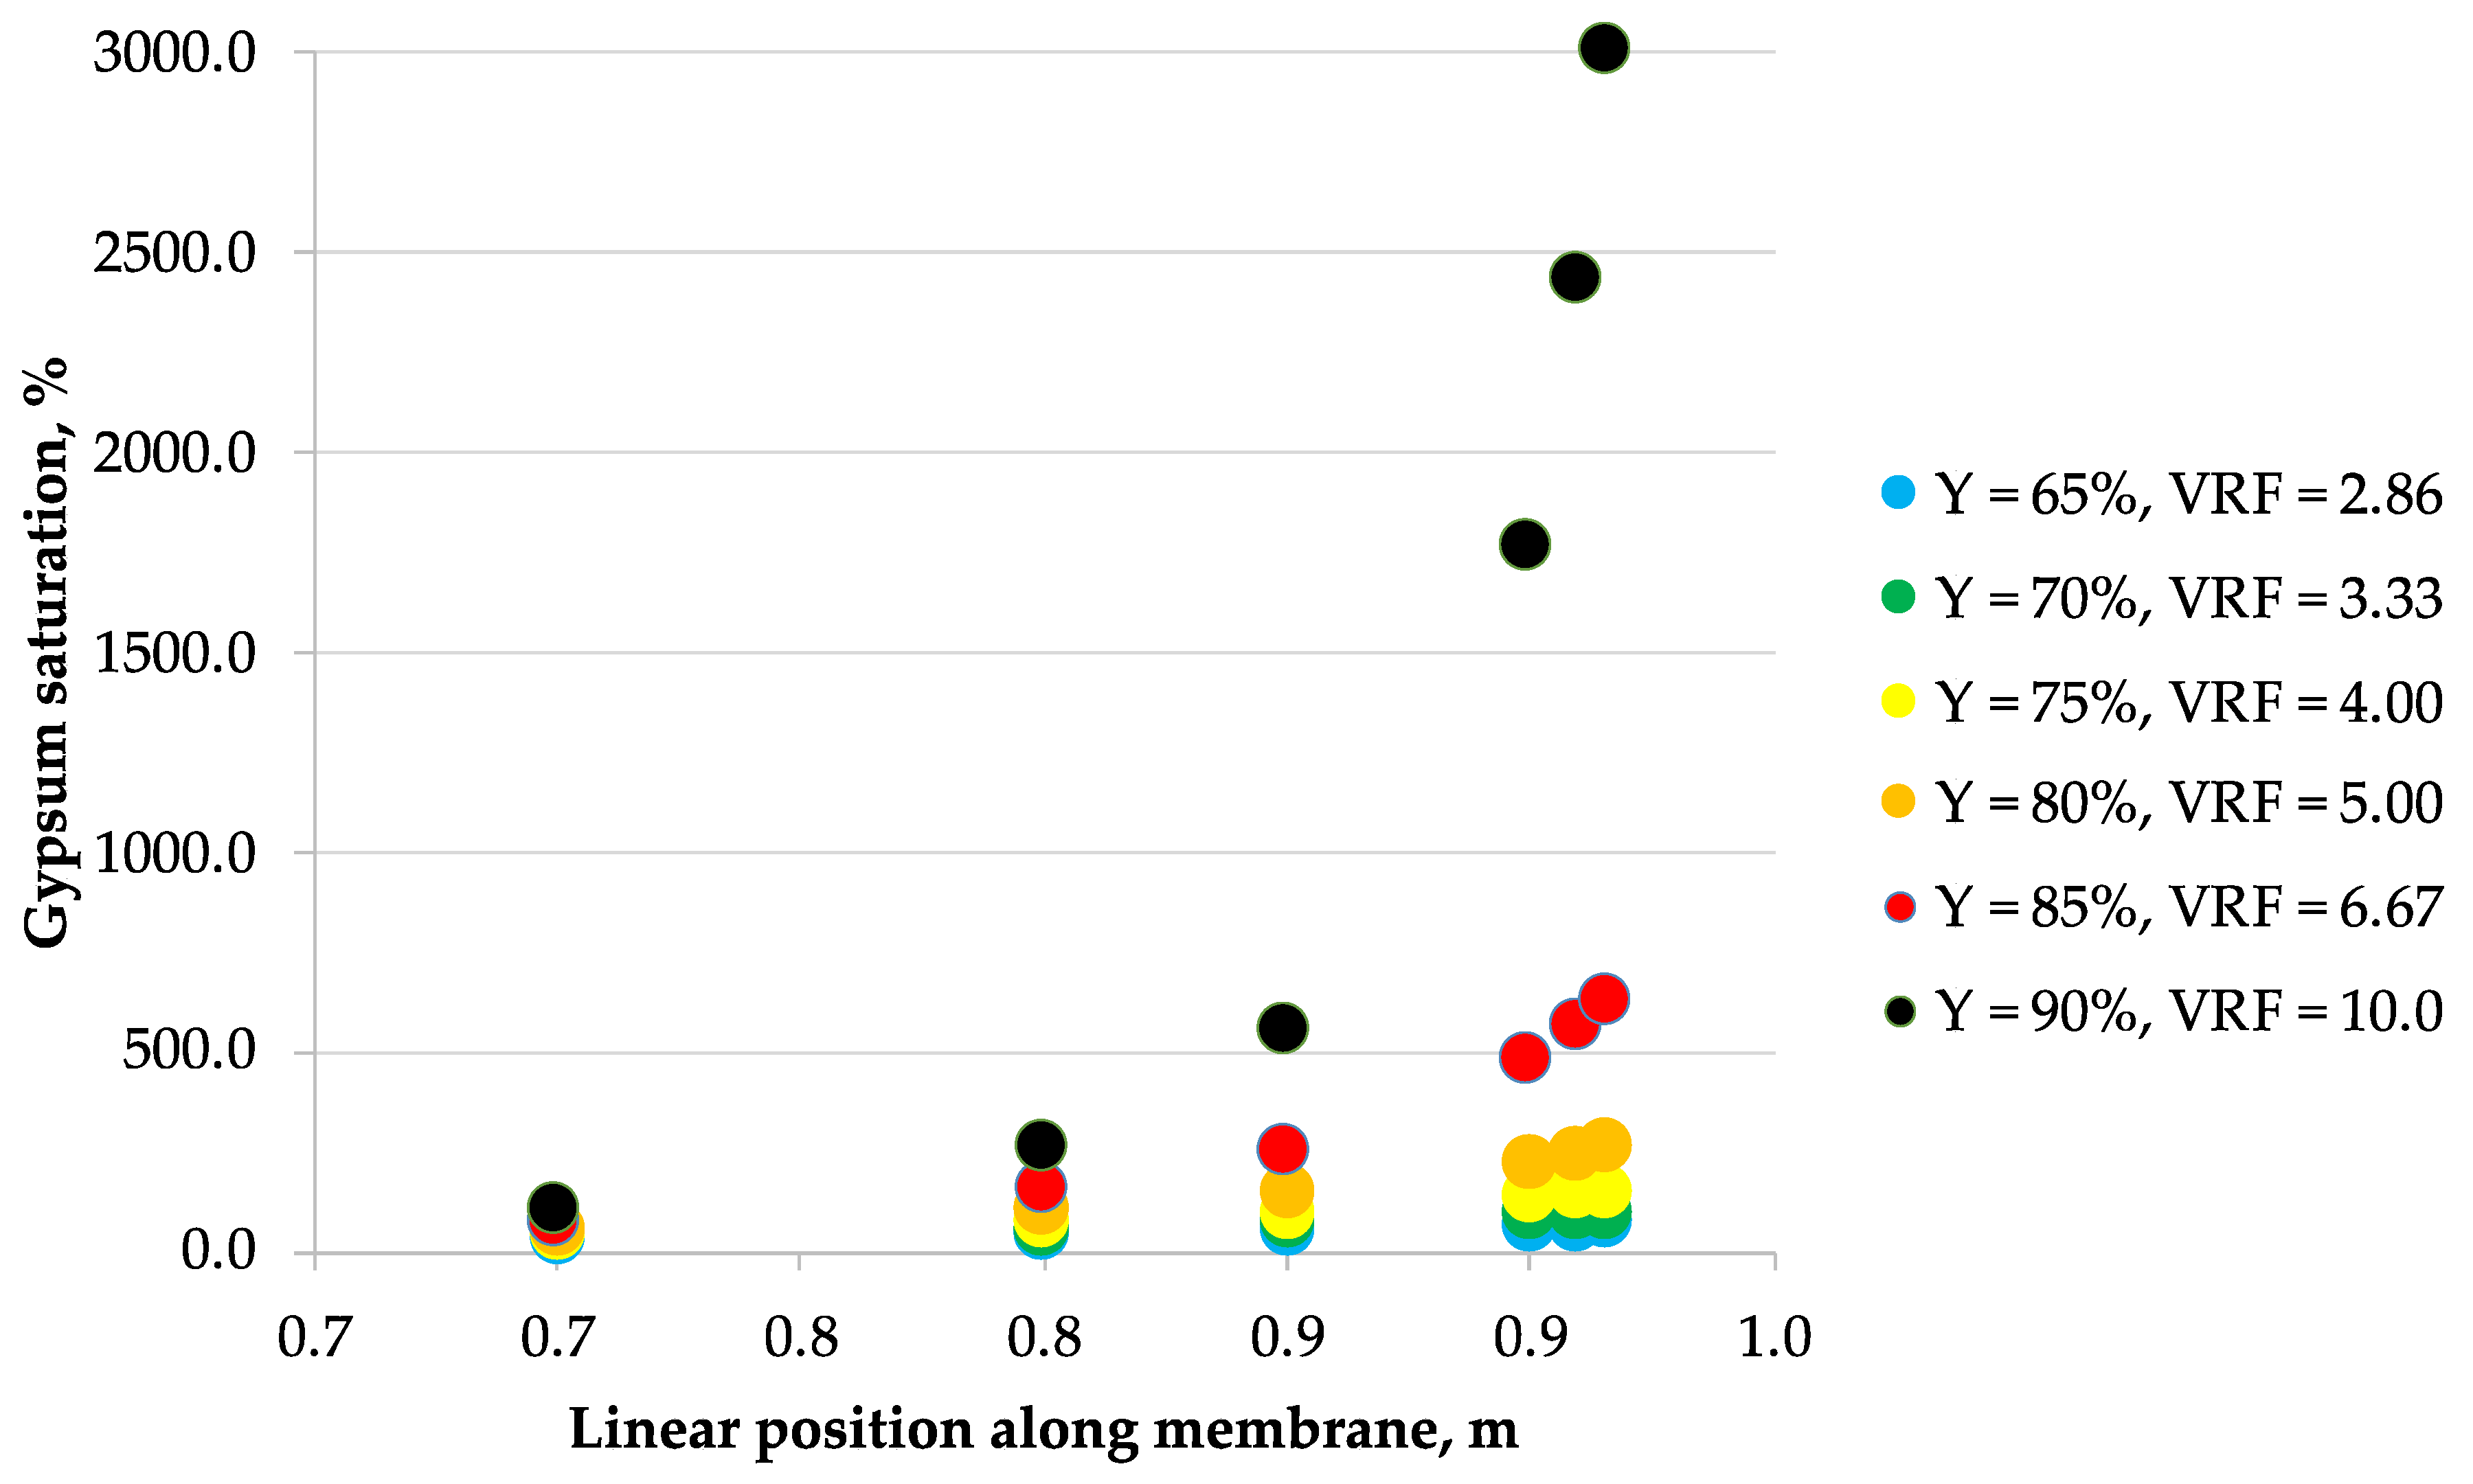
3.2. Scaling
- Calculate the permeate recovery Y of the module by assuming the feed linear flow velocity (refer to Section 2.3 Modeling).
- Assume a point along the module membrane length.
- Calculate the bulk retentate ionic concentrations and retentate concentrations at the membrane surface for a chosen point using the previously discussed model.
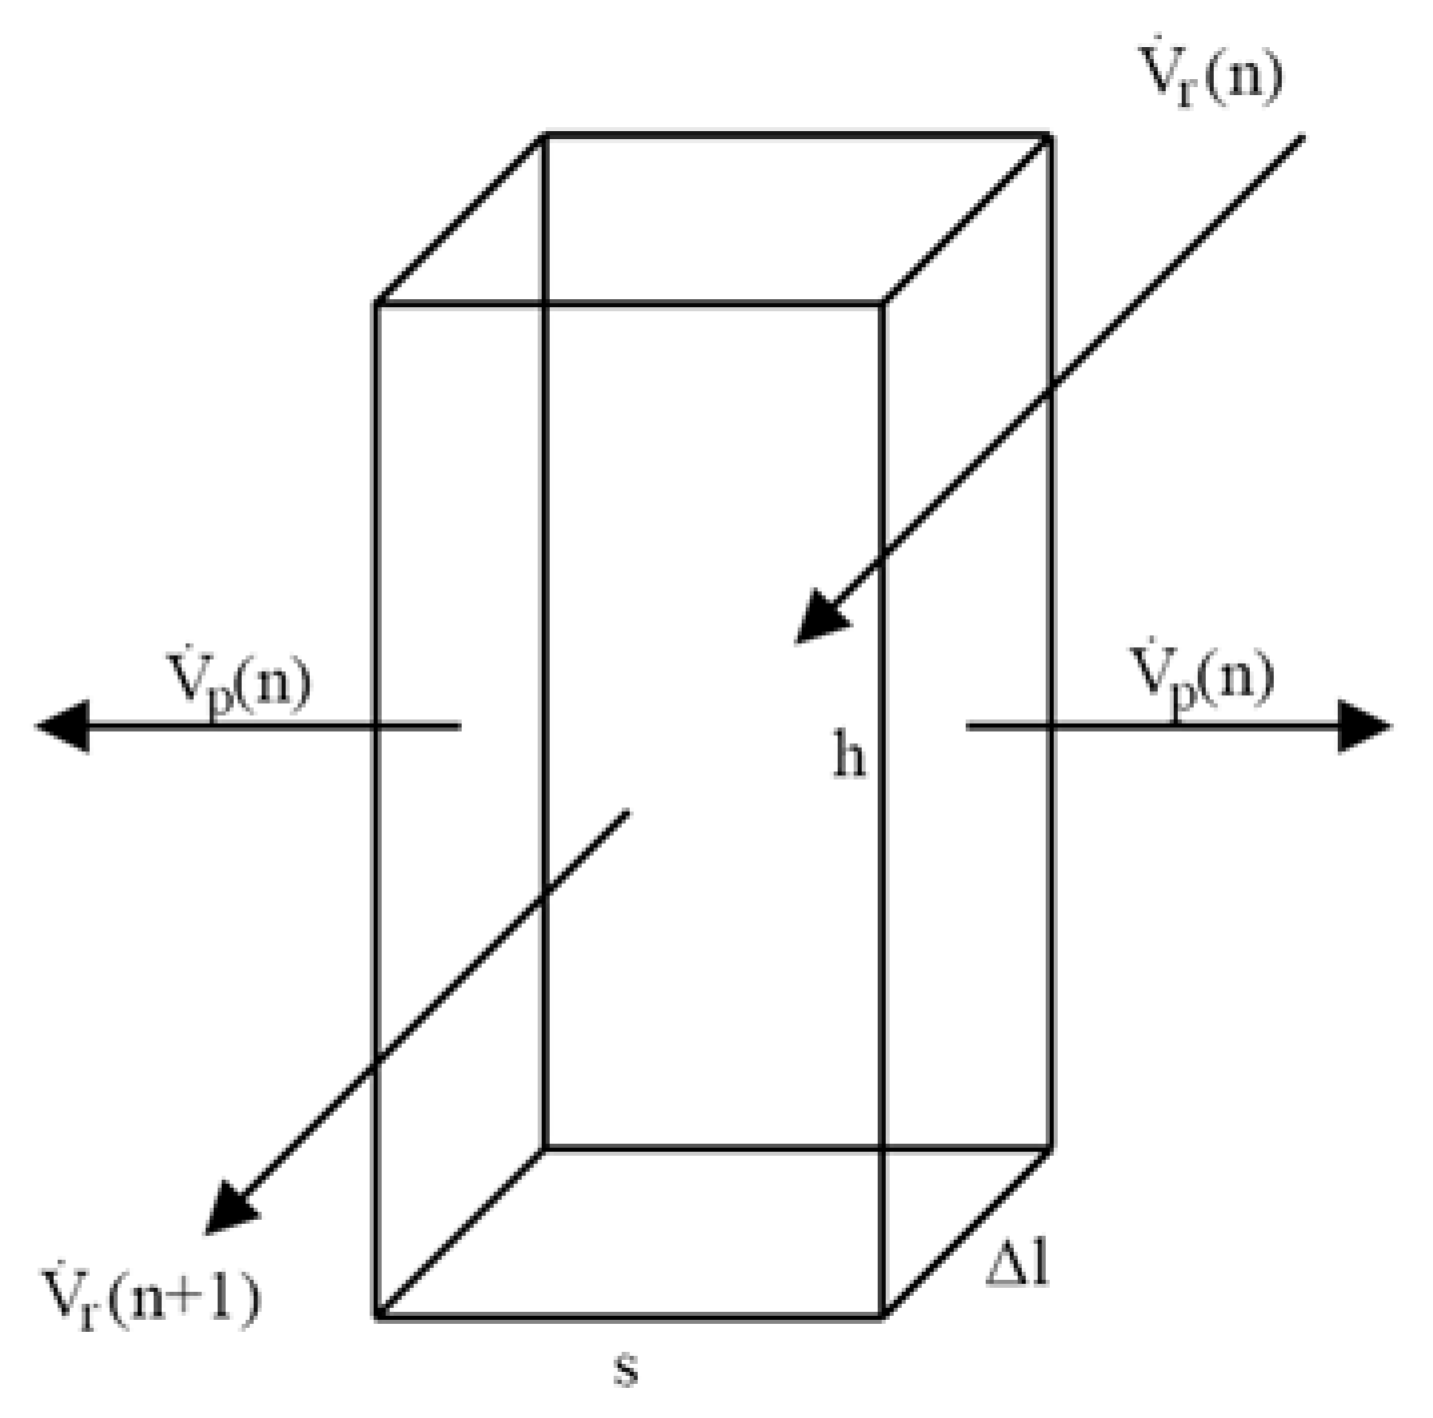
- Calculate the theoretical time needed for the solution to flow from the chosen point to the retentate outlet. The gradual change in the volumetric flow along the membrane module length, due to the flow across the membrane is taken into account when calculating the time needed to leave the module has been taken into account by calculating the mean residence time in each of the elementary units separately and adding them.
- If the theoretical time needed for the solution is not at least six times higher than the induction time, the scaling risk is unacceptablely high.
4. Conclusions
Author Contributions
Funding
Conflicts of Interest
Appendix A


| Recovery, % | Volume Reduction Fraction | Permeate Flux, dm3/m2·h | |||||
|---|---|---|---|---|---|---|---|
| “A” | “B” | ||||||
| NF270 | NFX | NFDL | NF270 | NFX | NFDL | ||
| 10% | 1.11 | 273 | 62 | 206 | 76 | 64 | 67 |
| 20% | 1.25 | 264 | 59 | 223 | 71 | 61 | 68 |
| 30% | 1.43 | 255 | 56 | 211 | 71 | 58 | 61 |
| 40% | 1.67 | 247 | 56 | 204 | 62 | 56 | 56 |
| 50% | 2.00 | 223 | 56 | 187 | 55 | 50 | 53 |
| 60% | 2.50 | 211 | 28 | 169 | 49 | 45 | 51 |
| 70% | 3.33 | 185 | - | 154 | 39 | 41 | 50 |
| 80% | 5.00 | 145 | - | 120 | 25 | 35 | 46 |
| 90% | 10.0 | 65 | - | - | 76 | 29 | 42 |
Appendix B
Appendix C
References
- Mohammad, A.W.; Teow, Y.H.; Ang, W.L.; Chung, Y.T.; Oatley-Radcliffe, D.L.; Hilal, N. Nanofiltration membranes review: Recent advances and future prospects. Desalination 2015, 356, 226–254. [Google Scholar] [CrossRef]
- Mohsen, M.S.; Jaber, J.O.; Afonso, M.D. Desalination of brackish water by nanofiltration and reverse osmosis. Desalination 2003, 157, 167. [Google Scholar] [CrossRef]
- Al-Amoudi, A.S.; Farooque, A.M. Performance, restoration and autopsy of NF membranes used in seawater pretreatment. Desalination 2005, 178, 261–271. [Google Scholar] [CrossRef]
- Lopez, J.; Reig, M.; Vecino, X.; Gibert, O.; Cortina, J.L. From nanofiltration membrane permeances to design projections for the remediation and valorisation of acid mine waters. Sci. Total Eviron. 2020, 738, 139780. [Google Scholar] [CrossRef]
- Lopez, J.; Reig, M.; Gibert, O.; Cortina, J.L. Recovery of sulphuric acid and added value metals (Zn, Cu, and rare earths) from acidic mine waters using nanofiltration membranes. Sep. Purif. Technol. 2019, 212, 180–190. [Google Scholar] [CrossRef]
- Voigt, I.; Richter, H.; Weyd, M.; Milew, K.; Haseneder, R.; Günther, C.; Prehn, V. Treatment of oily and salty mining water by ceramic nanofiltration membranes. Chem. Ing. Tech. 2019, 91, 1454–1459. [Google Scholar] [CrossRef]
- Laskowska, E.; Turek, M.; Mitko, K.; Dydo, P. Concentration of mine saline water in high-efficiency hybrid RO-NF system. Desalin. Water Treat. 2018, 128, 414–420. [Google Scholar] [CrossRef]
- Shirazi, S.; Lin, C.J.; Chen, D. Inorganic fouling of pressure-driven membrane processes—A critical review. Desalination 2010, 250, 236–248. [Google Scholar] [CrossRef]
- Sweity, A.; Ronen, Z.; Herzberg, M. Induced organic fouling with antiscalants in seawater desalination. Desalination 2014, 352, 158–165. [Google Scholar] [CrossRef]
- Hao, W.; Yang, M.; Zhao, K.; Tang, J. Dielectric measurements of fouling of nanofiltration membranes by sparingly soluble salts. J. Membr. Sci. 2016, 497, 339–347. [Google Scholar] [CrossRef]
- Meng, X.; Yang, R.; Zhang, X. Enhanced gypsum scaling by organic fouling layer on nanofiltration membrane: Characteristics and mechanisms. Water Res. 2016, 91, 203–213. [Google Scholar]
- Chesters, S.P. Innovations in the inhibition and cleaning of reverse osmosis membrane scaling and fouling. Desalination 2009, 238, 22–29. [Google Scholar] [CrossRef]
- Shih, W.Y.; Gao, J.; Rahardianto, A.; Glater, J.; Cohen, Y.; Gabelich, C.J. Ranking of antiscalant performance for gypsum scale suppression in the presence of residua aluminum. Desalination 2006, 196, 280–292. [Google Scholar] [CrossRef]
- Al-Amoudi, A.; Lovitt, R.W. Fouling strategies and the cleaning system of NF membranes and factors affecting cleaning efficiency. J. Membr. Sci. 2007, 303, 4–28. [Google Scholar] [CrossRef]
- Tomaszewska, B.; Kmiecik, E.; Wątor, K.; Tyszer, M. Use of numerical modelling in the prediction of membrane scaling. Reaction between antiscalants and feedwater. Desalination 2018, 427, 27–34. [Google Scholar] [CrossRef]
- Turek, M.; Waś, J.; Mitko, K. Scaling prediction in electrodialytic desalination. Desalin. Water Treat. 2012, 44, 255–260. [Google Scholar] [CrossRef]
- Mitko, K.; Turek, M. Concentration distribution along the electrodialyzer. Desalination 2014, 341, 96–100. [Google Scholar] [CrossRef]
- Vieira, G.S.; Moreira, F.K.V.; Matsumoto, R.L.S.; Michelon, M.; Filho, F.M.; Hubinger, M.D. Influence of nanofiltration membrane features on enrichment of jussara ethanolic extract (Euterpe edulis) in anthocyanins. J. Food Eng. 2018, 226, 31–41. [Google Scholar] [CrossRef]
- Imbrogno, A.; Schäfer, A.I. Comparative study of nanofiltration membrane characterization devices of different dimension and configuration (cross flow and dead end). J. Membr. Sci. 2019, 585, 67–80. [Google Scholar] [CrossRef]
- Noble, R.; Stern, S. Membrane Separations Technology: Principles and Applications, 3rd ed.; Elsevier Science: Amsterdam, The Netherlands, 1995; pp. 51–52. [Google Scholar]
- Li, Y.-H. Diffusion of ions in sea water and deep-sea sediments. Geochim. Cosmochim. 1974, 38, 703–714. [Google Scholar]
- Packter, A. The precipitation of sparingly soluble alkaline-earth metal and lead salts: Nucleation and growth orders during the induction period. J. Chem. Soc. A 1968, 0, 859–862. [Google Scholar] [CrossRef]
- Lancia, A.; Musmarra, D.; Prisciandaro, M. Measuring induction period for calcium sulfate dihydrate precipitation. AIChE J. 1999, 45, 390–397. [Google Scholar] [CrossRef]
- Prisciandaro, M.; Lancia, A.; Musmarra, D. Calcium sulfate dihydrate nucleation in the presence of calcium and sodium chloride salts. Ind. Eng. Chem. Res. 2001, 40, 2335–2339. [Google Scholar] [CrossRef]
- Parkhurst, D.L.; Appelo, C.A.J. Chapter A43: Description of input and examples for PHREEQC version 3—A computer program for speciation, batch-reaction, one-dimensional transport, and inverse geochemical calculations. In U.S. Geological Survey Techniques and Methods; Book 6; US Geological Survey: Reston, VA, USA, 2013; p. 497. [Google Scholar]
- ROSA. Available online: http://web.archive.org/web/20100723021839/http://www.dow.com/liquidseps/design/rosa.htm (accessed on 13 August 2020).
- Hilal, N.; Al-Zoubi, H.; Mohammad, A.W.; Darwish, N.A. Nanofiltration of highly concentrated salt solutions up to seawater salinity. Desalination 2005, 184, 315–326. [Google Scholar] [CrossRef]
- Kelewou, H.; Lhassani, A.; Merkouzi, M.; Drogui, P.; Sellamuthu, B. Salt retention by nanofiltration membranes: Physicochemical and hydrodynamic approaches and modelling. Desalination 2011, 277, 106–112. [Google Scholar] [CrossRef]
- Turek, M.; Mitko, K.; Laskowska, E.; Chorążewska, M.; Piotrowski, K.; Jakóbik-Kolon, A.; Dydo, P. Energy Consumption and Gypsum Scaling Assessment in a Hybrid Nanofiltration- Reverse Osmosis-Electrodialysis system. Chem. Eng. Technol. 2018, 41, 392–400. [Google Scholar] [CrossRef]


| Mine Water | Langelier Saturation Index (LSI) | Gypsum Saturation | Concentration, g/L | ||||
|---|---|---|---|---|---|---|---|
| Cl− | SO42− | Na+ | Mg2+ | Ca2+ | |||
| A | −2.4 | 34% | 0.384 | 1.02 | 0.107 | 0.142 | 0.312 |
| B | −2.0 | 11% | 33.2 | 0.937 | 19.5 | 0.990 | 0.771 |
| NFX 1 | NFDL 1 | NF270 1 | |
|---|---|---|---|
| Supplier | Synder Filtration | Suez | Dow FilmTec |
| Maximum Operating Temperature, °C | 50 | 50 | 45 |
| pH range | 3–10.5 | 3–9 | 2–11 |
| Minimum MgSO4 rejection, % | 99 | 96 | 99.2 |
| Membrane material | Polyamide thin-film composite | Polyamide thin-film composite | Polyamide thin-film composite |
| Isoelectric point | 3.2 | 4 | 3.0 |
| Molecular weight cut-off, Da | 150–300 | 150–300 | 200–400 |
| Average pore width, nm | n/a | 9.6 [18] | 7.9 [18] |
| Contact angle, ° | n/a | 37.9 [18] | 15.9 [18] |
| Y, % | tind, s | |||||
|---|---|---|---|---|---|---|
| NF270 “A” | NFX “A” | NFDL “A” | NF270 “B” | NFX “B” | NFDL “B” | |
| 65 | 28,560 | 48,900 | 27,180 | 1,156,440 | 1,403,220 | 657,900 |
| 70 | 11,100 | 20,760 | 10,440 | 283,320 | 348,900 | 126,780 |
| 75 | 3648 | 7560 | 3384 | 53,340 | 65,880 | 15,540 |
| 80 | 930 | 2202 | 846 | 7080 | 8520 | 894 |
| 85 | 153.6 | 447 | 136.8 | 560.4 | 648 | 12.24 |
| 90 | 10.8 | 46.62 | 9.18 | 19.2 | 20.7 | 4.60 × 10⁻³ |
| Membrane Type | ||||||
|---|---|---|---|---|---|---|
| NF270 “A” | NFX “A” | NFDL “A” | NF270 “B” | NFX “B” | NFDL “B” | |
| Maximum allowable recovery [%] | 90.1 | 91.6 | 89.8 | 89.3 | 89.5 | 84.6 |
Publisher’s Note: MDPI stays neutral with regard to jurisdictional claims in published maps and institutional affiliations. |
© 2020 by the authors. Licensee MDPI, Basel, Switzerland. This article is an open access article distributed under the terms and conditions of the Creative Commons Attribution (CC BY) license (http://creativecommons.org/licenses/by/4.0/).
Share and Cite
Mitko, K.; Laskowska, E.; Turek, M.; Dydo, P.; Piotrowski, K. Scaling Risk Assessment in Nanofiltration of Mine Waters. Membranes 2020, 10, 288. https://doi.org/10.3390/membranes10100288
Mitko K, Laskowska E, Turek M, Dydo P, Piotrowski K. Scaling Risk Assessment in Nanofiltration of Mine Waters. Membranes. 2020; 10(10):288. https://doi.org/10.3390/membranes10100288
Chicago/Turabian StyleMitko, Krzysztof, Ewa Laskowska, Marian Turek, Piotr Dydo, and Krzysztof Piotrowski. 2020. "Scaling Risk Assessment in Nanofiltration of Mine Waters" Membranes 10, no. 10: 288. https://doi.org/10.3390/membranes10100288
APA StyleMitko, K., Laskowska, E., Turek, M., Dydo, P., & Piotrowski, K. (2020). Scaling Risk Assessment in Nanofiltration of Mine Waters. Membranes, 10(10), 288. https://doi.org/10.3390/membranes10100288