2.1. Processing Scenarios
The process flow diagrams of the scenarios are presented in
Figure 1 and
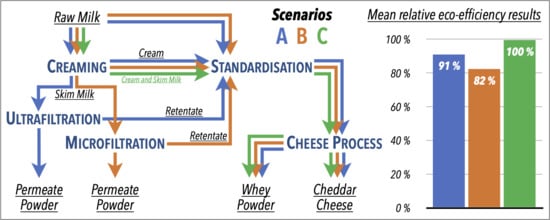
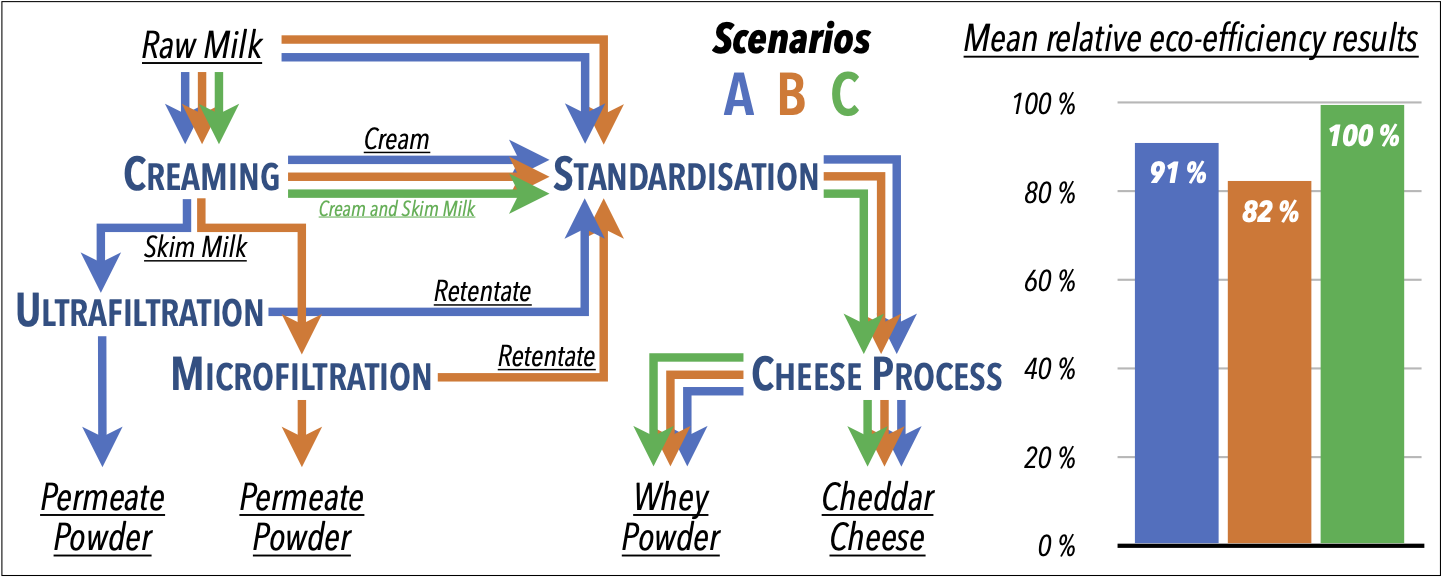
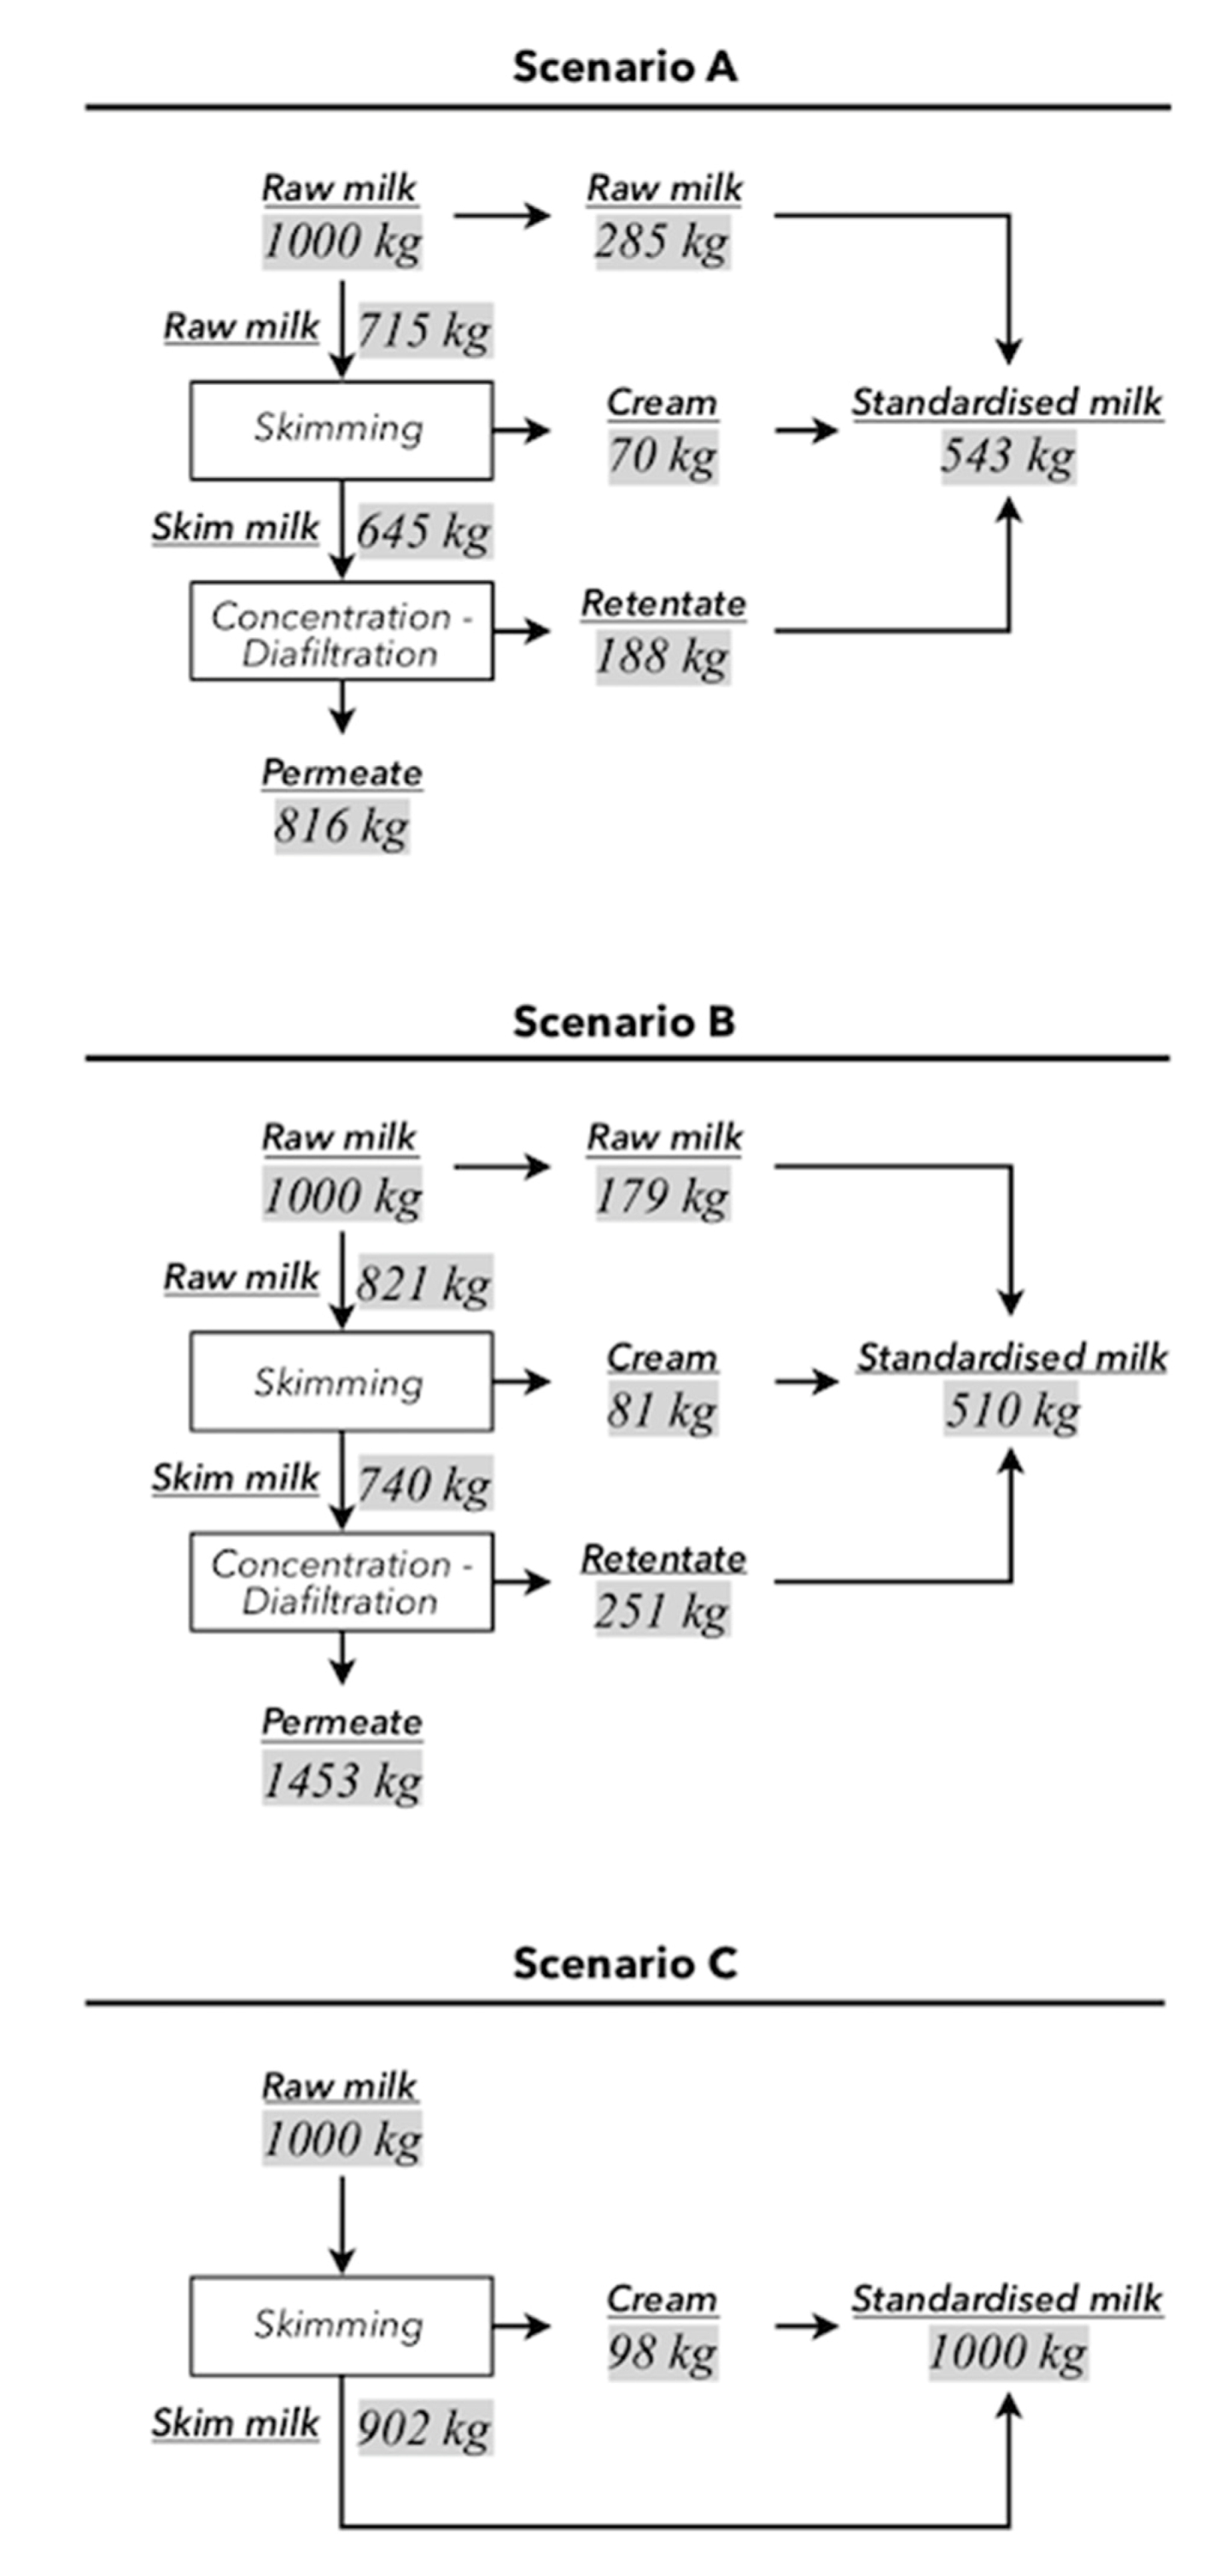
Figure 2. Three scenarios (A, B, and C) of the dairy process for manufacturing cheddar were compared. After receiving the raw milk, cheese milk was standardized using either UF (scenario A), MF (scenario B), or no membrane separation processes (scenario C). The EE of the three scenarios was assessed from “cradle-to-gate”: from raw milk production to the exit gate of the dairy processing plant where the cheddar is ready for distribution. All dimensions related to the life cycle of raw milk production, transport, and subsequent dairy processing operations were accounted for. The transport, distribution, and consumption of the finished products stages—which are common to the three scenarios—were excluded from this comparative EE assessment. All stages of the life cycle were deemed to take place in the province of Québec (Canada) and the transport distance of raw milk from dairy farms to cheesemaking plants was fixed at 70 km. Each scenario was divided into several production units: a cheese milk standardization unit, a cheesemaking process unit, and a whey valorization unit. A permeate valorization unit was also included in scenarios A and B.
Cheese milk standardization begins with receiving the raw milk at 4 °C and ends with the production of cheese milk with standardized protein and fat contents. The three scenarios shared the same raw milk composition: 3.97% fat (TF), 3.27% true proteins (TP), 4.81% lactose, and 0.75% salts (w·w
−1) [
16]. After standardization, the casein-to-fat ratio (CN/TF) of cheese milk agreed with Ong et al. [
10], at 0.67–0.72. In scenarios A and B, the standardization process also allowed for an increase in the cheese milk protein content to 5.93% (w/w), as per Oommen et al. [
17].
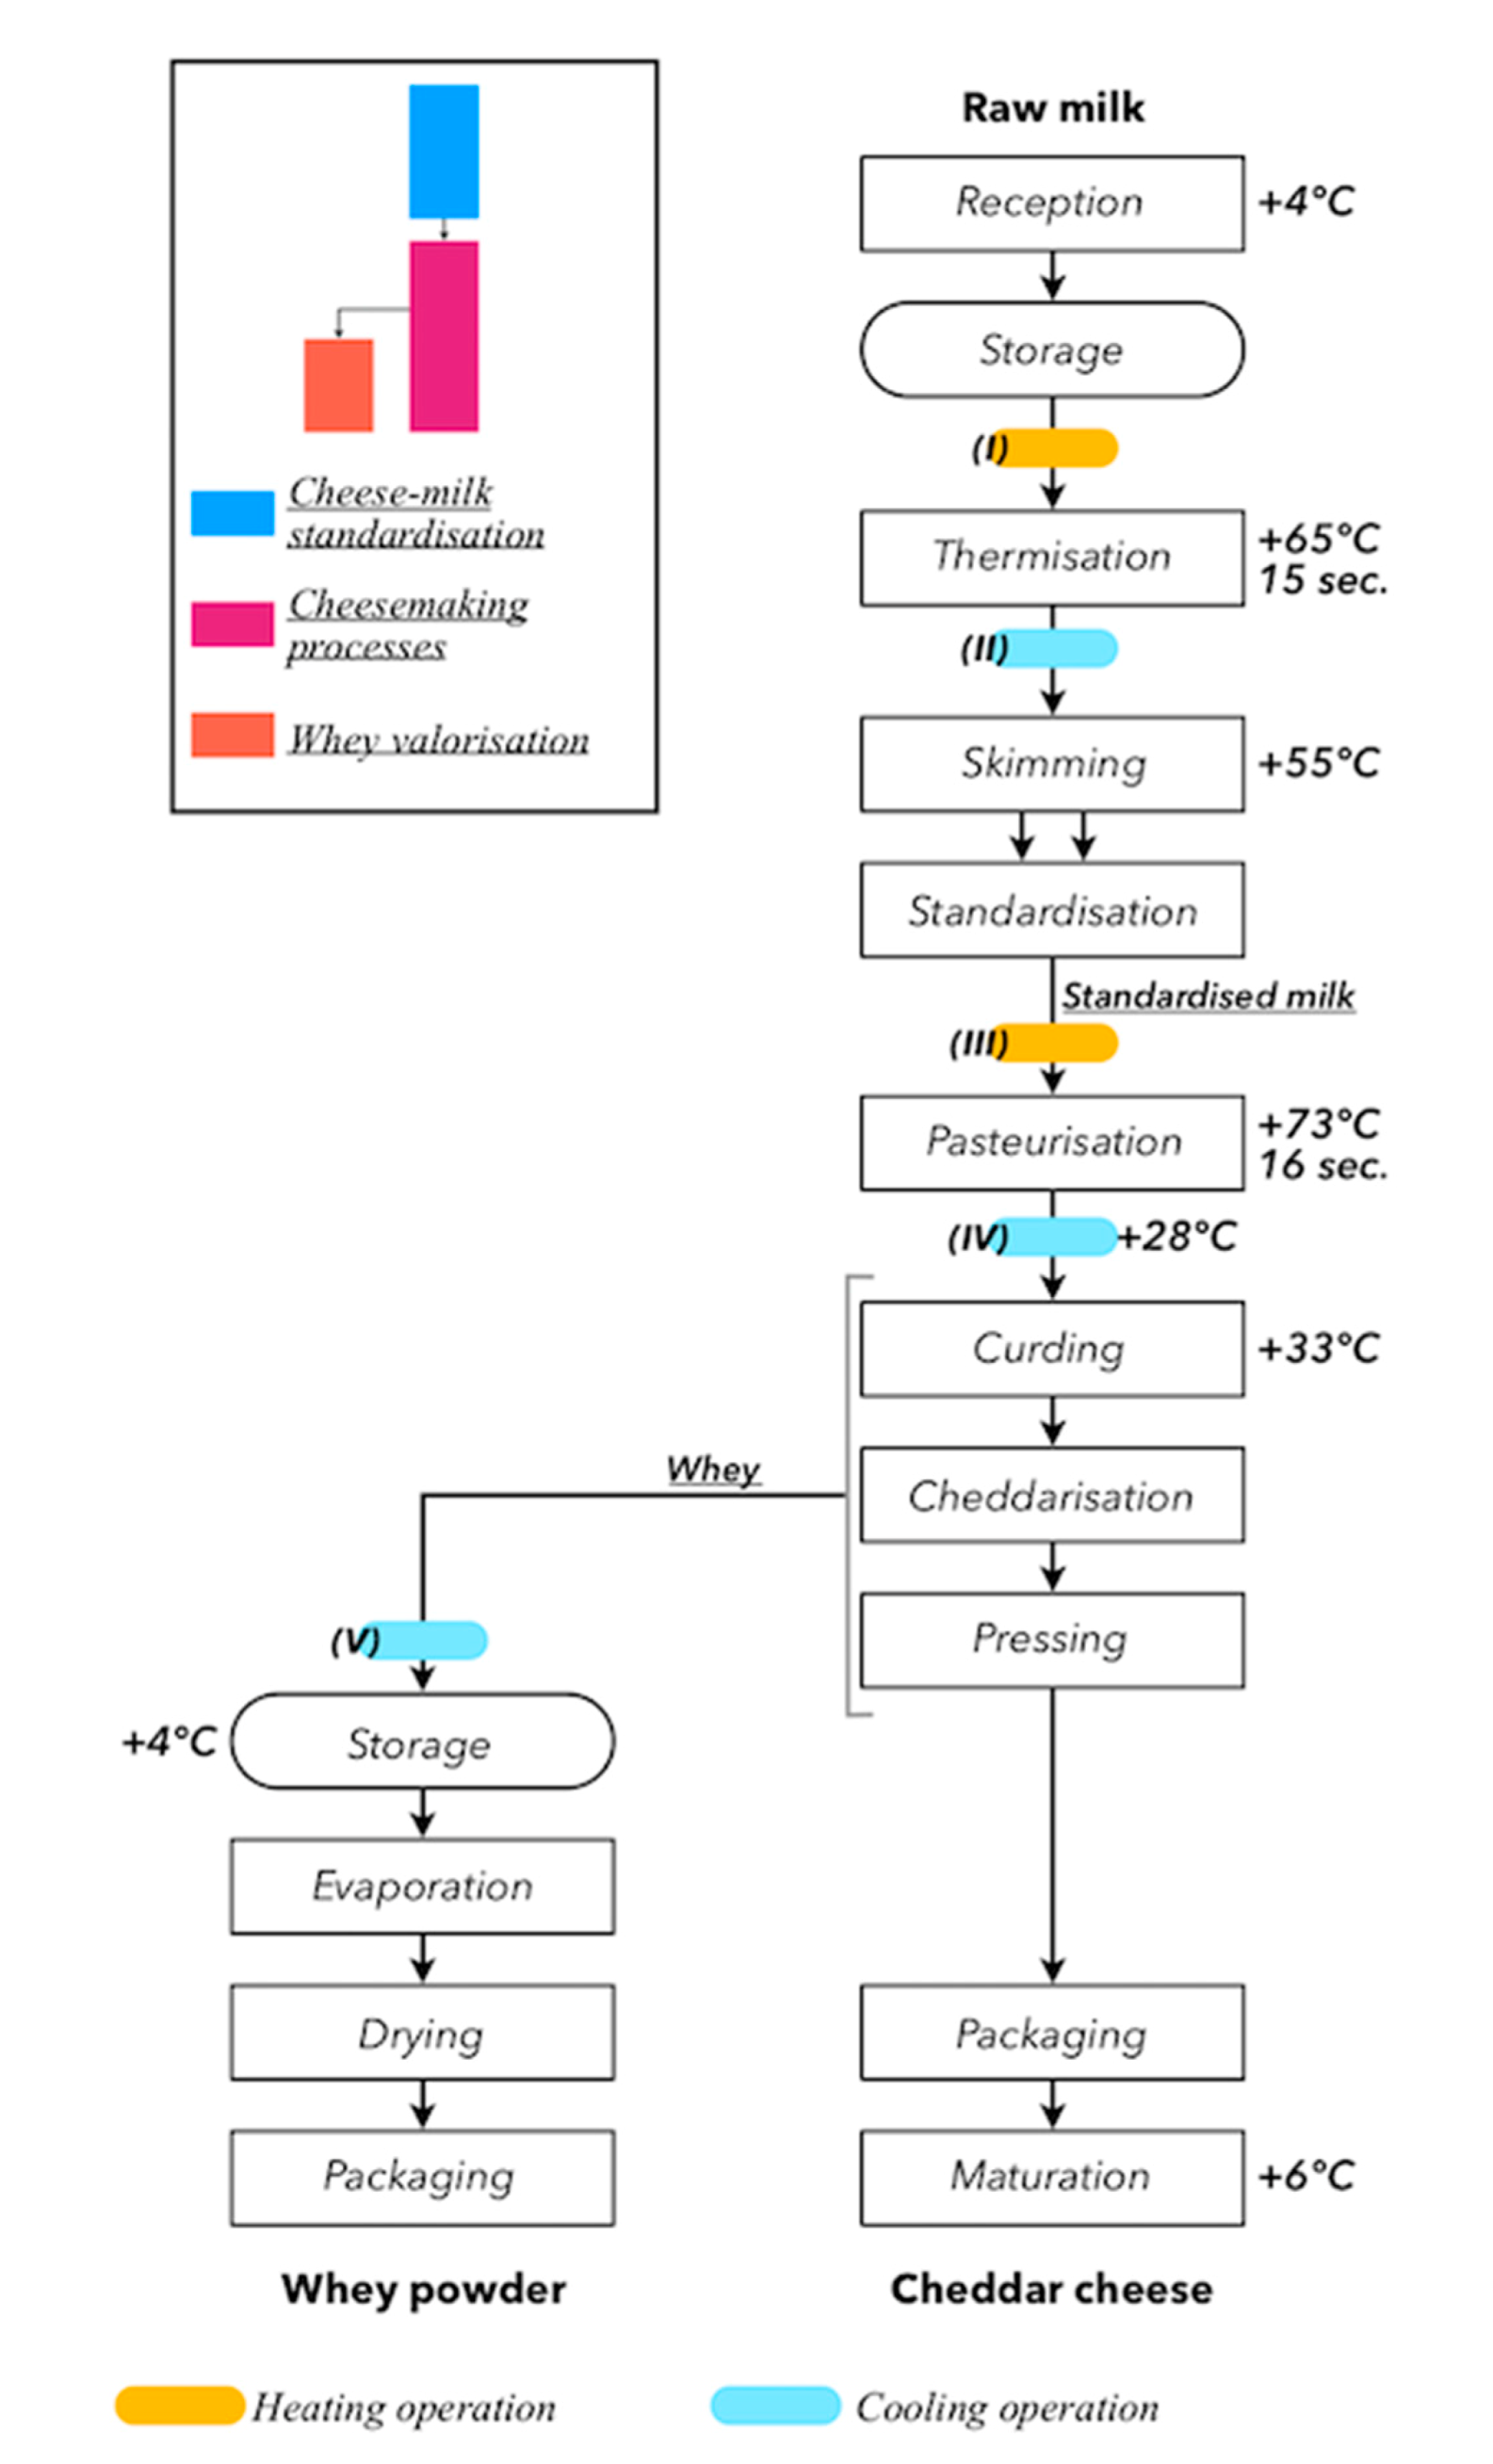
The cheese milk standardization step of scenario C corresponded to that described by TetraPak [
18]: 100% of the raw milk was skimmed prior to standardization (
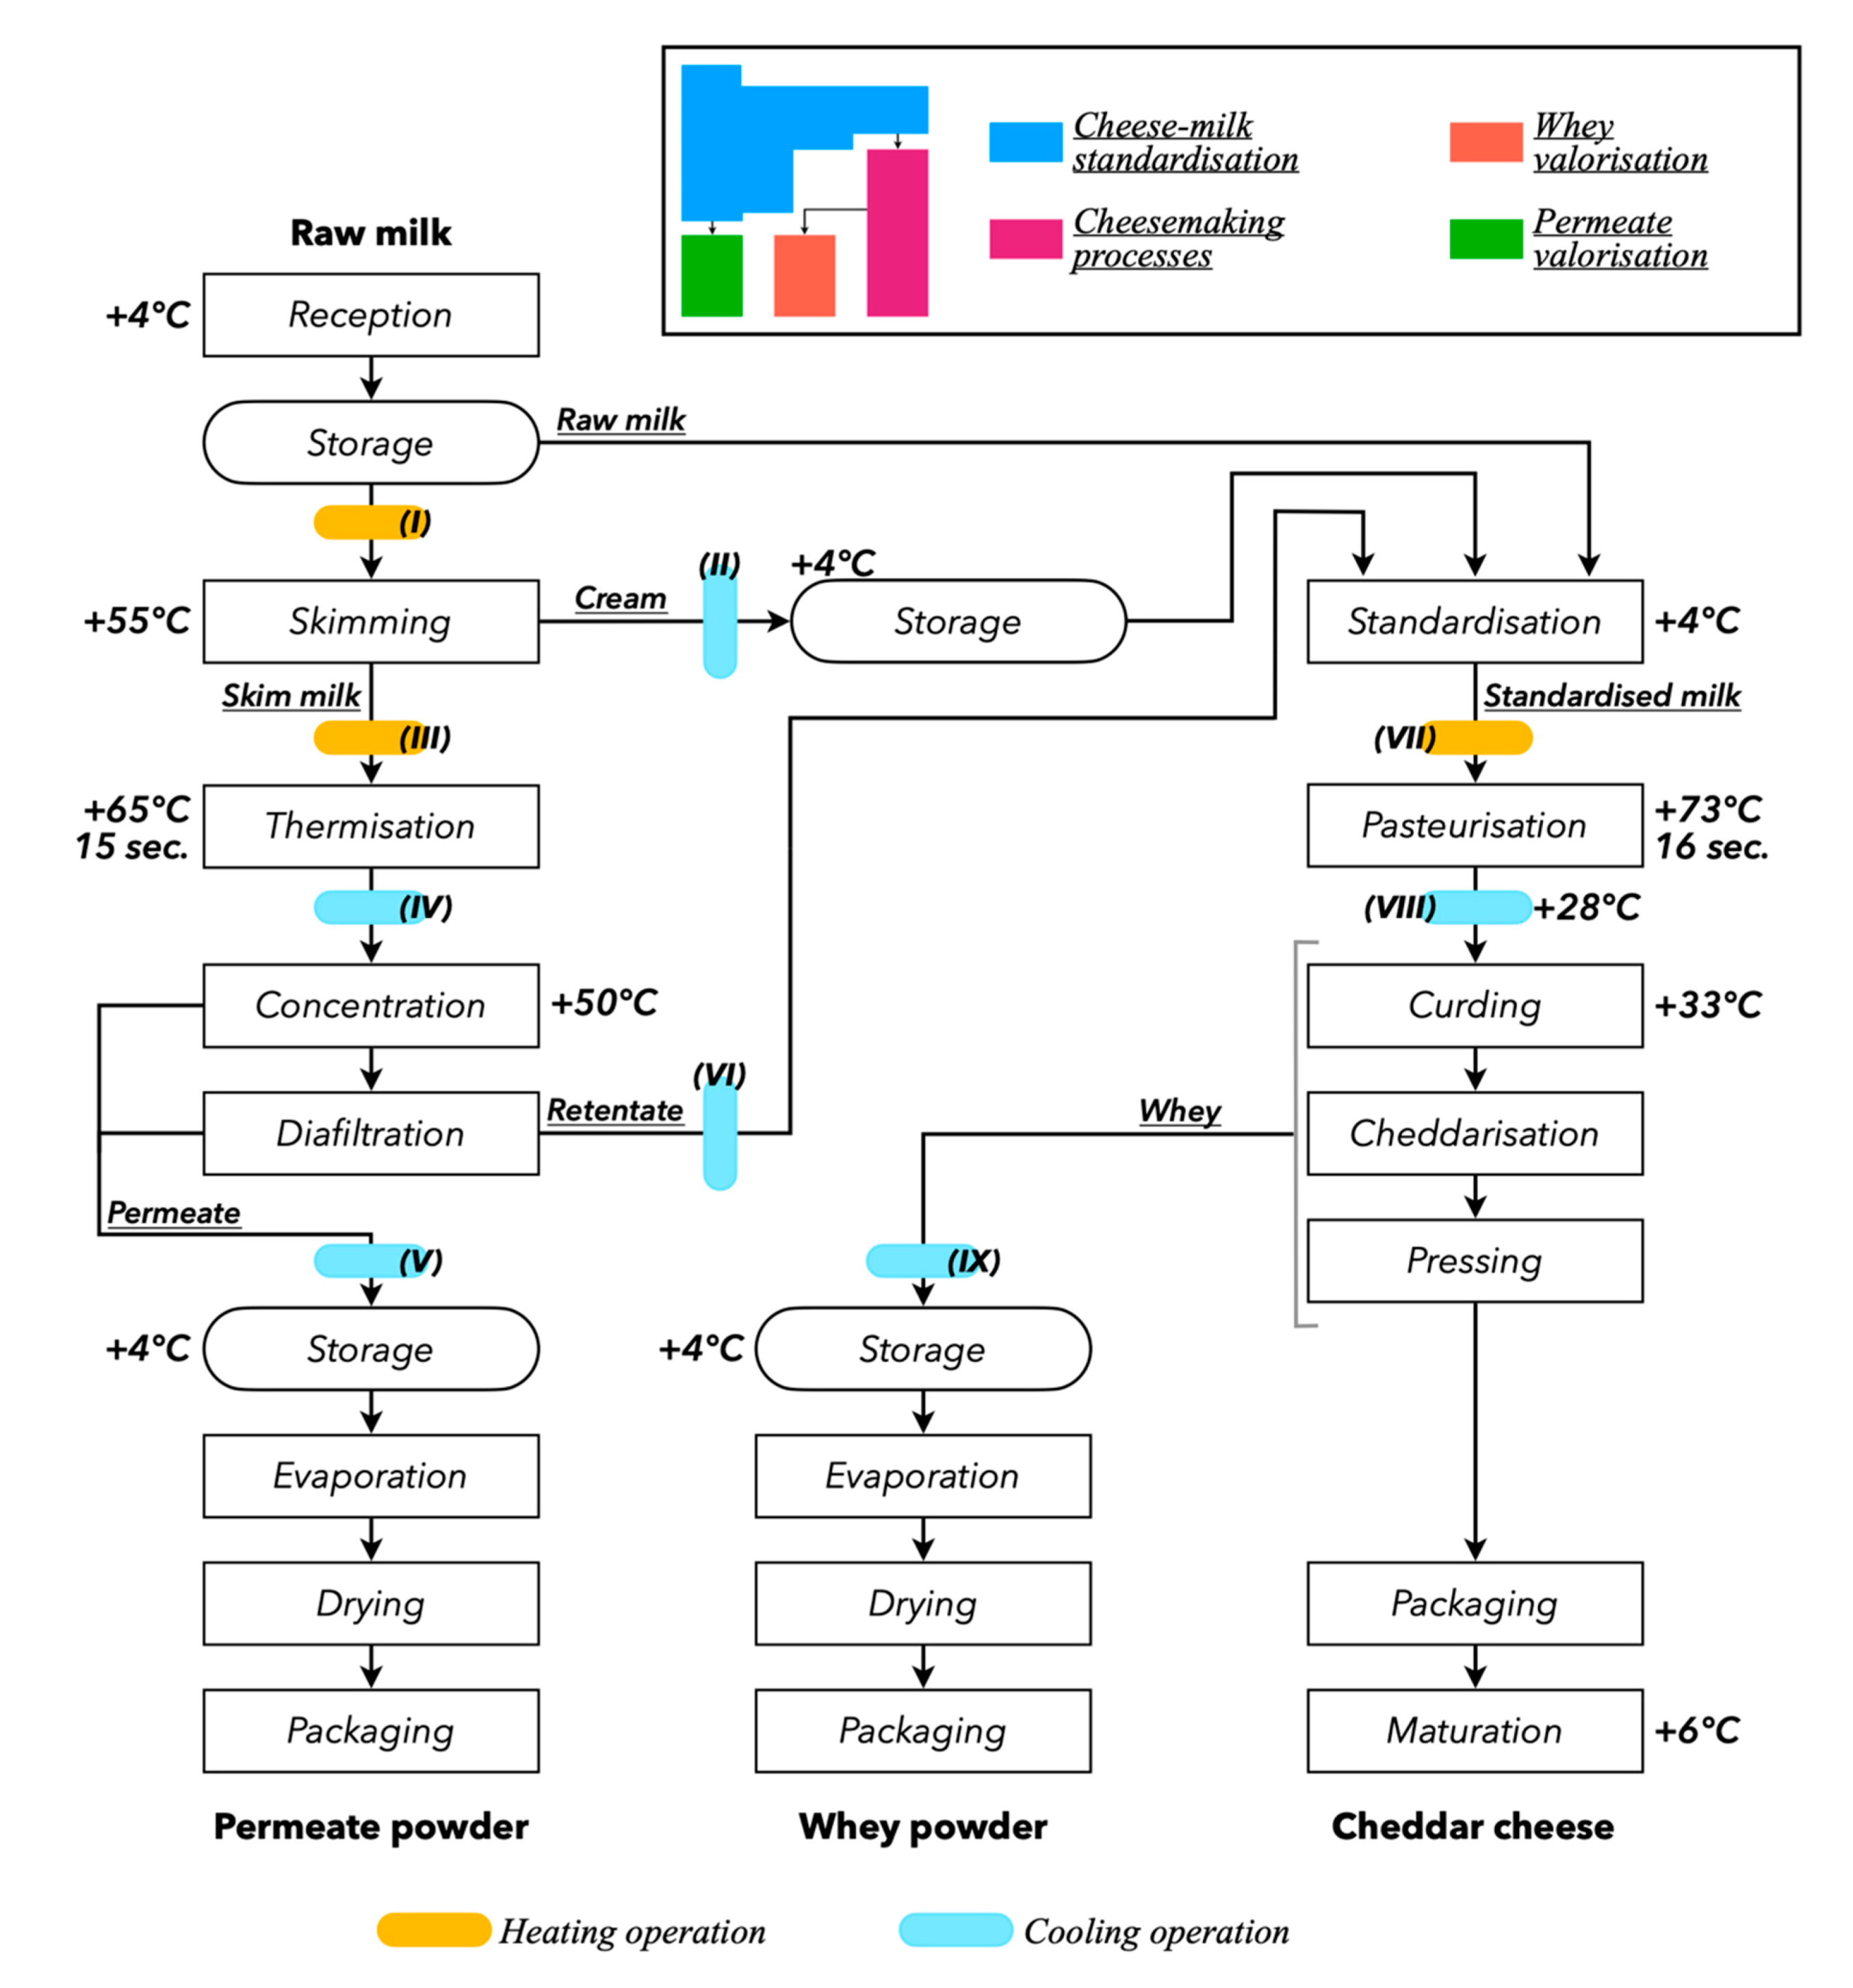
Figure 2). In scenarios A and B, only a portion of the raw milk was skimmed: raw milk, cream, and the retentate generated from the membrane separation processes performed on skim milk (SM) were combined at the standardization stage (
Figure 1). All SM generated at the skimming stage was sent to the membrane separation processes for concentration and diafiltration (DF). The membrane separation processes described in Gavazzi-April et al. [
19] was used for scenario A, and the membrane separation processes described in Mercier-Bouchard et al. [
12] was used for scenario B. In scenario A, SM was concentrated to a volume concentration factor (VCF) of 3.5 then continuous DF with 2.0 diavolumes (DV) was performed—the diavolume is the ratio of the volume of consumed diluent to the volume of treated retentate [
20]. These two steps were carried out with UF spiral-wound membranes with molecular weight cut-offs (MWCOs) of 10 kDa. In scenario B, concentration and DF were performed with MF spiral-wound membranes with a pore size of 0.1 µm. SM was concentrated to a VCF of 3.0 and two discontinuous DF of 2.0 DV were performed. In both scenarios, concentration and DF were carried out at 50 °C. For scenario B, the protein rejection coefficients obtained by Mercier-Bouchard et al. [
12] were used in the mass balance calculations. In scenario A, and in agreement with El-Gazzar et al. [
9], total CN retention was considered.
The three scenarios shared the same constraints: the CN/TF ratio of the standardized cheese milk was kept between 0.67 and 0.72, no overage of cream or SM was generated, and for scenarios A and B, 100% of the retentate was used for cheese milk standardization. This generated only one product at the standardization step: a cheese milk with standard protein and fat contents. However, a byproduct was obtained from cheese milk standardization in scenarios A and B: the permeate from concentration and DF.
The cheesemaking process after the cheese milk standardization step was identical in the three scenarios and corresponded to that described by TetraPak [
18] and Fox et al. [
16] for the manufacture of cheddar. As detailed by Oommen et al. [
17], the following ingredients were used during the cheesemaking process: 0.4 mL of calcium chloride 45% w·w
−1 per kg of cheese milk, 0.03 mL of annatto colorant per kg of cheese milk, 8.26 g starter culture per kg of protein in cheese milk, 0.11 mL of microbial coagulant enzyme per kg of cheese milk, and 1.90% w·w
−1 of salt per kg of curd. Cheese blocks of 18 kg were obtained following pressing [
21]. They were vacuum-packed in polyethylene (PE) films and stored at 6 °C for 8 months [
16].
The whey drained during the cheesemaking process was valorized into whey powder (WP). This step was identical in all scenarios and used the process described by Schuck et al. [
22]: the conversion from liquid whey to WP was carried out using a multistage evaporator and a spray drier. Similarly, the permeate generated by scenarios A and B was valorized into permeate powder. WP and permeate powder were packed in paper bags lined with an inner PE bag [
23,
24] that could hold 25 kg of powder.
The following parameters were the same for the three scenarios: 1500 m3 of raw milk were received and each processing plant operated for 20 h, daily. Cleaning and sanitation procedures were carried out during the four remaining hours of the day.
2.2. Eco-Efficiency Assessment of the Scenarios
The EE assessments of the scenarios were carried out using the software presented in Benoit et al. [
15]. Five eco-efficiency indicators (EEI) were therefore calculated. Four were related to environmental damage and used the Impact2002+ impact analysis method [
25]:
- -
EEI1: Net margin generated per unit of damage to the human health (HH) category,
- -
EEI2: Net margin generated per unit of damage to the ecosystem quality (EQ) category,
- -
EEI3: Net margin generated per unit of damage to the climate change (CC) category,
- -
EEI4: Net margin generated per unit of damage to the non-renewable resources (R) category.
One EEI was related to electricity consumption (EC) at the processing stage [
15]:
- -
EEI5: Net margin generated per unit of electricity consumed at the processing stage.
Since the software was not fitted with constrained optimization features, dimensioning and researching operational settings of all the process elements was required before modeling the three scenarios.
As per the constraints previously described, the dimensioning of the process elements was based on the distribution of raw milk at the cheese milk standardization step—the dimensioning of the process elements was thus different for each scenario. In scenarios A and B, the amounts of cream and retentate generated depended on the share of raw milk sent to the skimming step. That share was calculated using an iterative approach in which it was gradually increased until the protein content of the cheese milk reached 5.93% w·w
−1. Following the reasoning for the fluid distribution, each process element was dimensioned to cope with the productivity of the processing paths. The plate heat exchangers (nine in scenarios A and B and five in scenario C) were dimensioned and configured to maximize heat regeneration, to minimize the heat transfer surface, pressure losses, and energy use, and to keep the residence time under 10 s. The hydraulic network was dimensioned to maintain the fluid velocity under 3.5 m·s
−1, as recommended by TetraPak [
18]. A natural gas-fired boiler produced the steam used in the production of hot water at 75 °C, and a cooling unit produced water at 2 °C using a water-cooled condenser combined with a cooling tower (as described by TetraPak [
18]). As per Benoit et al. [
15], the configuration of the cleaning unit was done in accordance with data presented by Yee et al. [
26].
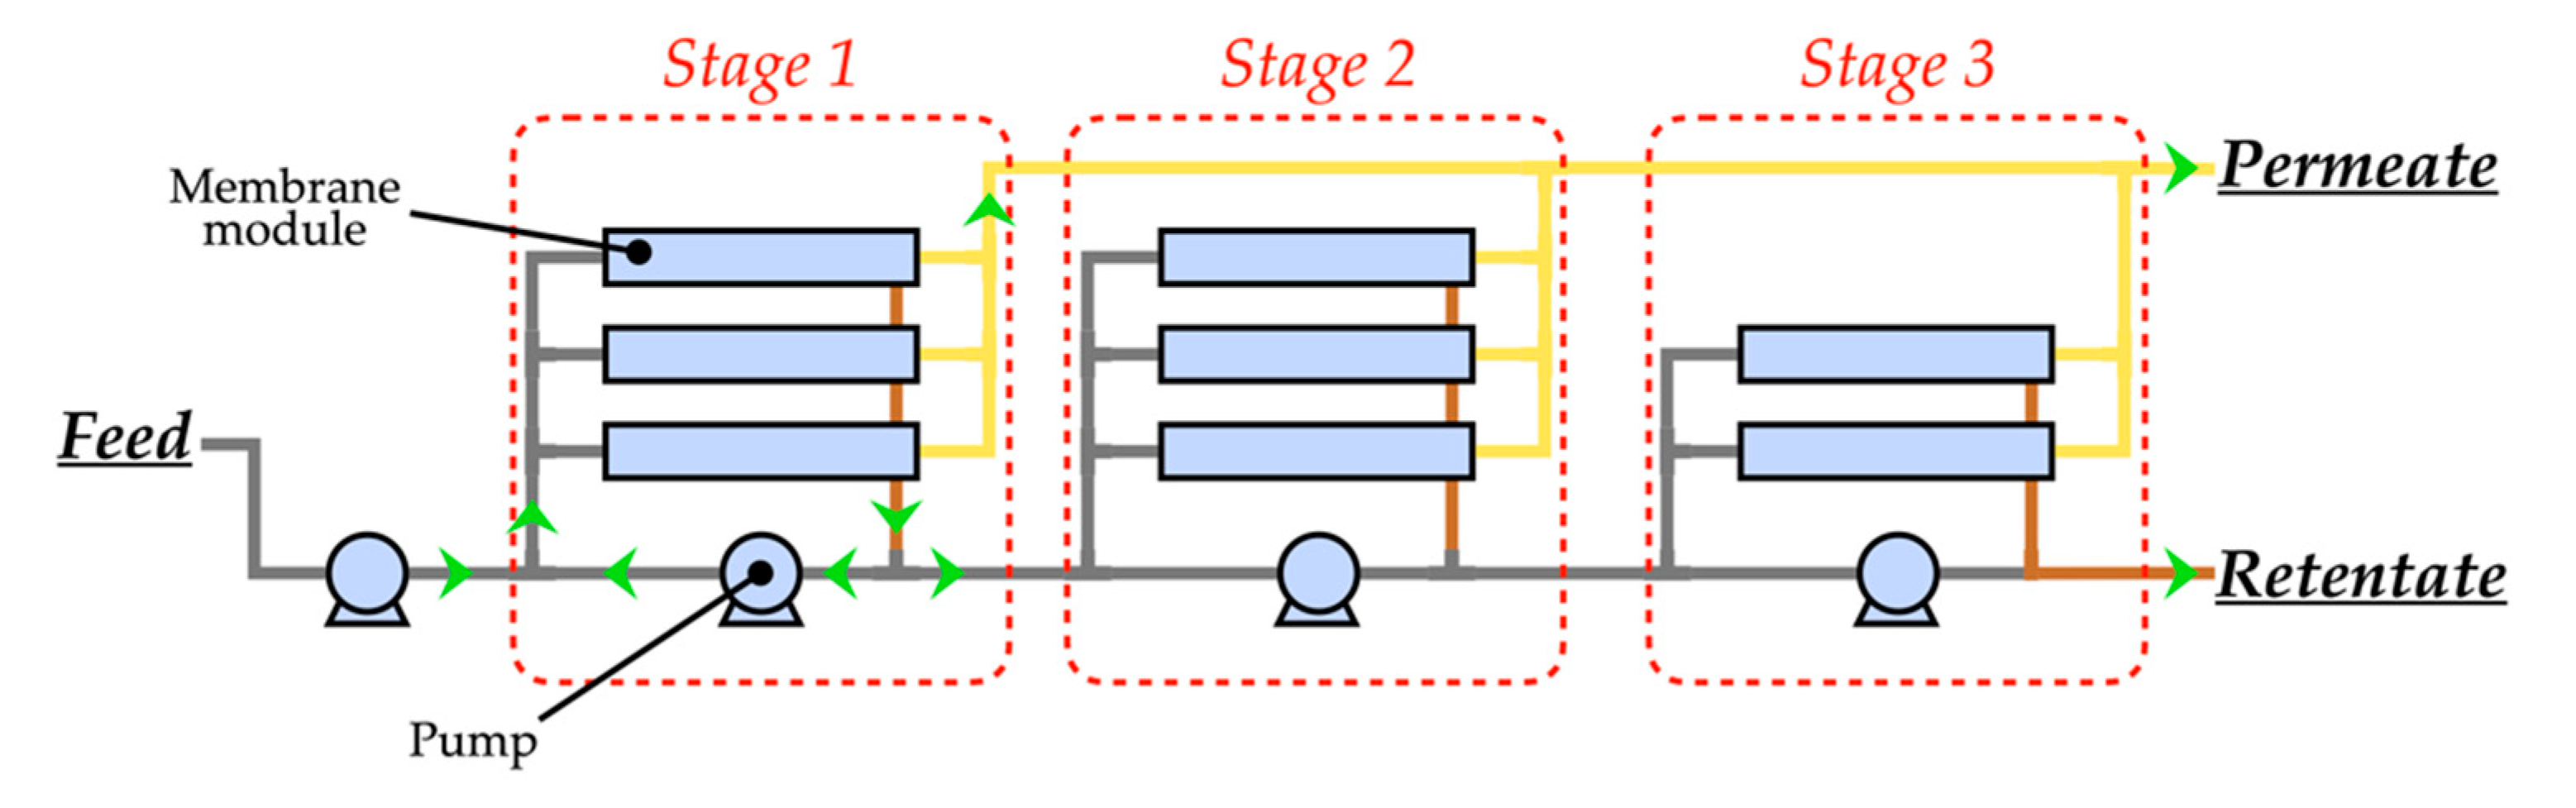
2.3. Modeling of the Membrane Separation Process
Membrane separation processes were modeled using the method suggested by Cheryan [
27] and Global Engineering Alliance (GEA) [
28] and described in this section. This method uses filtration flux datasets to dimension a filtration unit to the desired productivity. Filtration datasets were obtained from Gavazzi-April et al. [
19] and Mercier-Bouchard et al. [
12] (UF and MF, respectively—experiments carried out at the pilot scale in the batch mode). These data showed the evolution of the permeation flux (
J) as a function of the VCF. They made it possible to determine the relation between (1/
J) and (
QFeed/VCF). With
QFeed the required feed flow rate of the filtration unit (m
3·h
−1)—as determined from the fluid distribution calculations—and J the permeation flux (m
3·h
−1·m
−2) from the collected filtration data. When choosing a
VCF lower than the final
VCF value, the calculation of (
QFeed/ VCF) led to the corresponding (1/
J) value. The (1/
J) value was either already known from the collected filtration data for that (
QFeed/VCF) value, or it was calculated by linear interpolation between two existing coordinates. Equations (1), (2), and (3) (which are basic definitions of membrane separation processes concepts, valid at any time during a filtration) then made it possible to calculate the required membrane area of each stage:
(when ignoring density differences between feed, retentate, and permeate)
where
QRet and
QPerm are the retentate and permeate flow rates (m
3·h
−1), respectively, and
S is the membrane area required for this stage (m
2).
From these equations, the required membrane area for the stage can be calculated using the feed flow rate (
QFeed) and the coordinates (
QFeed/VCF; 1/
J) previously determined:
The retentate flow rate of the stage was then calculated using Equation (3). By definition, this flow rate is the feed flow rate of the following stage. The same strategy was then implemented from the beginning, adjusting the VCF of each stage, until the final VCF was reached.
This method was implemented for the dimensioning of the filtration units corresponding to the concentration steps of scenarios A and B (final VCF = 3.5 and 3.0, respectively), and for the DF steps of scenario B (two discontinuous DF, each with 2.0 DV). As suggested by Lutz [
29], a linear extrapolation method was used to model the continuous DF (two DV) of scenario A. Although the VCF and DF settings for producing cheese milk intended for cheddar production were non-optimal, this membrane separation processes modeling method can only be implemented using data collected from filtration operations. It is therefore necessary to conform to the filtration data available at the time the process simulations were carried out. It is also worth mentioning that, if available, filtration datasets corresponding to a VCF of 2.8 and a DF of 0.2 DV would have been more suited for cheese milk production. The EC of the membrane separation processes were calculated by summing the consumptions of the electric motor driving the pumps at each stage. These were calculated from the feed flow rate of the stage, the inlet pressure of the membrane modules (in accordance with the pilot scale experiments), and the mechanical efficiencies of the pumps and motors.
2.4. Modelling of Cheesemaking, Evaporation, and Drying Processes
The targeted moisture content of the cheeses produced in the three scenarios was 36% w·w
−1. Cheese yields were calculated using the modified Van Slyke formula (Equation (5)) suggested by Mullan [
30] to predict the cheddar manufacturing yield:
where
M is the mass (kg) of cheddar obtained per ton of standardized cheese milk (moisture content of 36% w·w
−1), and %
TF and %
CN are the percentage (w·w
−1) of
TF and
CN, respectively, in the standardized cheese milk.
Using the same equation for cheddar production from cheese milk standardized with UF retentate (
CN/
TF ratio of 0.70, and
CN concentration of 5.95% w·w
−1), the yields predicted by Oommen et al. [
17] had a confidence interval of 98.6%.
Mass and energy balances for the curding, cheddaring, pressing, and conditioning steps were calculated from the data presented by Sun et al. [
21] and TetraPak [
31,
32].
The energy consumption of the vacuum evaporation step and the drying step of the whey and permeate were predicted using the results obtained by Schuck et al. [
22] through process simulation.
2.5. Economic Parameters
The economic data related to production costs are presented in
Table 1. Most of these data are the mean values of the rates applied in Québec or Canada between the years 2014 and 2018 (for transport, electricity, natural gas, wastewater treatment, building, industrial equipment, and human resources).
To prevent the introduction of biases, the costs of the membrane modules correspond to the prices indicated in Alfa Laval’s catalogue [
39] for spiral wound modules with the same specifications as the membranes used in this study. Each module was given a lifetime of 18 months.
The cost of raw milk was based on its composition and the rates of Québec class 3b1: cheddar cheese and related cheeses [
33].
A mean cost was selected for fresh water. In Québec, for the majority of residential, commercial or industrial consumers, fresh water is indirectly charged through the municipal taxes without measurement of the volume consumed [
37,
50]. Taking all sectors into consideration, 95% of Canadian manufacturers use surface or ground water pumping to self-supply [
51]. For the three scenarios, a mean cost of
$0.53 CAD per m
3 of water consumed was set, as per MAMROT [
37].
Since Canadian market selling prices for the cheese and powders were not available, the selling prices were set from the data available on the American market [
52]. The cost of American class III milk (cheese class) was significantly lower at
$0.36 CAD·kg
−1 versus
$0.81 CAD·kg
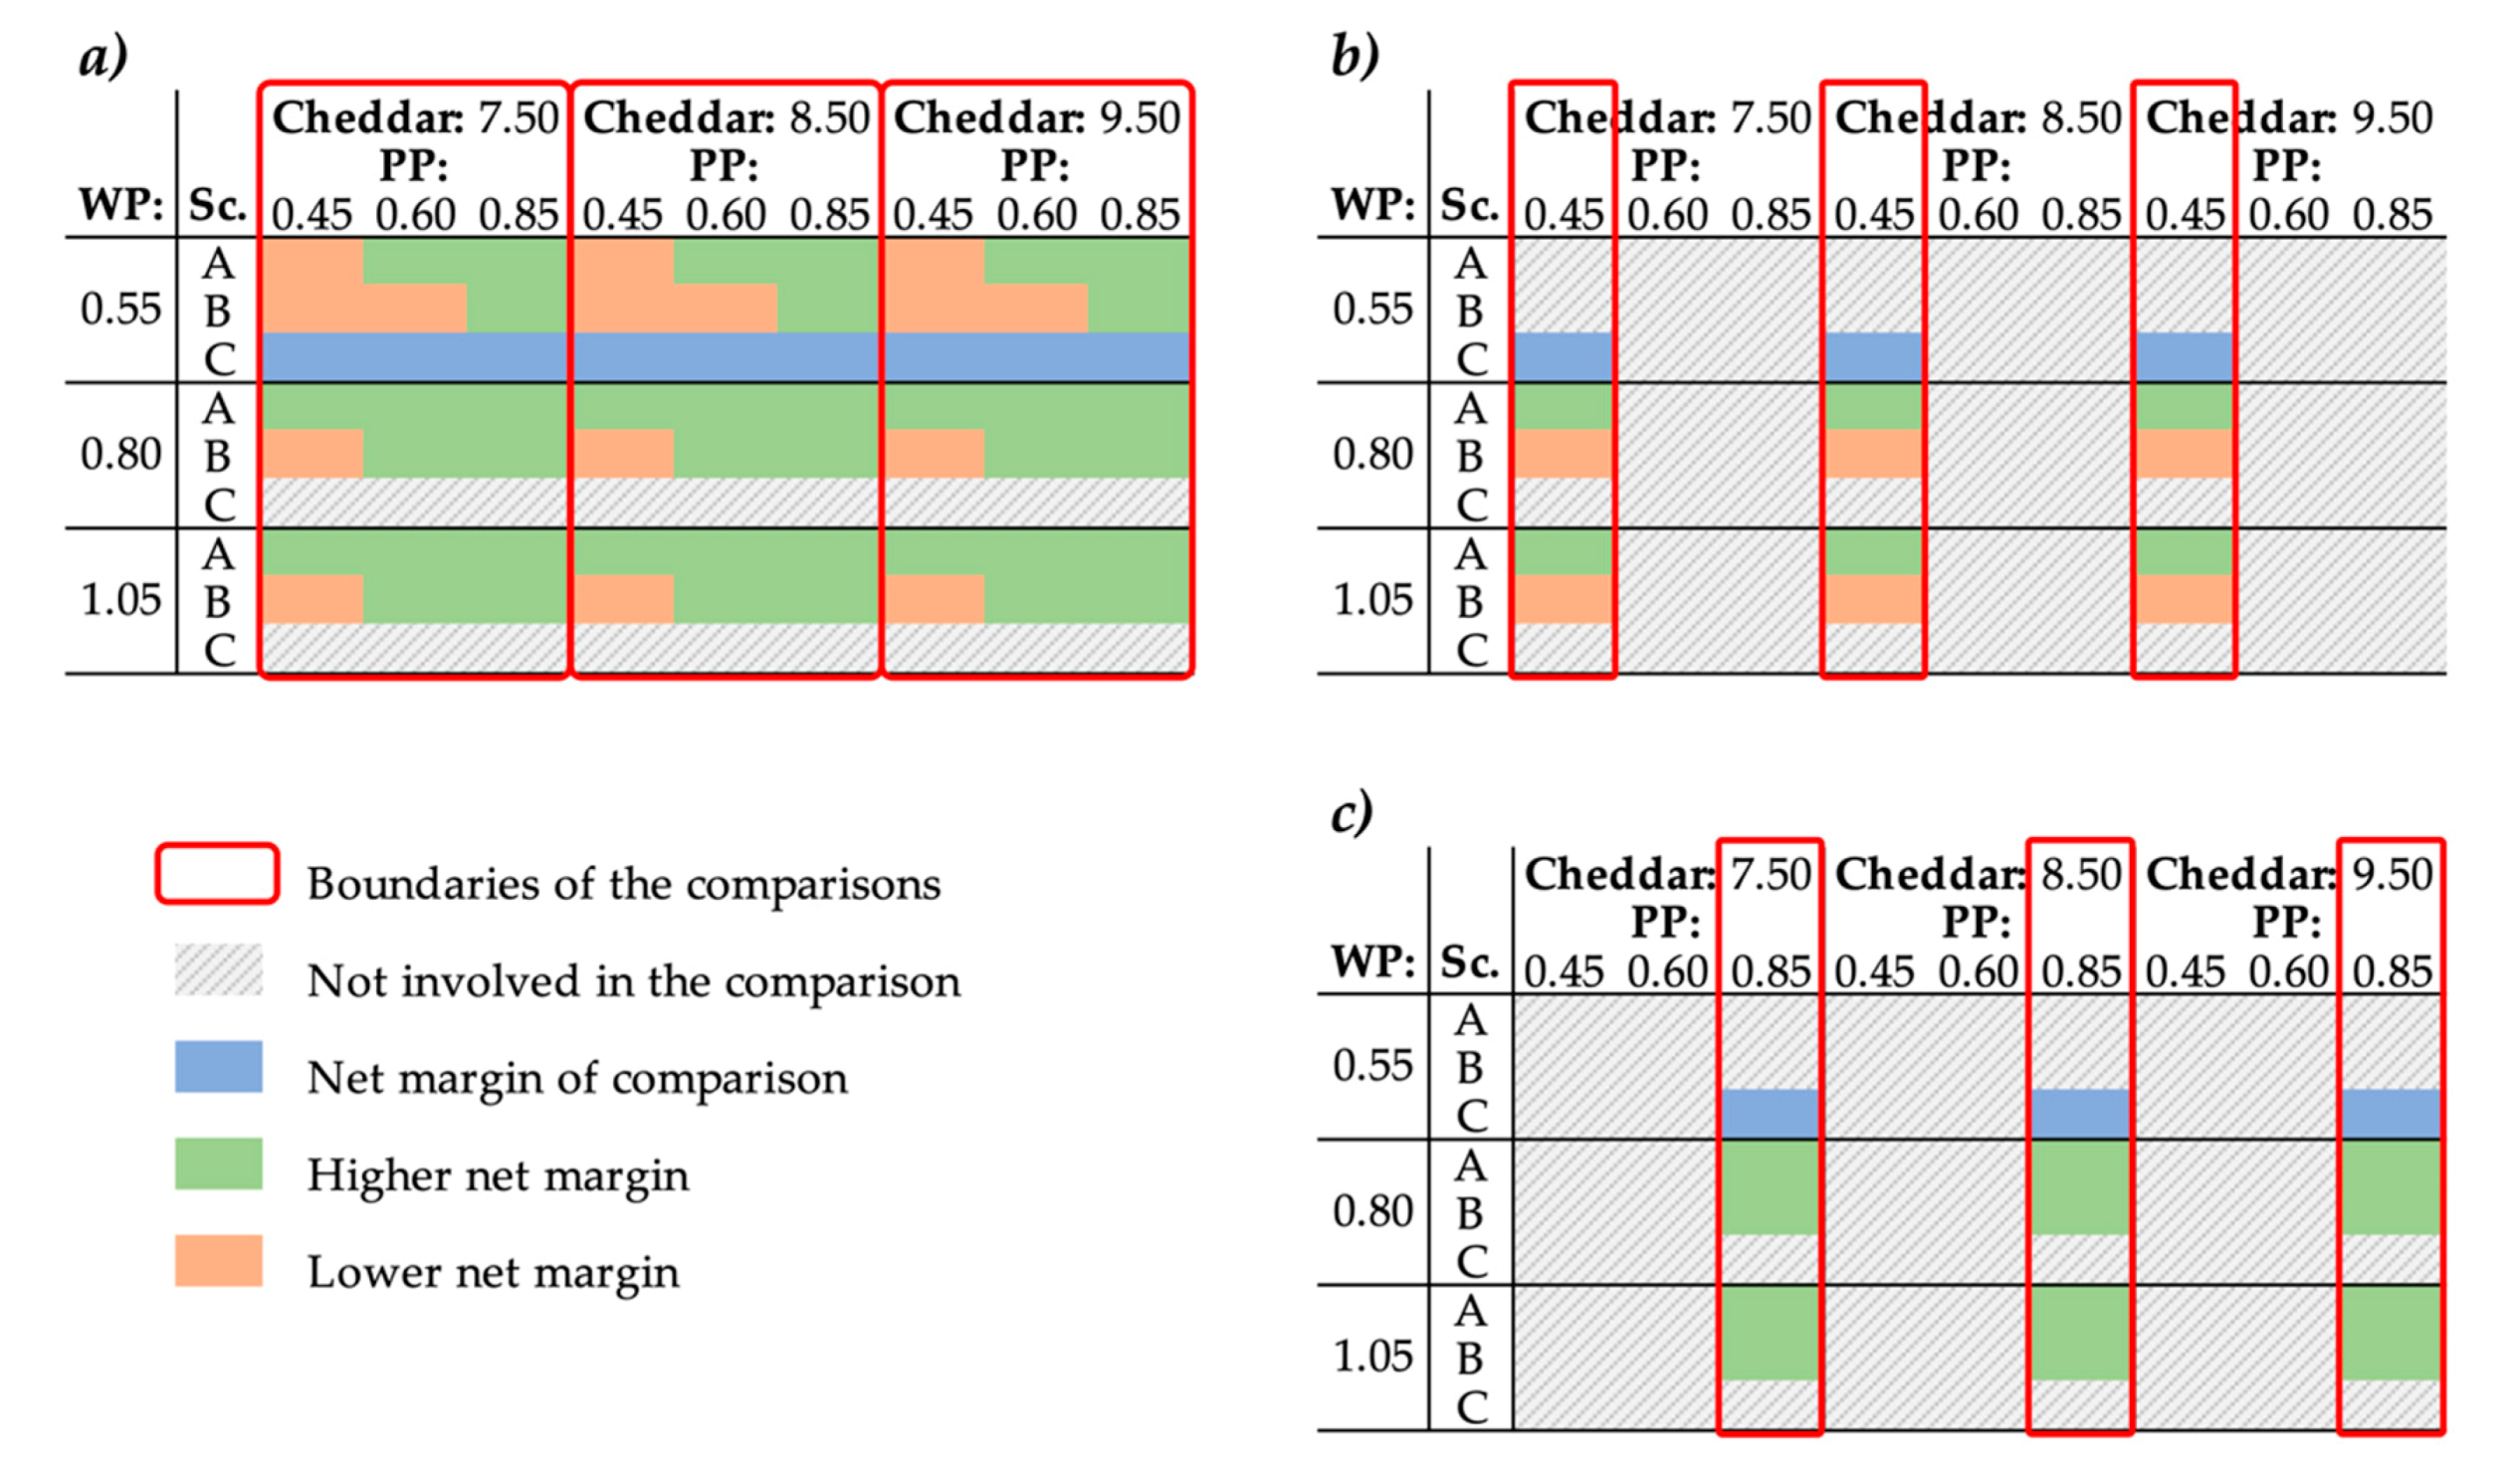
−1 in Québec. The selling prices were, therefore, increased from the observed American prices until economic profitability was reached for the three scenarios. The obtained price ranges were:
- -
Cheddar: from $7.50 to $9.50 CAD·kg−1;
- -
WP: from $0.55 to $1.05 CAD·kg−1;
- -
Permeate powder: from $0.45 to $0.85 CAD·kg−1.
These prices correspond to a relative increase in the observed American prices (from January to March 2018 [
52]) from 1.40 to 1.90. Using the features included in the EE assessment software, it was possible to carry out a sensibility analysis on the profitability of the scenarios depending on the selling prices of the cheddar and powders. The net margin generated per ton of raw milk was therefore evaluated for all possible selling price configurations.

 ,
, 


