2. Materials and Methods
2.1. Cells and Viruses
293T cells were purchased from Cell Bank/Stem Cell Bank, Chinese Academy of Sciences, HT1080 cells were purchased from Nanjing Cobioer Biosciences (Nanjing, China) and A549 cells were donated from Westlake University (Hangzhou, China). 293T, HT1080 and A549 cells were grown in complete medium (DMEM medium supplemented with 10% FBS) at 37 °C in 5% CO2. FI-RSV is produced by WuXi Discovery Biology (Shanghai, China). Respiratory syncytial virus, RSV/A2 (ATCC, VR-1540, Manassas, VA, USA) and RSV/B9320 (ATCC, VR-955) were used for the detection of neutralizing antibody.
2.2. Preparation of mRNA
In vitro transcription was performed using the TranscriptAid T7 High Yield Transcription Kit (Thermo K0441, Waltham, MA, USA), using linear DNA as a template for generating mRNA, with the addition of a certain proportion of pseudouridine and capping reagents. In vitro transcription conditions: the reaction system was configured according to the kit instructions, reaction at 37 °C for 0.5–2 h, the transcript was digested for 30 min by DNase, and the transcript was purified with Monarch RNA Cleanup Kit (NEB T2040L, Ipswich, MA, USA).
2.3. Lipid Synthesis
All lipids were synthesized using a similar method. General materials and solvents were purchased from Sigma Aldrich, Titan Scientific, SINOPEG and Leyan.
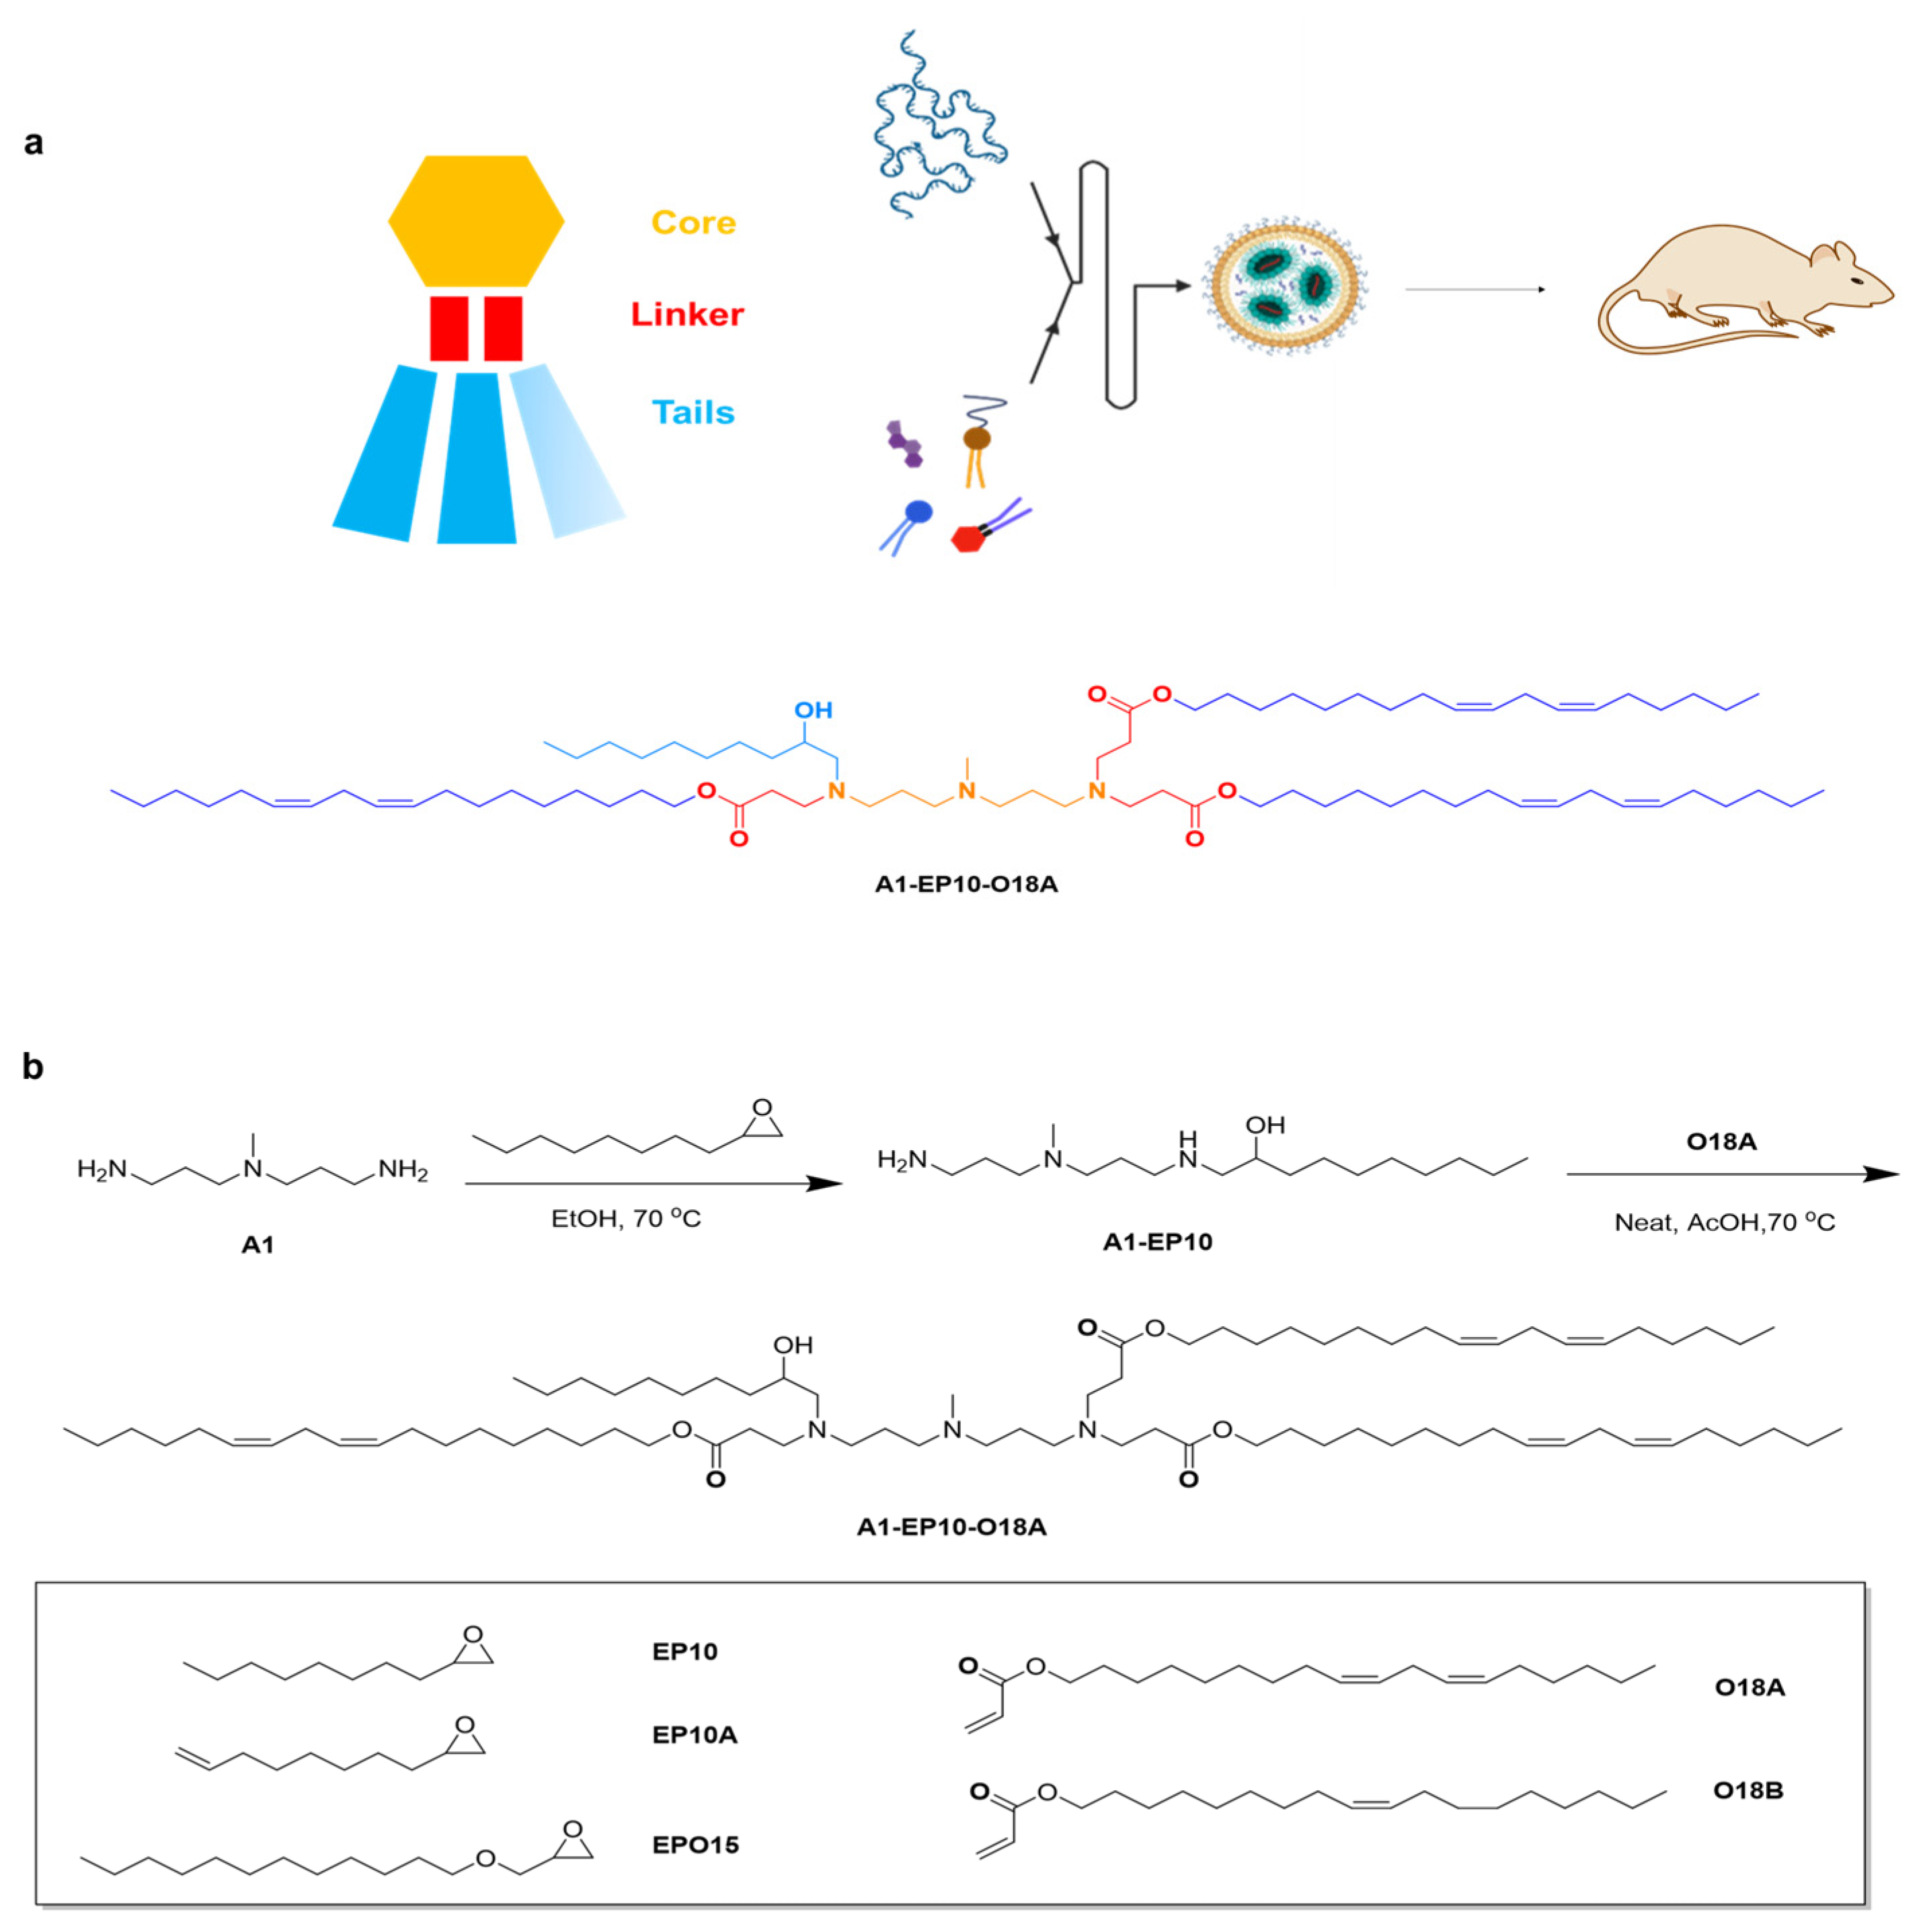
1-((3-((3-aminopropyl)(methyl)amino)propyl)amino)decan-2-ol: 2-octyloxirane (12.0 g, 1.0 eq.) was added to a solution of N1-(3-aminopropyl)-N1-methylpropane-1,3-diamine (44.62 g, 4.0 eq.) in EtOH (446.2 mL, 10V), then the mixture was heated to 70 °C and stirred for 15 h. Thin layer chromatography (TLC) showed the reaction was completed. The solution was evaporated under reduced pressure. H2O (500 mL) was then added to the residue, and the solution was washed with dichloromethane (DCM) (500 mL × 5); then, the combined organic phase was washed with saturated brine (300 mL) and dried over Na2SO4. After removing the solvent under vacuum, compound A1-EP10 was obtained as a colorless oil (18 g, 77.74% yield). 1H Nuclear Magnetic Resonance (NMR) (400 MHz, CDCl3) δ 3.60 (dddd, J = 9.8, 7.2, 4.4, 2.9 Hz, 1H), 2.79–2.57 (m, 5H), 2.47–2.34 (m, 5H), 2.20 (s, 3H), 1.64 (dp, J = 18.7, 6.9 Hz, 4H), 1.49–1.18 (m, 14H), 0.93–0.81 (m, 3H).
(9Z,12Z)-octadeca-9,12-dien-1-yl acrylate: acryloyl chloride (9.76 g, 1.15 eq.) was added to a solution of (9Z,12Z)-octadeca-9,12-dien-1-ol (25.0 g, 1.0 eq.) in DCM (1250 mL, 50 V) at 0 °C, then the mixture was stirred at 0 °C for 0.5 h. A solution of Et3N (14.24 g, 1.5 eq.) in DCM (50 mL) was added and stirred at 0 °C for 2 h. TLC showed the reaction was completed. H2O (500 mL) was then added to the mixture, the organic phase was separated, and the aqueous phase was extracted by DCM (500 mL × 3); then, the combined organic phase was washed with saturated brine (300 mL) and dried over Na2SO4. After removing the solvent under vacuum, the crude product was purified by silica-gel chromatography (DCM/hexane = 1:100, v/v) to give compound O18A as a colorless oil (29 g, 96.44%). 1H NMR (400 MHz, CDCl3) δ 6.40 (dd, J = 17.3, 1.5 Hz, 1H), 6.12 (dd, J = 17.4, 10.4 Hz, 1H), 5.81 (dd, J = 10.4, 1.5 Hz, 1H), 5.49–5.26 (m, 4H), 4.15 (t, J = 6.7 Hz, 2H), 2.77 (t, J = 6.4 Hz, 2H), 2.05 (q, J = 6.8 Hz, 4H), 1.72–1.62 (m, 2H), 1.41–1.24 (m, 17H), 0.89 (t, J = 6.8 Hz, 3H).
Di((9Z,12Z)-octadeca-9,12-dien-1-yl) 3,3′-((3-((3-((2-hydroxydecyl)(3-(((9Z,12Z)-octadeca-9,12-dien-1-yl)oxy)-3-oxopropyl)amino)propyl)(methyl)amino)propyl)azanediyl)dipropionate: a solution of (9Z,12Z)-octadeca-9,12-dien-1-yl acrylate (18.6 g, 3.5 eq.) and 1-((3-((3-aminopropyl)(methyl)amino)propyl)amino)decan-2-ol (5.0 g, 1.0 eq.) was stirred at 20 °C for 1 h under N2, then BHT (365.41 mg, 0.1 eq.) and AcOH (49.79 mg, 0.05 eq.) was added and stirred at 70 °C for 80 h. TLC showed the reaction was completed. The mixture was purified by silica-gel chromatography (DCM/MeOH = 30:1, v/v) to give compound A1-EP10-O18A as a yellow oil (43g, yield 57.03%). 1H NMR (400 MHz, CDCl3) δ 5.45–5.24 (m, 12H), 4.11–3.98 (m, 6H), 3.63–3.53 (m, 1H), 2.95–2.84 (m, 1H), 2.81–2.53 (m, 12H), 2.49–2.15 (m, 18H), 1.67–1.53 (m, 10H), 1.51–1.15 (m, 65H), 0.88 (td, J = 6.8, 4.8 Hz, 12H). HR-MS: [M + H]+ = 1263.15105.
2.4. Lipid Nanoparticle Preparation and In Vivo Imaging Study
mRNA was dissolved in citrate buffer (pH 4, self-prepared from sodium citrate dihydrate and citric acid), and the concentration of mRNA adjusted to 0.2 mg/mL, thereby obtaining the aqueous phase. A1-EP10-O18A (synthesized according to our patented method), 1,2-distearoyl-sn-glycero-3-phosphocholine (DSPC), cholesterol and DMG-PEG2000 were dissolved in desired molar fractions in dry ethanol, and the total concentration of lipids was adjusted to 10 mg/mL, thereby obtaining the organic phase. The aqueous phase and organic phase were admixed in a 3:1 ratio (v/v) by a microfluidic device (NanoAssemblr® Ignite™, Marlborough, MA, USA) at a total flow rate of 12 mL/min. The mixture was 10-fold diluted with PBS buffer (pH 7.4). Ethanol was separated by tangential flow filtration (Repligen®, TFF, Waltham, MA, USA). The solution was concentrated to 0.1 mg/mL (mRNA concentration) and filtrated by a 0.22 μm Millipore filter to obtain mRNA-containing lipid nanoparticles.
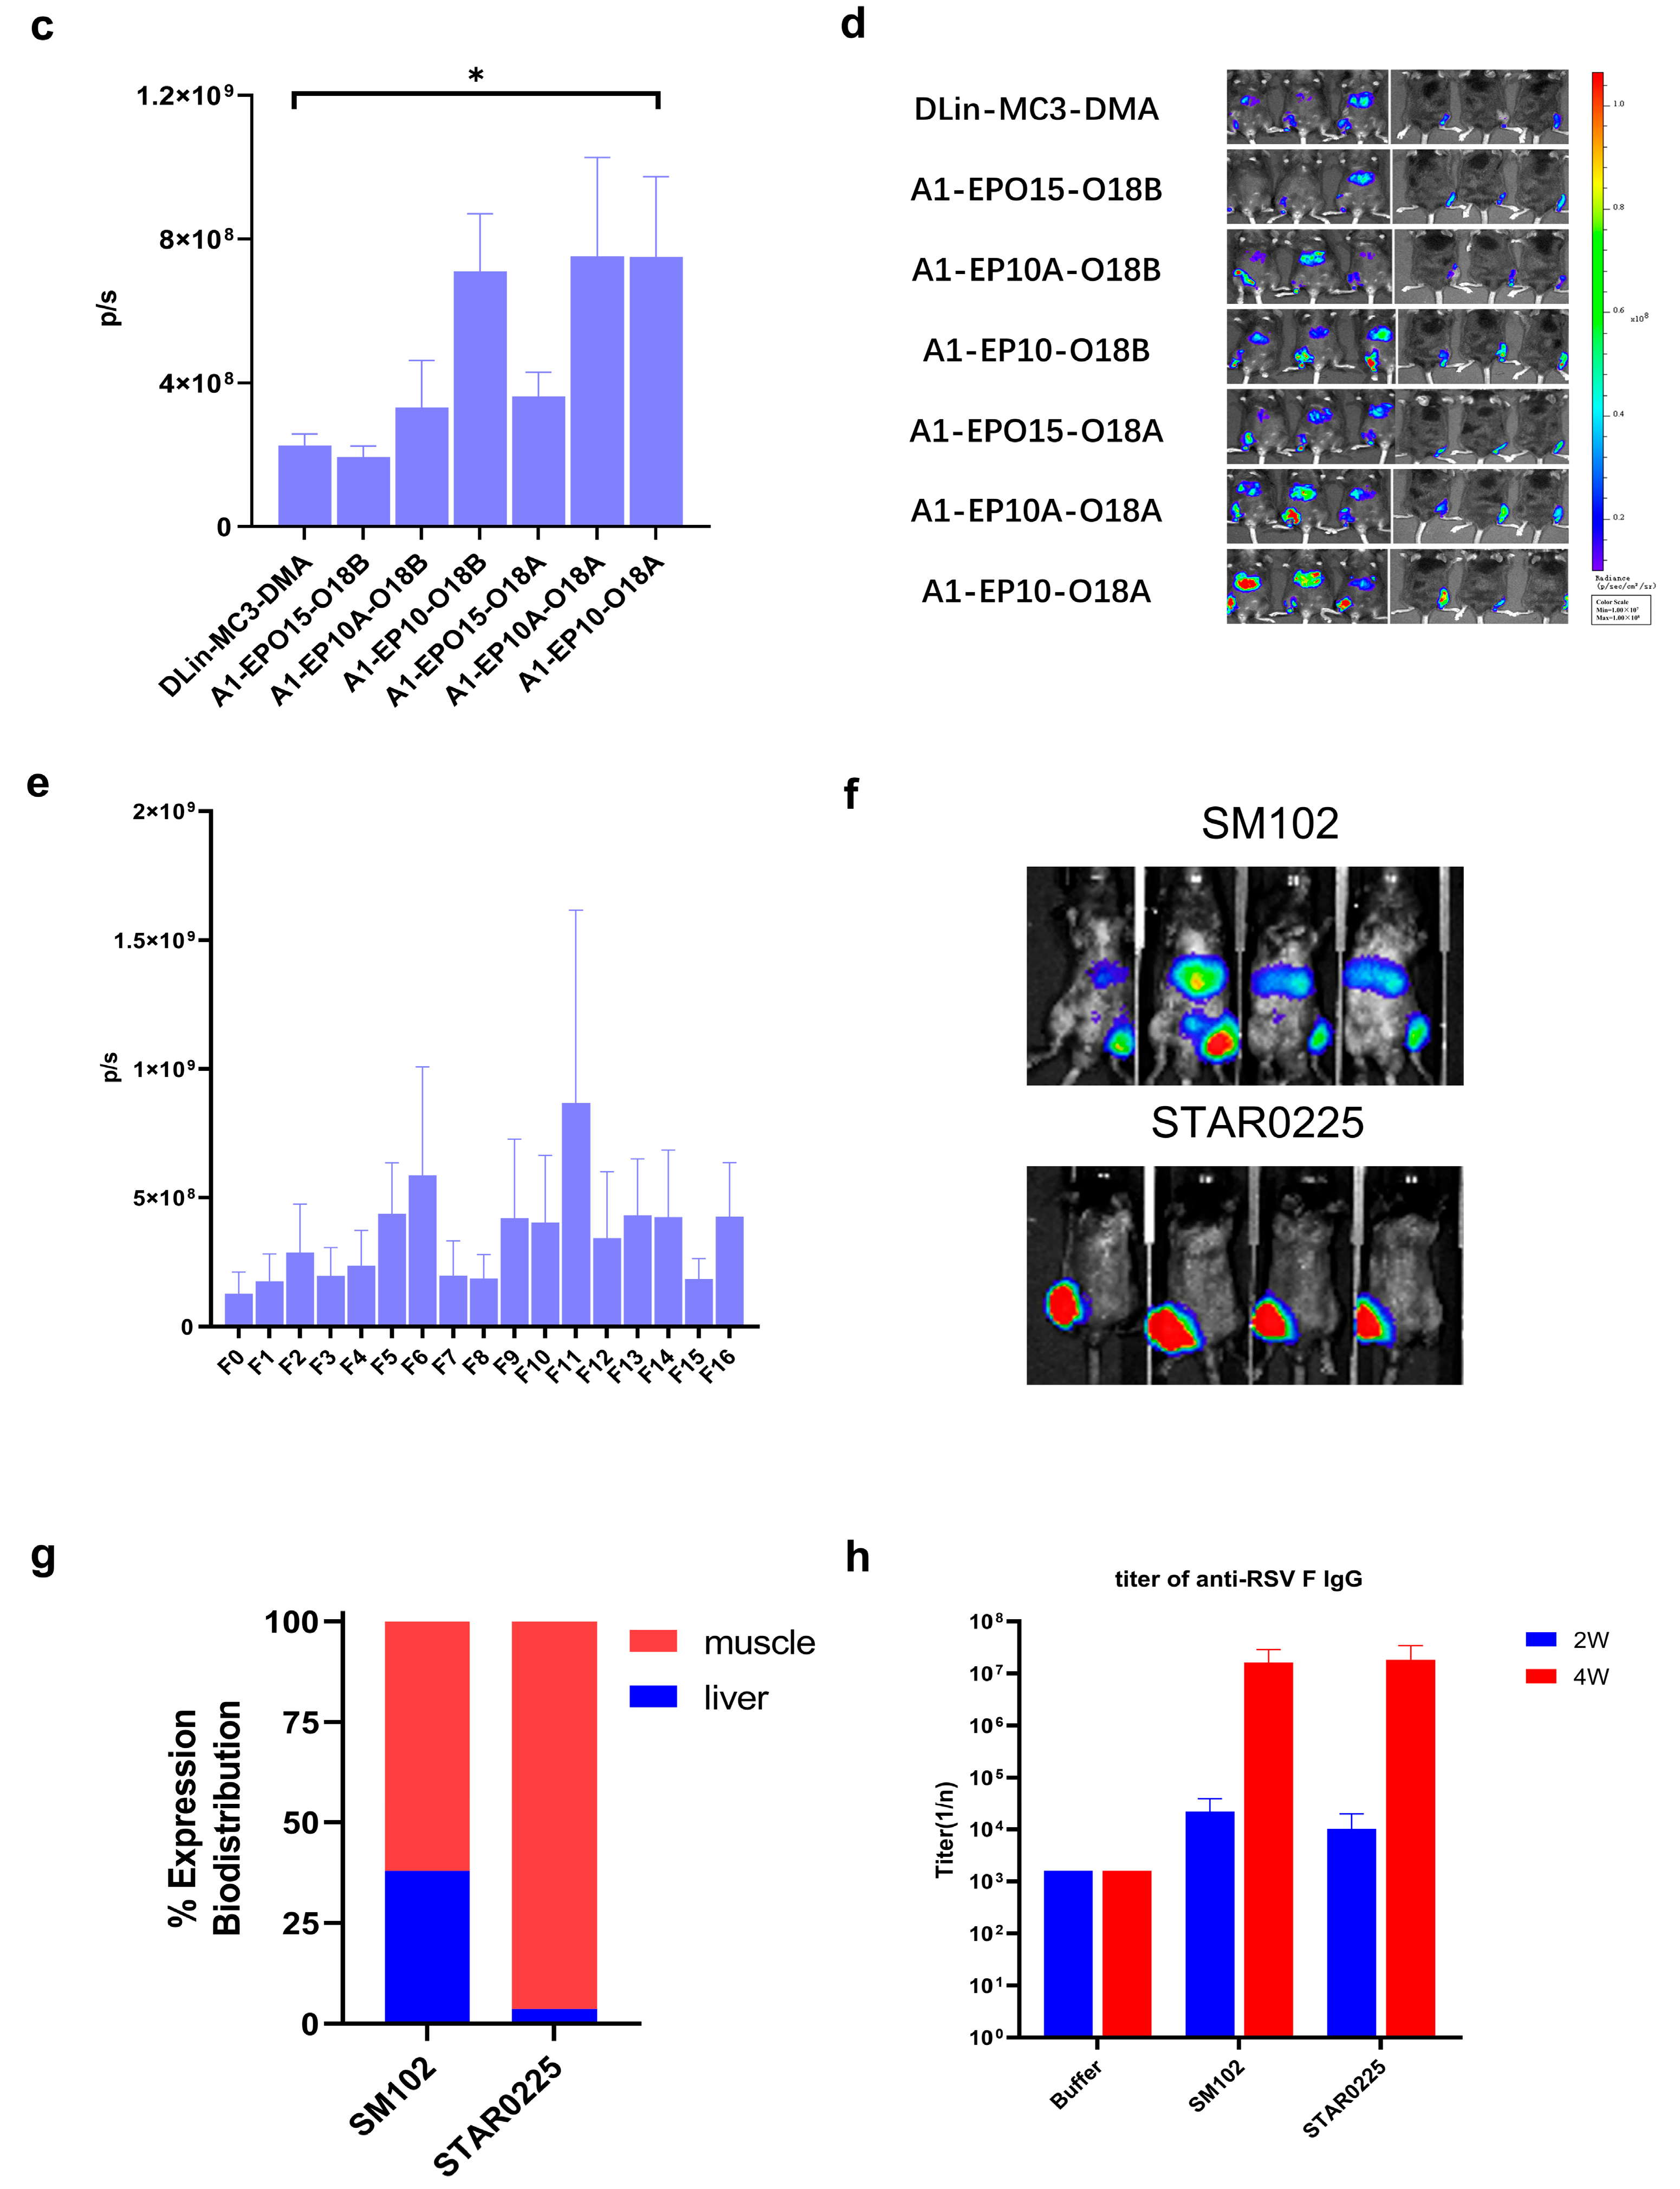
IVIS in vivo animal imaging study. Six-week-old male C57BL/6 mice weighing about 20 g, fed in the specific-pathogen-free (SPF) feeding room were selected. Two or three mice (n = 2 or 3) were randomly selected in each group, and the FLuc mRNA-containing lipid particles prepared as described above were administered via intramuscular injection (“IM”) at the dosage of 0.25 mg/kg. After 6 h, 100 μL of 30 mg/mL D-luciferin (potassium salt) was intraperitoneally injected into each mouse. After 10 min, the total fluorescence intensity of each mouse was observed and recorded by an in vivo imaging system, and the total fluorescence intensity (p/s) was recorded.
2.5. mRNA Transfection
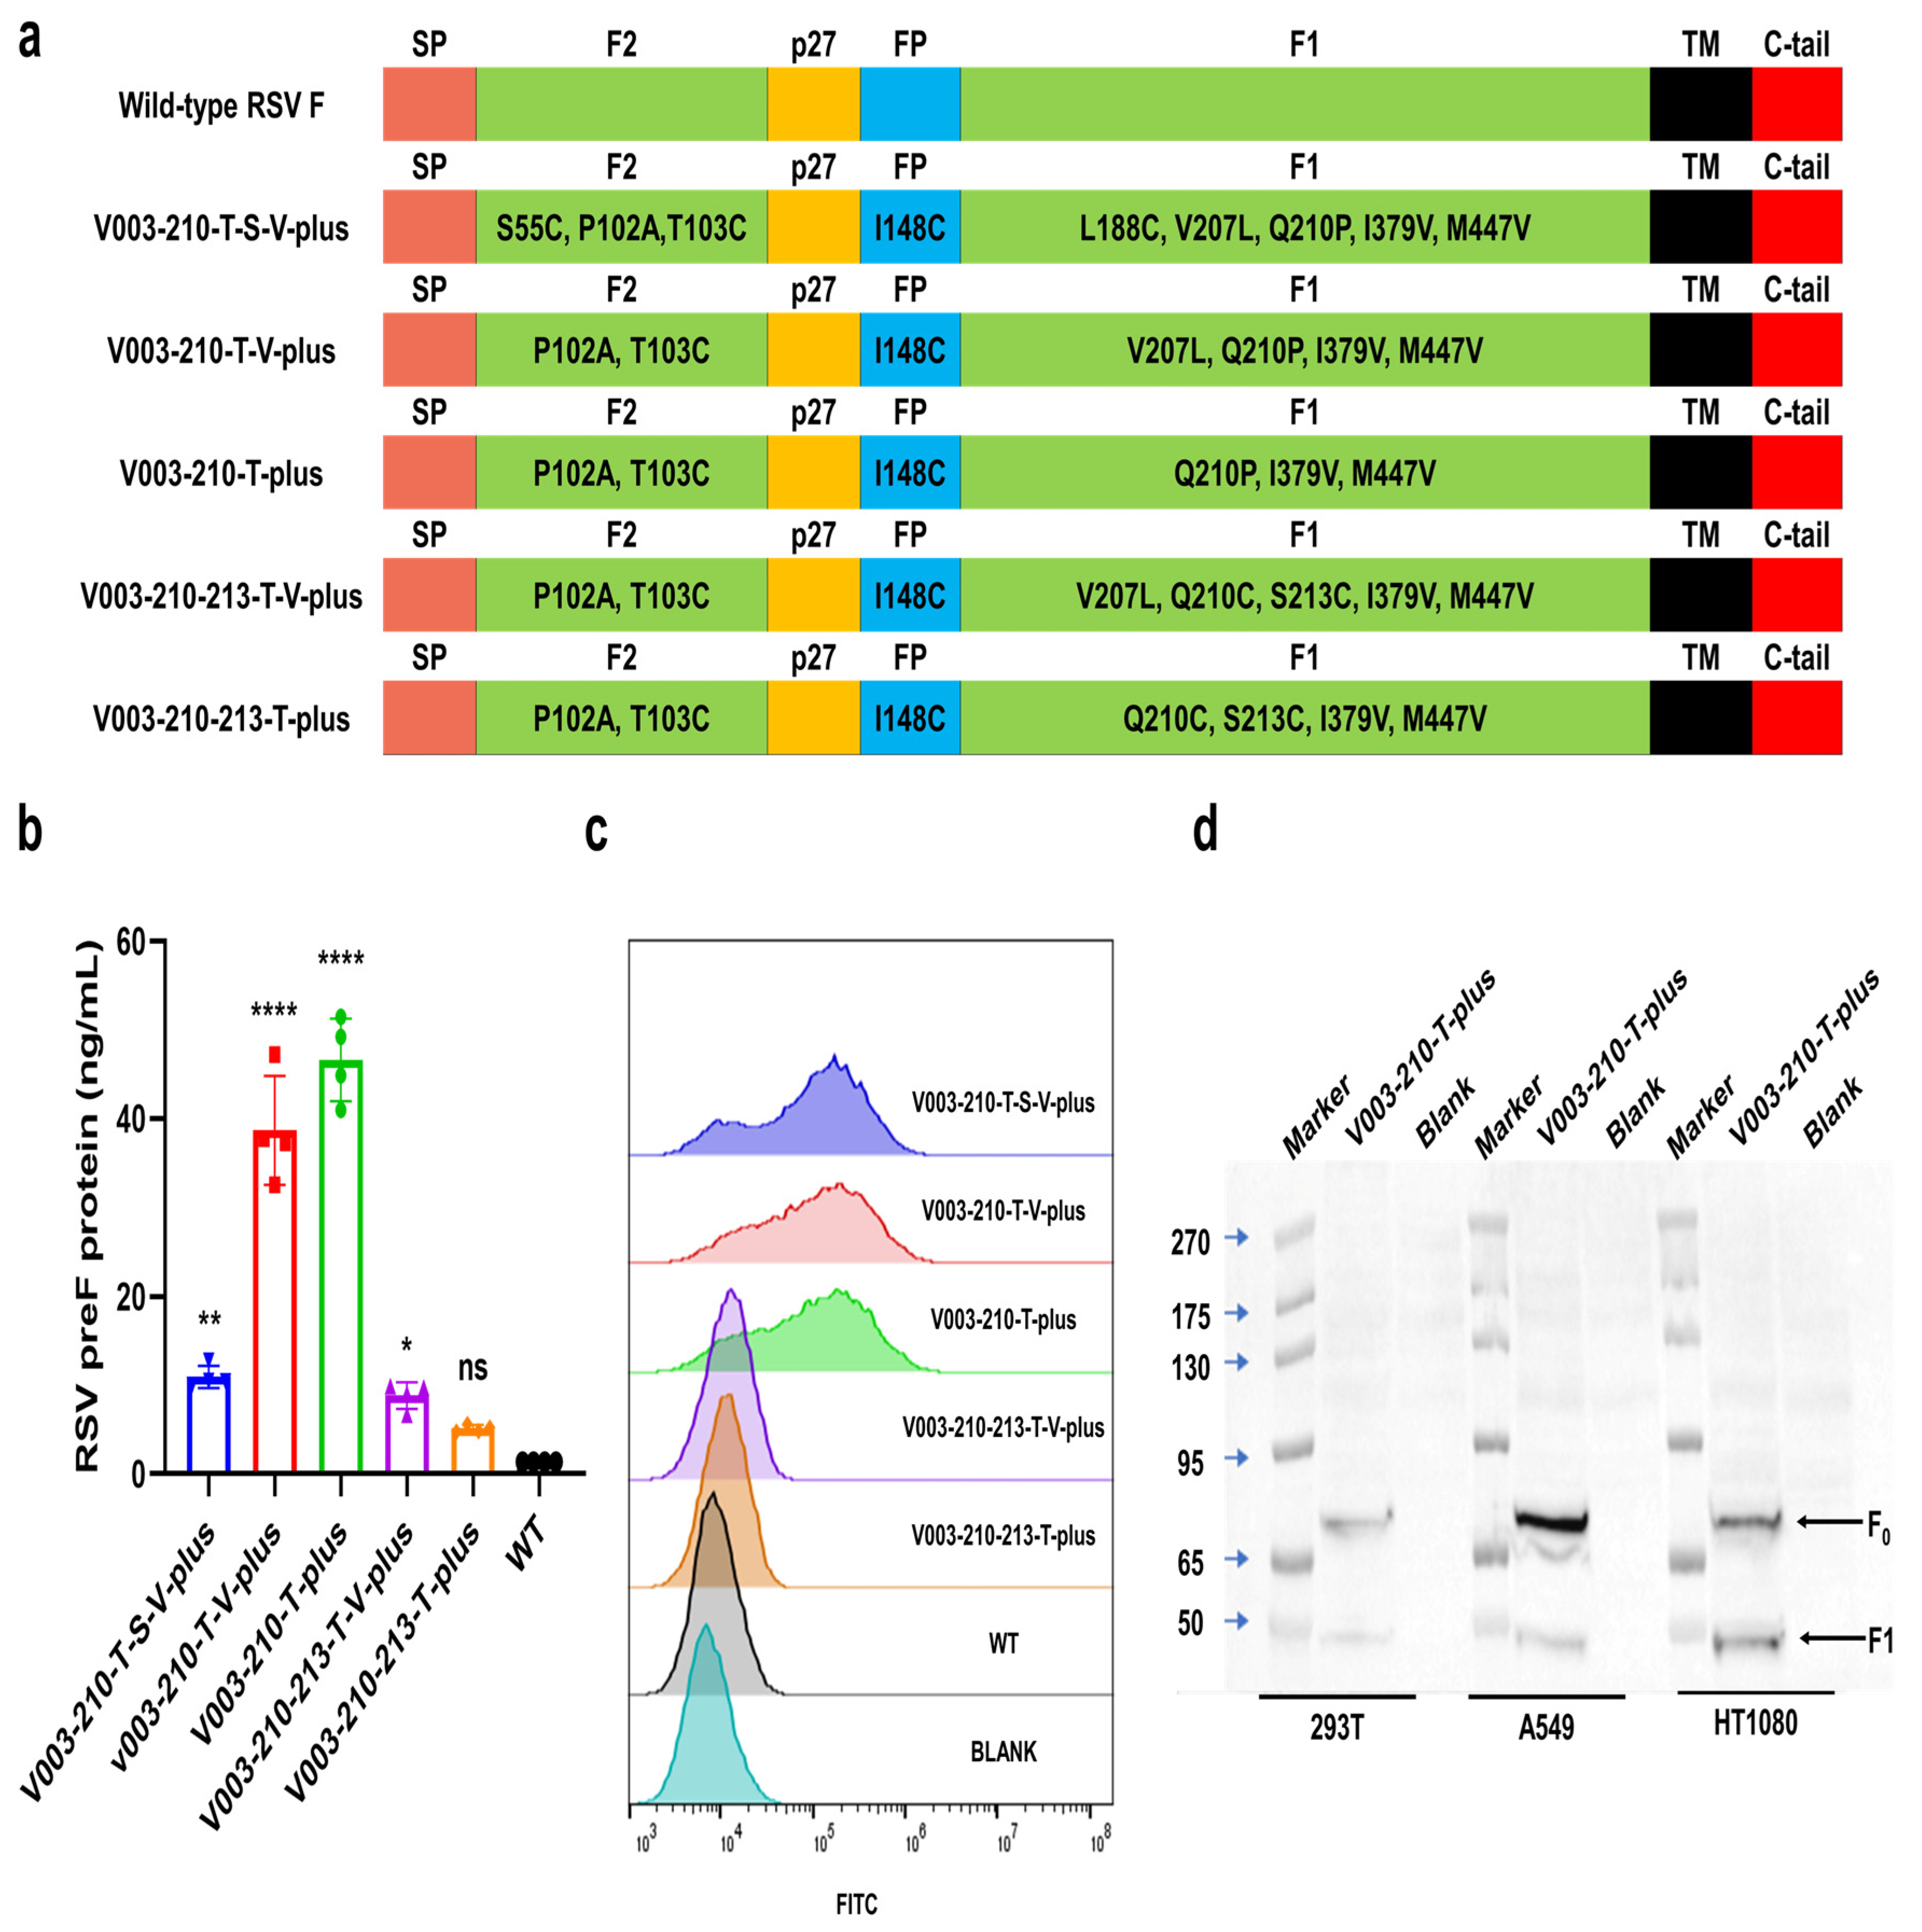
293T, HT1080 and A549 cells were inoculated in 6-well or 24-well plates. Twenty-four hours later, the cells were transfected with mRNA of RSV preF protein using Lipofectamine 2000 (Invitrogen, Waltham, MA, USA). Cells were collected 24 h after transfection. The expression of RSV preF protein was then detected by Western blot with a monoclonal antibody that recognizes RSV F protein (Sinobiological, 11049-R302, Beijing, China). The expression levels of RSV F and preF proteins were analyzed by FACS in cells transfected with different mRNAs. Briefly, after transfection, cells were trypsinized and washed. F488 Anti-Respiratory Syncytial Virus Fusion Protein Antibody (Φ) (recognize the antigenic site Φ of RSV preF protein, Vazyme, DD3941-02, Nanjing, China), RSV F Antibody (4D5) (Epitope I, novoprotein, DA102), RSV F Antibody (11A9) (Epitope II, novoprotein, DA091), RSV F Antibody (4B9) (Epitope III, novoprotein, DA110), RSV F Antibody (9F4) (Epitope IV, novoprotein, DA118), RSV Pre-F Antibody (7E11) (Epitope V, novoprotein, DA119) and RSV Pre-F Antibody (3C12) (Epitope Φ, novoprotein, DA101) were used to bind specifically to RSV preF protein or F protein, respectively. Except for F488 Anti-Respiratory Syncytial Virus Fusion Protein Antibody (Φ), all other groups added Rabbit Anti-Human IgG H&L (FITC) (abcam, ab6755) as a secondary antibody. The cells were washed and analyzed by FACS. Flow cytometric data were quantitatively evaluated using FlowJo software (V10.8.1).
The expression of RSV preF protein was detected by ELISA with Respiratory Syncytial Virus pre-F Elisa Kit (Φ and IV) (Vazyme, DD3939-01). Briefly, the capture antibody (recognize the RSV preF protein-specific antigenic sites Φ) was coated on a microplate. After blocking, cell lysates were added to the wells. Serial dilutions of RSV preF-11 protein standard were added to the control columns. After incubation, the plate was washed, and the detection antibody-HRP (recognize the antigenic site IV common to RSV preF protein and postF protein) was added. After incubation, tetramethylbenzidine (TMB) was added, and plates were read in a microplate reader at 450 nm/630 nm wavelengths.
2.6. Animal Studies
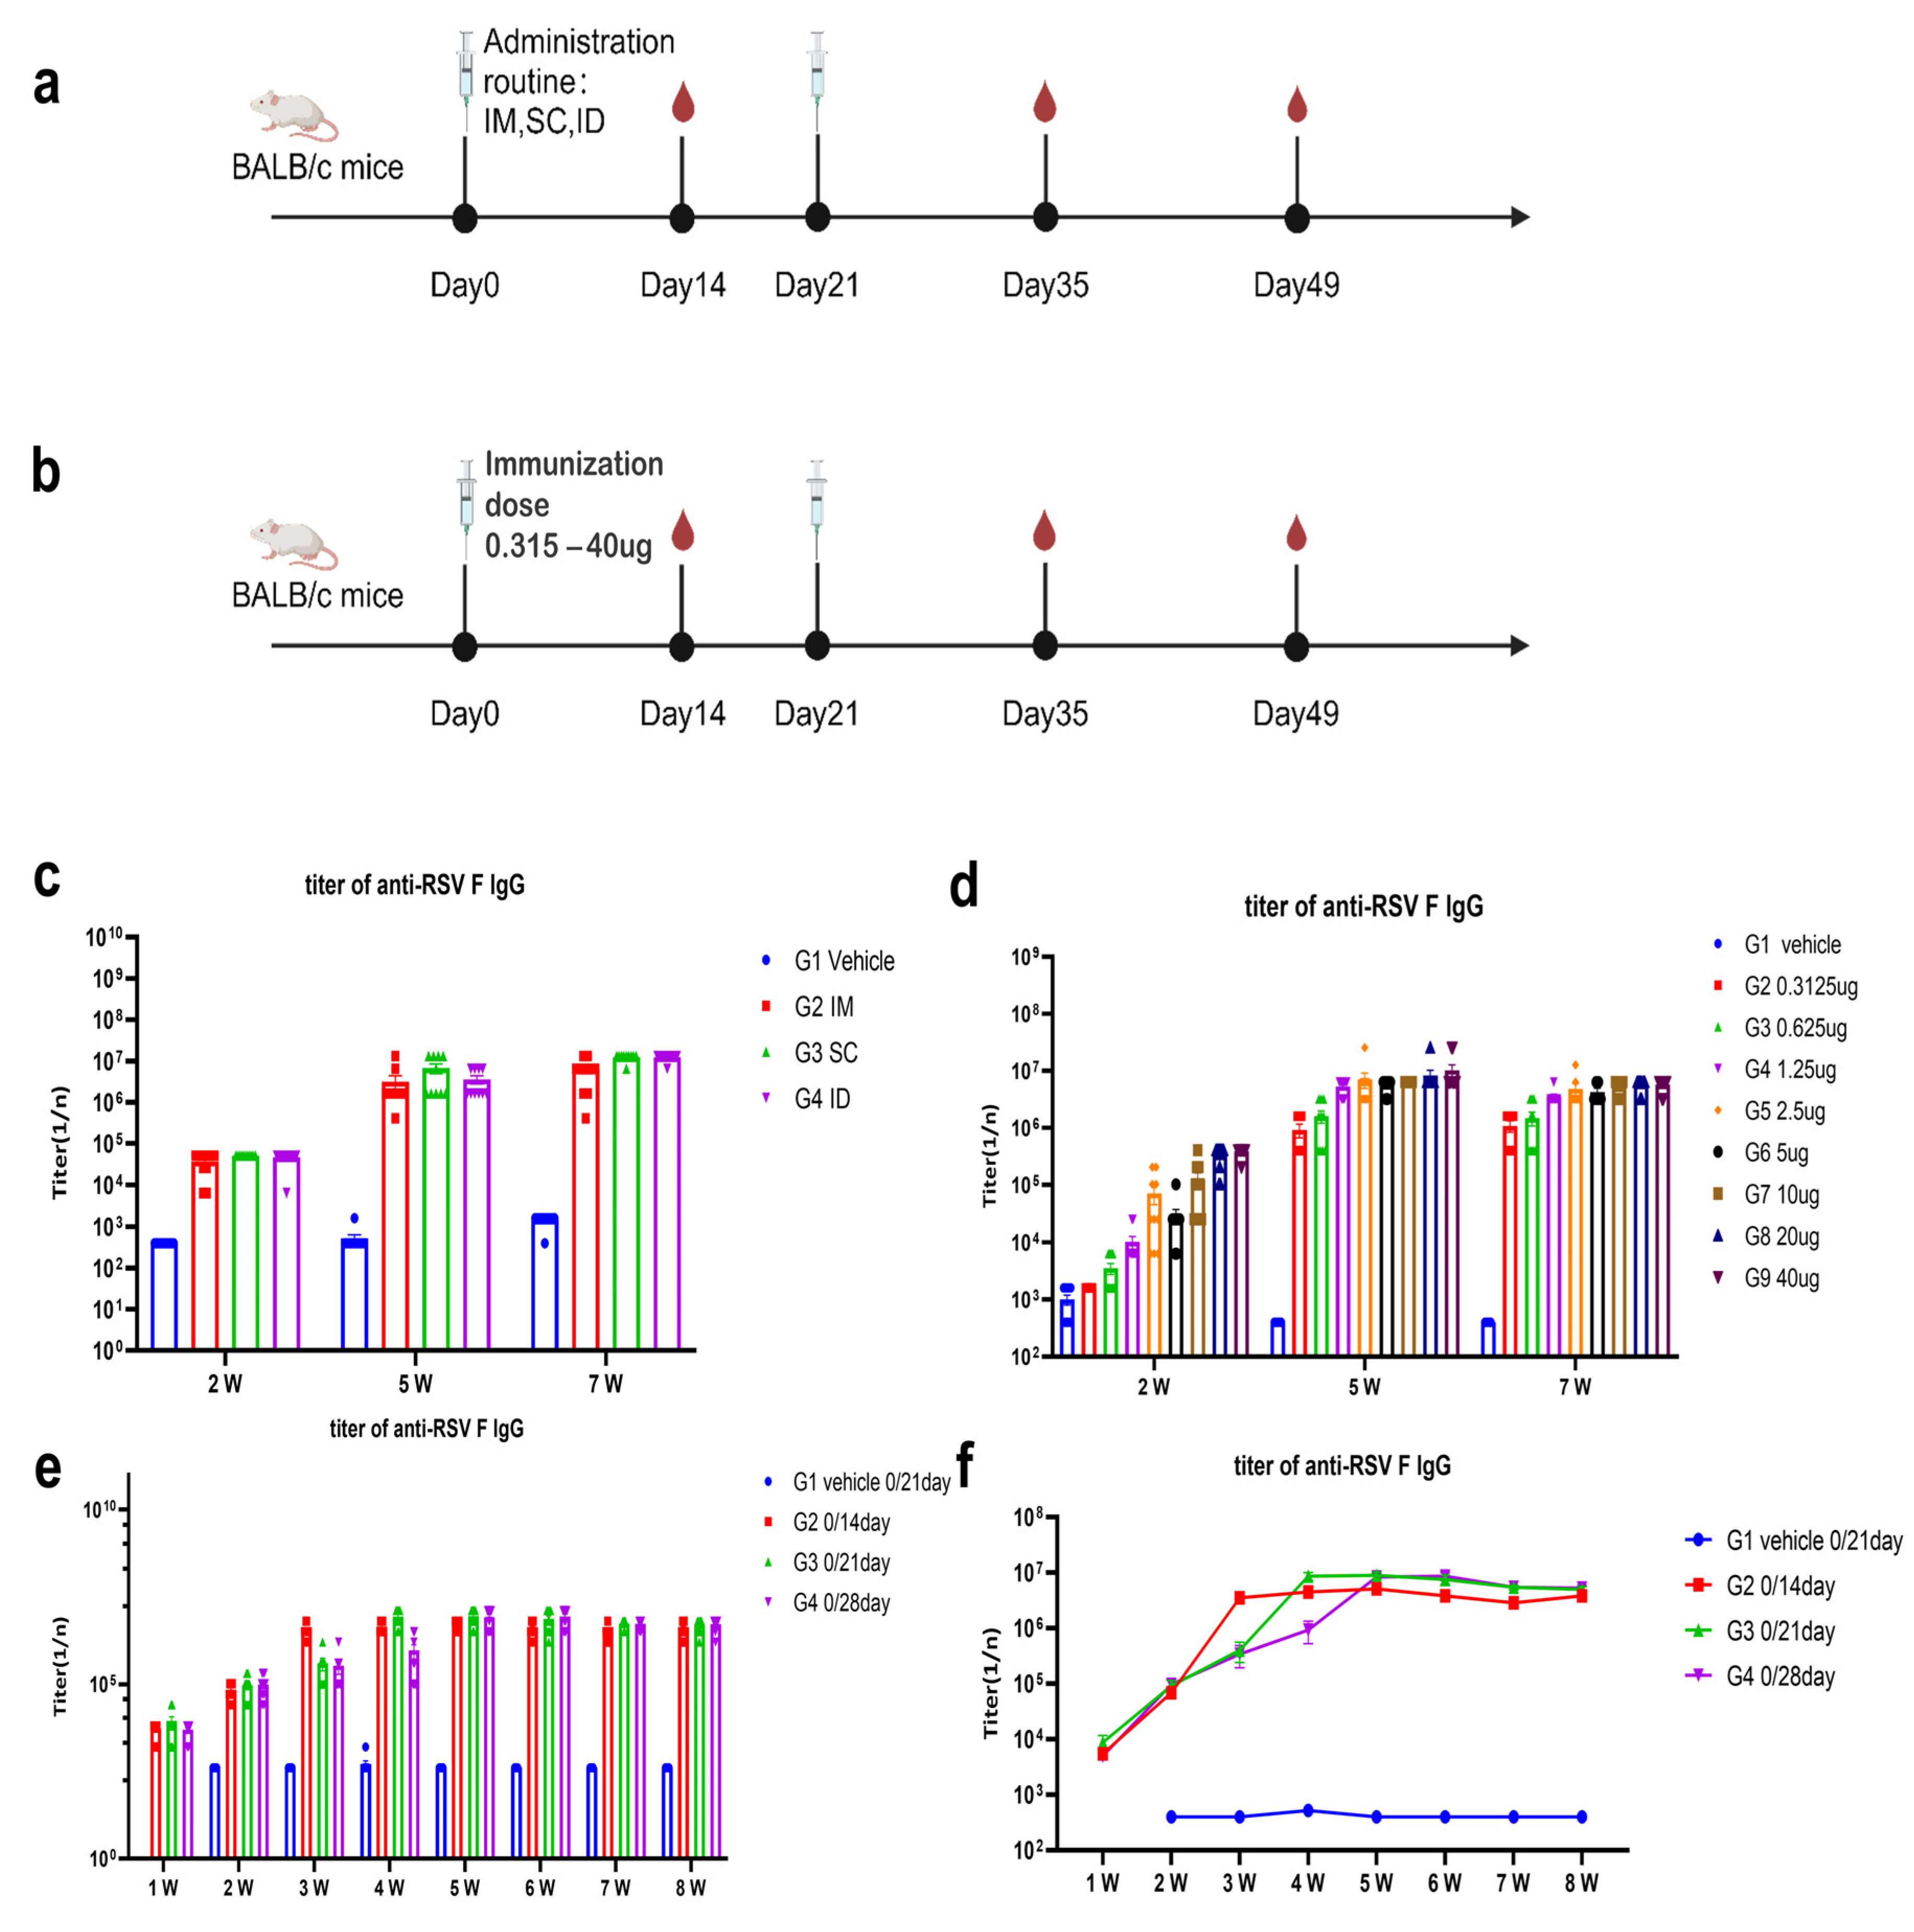
The candidate mRNA sequences were screened based on the ability to induce RSV F or preF protein-specific IgG in BALB/c mice and Sprague Dawley (SD) rats. RSV preF mRNAs with different sequence optimization strategies were produced by in vitro transcription and encapsulated in LNP STAR0225. The LNPs (in mice, 50 µL containing 5 µg mRNA; in rats, 500 µL containing 50 µg mRNA) were used to immunize mice or SD rats (3/sex/group) via intramuscular (IM) injections on Day 0 and Day 14. The RSV preF or F-specific antibody IgG titers were analyzed 2 and 5 weeks or 3 and 5 weeks after the first dose by ELISA.
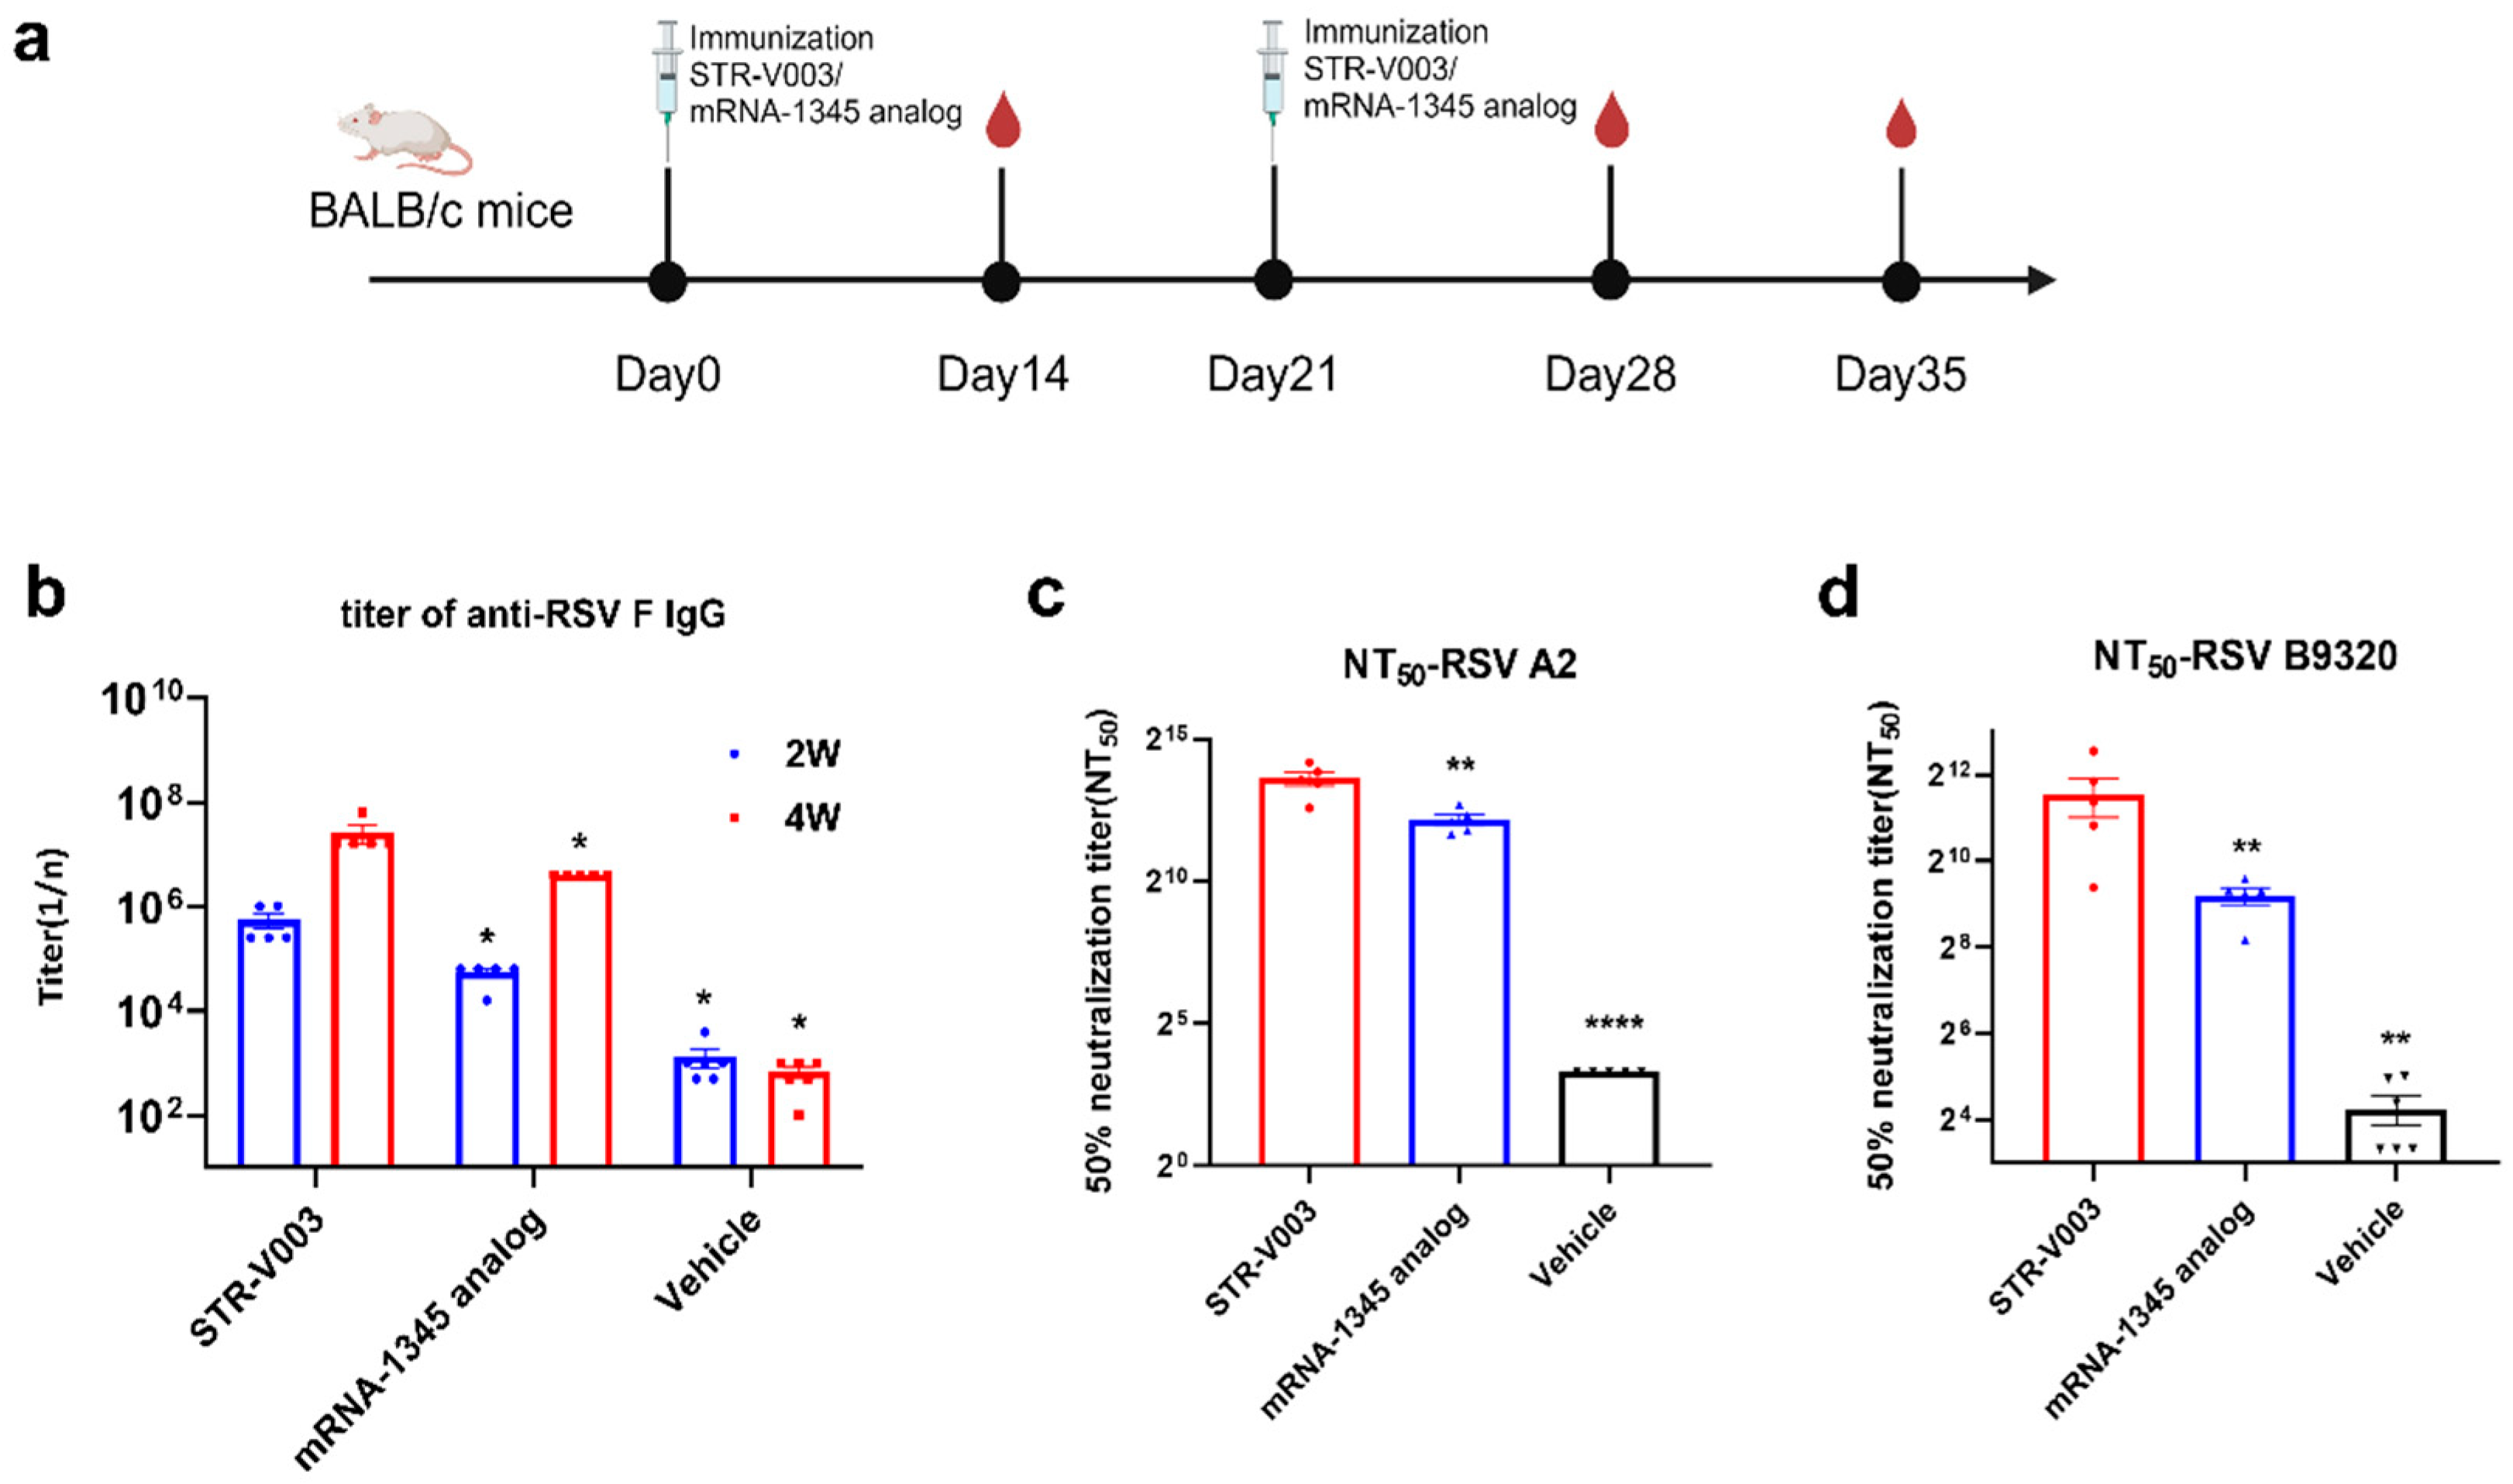
In the comparison of immunogenicity of STR-V003 and mRNA-1345, BALB/c mice (6~8 weeks old) in each group were injected with 50 µL mRNA-LNPs twice on Day 0 and Day 14 or Day 21. Vehicle was used as negative control. Serum samples were collected on Days 14, 28, and 35 for the detection of RSV preF-specific IgG antibody or neutralization antibody titers.
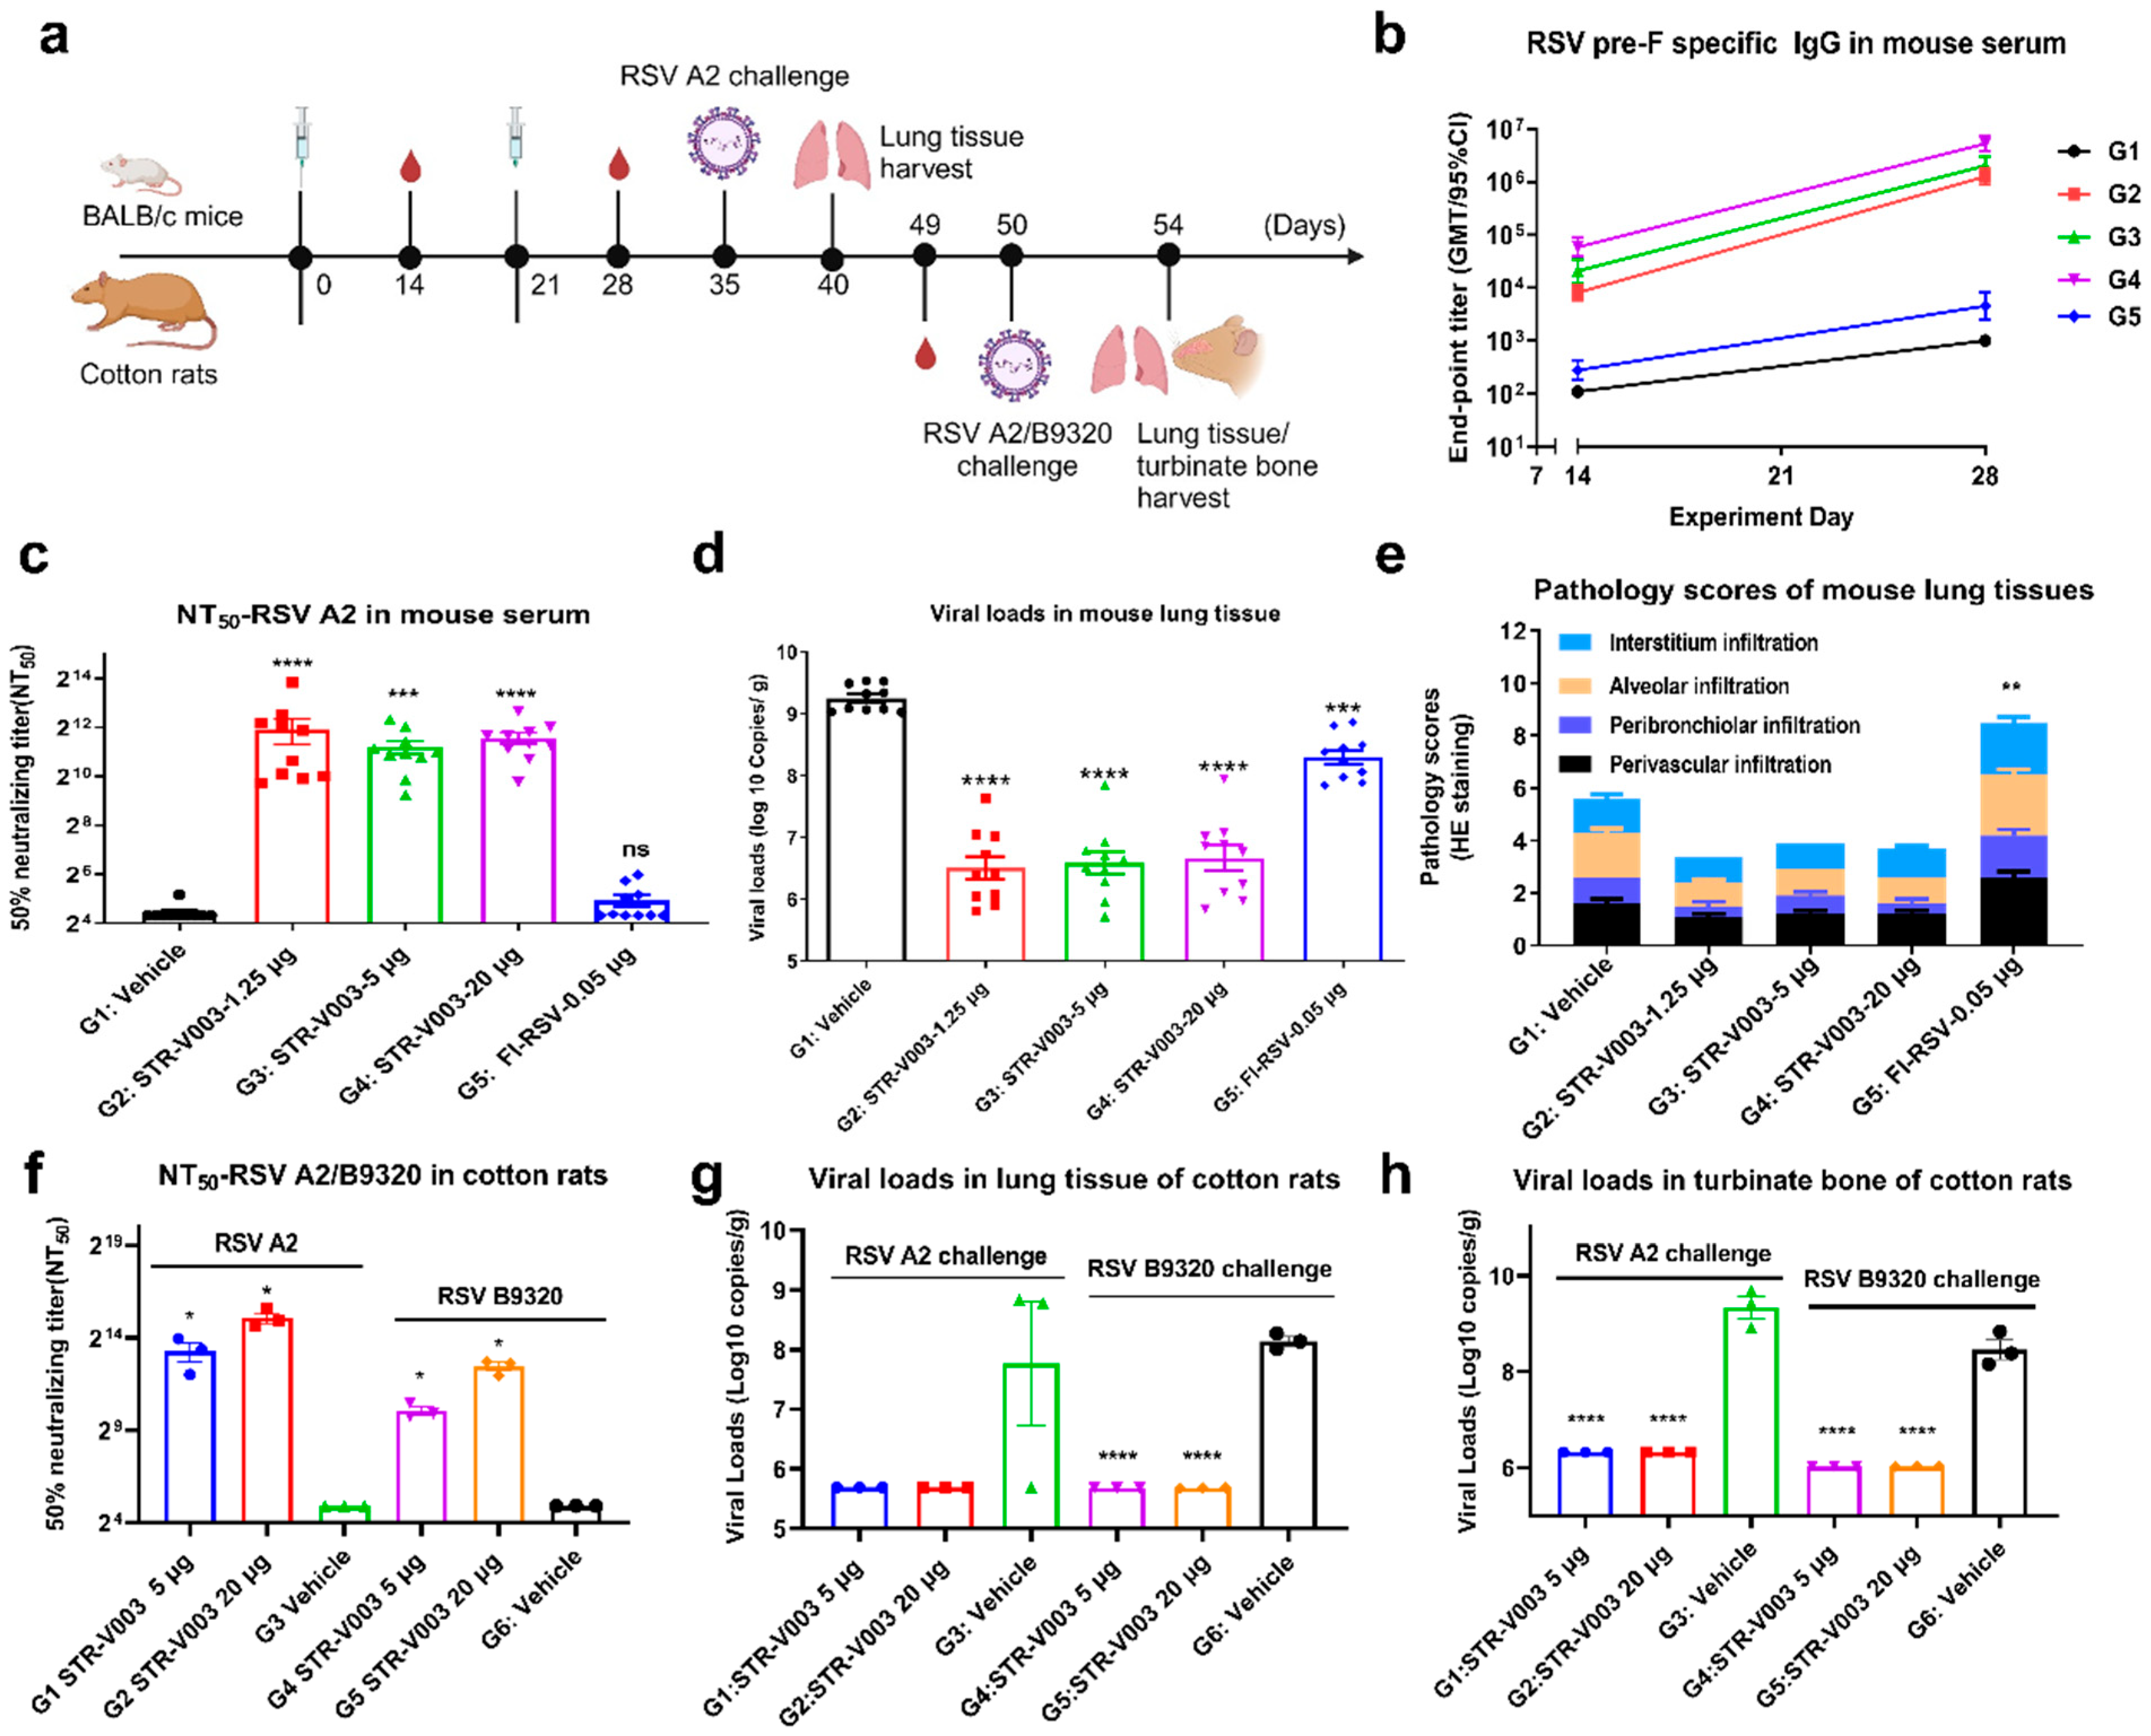
In the study of immunogenicity and challenge protection of STR-V003 in mouse model, female and male, 6–8 weeks old, BALB/c mice were immunized with vehicle, test vaccine STR-V003, FI-RSV by IM route on Day 0 and Day 21. Mice were deeply anesthetized by intraperitoneal injection of anesthetic (30 mg/kg Zoletil 50 and 6 mg/kg Xylazine Hydrochloride) on the day of inoculation (Day 35) and then inoculated with the RSV/A2 via intranasal inhalation. The inoculation amount is 1.0 × 10⁶ PFU/50 μL/mouse. Serum samples were collected on Days 14, 28, and Day 35 for the detection of RSV preF-specific IgG antibody and neutralization antibody titers. On the 40th day, the animals were euthanized by overdose anesthesia and exsanguination, and the lung tissue samples were collected for the detection of viral loads and lesions of lung tissue. After immunization, mice were weighed once per day for 6 consecutive days until the abnormal symptoms significantly improved and recovered, and then three times per week. After virus infection, mice were weighed once per day to observe and record their health and survival status.
In the study of immunogenicity and challenge protection of STR-V003 in cotton rat model, 5–7 week-old cotton rats were immunized with vehicle and test STR-V003 by the IM route on Day 0 and Day 21 and anesthetized with isoflurane gas in a gas anesthesia machine on the day of inoculation (Day 50). Each animal was intranasally instilled with 50 μL of viral solution, and the animals were observed to inhale the viral solution and returned to the home cage after waking up. The status of the animals was closely observed. The inoculation amount was 1.5 × 10⁶ PFU/50 μL/cotton rats. Serum samples were collected on Day 49 for neutralizing antibody. The turbinate bones and lung tissues were collected on Day 54 after the animals were euthanized for detection of viral loads and lesions of lung tissue. Animals were weighed and recorded three times per week before infection and once per day after infection.
The protocol and procedures involving the care and use of animals in the studies presented in
Section 4.3,
Section 4.4 and
Section 4.5 were reviewed and approved by the Institutional Animal Care and Use Committee (IACUC) of GemPharmatech Co., Ltd. (Nanjing, China) before conducting the study. The studies in
Section 4.6 were approved by the WuXi AppTec Co., Ltd. (Nantong, China). IACUC. During the study, the care and use of animals were conducted in accordance with the regulations of the Association for Assessment and Accreditation of Laboratory Animal Care (AAALAC). In the studies presented in
Section 4.8, animal husbandry and management were compliant with the relevant SOPs of JOINN Laboratories (Suzhou, China), the Guide for the Care and Use of Laboratory Animals 8th (8th Edition, Institute of Laboratory Animal Resources, Commission on Life Sciences, National Research Council; National Academy Press; Washington, D.C., 2011), and the U.S. Department of Agriculture through the Animal Welfare Act (Public Law 99–198). JOINN Laboratories (Suzhou, China) is fully accredited by the Association for Assessment and Accreditation of Laboratory Animal Care International (AAALAC). All procedures and activities involving the use and welfare of animals were approved by the Institutional Animal Care and Use Committee (IACUC) at JOINN Laboratories (Suzhou, China).
2.7. Evaluation of RSV preF/F-Specific Antibody Titers
In the study of in vivo screening of RSV preF mRNA sequence for STR-V003, the titers of serum-specific IgG antibody against RSV preF of mouse were tested using an ELISA kit (Vazyme, DD3910-01) according to the manufacturer’s instructions. Briefly, the microplate was precoated with anti-pre-F IgG and preF protein. Serum dilutions were added to the wells. Positive control and negative control were added to the control columns. After incubation, the plate was washed, and the anti-mouse antibodies labeled with HRP were added. After incubation, TMB was added, and plates were read in a microplate reader at 450 nm/630 nm wavelengths.
Evaluation of RSV F-specific antibody titers was conducted as previously described [
13]. ELISA plates were coated with recombinant human RSV fusion glycoprotein (total-F protein, final concentration: 0.2 μg/mL) (Sino Biological Inc. 11049-V0813, Beijing, China). The coated plates were incubated with a given serum dilution, and anti-mouse antibodies labeled with HRP (Abcam, ab6728, Cambridge, UK) were used to measure the binding of antibodies specifically to RSV-F protein using TMB substrate. Endpoint titers were defined as the reciprocal of the endpoint dilution, where the optical density (OD) signal of the serum sample was equal to or greater than twice the background OD signal.
In mouse model challenge experiments, the titers of serum-specific IgG antibody against RSV preF of mouse infection experiments were measured by ELISA. Briefly, 50 µL of the diluted antigen (HRSV (A) Pre-fusion glycoprotein F0, Acro Biosystems (RSF-V52H7, Beijing, China) at 2.0 µg/mL was added to the 96-well plate; the plate was sealed and left overnight at 2–8 °C. The plate was taken out and coated with the specific antigen from the refrigerator at 4 °C and washed once with washing solution (BIOLEGEND, 421601, San Diego, CA, USA). Then, 100 µL of blocking solution was added to each well, and the plate was sealed and incubated at 37 °C for 1.5 h. The blocking solution was discarded and washed once with washing solution. The serum samples were serially diluted with diluent. Then, 50 µL of the diluted sample or ELISA assay diluent (BIOLEGEND, 421203) was added to each well, and the plate was sealed and incubated at room temperature for 2 h. The liquid in the well was discarded and washed 3 times with washing solution. The HRP (Goat Anti-Mouse IgG H&L, Abcam, ab97023, Cambridge, UK) antibody was diluted with diluent 1:5000, 50 µL of HRP antibody added to each well; the plate was sealed and incubated at room temperature for 45 min in dark. Then, the liquid in the well was discarded and washed 3 times with washing solution. Chromogenic reagent A solution and B solution (BIOLEGEND, 421101) were mixed at 1:1, and 50 µL chromogenic solution was added to each well and incubated in the dark for 10 min. Then, 50 µL of stop solution (BIOLEGEND, 423001) was added to each well. The absorbance values at 450 nm were measured using a multi-functional microplate reader, the OD450 values were output, and the RSV-preF IgG antibody titers of serum samples of each animal were analyzed using a four-parameter fitting method.
2.8. Neutralizing Antibody
RSV neutralizing antibody was measured to evaluate the immunogenicity of STR-V003. Neutralizing antibody was detected by microneutralization. Briefly, the heat-inactivated serum samples were first diluted 20 times with DMEM, and then a 3-fold serial dilution was made; a total of 8 points were diluted. Serial dilutions of heat-inactivated serum from vaccinated or control animals were incubated with virus (200 TCID50/well) for 2 h at 37 °C. The serum–virus mixture or virus alone was added to the wells containing Hep-2 cells (ATCC, Manassas) and incubated for 2 h or 5 days at 37 °C. After removing the supernatant, a culture medium was added, and the culture continued for about 22 h. The cells were then fixed, and virus-specific foci were detected by antibody against RSV F protein (Sino Biological, 11049-R338, Beijing, China) or RSV G protein (Vazyme, DD1606, Nanjing, China), and secondary antibody (HRP-labeled Goat Anti-Rabbit IgG (H+L), Beyotime Institute of Biotechnology, A0208, Shanghai, China). The signal was developed by TMB, and absorbance was read at 450 nm. NT50 (the reciprocal of the serum dilution ratio when RSV viruses suppressed by 50%) was calculated to indicate the neutralizing activity of antibody against RSV viruses.
2.9. Quantification of Viral RNA in the Lung Tissue or Turbinate Bones of the Infected Animal by RT-qPCR
To evaluate the efficacy of the vaccine in the mouse and cotton rat model challenge experiment, RSV viral loads in lung tissue and turbinate bone were measured by RT-qPCR. The tissue samples were divided into several small pieces, and 600 μL RLT lysate (RNeasy Mini Kit, QIAGEN, 74104, Shanghai, China) was added to grind the lung tissue in a tissue homogenizer. Then, 100 μL of the lysate was used for RNA extraction and eluted with 50 μL of nuclease-free water (RNeasy Mini Kit) to obtain the total RNA. For turbinate bone, 150 μL of the lysate was added to 850 μL QIAzol (QIAGEN, 79306, Shanghai, China) for RNA extraction and eluted with 50 μL of nuclease-free water (RNeasy Mini Kit) to obtain total RNA. RSV-specific reverse transcription primers (GENEWIZ, Suzhou, China) were used with 10 μL RNA to synthesize cDNA. qPCR primers, probes (primers and probes were synthesized by GENEWIZ, Suzhou), FastStart Universal Probe Master (ROX) (Sigma-Aldrich, 04914058001, St. Louis, MO, USA), and water were mixed to prepare a qPCR reaction system, and 1 μL of cDNA or diluted plasmid RSV-N (GENEWIZ, Suzhou) was added as a template for TaqMan qPCR for detection. Using plasmid RSV-A-N or RSV-B-N copy number and qPCR amplification cycle number, a standard curve was created, the RSV copy number of all tested samples was calculated, and finally, the RSV virus copy number per gram of tissue was calculated.
2.10. Histopathology Assay
Histopathology assays were conducted as previously described [
13]. After perfusion, the lung tissue was fixed in 4% paraformaldehyde for more than 24 h. The next step was carried out in the pathological laboratory, where the tissue was dehydrated, followed by embedding and slicing with a thickness of 4 μm. The staining rack loaded with slices was placed in an oven at 60–65 °C for 1 h. After the paraffin melted to a transparent liquid state, the staining rack was placed at room temperature for 10 min to cool. After cooling, slices were placed in hematoxylin and eosin (HE) staining and sealed. Finally, lung sections were scored by a person blinded to the group assignment, and the scoring criteria are shown in
Supplementary Table S3.
2.11. Safety Study of STR-V003
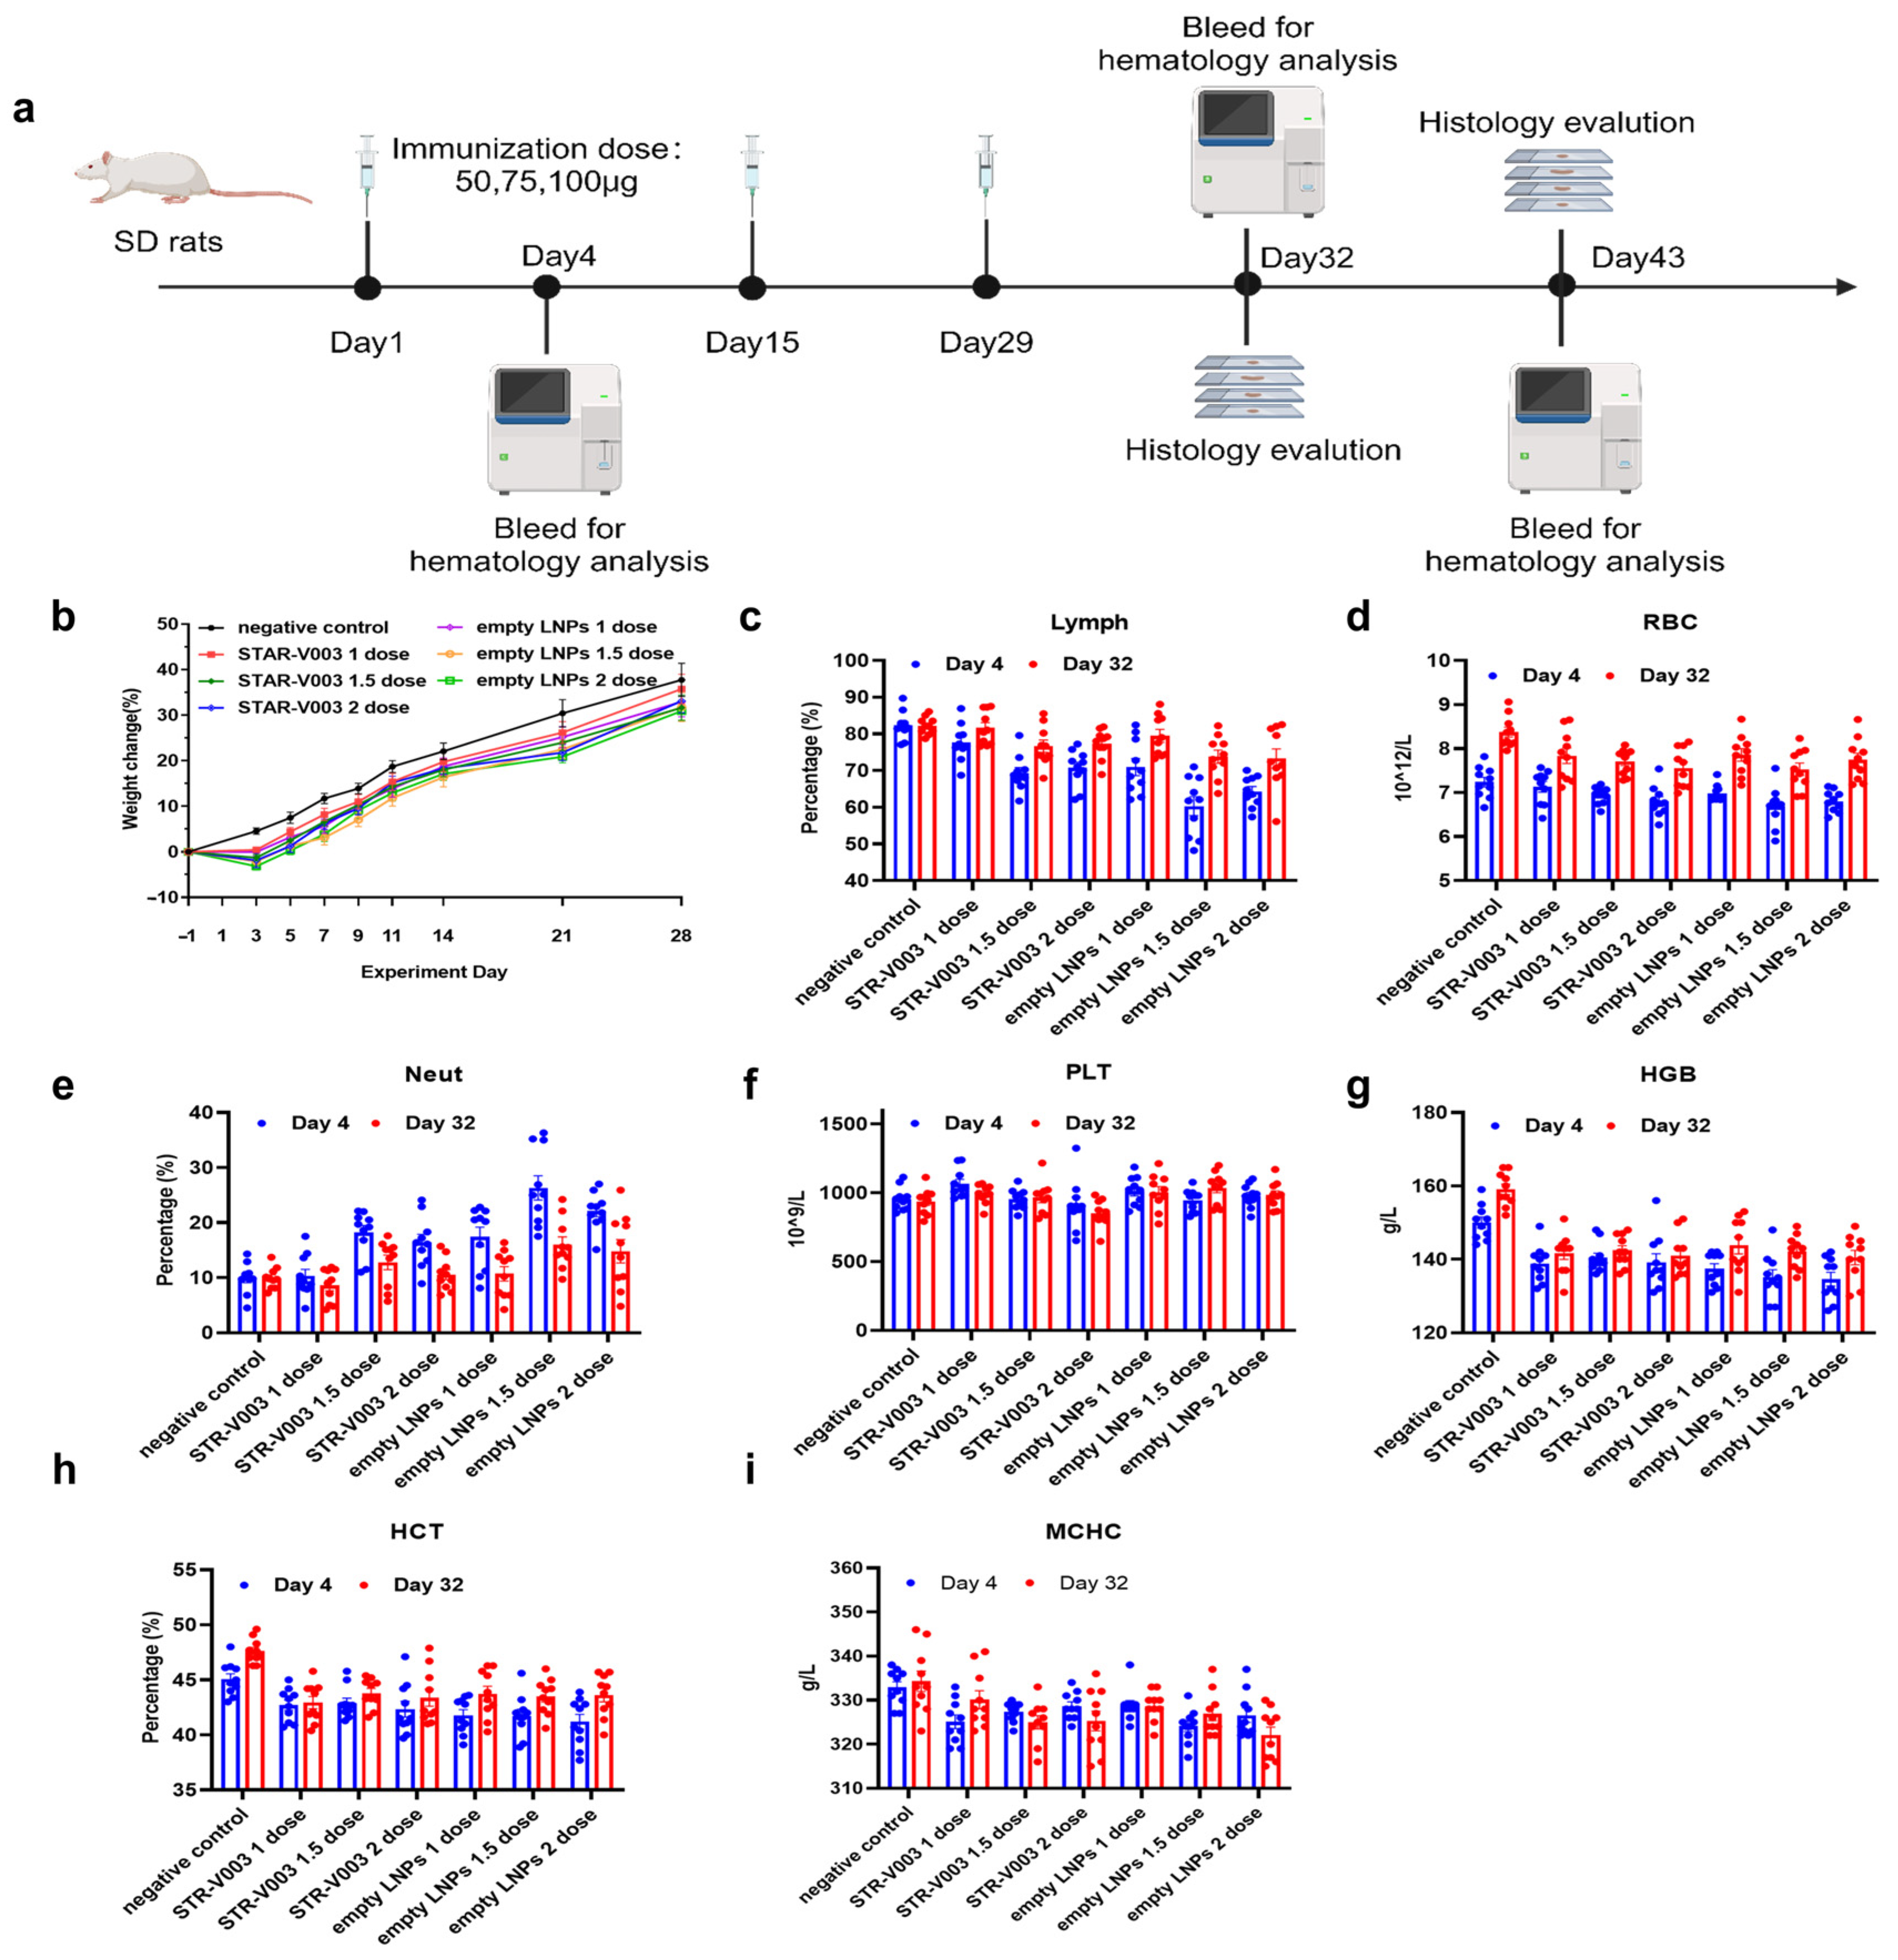
A total of 140 Sprague Dawley (SD) rats (70 animals/sex) were randomly assigned to 14 groups, with 5 animals/sex/group in Groups 1 to 7 designated as the main study groups and 5 animals/sex/group in Groups 8 to 14 as the satellite groups (
Supplementary Table S5). Rats were treated with 0.9% sodium chloride injection (Hunan Kelun Pharmaceutical Co., Ltd., Changsha, China) (1 mL/animal) as negative control for Group 1 and 8, STR-V003 (mRNA content of 50 μg/dose, 100 μg/mL, 0.5 mL/dose) at doses of 0.5 mL/1, 0.75 mL/1.5 and 1 mL/2 dose/animal for animals of Groups 2 and 9, Groups 3 and 10 or Groups 4 and 11, respectively, empty LNPs at doses of 0.5 mL/1, 0.75 mL/1.5 and 1 mL/2 dose/animal for animals of Groups 5 and 12, Groups 6 and 13 or Groups 7 and 14, respectively. The animals were administered treatment via intramuscular injection once every two weeks for 4 consecutive weeks (3 doses in total).
Parameters evaluated in this study included clinical observations (including administration site observations), body weight, food consumption, body temperature and hematology. The animals in Groups 1 to 7 and Groups 8 to 14 were euthanized 3 days after the last dosing (Day 32) and after the end of the recovery period (Day 43) for macroscopic changes, organ weight and histopathological examination of the liver, submandibular lymph nodes, mesenteric lymph nodes, inguinal lymph nodes, spleen and thymus.
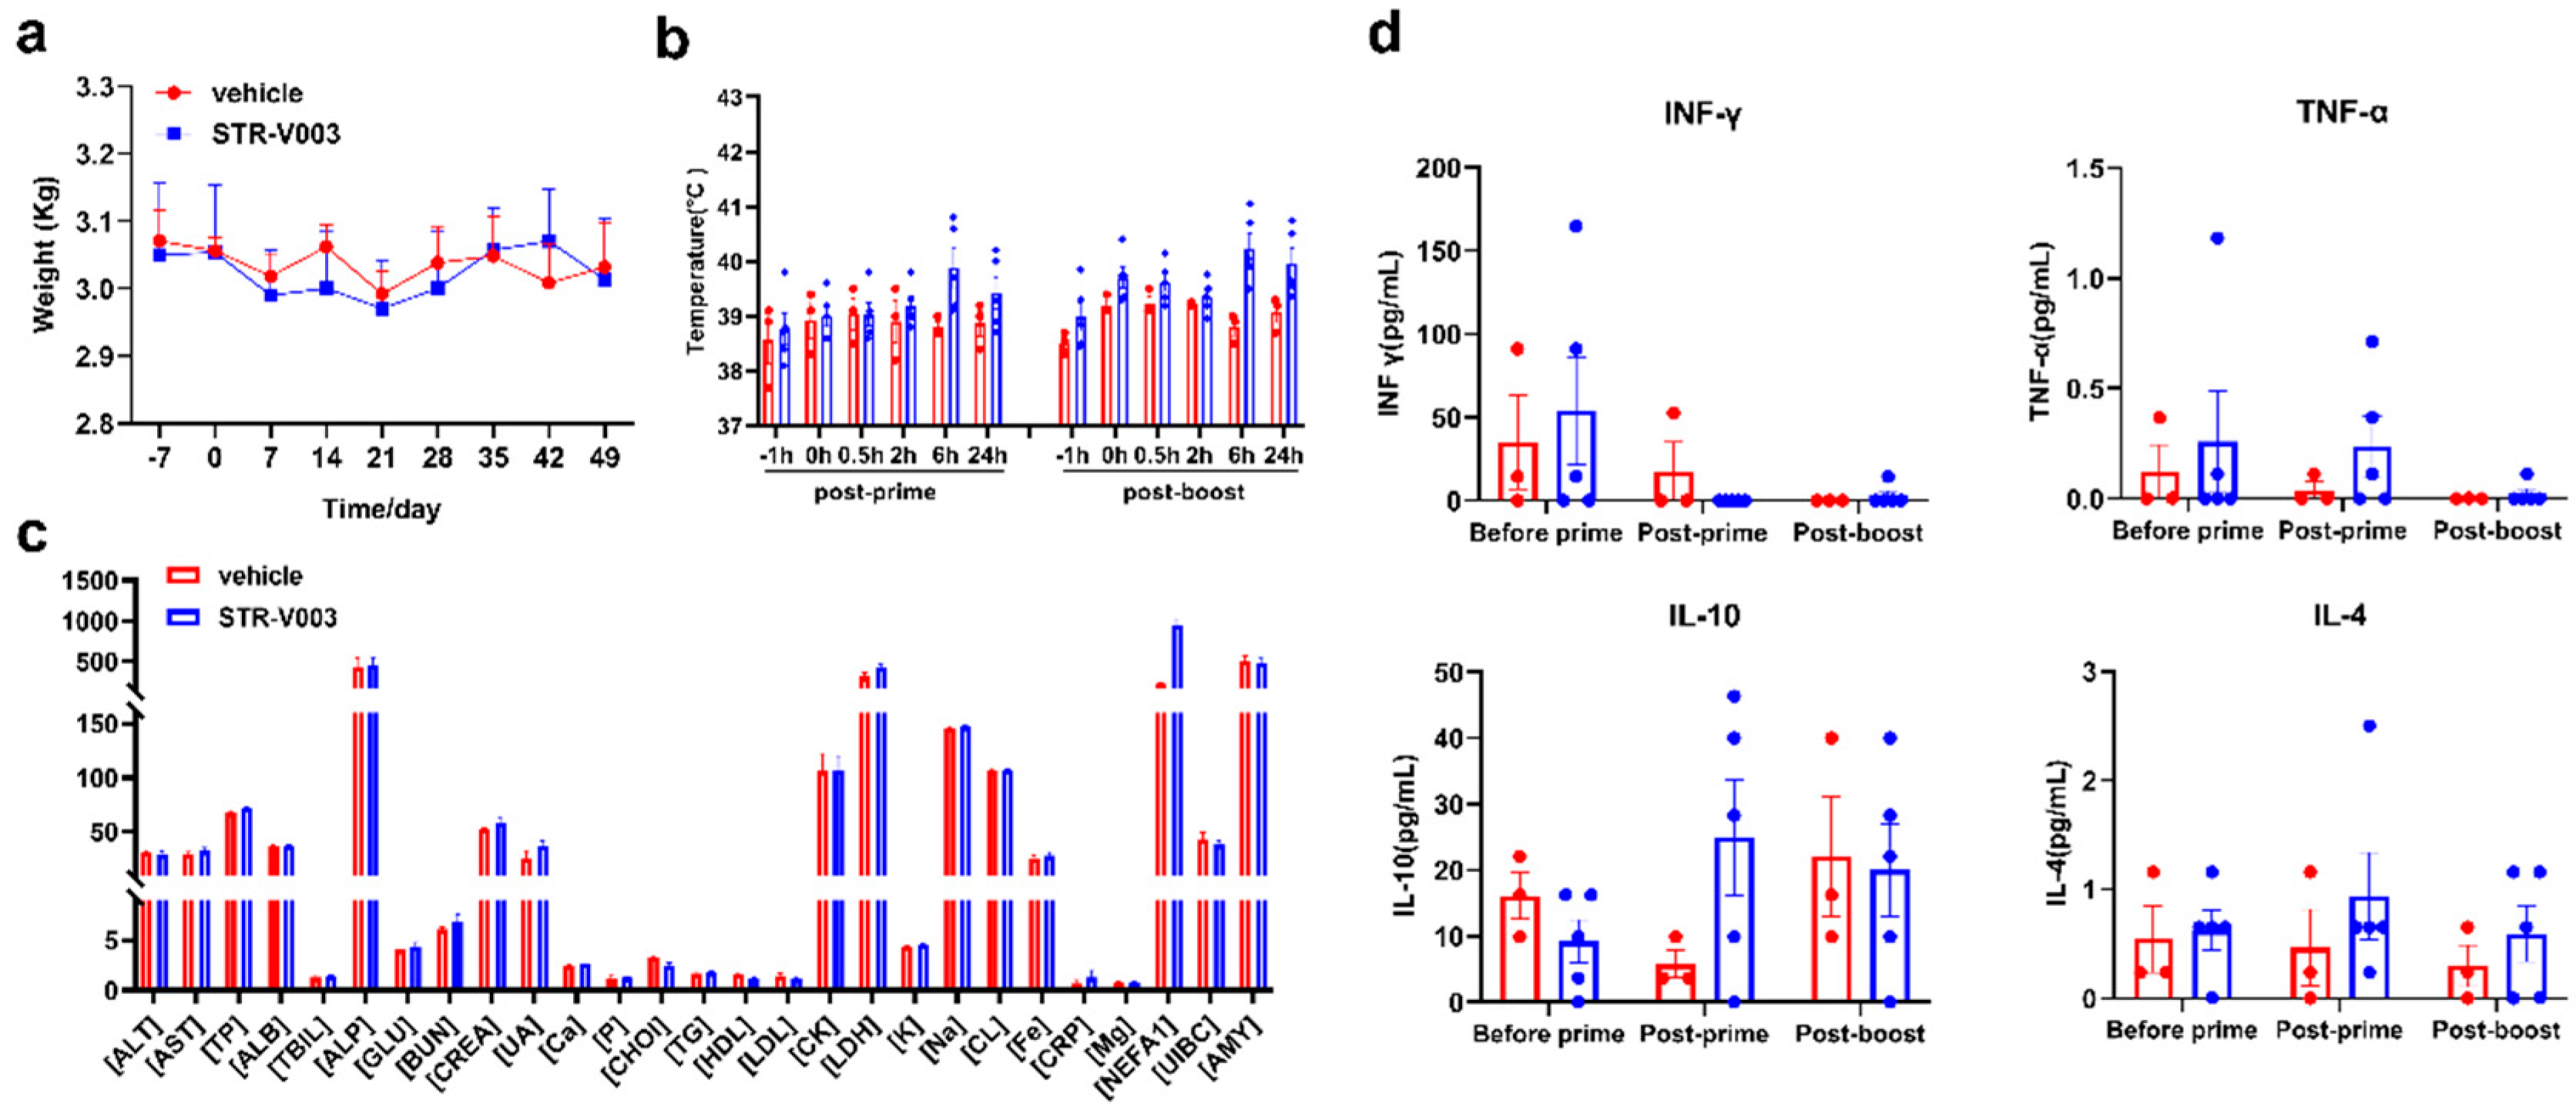
For the non-human primate (NHP) study, there were middle-aged female cynomolgus monkeys, among which 3 were in the vehicle group and 5 were dosed with STR-V003 analogue. The mRNA vaccine was injected intramuscularly on Day 0 and Day 21, which was consistent with our clinical plan. Blood was collected within 24 h after each administration to detect the blood biochemical and cytokine secretion conditions. The whole NHP experiment lasted for approximately 2 months, and the changes in body weight and body temperature were monitored and completed in the Saifu Laboratories Co., Ltd. (Beijing, China).
3. Statistical Analysis
GraphPad Prism 7.00 was used for statistical analysis of the data. One-way ANOVA was used to analyze the statistical difference of lung tissue viral loads. One-way ANOVA and two-way ANOVA were used to analyze the statistical difference in lung tissue pathology.
For the safety study of STR-V003/Empty LNPs, all statistical tests were conducted as 2-sided tests, and the level of significance was set at 5% or p ≤ 0.05. Group means and standard deviation (SD) were calculated for males and females, respectively, in the Provantis system (SAS 9.4 software), including body weights, body weight gain, organ weights, organ-to-body/brain weight ratios, clinical pathology (hematology), etc. in the negative control article and dose groups. The data were analyzed with the following procedures:
Levene’s test was performed on the original data to test for variance homogeneity. When the result showed no significance (p > 0.05), a one-way analysis of variance (ANOVA) was performed. If ANOVA showed significance (p ≤ 0.05), Dunnett’s test (parametric method) was performed for multiple comparisons.
In the case of variance heterogeneity (p ≤ 0.05 by Levene’s test), the data were logarithmically transformed using the natural logarithm (ln transformation), and then the transformed data were tested for variance homogeneity as described above using Levene’s test. In the case of variance heterogeneity of transformed data (p ≤ 0.05 by Levene’s test) or negative values, a Kruskal–Wallis test (non-parametric method) was performed on the original data. If the Kruskal–Wallis test showed significance (p ≤ 0.05), a two-independent-sample test (Mann–Whitney U Wilcoxon) was performed for multiple comparisons.
When a dataset has zero values, the zero values were regarded as 1/10 of the smallest positive value in the dataset when logarithmical transformation is performed.


