Abstract
Background: Currently, reported COVID-19 deaths are inadequate to assess the impact of the pandemic on global excess mortality. All-cause excess mortality is a WHO-recommended index for assessing the death burden of COVID-19. However, the global excess mortality assessed by this index remains unclear. We aimed to assess the global excess mortality during the COVID-19 pandemic. Methods: We searched PubMed, EMBASE, and Web of Science for studies published in English between 1 January 2020, and 21 May 2022. Cross-sectional and cohort studies that reported data about excess mortality during the pandemic were included. Two researchers independently searched the published studies, extracted data, and assessed quality. The Mantel–Haenszel random-effects method was adopted to estimate pooled risk difference (RD) and their 95% confidence intervals (CIs). Results: A total of 79 countries from twenty studies were included. During the COVID-19 pandemic, of 2,228,109,318 individuals, 17,974,051 all-cause deaths were reported, and 15,498,145 deaths were expected. The pooled global excess mortality was 104.84 (95% CI 85.56–124.13) per 100,000. South America had the highest pooled excess mortality [134.02 (95% CI: 68.24–199.80) per 100,000], while Oceania had the lowest [−32.15 (95% CI: −60.53–−3.77) per 100,000]. Developing countries had higher excess mortality [135.80 (95% CI: 107.83–163.76) per 100,000] than developed countries [68.08 (95% CI: 42.61–93.55) per 100,000]. Lower middle-income countries [133.45 (95% CI: 75.10–191.81) per 100,000] and upper-middle-income countries [149.88 (110.35–189.38) per 100,000] had higher excess mortality than high-income countries [75.54 (95% CI: 53.44–97.64) per 100,000]. Males had higher excess mortality [130.10 (95% CI: 94.15–166.05) per 100,000] than females [102.16 (95% CI: 85.76–118.56) per 100,000]. The population aged ≥ 60 years had the highest excess mortality [781.74 (95% CI: 626.24–937.24) per 100,000]. Conclusions: The pooled global excess mortality was 104.84 deaths per 100,000, and the number of reported all-cause deaths was higher than expected deaths during the global COVID-19 pandemic. In South America, developing and middle-income countries, male populations, and individuals aged ≥ 60 years had a heavier excess mortality burden.
1. Introduction
As of 21 May 2022, more than 6.29 million people worldwide died from COVID-19 infection [1]. Global countries have adopted a series of public health measures to curb the coronavirus disease 2019 (COVID-19) pandemic, such as strict lockdown policies and wearing masks [2,3]. These measures cut off the main transmission routes of respiratory infectious diseases such as COVID-19 and influenza and lower their prevalence and mortality [2,3]. Notably, despite the reduction of accidental traffic deaths due to strict lockdown policies [4,5,6,7], these policies may increase the deaths of patients with chronic diseases because they have difficulty receiving timely health care [8,9,10]. Additionally, limited medical resources increase the risk of death among patients with chronic diseases [11]. The deaths from mental depression, suicide, and violence also increased during the pandemic [4,12,13]. Therefore, the COVID-19 pandemic is threatening global health resources and economic and political development.
Mortality statistics are fundamental to the decision-making of public health [14]. However, the categorization of death is inconsistent among countries, health systems, and physicians [3,9]. Importantly, COVID-19 deaths may be underestimated in the early stages of the pandemic because many cases and deaths that should have been attributed to COVID-19 were not detected and identified due to inadequate tests and overloaded health systems, caused by a sudden increase in COVID-19 symptom patients in most countries [15]. Furthermore, influenced by misdiagnosis and pandemic “bias”, indirect deaths during the pandemic are likely to be misclassified as direct deaths of COVID-19, such as deaths caused by resource constraints in health care systems, unnatural causes, or extreme events [9,14,16]. Even before the major reshuffling of death causes due to COVID-19, death certificates were known to be notoriously error-prone. Comorbidities may complicate the assignment of COVID-19 and other illnesses on the death certificate [8,17,18].
Currently, challenges exist in distinguishing death causes induced by COVID-19 or other events. A modeling study indicates that reported COVID-19 deaths are inadequate to assess the impact of the pandemic on excess mortality [14]. Excess mortality is a more comprehensive index to measure the impact of the COVID-19 pandemic on deaths, and it refers to the number of deaths from all causes during the pandemic more than what we would have expected to see under “normal” conditions, including the deaths induced by a lack of medical resources and restrictive intervention during the pandemic [19,20,21]. Moreover, excess mortality can be the reference for assessing COVID-19 deaths because further studies can estimate COVID-19 deaths based on this result by subtracting other causes of death from excess mortality (e.g., heat waves, war, etc.) [22].
At present, various studies from many countries have analyzed excess mortality during the pandemic, whereas global excess mortality is unclear. Most countries, such as the United States, India, and the United Kingdom [23,24,25,26], reported all-cause excess mortality more than the expected level, but it was not in other countries such as Australia and Japan [15,26,27]. Therefore, we conducted this systematic review and meta-analysis study to evaluate global excess mortality and provide evidence regarding the hazard of the pandemic.
2. Materials and Methods
2.1. Search Strategy
We conducted the meta-analysis following the Preferred Reporting Items for Systematic Reviews and Meta-Analyses (PRISMA) guidelines [28]. This review was registered with PROSPERO (CRD42022334486). Two researchers (WS and ZG) searched published English-language studies from 1 January 2020, to 21 May 2022, through PubMed, EMBASE, and Web of Science. The search terms included (“SARS-CoV-2” or “COVID-19”) and (“Excess Mortality” or “Excess Death” or “Additional Death”). The detailed search strategies are shown in the eMethods in the Supplemental Materials: Text S1. WS and ZG independently reviewed the titles, abstracts, and full texts of articles, and identified additional studies from the reference lists. Disagreements were resolved by discussion with 2 other authors (YW and JY).
The primary outcome to evaluate excess death was excess mortality during the pandemic, defined as the difference between the number of reported all-cause deaths and the expected number of deaths during the pandemic divided by the total population during the same period [29]. The calculation formula was .
2.2. Inclusion and Exclusion Criteria
The inclusion criteria were as follows: (1) observational studies (cross-sectional studies and cohort studies) and (2) studies with extractable data to calculate the excess mortality. We excluded the following studies: (1) duplicates and (2) nonoriginal articles, such as reviews and comments; (3) articles unable to find full text; (4) studies with insufficient data to calculate excess mortality; (5) preprints; (6) overlap studies; (7) non-English studies; (8) nongeneral population studies.
For more than one study in a country, we selected the study that covered the largest population, spanned the longest time period, and performed analyses in different age and sex groups.
2.3. Data Extraction
The authors WS and WY independently screened the titles and abstracts, and excluded studies that did not meet the inclusion criteria. Discrepancies were resolved by discussion with the main author (JY). The following data were extracted independently by two authors (WS and WY) from the included studies: first author, publication year, country, study design, the number of reported all-cause deaths, the number of expected all-cause deaths, the number of population, pandemic time and time used to estimate expected deaths. If available, we also extracted the data on the sex and age of reported all-cause deaths, expected all-cause deaths, and the population.
2.4. Risk of Bias Assessment
WS and YW independently assessed the risk of bias for each study, which was cross-checked by ZG and JY. Cross-sectional studies were assessed by the Agency for Healthcare Research and Quality (AHRQ) [30] and cohort studies were assessed by the Newcastle–Ottawa scale (Table S1) [31]. Reviewers rated each domain for overall risk of bias as low, moderate, high, or serious/critical (Table S2).
2.5. Data Synthesis and Statistical Analysis
We performed a meta-analysis of global excess mortality during the pandemic, and we reported the pooled risk difference (RD) as excess mortality. The Mantel–Haenszel random-effects method [32] was adopted to estimate the pooled risk difference and their 95% confidence intervals (CIs). The lower limit of 95% CI > 0 indicated that the number of reported all-cause deaths was higher than that of expected deaths; the upper limit of 95% CI < 0 indicated that the number of reported all-cause deaths was lower than that of expected deaths; that the 95% CI included 0 suggested no significant difference between reported and expected deaths. The heterogeneity among the studies was estimated using I2 values. Very low, low, moderate, and high degrees of heterogeneity were defined as I2 ≤ 25%, 25% to ≤50%, 50% to ≤75%, and ≥75%, respectively [33].
We performed subgroup analyses in continents (Asia vs. Africa vs. Europe vs. North America vs. South America vs. Oceania), country development levels (developing country vs. developed country), World Bank income levels (lower middle-income country vs. upper middle-income country vs. high-income country), age groups (<40 years vs. 40–60 years vs. ≥60 years) and sex (male vs. female). We performed sensitivity analyses by excluding countries with populations less than 1 million. All analyses were performed using Stata software (version 12.0; Stata SE Corporation LP, College Station, TX, USA). A two-sided p value < 0.05 was considered statistically significant [34].
3. Results
3.1. Characteristics of Included Studies
A total of 6907 studies were initially identified through searching the database and the reference list of articles and reviews. Among them, 1781 duplicates and 4687 irrelevant articles were excluded. After exclusion, 439 studies were eligible for full-text review. The final meta-analysis comprised 20 eligible studies (Figure 1), References [15,21,24,25,26,35,36,37,38,39,40,41,42,43,44,45,46,47,48,49] of which 79 countries were included in the study (Table 1).
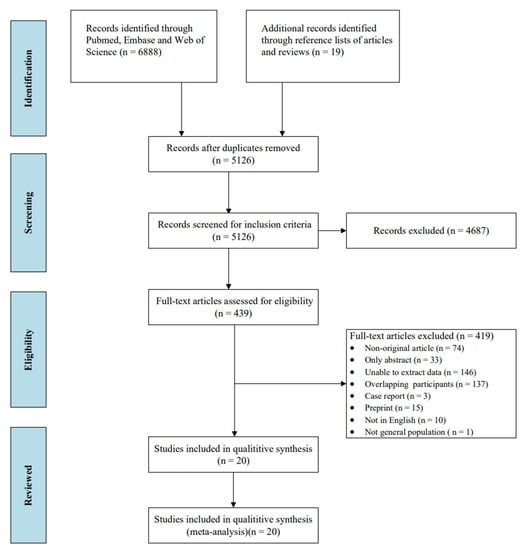
Figure 1.
Flowchart of the study selection.

Table 1.
Characteristics of the studies included in the systematic review and meta-analysis.
Among the 20 studies, 2 (10.0%) were cohort studies, and 18 (90.0%) were cross-sectional studies. Nineteen (95.0%) studies were assessed as having a low risk of bias, and one (5.0%) was assessed as having a moderate risk of bias. Among 79 countries, 23 (29.1%) were conducted in Asia, 39 (49.4%) in Europe, 4 (5.1%) in North America, 8 (10.1%) in South America, 3 (3.8%) in Africa, and 2 (2.5%) in Oceania. Forty-three (54.4%) were developing countries, and 36 (45.6%) were developed countries. Nine (11.4%) were lower-middle-income countries, 24 (30.4%) were upper-middle-income countries, and 46 (58.2%) were high-income countries.
3.2. Excess Mortality during the COVID-19 Pandemic
A total of 79 countries from 20 studies were included. During the COVID-19 pandemic, of 2,228,109,318 individuals, 17,974,051 all-cause deaths were reported, and 15,498,145 deaths were expected. The pooled global excess mortality was 104.84 (95% CI 85.56–124.13) per 100,000, with high heterogeneity among countries (I2 = 99.9%) (Figure 2).
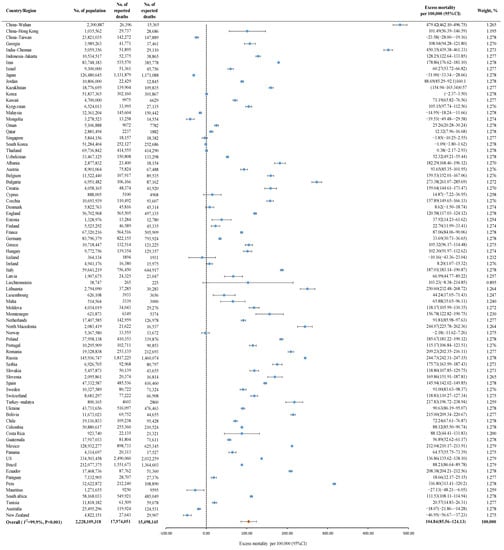
Figure 2.
The global excess mortality during the COVID-19 pandemic among 79 countries. Orange dot: the pooled excess mortality; Blue dot: excess mortality in different countries; CI: confidence interval.
Figure 3 shows the results of the subgroup analysis. South America had the highest pooled excess mortality [134.02 deaths (95% CI: 68.24–199.80) per 100,000], followed by North America [124.63 deaths (95% CI: 65.82–183.45) per 100,000], Europe [122.16 deaths (95% CI: 97.73–146.60) per 100,000], Asia [83.40 deaths (95% CI: 48.77–118.03) per 100,000], Africa [35.49 deaths (95% CI:−41.56–112.55) per 100,000], and Oceania [−32.15 deaths (95% CI:−60.53–−3.77) per 100,000]. The pooled excess mortality was higher in developing countries [135.80 deaths (95% CI: 107.83–163.76) per 100,000] than in developed countries [68.08 deaths (95% CI%: 42.61–93.55) per 100,000]. The pooled excess mortality in lower-middle-income countries [133.45 deaths (95% CI: 75.10–191.81) per 100,000] and upper-middle-income countries [149.88 deaths (110.35 –189.38) per 100,000] was higher than that in high-income countries [75.54 deaths (95% CI: 53.44–97.64) per 100,000]. The pooled excess mortality was higher in males [130.10 deaths (95% CI: 94.15–166.05) per 100,000] than females [102.16 deaths (95% CI: 85.76–118.56) per 100,000]. In eight countries, the population aged ≥ 60 had the highest excess mortality [781.74 deaths (95% CI: 626.24–937.24) per 100,000], followed by the population aged 40–60 [62.48 deaths (95% CI: 24.45–100.51) per 100,000] and aged < 40 [−0.13 deaths (95% CI: −6.24–5.97) per 100,000].
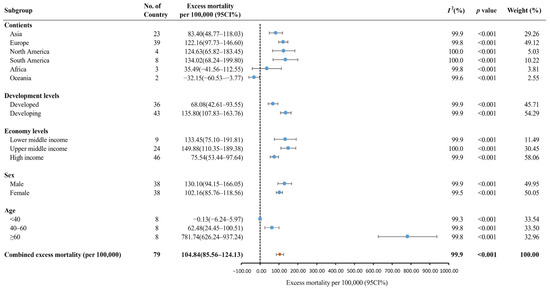
Figure 3.
The global excess mortality during the COVID-19 pandemic by subgroup. Orange dot: the pooled excess mortality; Blue dot: excess mortality in different subgroups; CI: confidence interval.
3.3. Publication Bias and Sensitivity Analysis
We did not analyze publication bias because the study subject in our study was the country, not the originally published studies. After excluding eight countries with a study population of less than 1 million, the pooled excess mortality [106.99 deaths (95% CI: 86.71–127.27) per 100,000] was similar to the original result. (Figure S1)
4. Discussion
In this systematic review and meta-analysis, we found that the pooled excess mortality was 104.84 deaths (95% CI: 85.56–124.13) per 100,000. We found that the excess mortality was higher in South America, North America, Europe, developing countries, lower- or upper-middle-income countries, the male population, and the population aged ≥ 60 years.
To the best of our knowledge, the current study is the first systematic review to evaluate all-cause excess mortality during the pandemic. In this study, the pooled excess mortality was 104.84 per 100,000 globally. Our results are consistent with previous findings (120.30 per 100,000) from COVID-19 Excess Mortality Collaborators, although their findings were derived from a model estimation covering 187 countries/regions [14]. Previous literature reported all-cause excess mortality from January to August 2020 for 22 countries but did not calculate the pooled excess mortality [15]. Similarly, another study calculated all-cause excess mortality during the SARS-CoV-2 pandemic in 67 countries, and no pooled excess mortality data were presented [26]. The coronavirus not only directly kills people but also causes a chain reaction of premature deaths in society. For example, in response to the ongoing epidemic crisis, the Greek public healthcare system ceased most of its regular activities and redirected available resources to COVID-19 treatment and caused excess non-COVID-19 deaths (representing 62% of all-cause excess deaths) during the first 9 months of the epidemic [50]. A similar situation occurred in Italy and England, where 20% and 25% of excess deaths during the first wave of the epidemic could not be directly attributed to COVID-19, respectively [51,52]. Besides, lacking guidelines and personal protective equipment also downsized the clinical activities of primary care centers, which may have increased excess non-COVID-19 deaths during the pandemic [50].
We found that South America had the highest pooled excess mortality, followed by North America, Europe, Asia, Africa, and Oceania, and reported all-cause deaths in Oceania were lower than expected deaths. Our findings are consistent with the COVID-19 Excess Mortality Collaborators’ results [14]. In our study, the top three countries in South America for excess mortality were Ecuador, Bolivia, and Peru, which is consistent with the findings of Karlinsky et al. [3]. In the early stages of the pandemic, the number of deaths increased dramatically in Ecuador due to limited detection capacity and inadequate emergency measures, such as social distancing and wearing masks [49]. In Peru, many factors contributed to all-cause deaths, including coronavirus infection, overloaded health systems, lack of medical services, limited number of ICU beds, and inadequate oxygen supply equipment during the pandemic [9].
North America and Europe were two continents with excess mortality that was only lower than that of South America. Lower mask use, more frequent population mobility, and fewer social distancing mandates may cause high all-cause excess mortality in the United States and parts of European countries [14]. In this study, Africa had low excess mortality, but the prevalence of COVID-19 was severe in sub-Saharan Africa. Thus, we consider that underreporting of deaths or lack of mortality-related surveillance or reporting in some countries may lead to a low rate [14,53,54]. The number of reported all-cause deaths in Oceania was lower than the expected deaths, which is consistent with the findings of previous studies [14,15]. This phenomenon may be related to the following reasons: First, Australia and New Zealand have implemented strict entry-exit screening, timely detection, vaccination and mask-wearing requirements, close contact tracking, and vulnerable group attention during the pandemic [55,56,57,58]. Second, the medical information surveillance system plays an important role in the timely response to public health emergencies in Australia [59]. Third, unique meteorological factors and the Australian government’s influenza vaccination campaign during the pandemic reduced the number of influenza deaths [15]. All the above actions may potentially reduce the number of all-cause deaths in Oceania during the pandemic.
We found that the pooled excess mortality in developing countries was higher than that in developed countries, and middle-income countries had higher excess mortality than high-income countries. The results of the COVID-19 excess mortality collaborators supported that East Asia, Australia, and the high-income Asia-Pacific region had low excess mortality [14], which is similar to our findings. The pandemic has brought shocks to health systems in countries worldwide. Our analysis suggests that developed countries have better quality and more adequate quantities of health care services (e.g., number of intensive care beds, oxygen ventilators, etc.) [60] compared to developing countries. Thus, these advantages might reduce all-cause excess mortality in developed countries. In addition, vaccination is an important protective factor in reducing excess deaths globally, and studies have shown that the number of new deaths per million people decreases over time as vaccine coverage rises [61]. At the beginning of the outbreak, developed countries had better access to the COVID-19 vaccine and higher public accessibility to vaccination, so their vaccine coverage was higher than that of developing countries [62].
In this systematic review, the male population had higher excess mortality than the female population, which is consistent with previous studies [41,63,64,65]. Males with COVID-19 infection have longer courses and worse prognoses than females. In addition, androgens, especially testosterone, are considered a possible risk factor [66]. Populations older than 60 years had higher excess mortality, and several country studies also indicate the same results [42,45,67,68]. We believe that the senior population has lower physical function and immunity compared to younger people, and they are more susceptible to the neo-crown virus during the pandemic [69,70]. Meanwhile, elderly people tend to suffer from one or more chronic diseases, and they are at a higher risk of death due to neo-coronavirus or post-infection complications after unfortunate infections. Moreover, the elderly population is more concerned about the effects of adverse vaccine reactions, and therefore, vaccine hesitancy leads to relatively low vaccination rates in this population. Especially developed countries have a much larger proportion of the elderly population and the excess number of deaths from this population is greater [69,70].
Our meta-analysis still has several limitations. First, the number of reported all-cause deaths is real-world data from the mortality surveillance system or death survey in 79 countries. Despite quality control of the data, it is possible that all-cause excess mortality in some countries is underestimated due to delayed or omissive. Because robust vital registration systems do not exist in many parts of the world, the WHO estimated that 40% of global deaths that occurred in 2020 were unregistered [71]. Second, only 10.1% of countries reported the number of all-cause reported deaths and expected deaths by sex and age groups. It is necessary to refine and supplement excess mortality results for sex and age by including more country data in the future. Third, the number of African countries included in this study is small. However, Africa has a severe prevalence of COVID-19 with a potentially high number of excess deaths. Relevant studies in Africa are required to further complement all-cause excess mortality globally.
5. Conclusions
In this meta-analysis, the pooled global excess mortality was 104.84 deaths per 100,000, and the number of all-cause reported deaths was higher than expected deaths during the COVID-19 pandemic worldwide. Excess mortality was higher in South America, North America, Europe, developing countries, middle-income countries, the male population, and individuals aged ≥ 60 years. Further research needs to more accurately estimate all-cause excess mortality attributed to the COVID-19 pandemic.
Supplementary Materials
The following supporting information can be downloaded at: https://www.mdpi.com/article/10.3390/vaccines10101702/s1, Text S1: Search strategy; Table S1: Risk of bias of all included cross-sectional studies using the Agency for Healthcare Research and Quality scale (AHRQ-Tool) (n = 18); Table S2: Risk of bias of all included cohort studies using the Newcastle-Ottawa quality assessment scale (n = 2); Figure S1: Sensitive analysis of excess mortality among 71 countries/regions.
Author Contributions
Conceptualization and study design, J.L. and M.L.; literature search, data extraction, literature quality assessment, W.S., Y.W., Z.G. and J.Y.; statistical analysis and manuscript writing, W.S.; manuscript revising, W.S. and M.L. All authors have read and agreed to the published version of the manuscript.
Funding
This work was supported by grants 72122001 and 71934002 from the National Natural Science Foundation of China, grants 2021ZD0114101, 2021ZD0114104, and 2021ZD0114105 from the National Key Research and Development Program of China. The funders had no role in study design, data collection and analysis, decision to publish, or preparation of the paper. No payment was received by any of the co-authors for the preparation of this article.
Institutional Review Board Statement
Not applicable.
Informed Consent Statement
Not applicable.
Data Availability Statement
Data can be obtained by contacting the corresponding author.
Acknowledgments
Thanks to all authors for their contributions to this article.
Conflicts of Interest
The authors declare no conflict of interest.
References
- World Health Organization. WHO Coronavirus (COVID-19) Dashboard. 2022. Available online: https://covid19.who.int/ (accessed on 21 May 2022).
- Kung, S.; Doppen, M.; Black, M.; Hills, T.; Kearns, N. Reduced mortality in New Zealand during the COVID-19 pandemic. Lancet 2021, 397, 25. [Google Scholar] [CrossRef]
- Karlinsky, A.; Kobak, D. Tracking excess mortality across countries during the COVID-19 pandemic with the World Mortality Dataset. Elife 2021, 10, e69336. [Google Scholar] [CrossRef] [PubMed]
- Kirpich, A.; Shishkin, A.; Weppelmann, T.A.; Tchernov, A.P.; Skums, P.; Gankin, Y. Excess mortality in Belarus during the COVID-19 pandemic as the case study of a country with limited non-pharmaceutical interventions and limited reporting. Sci. Rep. 2022, 12, 5475. [Google Scholar] [CrossRef] [PubMed]
- European Commission. Road Safety: 4000 Fewer People Lost Their Lives on Eu Roads in 2020 as Death Rate Falls to All Time Low 2021. Available online: https://ec.europa.eu/transport/modes/road/news/2021-04-20-road-safety_en (accessed on 1 July 2022).
- Transport Community Permanent Secretariat. Fatalities for 2020 Annual Statistics for Western Balkans. 2021. Available online: https://www.transport-community.org/wp-content/uploads/2021/04/Annual-Statistics-2020.pdf (accessed on 1 July 2022).
- Faust, J.S.; Du, C.; Mayes, K.D.; Li, S.X.; Lin, Z.; Barnett, M.L.; Krumholz, H.M. Mortality from Drug Overdoses, Homicides, Unintentional Injuries, Motor Vehicle Crashes, and Suicides During the Pandemic, March-August 2020. JAMA 2021, 326, 84–86. [Google Scholar] [CrossRef]
- Gobiņa, I.; Avotiņš, A.; Kojalo, U.; Strēle, I.; Pildava, S.; Villeruša, A.; Briģis, Ģ. Excess mortality associated with the COVID-19 pandemic in Latvia: A population-level analysis of all-cause and noncommunicable disease deaths in 2020. BMC Public Health 2022, 22, 1109. [Google Scholar] [CrossRef]
- Ramírez-Soto, M.C.; Ortega-Cáceres, G. Analysis of Excess All-Cause Mortality and COVID-19 Mortality in Peru: Observational Study. Trop. Med. Infect Dis. 2022, 7, 44. [Google Scholar] [CrossRef]
- Antonio-Villa, N.E.; Fernandez-Chirino, L.; Pisanty-Alatorre, J.; Mancilla-Galindo, J.; Kammar-García, A.; Vargas-Vázquez, A.; González-Díaz, A.; Fermín-Martínez, C.A.; Márquez-Salinas, A.; Guerra, E.C.; et al. Comprehensive Evaluation of the Impact of Sociodemographic Inequalities on Adverse Outcomes and Excess Mortality during the Coronavirus Disease 2019 (COVID-19) Pandemic in Mexico City. Clin. Infect Dis. 2022, 74, 785–792. [Google Scholar] [CrossRef]
- French, G.; Hulse, M.; Nguyen, D.; Sobotka, K.; Webster, K.; Corman, J.; Aboagye-Nyame, B.; Dion, M.; Johnson, M.; Zalinger, B.; et al. Impact of hospital strain on excess deaths during the COVID-19 pandemic-United States, july 2020-july 2021. Am. J. Transplant. 2022, 22, 654–657. [Google Scholar] [CrossRef]
- Tanaka, T.; Okamoto, S. Increase in suicide following an initial decline during the COVID-19 pandemic in Japan. Nat. Hum. Behav. 2021, 5, 229–238. [Google Scholar] [CrossRef]
- Sun, S.; Cao, W.; Ge, Y.; Siegel, M.; Wellenius, G.A. Analysis of Firearm Violence during the COVID-19 Pandemic in the US. JAMA Netw. Open 2022, 5, e229393. [Google Scholar] [CrossRef]
- COVID-19 Excess Mortality Collaborators. Estimating excess mortality due to the COVID-19 pandemic: A systematic analysis of COVID-19-related mortality, 2020-2021. Lancet 2022, 399, 1513–1536. [Google Scholar] [CrossRef]
- Achilleos, S.; Quattrocchi, A.; Gabel, J.; Heraclides, A.; Kolokotroni, O.; Constantinou, C.; Pagola Ugarte, M.; Nicolaou, N.; Rodriguez-Llanes, J.M.; Bennett, C.M.; et al. Excess all-cause mortality and COVID-19-related mortality: A temporal analysis in 22 countries, from January until August 2020. Int. J. Epidemiol. 2022, 51, 35–53. [Google Scholar] [CrossRef] [PubMed]
- Ioannidis, J.P.A. Over- and under-estimation of COVID-19 deaths. Eur. J. Epidemiol. 2021, 36, 581–588. [Google Scholar] [CrossRef]
- Kiang, M.V.; Irizarry, R.A.; Buckee, C.O.; Balsari, S. Every Body Counts: Measuring Mortality From the COVID-19 Pandemic. Ann. Intern. Med. 2020, 173, 1004–1007. [Google Scholar] [CrossRef] [PubMed]
- Koffman, J.; Gross, J.; Etkind, S.N.; Selman, L. Uncertainty and COVID-19: How are we to respond? J. R. Soc. Med. 2020, 113, 211–216. [Google Scholar] [CrossRef] [PubMed]
- Zhou, F.; Hu, T.J.; Zhang, X.Y.; Lai, K.; Chen, J.H.; Zhou, X.H. The association of intensity and duration of non-pharmacological interventions and implementation of vaccination with COVID-19 infection, death, and excess mortality: Natural experiment in 22 European countries. J. Infect Public Health 2022, 15, 499–507. [Google Scholar] [CrossRef] [PubMed]
- Rizzi, S.; Søgaard, J.; Vaupel, J.W. High excess deaths in Sweden during the first wave of COVID-19: Policy deficiencies or ’dry tinder’? Scand. J. Public Health 2022, 50, 33–37. [Google Scholar] [CrossRef] [PubMed]
- Shin, M.S.; Sim, B.; Jang, W.M.; Lee, J.Y. Estimation of Excess All-cause Mortality during COVID-19 Pandemic in Korea. J. Korean Med. Sci. 2021, 36, e280. [Google Scholar] [CrossRef]
- Islam, N. "Excess deaths" is the best metric for tracking the pandemic. BMJ 2022, 376, o285. [Google Scholar] [CrossRef]
- O’Donnell, S.B.; Bone, A.E.; Finucane, A.M.; McAleese, J.; Higginson, I.J.; Barclay, S.; Sleeman, K.E.; Murtagh, F.E. Changes in mortality patterns and place of death during the COVID-19 pandemic: A descriptive analysis of mortality data across four nations. Palliat. Med. 2021, 35, 1975–1984. [Google Scholar] [CrossRef]
- Jacobson, S.H.; Jokela, J.A. Beyond COVID-19 deaths during the COVID-19 pandemic in the United States. Health Care Manag. Sci. 2021, 24, 661–665. [Google Scholar] [CrossRef]
- Lewnard, J.A.; Mahmud, A.; Narayan, T.; Wahl, B.; Selvavinayagam, T.S.; Mohan, B.C.; Laxminarayan, R. All-cause mortality during the COVID-19 pandemic in Chennai, India: An observational study. Lancet Infect Dis. 2022, 22, 463–472. [Google Scholar] [CrossRef]
- Sanmarchi, F.; Golinelli, D.; Lenzi, J.; Esposito, F.; Capodici, A.; Reno, C.; Gibertoni, D. Exploring the Gap between Excess Mortality and COVID-19 Deaths in 67 Countries. JAMA Netw. Open 2021, 4, e2117359. [Google Scholar] [CrossRef] [PubMed]
- Anzai, T.; Fukui, K.; Ito, T.; Ito, Y.; Takahashi, K. Excess Mortality from Suicide During the Early COVID-19 Pandemic Period in Japan: A Time-Series Modeling Before the Pandemic. J. Epidemiol. 2021, 31, 152–156. [Google Scholar] [CrossRef] [PubMed]
- Page, M.J.; McKenzie, J.E.; Bossuyt, P.M.; Boutron, I.; Hoffmann, T.C.; Mulrow, C.D.; Shamseer, L.; Tetzlaff, J.M.; Akl, E.A.; Brennan, S.E.; et al. The PRISMA 2020 statement: An updated guideline for reporting systematic reviews. BMJ 2021, 372, n71. [Google Scholar] [CrossRef] [PubMed]
- Aron, J.; Muellbauer, J. Excess Mortality versus COVID-19 Death Rates: A Spatial Analysis of Socioeconomic Disparities and Political Allegiance Across U.S. States. Rev. Income Wealth 2022, 68, 348–392. [Google Scholar] [CrossRef]
- Rostom, A.; Dubé, C.; Cranney, A.; Saloojee, N.; Sy, R.; Garritty, C.; Sampson, M.; Zhang, L.; Yazdi, F.; Mamaladze, V.; et al. Celiac Disease. Rockville (MD): Agency for Healthcare Research and Quality (US), 2004 Sep. (Evidence Reports/Technology Assessments, No. 104.) Appendix D. Quality Assessment Forms. 2004. Available online: https://www.ncbi.nlm.nih.gov/books/NBK35156/ (accessed on 24 May 2022).
- GA Wells, B.S.; O’Connell, D.; Peterson, J.; Welch, V.; Losos, M.; Tugwell, P. The Newcastle-Ottawa Scale (NOS) for Assessing the Quality of Nonrandomised Studies in Meta-Analyses. 2011. Available online: http://www.ohri.ca/programs/clinical_epidemiology/oxford.asp (accessed on 12 June 2022).
- Muka, T.; Glisic, M.; Milic, J.; Verhoog, S.; Bohlius, J.; Bramer, W.; Chowdhury, R.; Franco, O.H. A 24-step guide on how to design, conduct, and successfully publish a systematic review and meta-analysis in medical research. Eur. J. Epidemiol. 2020, 35, 49–60. [Google Scholar] [CrossRef]
- Higgins, J.P.; Thompson, S.G. Quantifying heterogeneity in a meta-analysis. Stat. Med. 2002, 21, 1539–1558. [Google Scholar] [CrossRef]
- Egger, M.; Davey Smith, G.; Schneider, M.; Minder, C. Bias in meta-analysis detected by a simple, graphical test. BMJ 1997, 315, 629–634. [Google Scholar] [CrossRef]
- Santos, A.M.D.; Souza, B.F.; de Carvalho, C.A.; Campos, M.A.G.; de Oliveira, B.L.C.A.; Diniz, E.M.; Dos Remédios Freitas Carvalho Branco, M.; Queiroz, R.C.S.; Carvalho, V.A.; Araújo, W.R.M.; et al. Excess deaths from all causes and by COVID-19 in Brazil in 2020. Rev. Saude Publica 2021, 55, 71. [Google Scholar] [CrossRef]
- Bogos, K.; Kiss, Z.; Kerpel Fronius, A.; Temesi, G.; Elek, J.; Madurka, I.; Cselkó, Z.; Csányi, P.; Abonyi-Tóth, Z.; Rokszin, G.; et al. Different Trends in Excess Mortality in a Central European Country Compared to Main European Regions in the Year of the COVID-19 Pandemic (2020): A Hungarian Analysis. Pathol. Oncol. Res. 2021, 27, 1609774. [Google Scholar] [CrossRef]
- Alahmad, B.; AlMekhled, D.; Odeh, A.; Albloushi, D.; Gasana, J. Disparities in excess deaths from the COVID-19 pandemic among migrant workers in Kuwait. BMC Public Health 2021, 21, 1668. [Google Scholar] [CrossRef] [PubMed]
- Bradshaw, D.; Dorrington, R.E.; Laubscher, R.; Moultrie, T.A.; Groenewald, P. Tracking mortality in near to real time provides essential information about the impact of the COVID-19 pandemic in South Africa in 2020. S. Afr. Med. J. 2021, 111, 732–740. [Google Scholar] [CrossRef] [PubMed]
- Aytemur, Z.A.; Yalçınsoy, M.; Arslan, A.K.; Hacıevliyagil, S.S. Excess Deaths in Malatya in the COVID-19 Pandemic. Turk. Thorac. J. 2021, 22, 473–476. [Google Scholar] [CrossRef] [PubMed]
- Wai, A.K.; Wong, C.K.; Wong, J.Y.; Xiong, X.; Chu, O.C.; Wong, M.S.; Tsui, M.S.; Rainer, T.H. Changes in Emergency Department Visits, Diagnostic Groups, and 28-Day Mortality Associated With the COVID-19 Pandemic: A Territory-Wide, Retrospective, Cohort Study. Ann. Emerg. Med. 2022, 79, 148–157. [Google Scholar] [CrossRef]
- Ramírez-Soto, M.C.; Ortega-Cáceres, G. Arroyo-Hernández, H. Excess all-cause deaths stratified by sex and age in Peru: A time series analysis during the COVID-19 pandemic. BMJ Open 2022, 12, e057056. [Google Scholar] [CrossRef]
- Safavi-Naini, S.A.A.; Farsi, Y.; Alali, W.Q.; Solhpour, A.; Pourhoseingholi, M.A. Excess all-cause mortality and COVID-19 reported fatality in Iran (April 2013–September 2021): Age and sex disaggregated time series analysis. BMC Res. Notes 2022, 15, 130. [Google Scholar] [CrossRef]
- Rangachev, A.; Marinov, G.K.; Mladenov, M. The demographic and geographic impact of the COVID pandemic in Bulgaria and Eastern Europe in 2020. Sci. Rep. 2022, 12, 6333. [Google Scholar] [CrossRef]
- Wijaya, M.Y. The Estimation of Excess Mortality during the COVID-19 Pandemic in Jakarta, Indonesia. Kesmas J. Kesehat. Masy. Nas. 2022, 17, 25–31. [Google Scholar] [CrossRef]
- Peretz, C.; Rotem, N.; Keinan-Boker, L.; Furshpan, A.; Green, M.; Bitan, M.; Steinberg, D.M. Excess mortality in Israel associated with COVID-19 in 2020-2021 by age group and with estimates based on daily mortality patterns in 2000-2019. Int. J. Epidemiol. 2022, 51, 727–736. [Google Scholar] [CrossRef]
- Konstantinoudis, G.; Cameletti, M.; Gómez-Rubio, V.; Gómez, I.L.; Pirani, M.; Baio, G.; Larrauri, A.; Riou, J.; Egger, M.; Vineis, P.; et al. Regional excess mortality during the 2020 COVID-19 pandemic in five European countries. Nat. Commun. 2022, 13, 482. [Google Scholar] [CrossRef] [PubMed]
- Liu, J.; Zhang, L.; Yan, Y.; Zhou, Y.; Yin, P.; Qi, J.; Wang, L.; Pan, J.; You, J.; Yang, J.; et al. Excess mortality in Wuhan city and other parts of China during the three months of the covid-19 outbreak: Findings from nationwide mortality registries. BMJ 2021, 372, n415. [Google Scholar] [CrossRef] [PubMed]
- Khader, Y.; Al Nsour, M. Excess Mortality during the COVID-19 Pandemic in Jordan: Secondary Data Analysis. JMIR Public Health Surveill. 2021, 7, e32559. [Google Scholar] [CrossRef]
- Cuéllar, L.; Torres, I.; Romero-Severson, E.; Mahesh, R.; Ortega, N.; Pungitore, S.; Hengartner, N.; Ke, R. Excess deaths reveal the true spatial, temporal and demographic impact of COVID-19 on mortality in Ecuador. Int. J. Epidemiol. 2022, 51, 54–62. [Google Scholar] [CrossRef] [PubMed]
- Kondilis, E.; Tarantilis, F.; Benos, A. Essential public healthcare services utilization and excess non-COVID-19 mortality in Greece. Public Health 2021, 198, 85–88. [Google Scholar] [CrossRef] [PubMed]
- Alicandro, G.; Remuzzi, G.; La Vecchia, C. Italy’s first wave of the COVID-19 pandemic has ended: No excess mortality in May, 2020. Lancet 2020, 396, e27–e28. [Google Scholar] [CrossRef]
- Kontopantelis, E.; Mamas, M.A.; Deanfield, J.; Asaria, M.; Doran, T. Excess mortality in England and Wales during the first wave of the COVID-19 pandemic. J. Epidemiol. Community Health 2021, 75, 213–223. [Google Scholar] [CrossRef]
- Tessema, S.K.; Nkengasong, J.N. Understanding COVID-19 in Africa. Nat Rev Immunol 2021, 21, 469–470. [Google Scholar] [CrossRef]
- Salyer, S.J.; Maeda, J.; Sembuche, S.; Kebede, Y.; Tshangela, A.; Moussif, M.; Ihekweazu, C.; Mayet, N.; Abate, E.; Ouma, A.O.; et al. The first and second waves of the COVID-19 pandemic in Africa: A cross-sectional study. Lancet 2021, 397, 1265–1275. [Google Scholar] [CrossRef]
- Stobart, A.; Duckett, S. Australia’s Response to COVID-19. Health Econ. Policy Law 2022, 17, 95–106. [Google Scholar] [CrossRef]
- Costantino, V.; Raina MacIntyre, C. The Impact of Universal Mask Use on SARS-COV-2 in Victoria, Australia on the Epidemic Trajectory of COVID-19. Front. Public Health 2021, 9, 625499. [Google Scholar] [CrossRef] [PubMed]
- Jefferies, S.; French, N.; Gilkison, C.; Graham, G.; Hope, V.; Marshall, J.; McElnay, C.; McNeill, A.; Muellner, P.; Paine, S.; et al. COVID-19 in New Zealand and the impact of the national response: A descriptive epidemiological study. Lancet Public Health 2020, 5, e612–e623. [Google Scholar] [CrossRef]
- Baker, M.G.; Kvalsvig, A.; Verrall, A.J. New Zealand’s COVID-19 elimination strategy. Med. J. Aust. 2020, 213, 198–200. [Google Scholar] [CrossRef] [PubMed]
- Pearce, C.; McLeod, A.; Supple, J.; Gardner, K.; Proposch, A.; Ferrigi, J. Responding to COVID-19 with real-time general practice data in Australia. Int. J. Med. Inform. 2022, 157, 104624. [Google Scholar] [CrossRef] [PubMed]
- Walker, P.G.; Whittaker, C.; Watson, O.J.; Baguelin, M.; Winskill, P.; Hamlet, A.; Djafaara, B.A.; Cucunubá, Z.; Olivera, M.D.; Green, W.; et al. The impact of COVID-19 and strategies for mitigation and suppression in low- and middle-income countries. Science 2020, 369, 413–422. [Google Scholar] [CrossRef] [PubMed]
- Huang, C.; Yang, L.; Pan, J.; Xu, X.; Peng, R. Correlation between vaccine coverage and the COVID-19 pandemic throughout the world: Based on real-world data. J. Med. Virol. 2022, 94, 2181–2187. [Google Scholar] [CrossRef]
- Watson, O.J.; Barnsley, G.; Toor, J.; Hogan, A.B.; Winskill, P.; Ghani, A.C. Global impact of the first year of COVID-19 vac-cination: A mathematical modelling study. Lancet Infect Dis. 2022, 22, 1293–1302. [Google Scholar] [CrossRef]
- Islam, N.; Shkolnikov, V.M.; Acosta, R.J.; Klimkin, I.; Kawachi, I.; Irizarry, R.A.; Alicandro, G.; Khunti, K.; Yates, T.; Jdanov, D.A.; et al. Excess deaths associated with covid-19 pandemic in 2020: Age and sex disaggregated time series analysis in 29 high income countries. BMJ 2021, 373, n1137. [Google Scholar] [CrossRef]
- Nielsen, J.; Nørgaard, S.K.; Lanzieri, G.; Vestergaard, L.S.; Moelbak, K. Sex-differences in COVID-19 associated excess mortality is not exceptional for the COVID-19 pandemic. Sci. Rep. 2021, 11, 20815. [Google Scholar] [CrossRef]
- Gianicolo, E.A.L.; Russo, A.; Büchler, B.; Taylor, K.; Stang, A.; Blettner, M. Gender specific excess mortality in Italy during the COVID-19 pandemic accounting for age. Eur. J. Epidemiol. 2021, 36, 213–218. [Google Scholar] [CrossRef]
- Giagulli, V.A.; Guastamacchia, E.; Magrone, T.; Jirillo, E.; Lisco, G.; De Pergola, G.; Triggiani, V. Worse progression of COVID-19 in men: Is testosterone a key factor? Andrology 2021, 9, 53–64. [Google Scholar] [CrossRef] [PubMed]
- Sempé, L.; Lloyd-Sherlock, P.; Martínez, R.; Ebrahim, S.; McKee, M.; Acosta, E. Estimation of all-cause excess mortality by age-specific mortality patterns for countries with incomplete vital statistics: A population-based study of the case of Peru during the first wave of the COVID-19 pandemic. Lancet Reg. Health Am. 2021, 2. [Google Scholar] [CrossRef] [PubMed]
- Sinnathamby, M.A.; Whitaker, H.; Coughlan, L.; Lopez Bernal, J.; Ramsay, M.; Andrews, N. All-cause excess mortality observed by age group and regions in the first wave of the COVID-19 pandemic in England. Euro Surveill. 2020, 25, 2001239. [Google Scholar] [CrossRef] [PubMed]
- Ramasamy, M.N.; Minassian, A.M.; Ewer, K.J.; Flaxman, A.L.; Folegatti, P.M.; Owens, D.R.; Voysey, M.; Aley, P.K.; Angus, B.; Babbage, G.; et al. Safety and immunogenicity of ChAdOx1 nCoV-19 vaccine administered in a prime-boost regimen in young and old adults (COV002): A single-blind, randomised, controlled, phase 2/3 trial. Lancet 2021, 396, 1979–1993. [Google Scholar] [CrossRef]
- Hossain, M.B.; Alam, M.Z.; Islam, M.S.; Sultan, S.; Faysal, M.M.; Rima, S.; Hossain, M.A.; Mamun, A.A. COVID-19 vaccine hesitancy among the adult population in Bangladesh: A nationwide cross-sectional survey. PLoS ONE 2021, 16, e0260821. [Google Scholar] [CrossRef]
- WHO SCORE Global Report 2020. A Visual Summary. 2020. Available online: https://www.who.int/data/stories/score-global-report-2020---a-visual-summary (accessed on 27 September 2022).
Publisher’s Note: MDPI stays neutral with regard to jurisdictional claims in published maps and institutional affiliations. |
© 2022 by the authors. Licensee MDPI, Basel, Switzerland. This article is an open access article distributed under the terms and conditions of the Creative Commons Attribution (CC BY) license (https://creativecommons.org/licenses/by/4.0/).