1. Introduction
Phytochemicals, also referred to as phytobiotics or phytogenics, are natural bioactive products derived from plants. They include mainly essential oils [
1], flavonoids [
2], terpenes [
3], polysaccharides [
4], and phenolic acid [
5]. Currently, phytochemicals were studied widely because of their multiple functions in human and animal health [
6,
7]. Phytochemicals have broad spectrum functions that are antioxidative [
8], anti-microbial [
9], anti-inflammatory [
10], and anticancer in nature [
11]. Research has investigated the profile of phenolic compounds and antioxidant activity of finger millet varieties [
12,
13]. Twenty phenolic compounds were identified including 18 flavonoids with the predominant flavonoids of catechin and epicatechin. Chen et al. [
14] revealed that the dominant phytochemicals in wheat were phenolic acids with high antioxidative capacity in vitro. In addition, the beneficial functions of soy isoflavone [
15,
16] and lutein [
8] have drawn extensive attention recently. Burgeoning evidence indicates that phytochemicals extracted from the plants could be a good source of functional foods or potential additives for functional foods and animal feeds.
Red-osier dogwood (
Cornus stolonifera Michx.) is native to North America and is commonly found in marshes, low meadows, and along river banks from Labrador to Alaska [
17]. In Canada, it is a precious plant resource and rich in phenolic components, including anthocyanins with strong antioxidative activity [
18]. At present, ground red-osier dogwood has been investigated in animal feeds to improve growth performance, feed intake, disease prevention, and meat quality [
19,
20]. Researchers [
19,
20] investigated the effects of ground red-osier dogwood supplementation on the digestibility, blood metabolites, and acute phase response in beef heifers. The results showed that ground red-osier dogwood could increase the feed digestibility and plasma concentration of haptoglobin and serum amyloid A in a ground red-osier dogwood dose-dependence. Dietary 4% ground red-osier dogwood supplementation attenuated oxidative stress and improved the growth performance of the
E. coli infected weaned piglets, as revealed by Koo et al. [
21,
22] and Jayaraman et al. [
21,
22]. The beneficial effects of ground red-osier dogwood on animal growth and feed digestion might be associated with the oxidative homeostasis of the intestinal cells and the integrity of the intestinal barrier that are maintained by the antioxidative function of phytochemicals in the ground red-osier dogwood.
Cellular oxidative and inflammatory models have been widely used to investigate the potential mechanisms of phytochemicals involved in human and animal health. The intestinal porcine epithelial cell line J2 (IPEC-J2) and human colon adenocarcinoma cell line-2 (Caco-2) provide useful cell models for investigating the antioxidant mechanism of phytochemicals in the intestine [
8,
21,
22]. Omonijo et al. [
10] revealed the anti-inflammatory mechanism of thymol in the inflammatory models of lipopolysaccharide (LPS)-induced IPEC-J2 cells. Yang et al. [
23] investigated the effects of resveratrol on the oxidative model of IPEC-J2 cells, and found that resveratrol protects IPEC-J2 cells from oxidative damage by stimulating the Nrf-2 pathway. Wu et al. [
24] revealed that phytochemicals increase the expressions of tight junction proteins including occludin, zona occludens (ZO-1), and induce the upregulation of antioxidant enzymes including superoxidedismutase (SOD), hemeoxygenase-1 (HO-1), catalase (CAT), and glutathione peroxidase (GSH-Px) in the oxidative model of Caco-2 cells. A variety of adverse factors could cause the production of reactive oxygen species (ROS), resulting in oxidative damage of the intestinal barrier. Moreover, persistent oxidative damage could trigger the development of the intestinal diseases, including colon cancer [
25]. Therefore, the intake of natural phytochemicals could maintain the health of the gut and be considered an effective way to reduce the occurrence of intestinal diseases. Although ground red-osier dogwood has been investigated as potential animal feed additives to improve animal performance and meat quality, the mechanisms of ground red-osier dogwood in maintaining the oxidative homeostasis and the integrity of the intestinal barrier are still not fully understood.
In the present study, it is hypothesized that red-osier dogwood extracts (RDE) act as antioxidant agents capable of exerting protective effects against chemical-induced damage in intestinal epithelial cells. Therefore, an oxidative damage model of Caco-2 cells induced by hydrogen peroxide (H2O2) was established, and the mechanisms of RDE in recovering the intestinal cells from oxidative damage were investigated by examining the antioxidant system and the tight junction protein expression.
2. Materials and Methods
2.1. Materials and Reagents
RDE powder (moisture 7.3%; total phenolic content 26.51 gallic acid equivalent (GAE)/100 g including gallic acid 1670.09 mg/100 g and rutin 2745.49 mg/100 g) from leaves was provided by Red Dog Enterprises Ltd. (Swan River, MB, Canada). Hydrogen peroxide (H2O2), 2′,7′dichlorofluorescein diacetate (DCFH-DA), 4 kDa fluorescein isothiocyanate-dextran (FD4) and paraformaldehyde (PFA) were purchased from Sigma-Aldrich (Oakville, ON, Canada). Hanks’ balanced salt solution (HBSS), DMEM/F12 medium, trypsin (0.25%), anti-anti (penicillin (100 IU/mL), streptomycin (100 μg/mL), and 0.25 μg/mL of amphotericin B) and fetal bovine serum (FBS) were purchased from Invitrogen (Fisher Scientific, Ottawa, ON, Canada). T-25 or T-75 culture flasks, Transwell permeable supports (0.4 μm pore size), and cell culture plates were purchased from Corning (Fisher Scientific, Ottawa, ON, Canada).
2.2. Cell Culture
Caco-2 human colon cancer cell was purchased from the American Type Culture Collection (ATCC, Manassas, VA, USA). Cells were grown in DMEM-Ham’s F-12 (1:1) supplemented with 10% FBS and 1% anti-anti, and maintained in an atmosphere of 5% CO2 at 37 °C. Cells were cultured in a T-25 or T-75 culture flask with a medium change every two days until 90% confluence. Then, they were digested with 0.25% trypsin (at 37 °C for 1–2 min) and seeded in a cell culture plate (96-, 24-, 12-, or 6-well) to culture for further experiments.
2.3. Experiment Design
Cytotoxicity of H2O2 (ranges from 0.2 to 2.0 mM) on Caco-2 cells was tested by a viability assay, and the optimal concentration of H2O2 was chosen for inducing oxidative damage of Caco-2 cells. Cells were treated with 1 mM of H2O2 for 3 h firstly, and then washed with PBS (a pre-warmed at 37 °C water bath) one time. Afterward, the cells treated with 100 μg/mL RDE for 24 h were considered the treatment group (T) according to the results. The cells treated with H2O2 and followed with a standard medium [DMEM-Ham’s F-12 (1:1) supplemented with 10% FBS and 1% anti-anti] for 24 h were defined as treatment control (TC). The cells without H2O2 and RDE treatment were negative control (NC). In brief, the H2O2 work solution was directly diluted using a medium from 10 M H2O2. The RDE solution was prepared according to the required concentrations using a medium.
2.4. Cell Viability Assay
After treatments, cell viability was measured using the water-soluble tetrazolium salts (WST-1) Cell Proliferation Reagent (Sigma Aldrich, Roche, Indianapolis, IN, USA) according to the manufacturer’s instructions. Briefly, Caco-2 cells were seeded into 96-well plates at a density of 2 × 10⁴ cells/well and cultured in a complete medium for about 5 days (90% confluent). After the different treatments (NC, TC, and T), cells were washed one time with PBS and then treated with 100 μL fresh medium containing 10% WTS-1 and incubated for 1.5 h at 37 °C in an atmosphere of 5% CO2. The absorbance at 450 nm was measured using a Synergy™ H4 Hybrid Multi-Mode Microplate Reader (BioTek, Winooski, VT, USA). Cell viability was presented as a percentage of control cells.
2.5. IL-8 Determination
IL-8 was determined using IL-8 Human Uncoated ELISA Kit (cat. #88-8086, Invitrogen, Carlsbad, CA, USA). Cells were cultured in a 12-well plate with the inoculum density of 2 × 10⁵ cells/well and treated with H2O2 and RDE as described above. After, 100 μL of the medium was used to determine IL-8 content according to the kit instructions.
2.6. Reactive Oxygen Species (ROS) Assay
Cellular ROS was measured using a BD FACSCalibur flow cytometer (BD Biosciences, San Jose, CA, USA) [
26]. Cells were cultured in a T-25 flask with a inoculum density of 1 × 10
6 cells/well until 90% confluence reached. They were treated with H
2O
2 and RDE as described above. After treatments, cells were washed with PBS two times and treated with 1 mL DCFH-DA solution (10 µM in PBS) for 30 min at 37 °C. Then, cells were washed with PBS two times and fixed with 4% PFA for 15 min at room temperature. After that, they were digested with 0.25% trypsin (at 37 °C) to monoplast, washed with PBS, and then centrifuged to collect cells for flow cytometry analysis. A total of 10,000 cells was calculated, and fluorescence intensity was measured.
2.7. Glutathione Determination
Total glutathione (GSH) and oxidized glutathione (GSSG) were determined using a Glutathione Colorimetric Detection Kit (cat. #EIAGSHC, Invitrogen). Cells were cultured in 12-well plate with a inoculum density of 2 × 10⁵ cells/well and treated with H2O2 and RDE as described above. Afterward, cells were washed with ice-cold PBS and resuspended in 200 μL of ice-cold 5% aqueous 5-sulfo-salicylic acid dehydrate (SSA) and followed by the freeze–thaw cycling to lyse cells. After, lysed cells were centrifuged at 14,800× g at 4 °C for 15 min. The dilution and assay were conducted by following the kit instructions. The reduced GSH was calculated by an equation: reduced GSH = total GSH − GSSG.
2.8. Transepethial Electrical Resistant (TEER) Measurement
The TEER of cell monolayers was measured using a Millicell Electrical Resistance System (ESR-2) (Millipore-Sigma) according to our previously published procedure [
10]. Caco-2 cells were seeded onto Transwells (Polyester membrane, 12 wells, 12 mm diameter inserts, Corning Costar, Fisher Scientific) at a density of 1 × 10
5 cells/insert. The TEER value was monitored every other day. When a monolayer of cells was completely differentiated (about 10 days), cells were treated with H
2O
2 and RDE, and TEER values were measured after H
2O
2 treatment for 6 h and after RED treatment for 24 h, respectively. The data were presented as a percentage of initial value before treatments.
2.9. Measurement of Cell Permeability
To quantify the paracellular permeability of cell monolayers, 1 mg/mL of FD4 (46944-500MG-F, Sigma-Aldrich) was added to the apical side of the inserts (Polyester membrane, 12 wells, 12 mm diameter inserts, Corning Costar, Fisher Scientific, Ottawa, ON, Canada). The cell culture and the treatments were the same as that of TEER measurement. The basolateral medium aliquots were taken after 2 h of incubation at 37 °C in an atmosphere of 5% CO
2. Then, 100 μL of the medium was transferred into 96-well plates and the diffused fluorescent tracer was then measured by fluorometry (excitation, 485 nm; emission, 528 nm) using a Synergy™ H4 Hybrid Multi-Mode Microplate Reader (BioTek, Winooski, VT, USA) [
10].
2.10. RNA Extraction and Real-Time PCR
Total RNA isolation and real-time PCR were conducted according to Omonijo et al. [
10]. The reference gene was GAPDH (glyceraldehyde-3-phosphate dehydrogenase). The primers for real-time PCR analysis were designed with the Primer-Blast based on the published cDNA sequence in the Gene Bank (
https://www.ncbi.nlm.nih.gov/tools/primer-blast/). The information of genes detected and the primers are shown in
Table 1.
2.11. Immunofluorescent Staining
Cells with a inoculum density of 1 × 10
5 cells/well were cultured onto coverslips (24-well plate, Fisher Scientific) pre-coated with collagen and fixed with 4% PFA after treatments as described above. The cells were washed with PBS 2 times and incubated with 0.3% Triton X-100 in PBS (PBS/Triton) at room temperature for 10 min. For β-actin staining, the treated cells were incubated with Phalloidin, CF488A (1:100 dilution in PBS, Biotium, Inc., Fremont, CA, USA) at room temperature for 1 h. The cells were then washed three times with PBS and mounted with Vectashield mounting medium with DAPI (Vector Laboratories, Inc., Burlingame, CA, USA). For ZO-1 staining, cells were blocked with 5% goat serum (Jackson ImmunoResearch Laboratories, West Grove, PA, USA) for 1 h and then incubated with an anti-rabbit ZO-1 polyclonal antibody (cat. # 61-7300, 1:100 dilution, Thermal Scientific, Ottawa, Canada) at 4 °C overnight. The cells were then washed three times with PBS and incubated with an Alexa fluor 488 goat anti-rabbit antibody (Thermal Scientific, cat. # A-11034) for 1 h at room temperature. Rinsed cells were mounted with Vectashield Mounting Medium with DAPI (Vector Laboratories, Inc.)
. The images were taken by a Zeiss Fluorescence Microscope (Carl Zeiss Ltd., Toronto, ON, Canada) [
10].
2.12. Western Blotting
Cells were cultured in a 6-well plate with a inoculum density of 4 × 10⁵ cells/well and total protein was extracted after the treatments described above. Protein extraction was conducted using a total protein extraction kit according to instructions provided by the manufacturer (Thermo Scientific, Ottawa, ON, Canada). A portion of protein was quantified using a BCA protein assay kit (Thermo Scientific). Then proteins were heat-denatured in an SDS-PAGE loading buffer. Proteins were electrophoresed on polyacrylamide gels and electro-transferred to mini-size nitrocellulose membranes (Bio-Rad, Laboratories Ltd., Montreal, QC, Canada). The immunoreaction was achieved by incubation of the membranes, previously blocked with 5% non-fat dry milk in Tris-buffered saline with 0.1% of Tween 20 (TBST), followed by incubation with rabbit anti-Nrf-2 (Thermal Scientific, cat. #PA5-68817), rabbit anti-ZO-1 (Thermal Scientific, cat. #61-7300), rabbit anti-claudin-1(Thermal Scientific, cat. #34-1700), rabbit anti-claudin-3 (Thermal Scientific, cat. #51-9000), and rabbit anti-occludin (Thermal Scientific, cat. #71-1500) proteins after being diluted (1:1000, Abcam Inc., Toronto, ON, Canada) overnight at 4°C. Afterward, it was washed five times with TBST. Detection of the immune complexes was performed with a horseradish peroxidase-conjugated secondary antibody (1:5000, goat anti-rabbit, Jackson ImmunoResearch Laboratories), then the membrane was washed 5 times, 5 min per time. The ClarityTM Western ECL Substrate was applied to the blot according to the manufacturer’s recommendations (Bio-Rad Laboratories Ltd.). The chemiluminescent signals were captured using a ChemiDoc MP imaging system (Bio-Rad Laboratories Ltd.), and Image Lab 6.0 was used to quantify the intensity of the bands (Bio-Rad Laboratories Ltd.). β-actin (from mouse, Thermal Scientific, cat. #AM4302) was set as the internal reference.
2.13. Statistical Analysis
Data were presented as means ± standard deviations (SD). Statistical analysis was performed using GraphPad Prism 7 (GraphPad Software, La Jolla, CA, USA). Differences between the means were evaluated by one-way ANOVA. Duncan’s multiple range test was used. Level of significance was set at P < 0.05.
3. Results
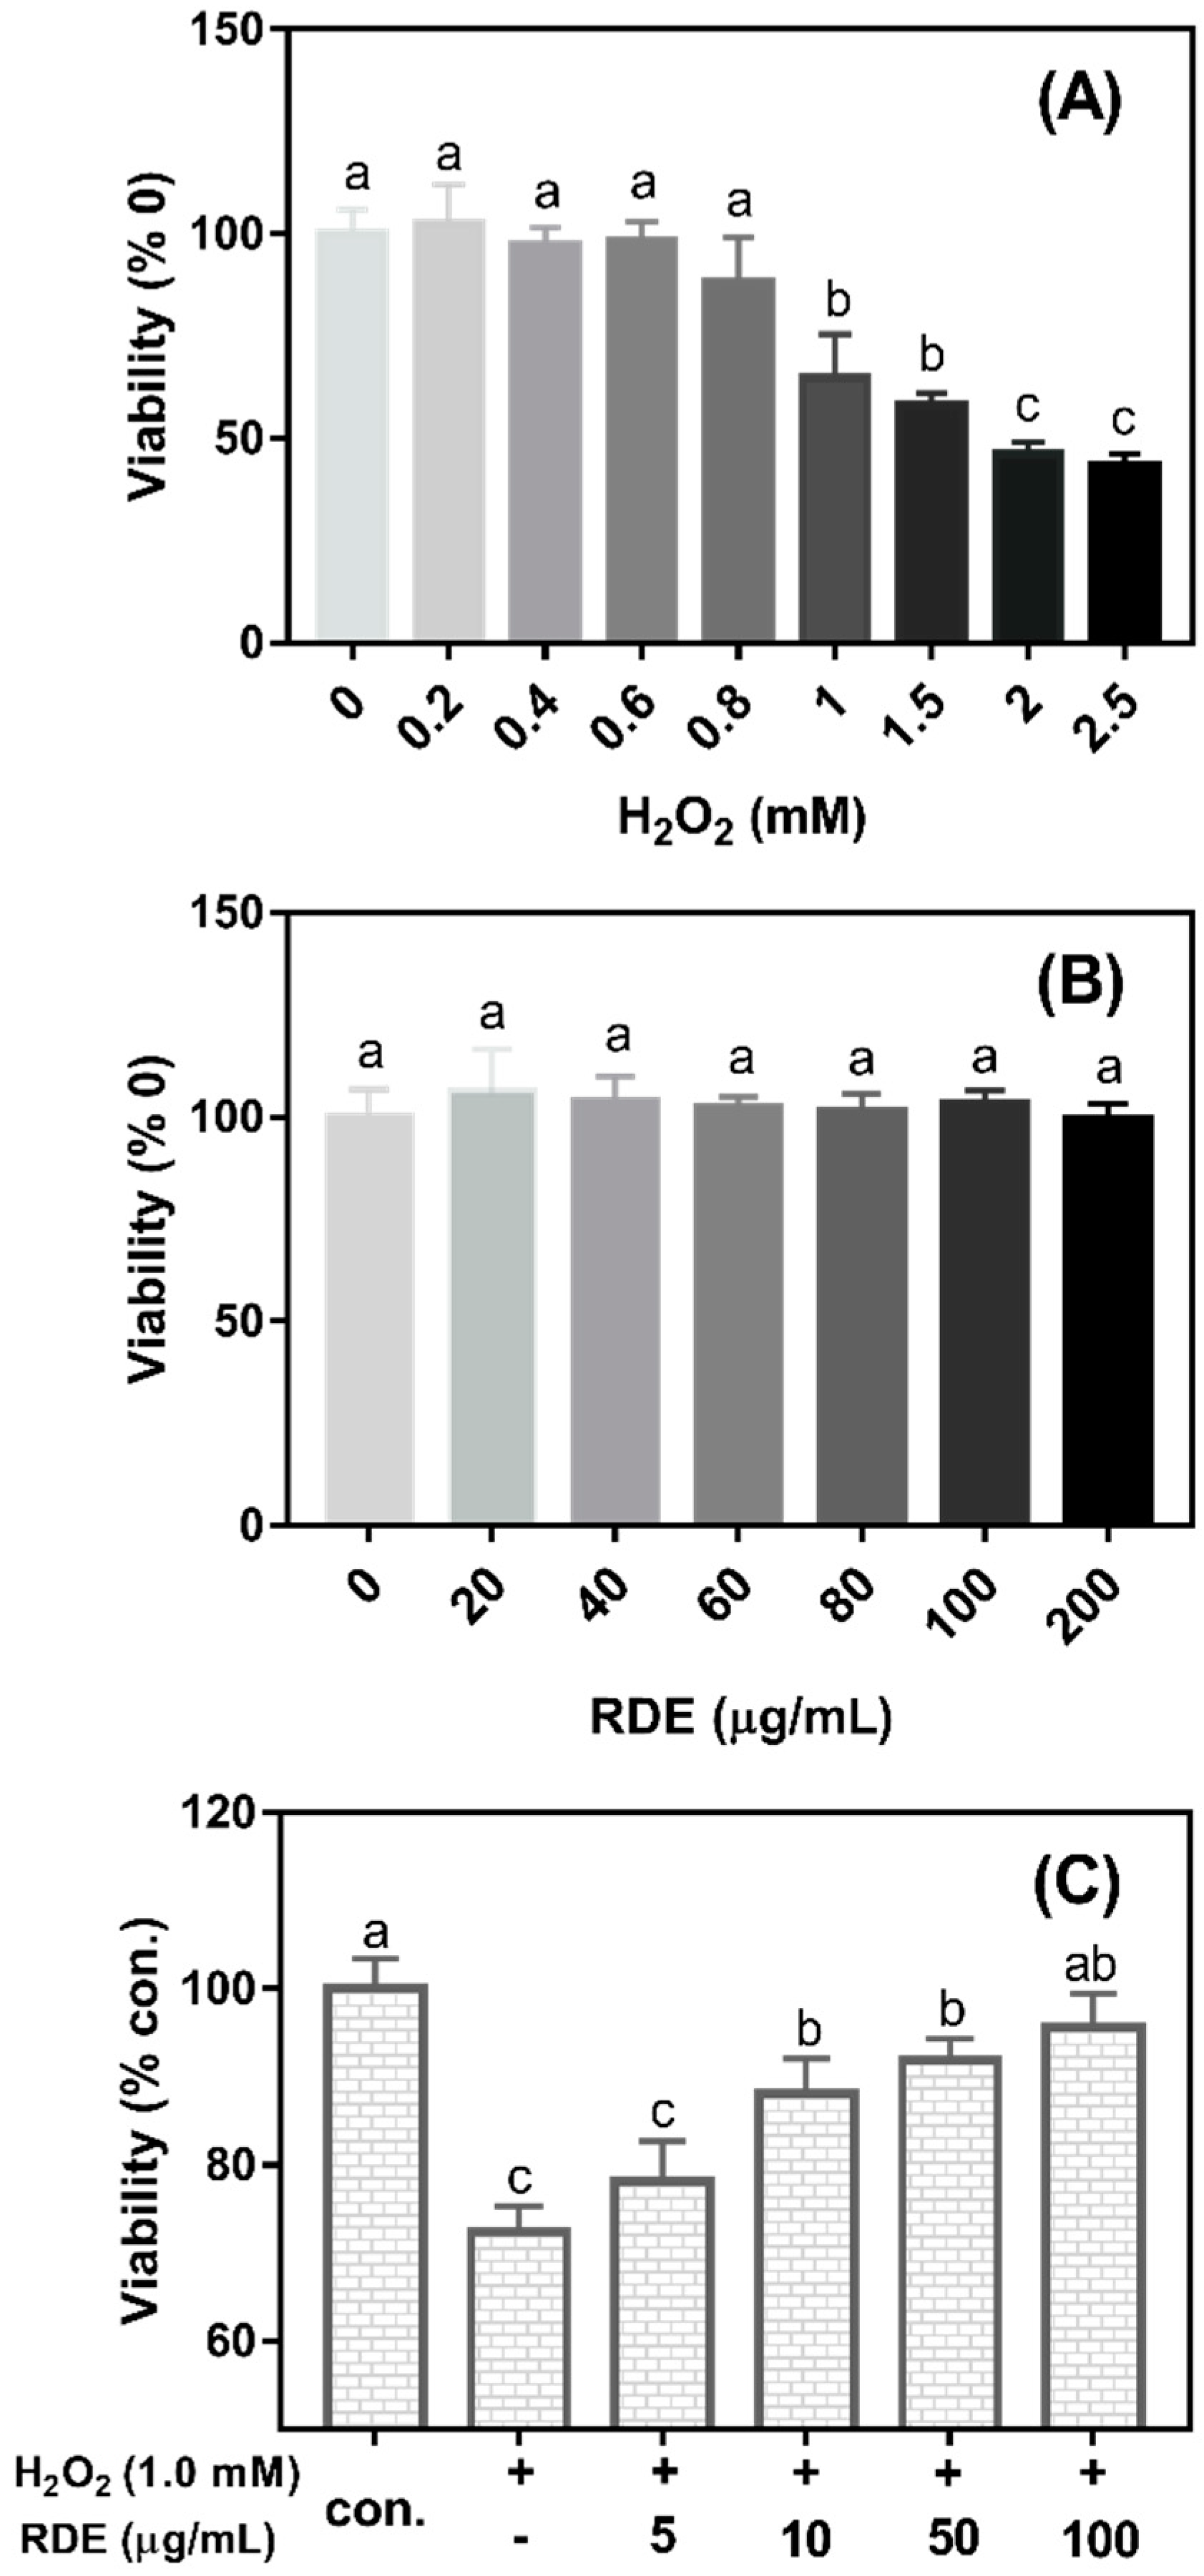
As shown in
Figure 1A, the cell viability significantly decreased when the concentrations of H
2O
2 were more than 0.8 mM (
P < 0.05). The cell viability was reduced at 35.15% when 1 mM H
2O
2 was added in the medium compared with the control (0 mM H
2O
2). Therefore, 1 mM H
2O
2 was selected to induce oxidative damage in this study. As shown in
Figure 1B, the cell viability was not changed when cells were treated with the RDE at the concentrations of 0–200 μg/mL (
P > 0.05). As shown in
Figure 1C, when cells were pre-treated with 1 mM H
2O
2 for 3 h and then incubated with different concentrations of RDE for 24 h, RDE showed a dose-dependent recovery of the cell viability that was compromised by 1 mM H
2O
2 and the cells treated with 100 μg/mL of RDE had similar viability with the control cells (
P > 0.05). Therefore, 100 μg/mL of RDE was used in the subsequent experiments.
H
2O
2 treatment induced a significant amount of IL-8 secretion and they were increased almost two-fold when compared with the control cells (NC) (
P < 0.05) (
Figure 2A). The 100 μg/mL of RDE reduced IL-8 secretion in the cells when compared with the treatment control cells (TC) (
P < 0.05). However, IL-8 secretion was still higher in the cells treated with RDE (T) than in the control cells (NC) (
P < 0.05). As shown in
Figure 2B, the intracellular fluorescent intensity of cells treated with H
2O
2 (TC) was higher than those of the control cells (NC) and the incubation of H
2O
2-pretreated cells with RDE for 24 h reduced the ROS to the level of control. The H
2O
2 treatment increased total GSH content (
P < 0.05) while the reduced GSH/ GSSS ratio remained the same (
P > 0.05) when compared with the control cells (NC). The RDE treatment reduced both total GSH and GSSG (
P < 0.05,
Figure 2C) and had a higher reduced GSH/GSSG ratio when compared with both the NC and TC groups (
P < 0.05,
Figure 2D).
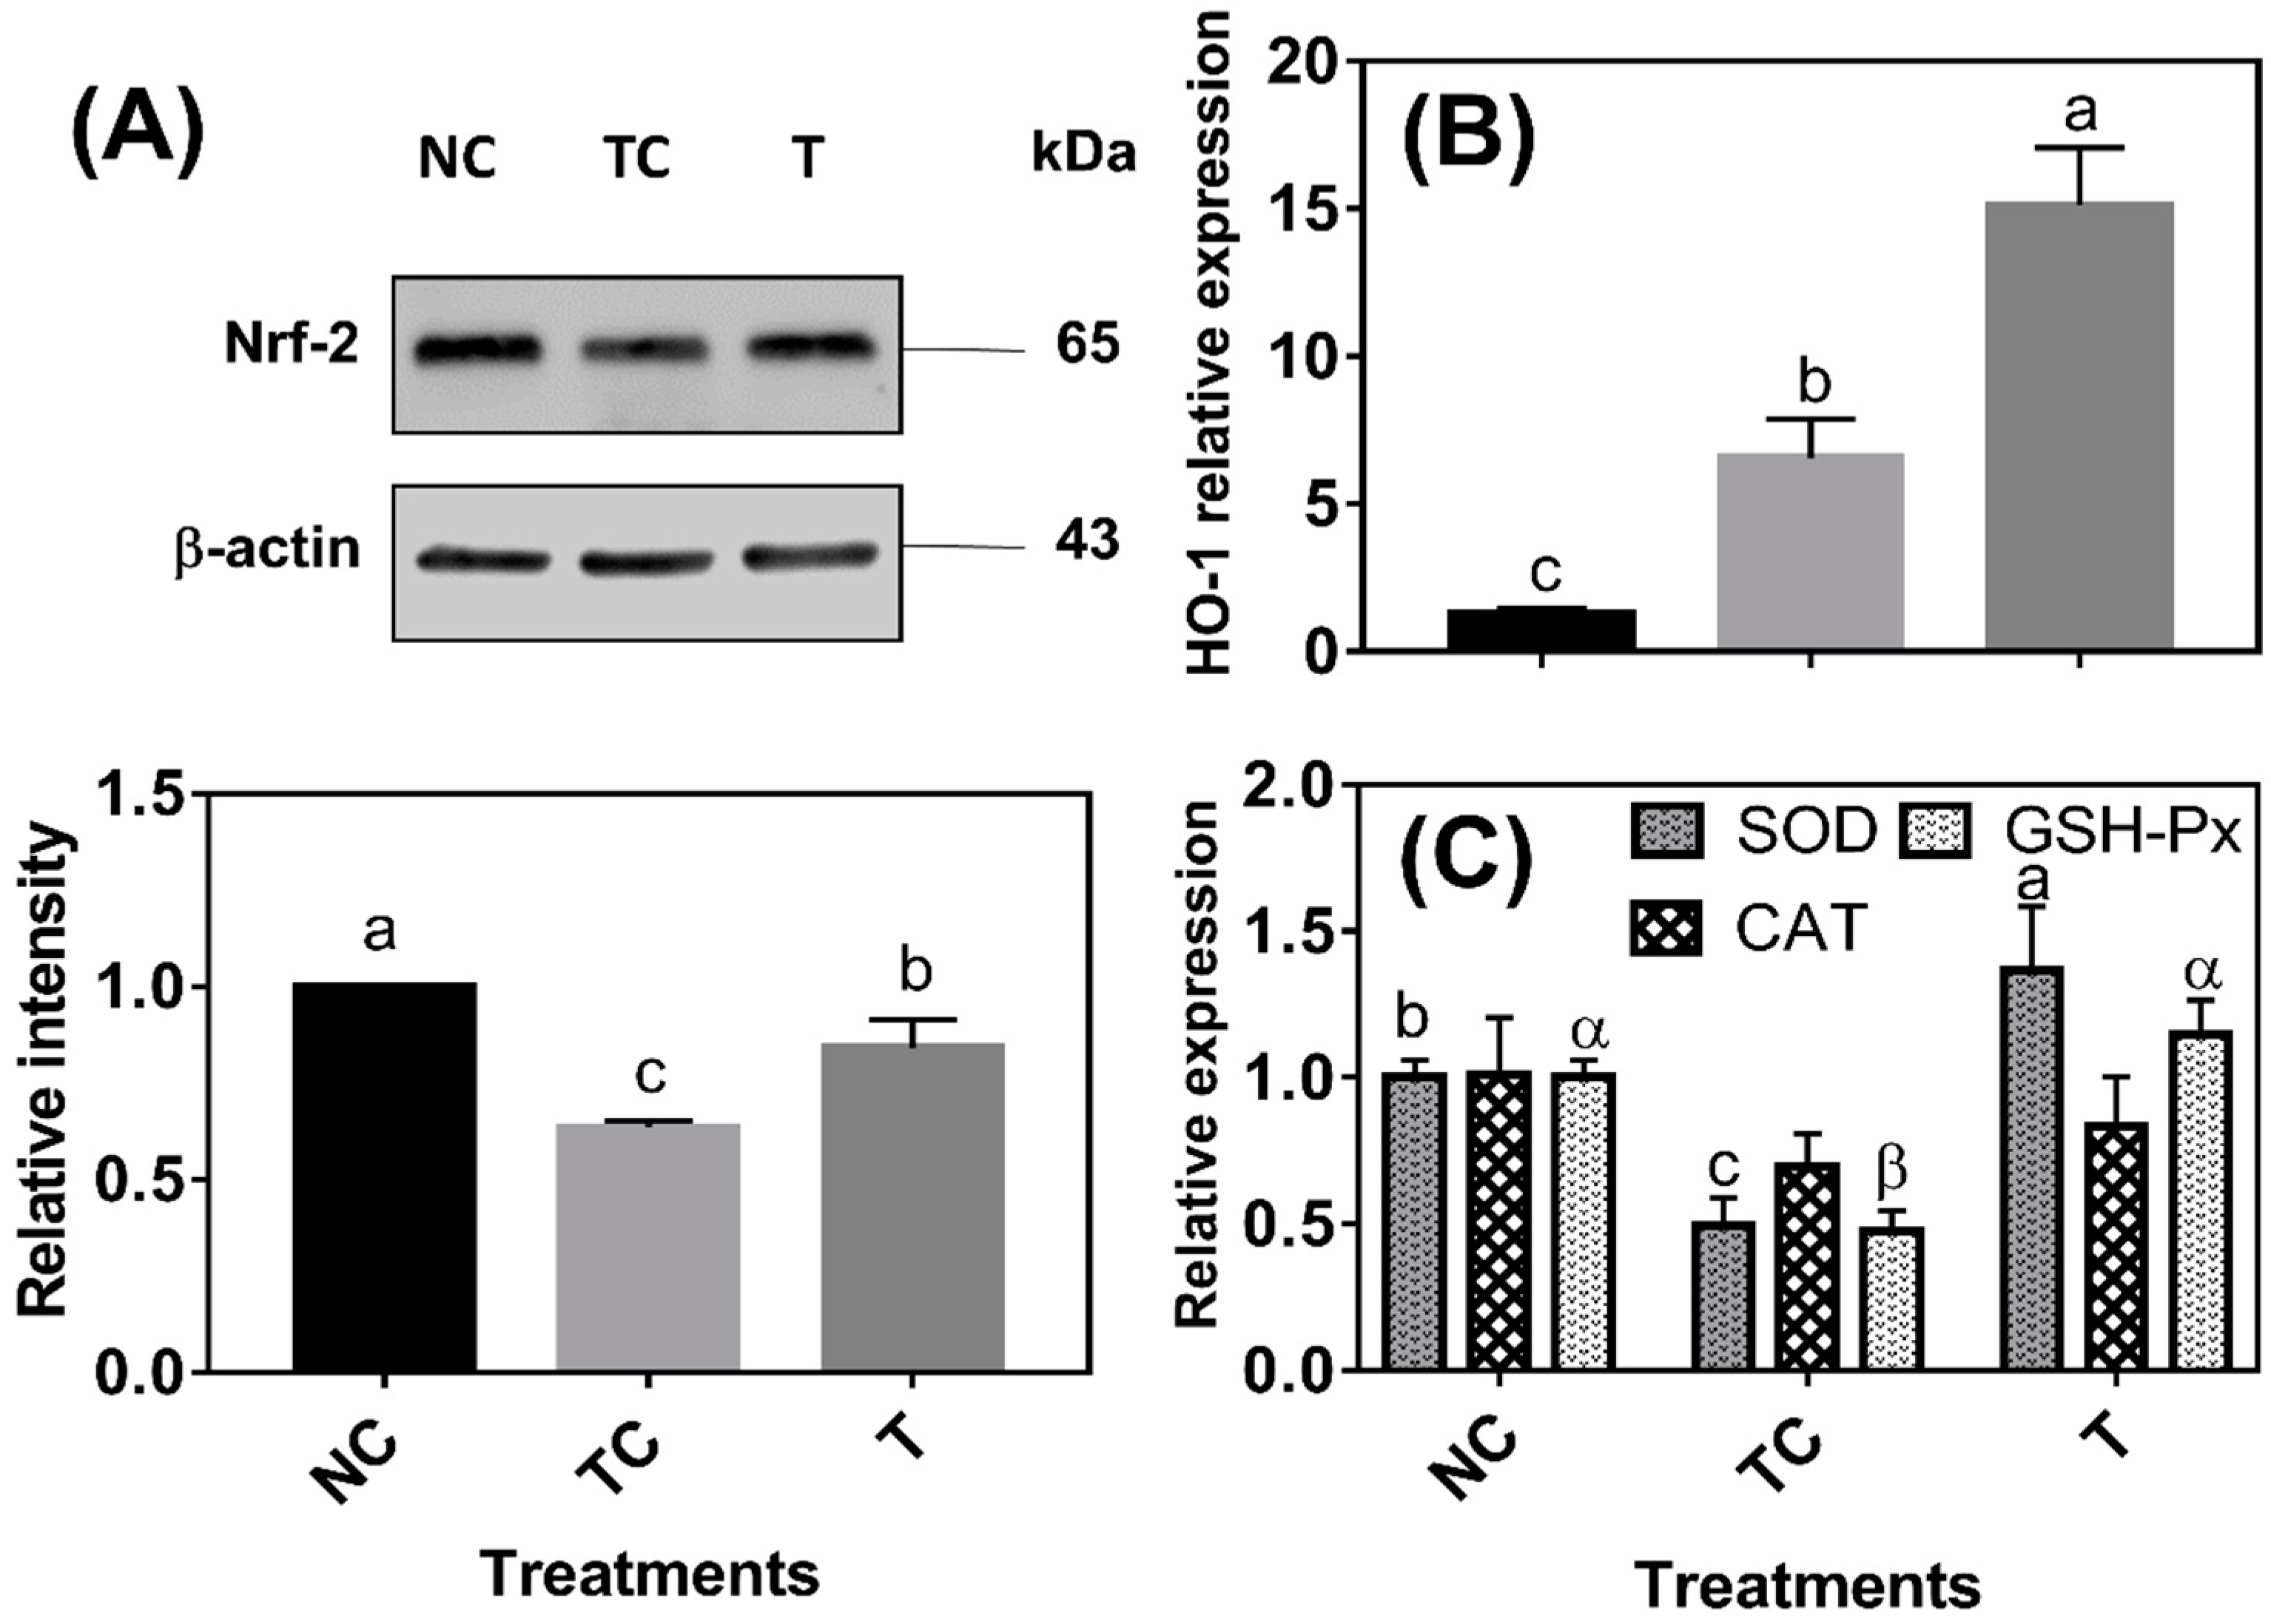
As shown in
Figure 3A, the Nrf-2 protein abundance was lower (
P < 0.05) in the cells treated with H
2O
2 (TC) than in the control cells (NC). The Nrf-2 protein abundance was higher (
P < 0.05) in the cells treated with RDE (T) than in the cells treated with H
2O
2 (TC) but still lower (
P < 0.05) than in the control cells (NC). HO-1 mRNA abundance was increased (
P < 0.05) by 5.29 folds under H
2O
2 treatment compared with that of the control cells (NC) and HO-1 mRNA abundance was the highest (
P < 0.05) in the cells treated with RDE (
Figure 3B). H
2O
2 treatment significantly decreased the mRNA levels of SOD and GSH-Px, and the mRNA levels of the two enzymes were increased by followed RDE treatment (
P < 0.05). However, there was no significant difference (
P > 0.05) observed in the mRNA level of CAT among the three treatment groups (
Figure 3C).
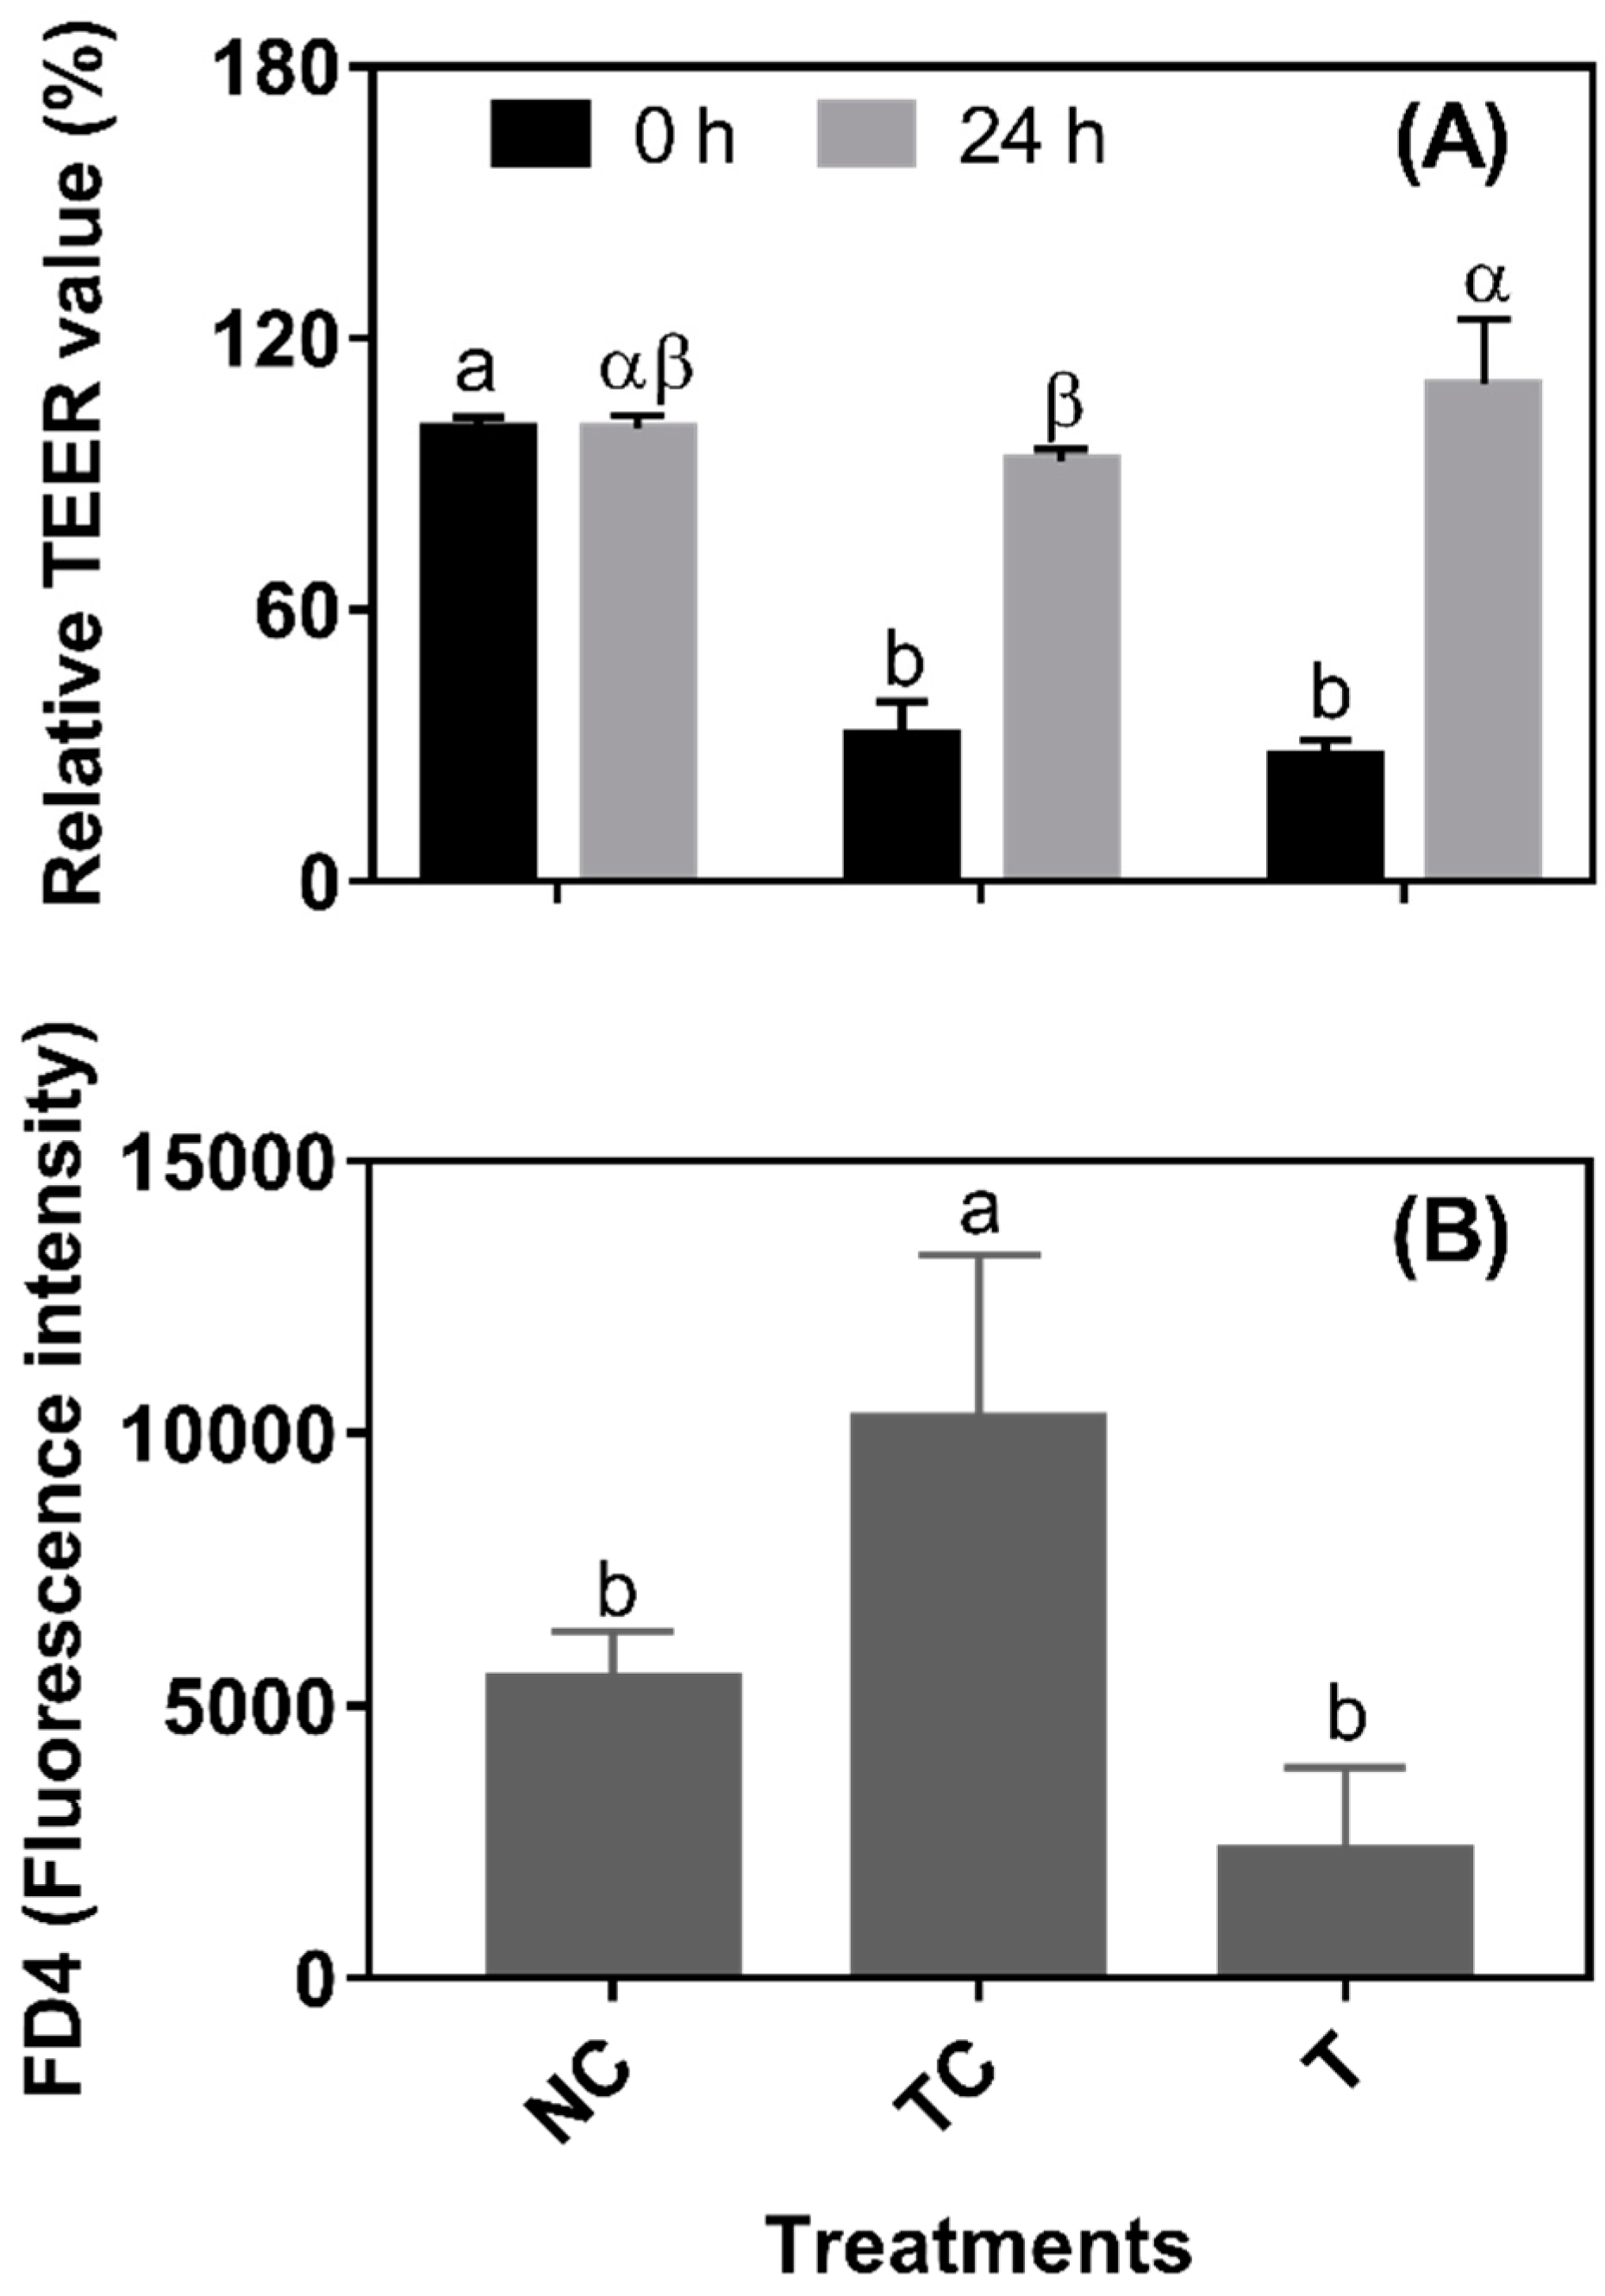
In
Figure 4A, after a 3 h H
2O
2 treatment, the TEER values were significantly decreased (set as 0 h from RDE treatment) (
P < 0.05). There was no significant difference (
P > 0.05) observed in the TEER values between the TC and NC groups and between the NC and T groups when cells were further cultured for 24 h. However, the TEER value was higher (
P < 0.05) in the cells treated with RDE (T) than in the treatment control cells (TC). As shown in
Figure 4B, the leakage of FD4 was higher (
P < 0.05) in the TC group than in the NC and T groups. However, there was no significant difference (
P > 0.05) in the leakage of FD4 observed between the NC and T groups. As shown in
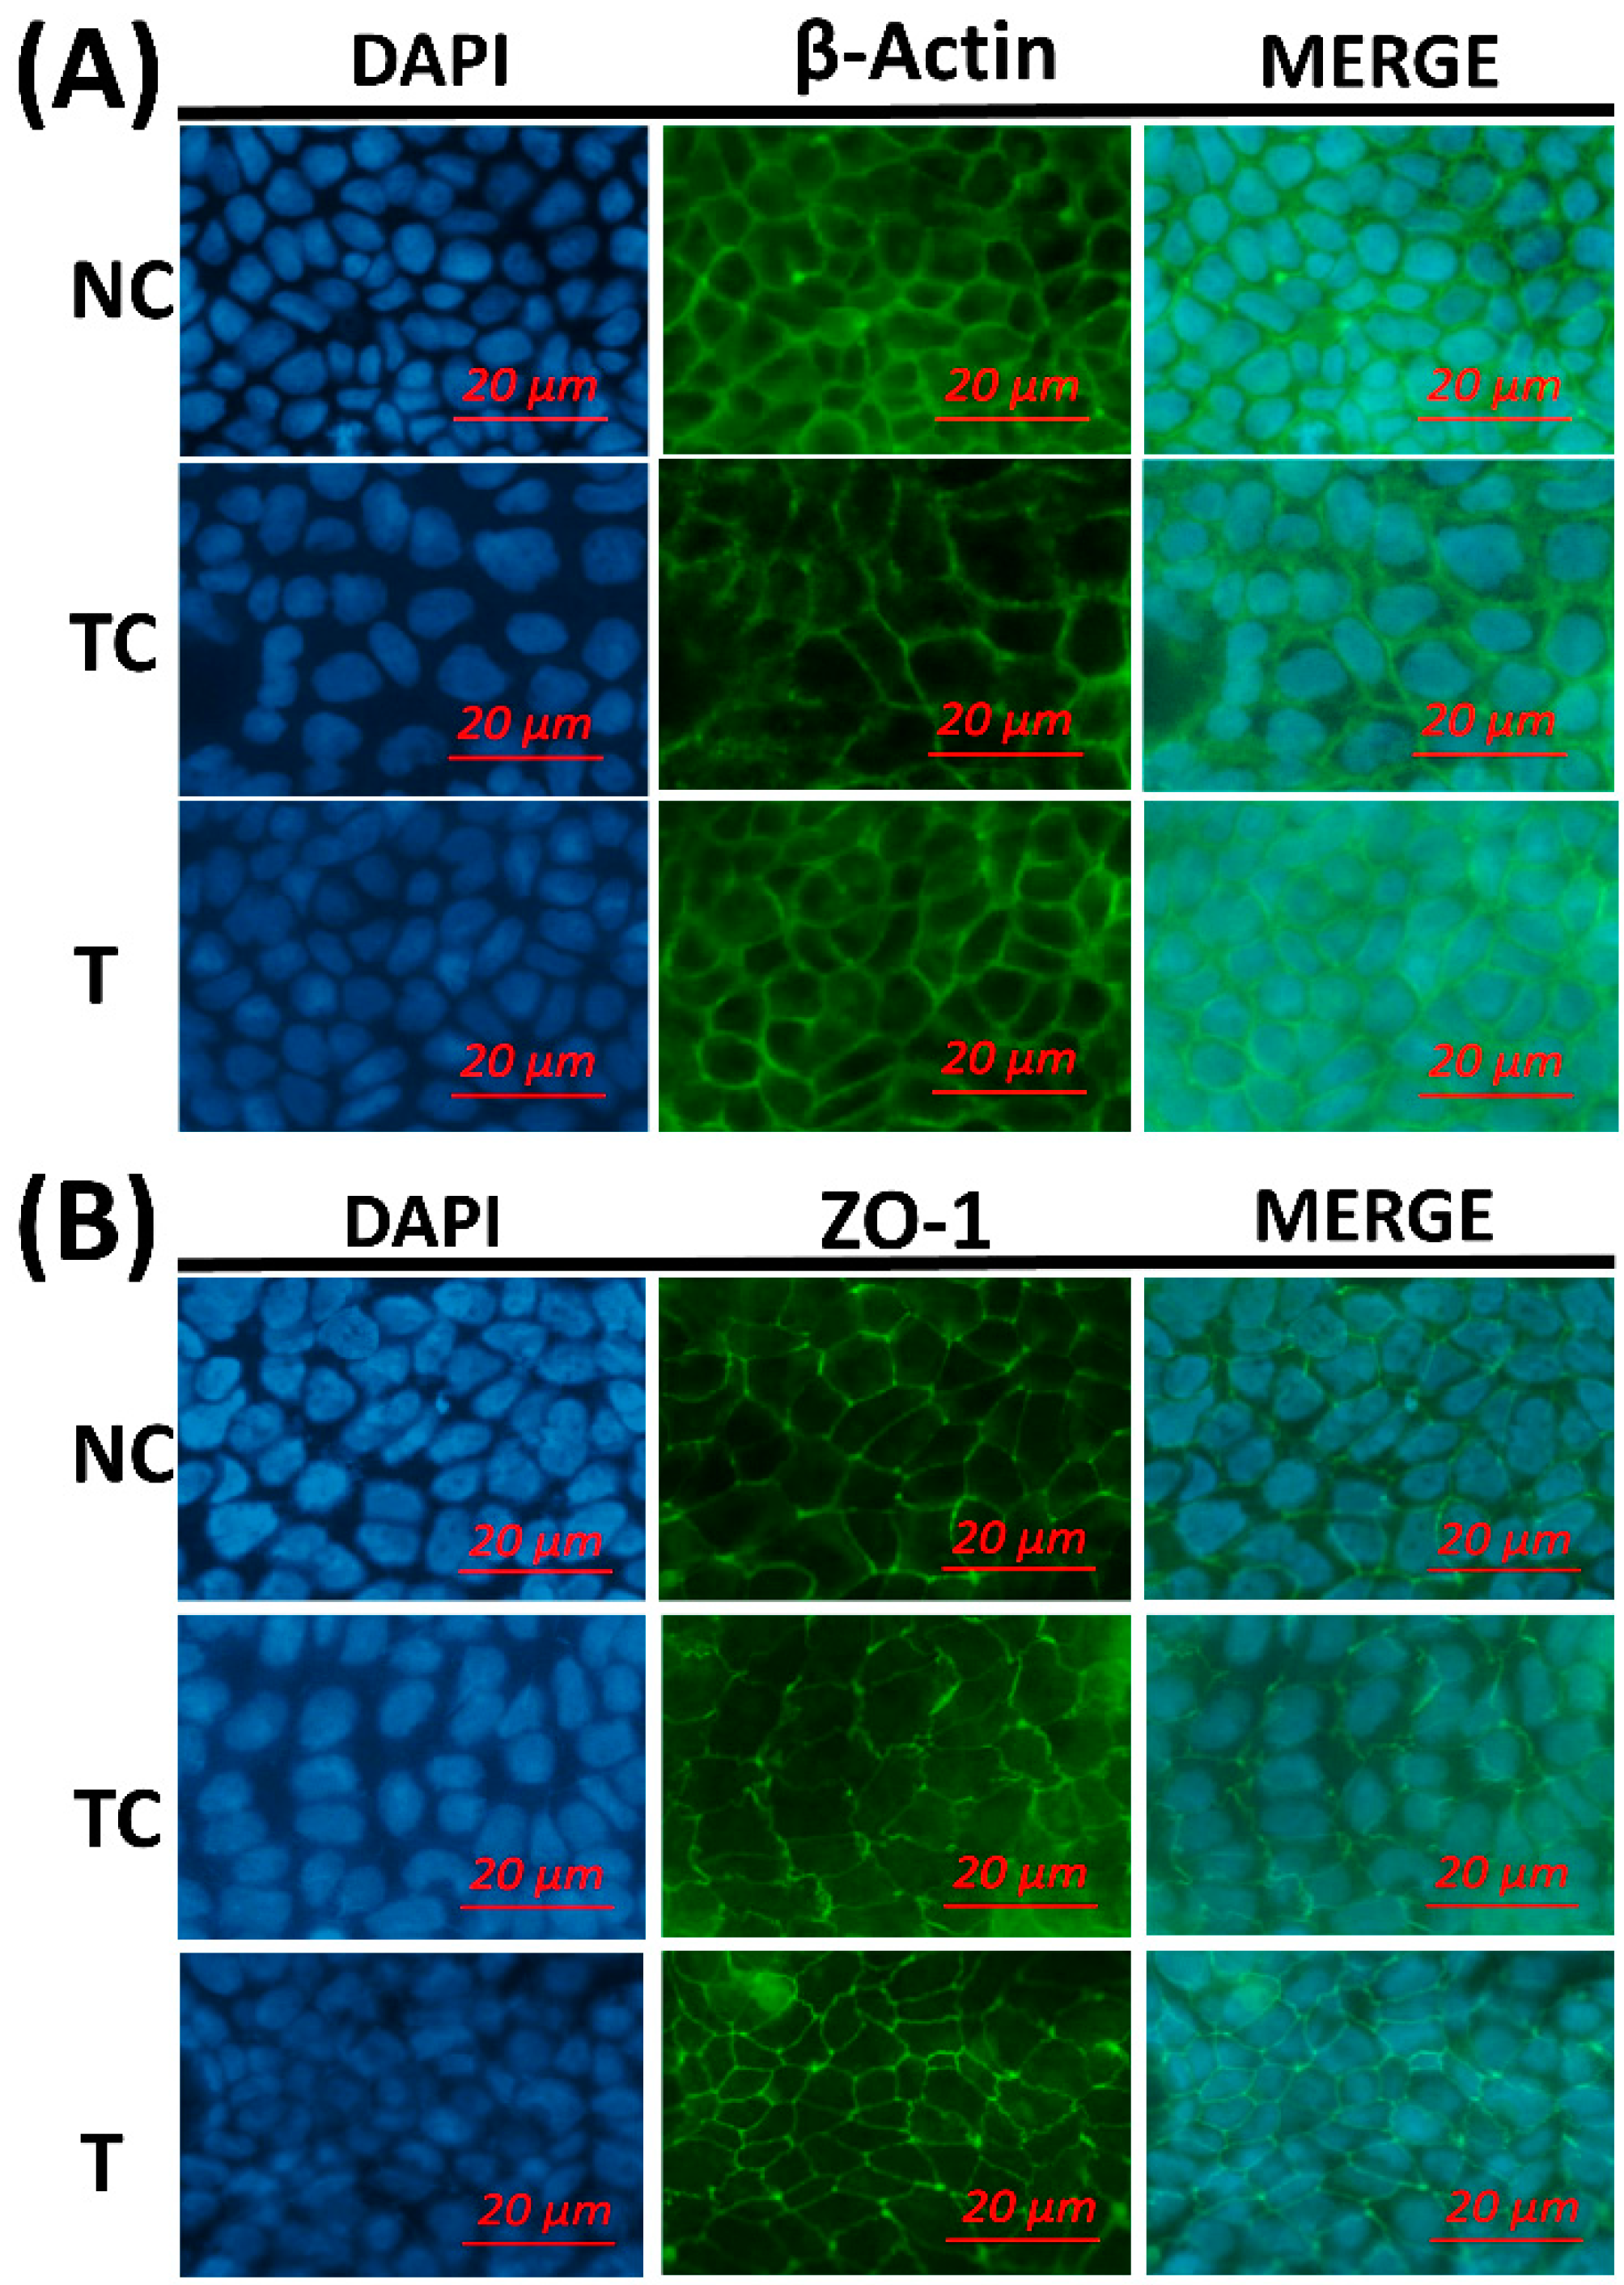
Figure 5, the cytoskeletal structure of the β-actin fiber was partially disorganized in the TC group by H
2O
2 treatment, while incubation with RDE after H
2O
2 treatment could alleviate the damage induced by H
2O
2. The morphology of tight junction had similar changes as cytoskeleton after different treatments.
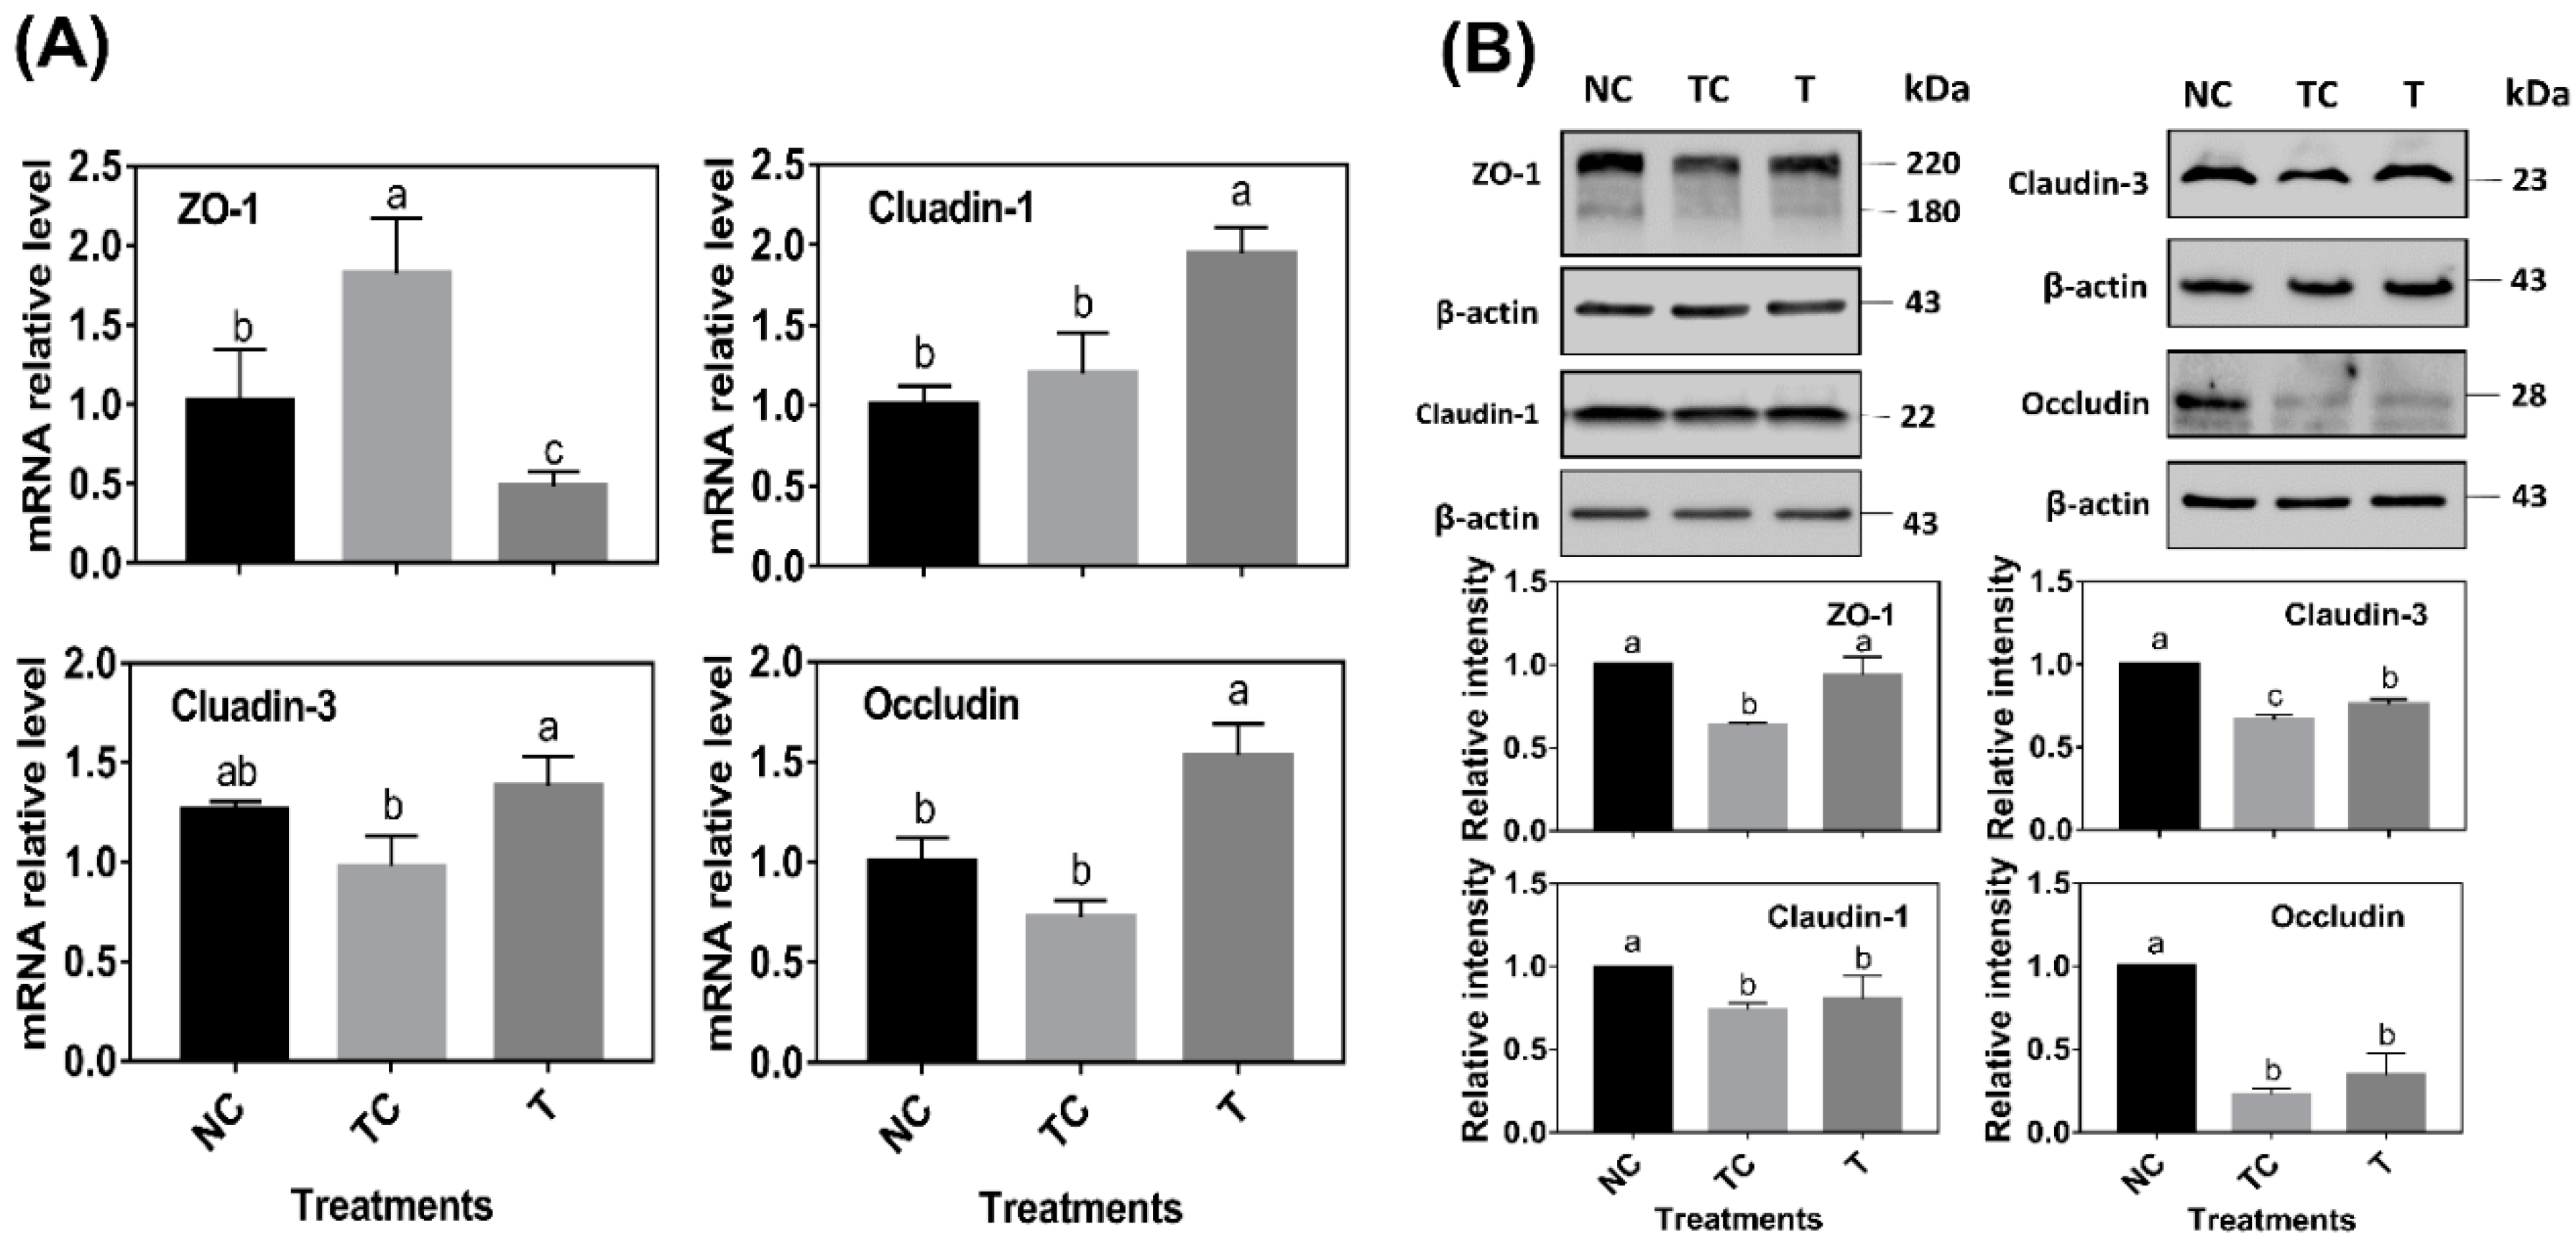
As shown in
Figure 6A, ZO-1 mRNA abundance was significantly increased by H
2O
2 treatment (
P < 0.05) while there was no difference (
P > 0.05) observed in the mRNA abundance of claudin-1, claudin-3, and occludin when compared with the control cells (NC). However, the cells treated with RDE had a higher level of claudin-1, claudin-3, and occludin mRNA abundance and a lower level of ZO-1 mRNA abundance than those in the other two treatments (
P < 0.05). As shown in
Figure 6B, H
2O
2 treatment (TC) significantly decreased the protein abundance of ZO-1, claudin-1, claudin-3, and occludin (
P < 0.05) when compared with the control cells (NC). RDE treatment (T) significantly increased the protein abundance of ZO-1 and claudin-3 (
P < 0.05) when compared with the TC group.
4. Discussion
Numerous studies have shown that the occurrences of the intestinal disease are associated with a defective barrier function that was caused by oxidative damage [
27]. Therefore, controlling oxidative damage and repairing the intestinal barrier could be effective ways to prevent many intestinal diseases. Phytochemicals have been reported to reduce the production of cellular ROS [
28] and the incidence of intestinal inflammation [
10]. The supplementation of ground red-osier dogwood in feeds decreased the serum malondialdehyde content and increased the SOD levels in the
Escherichia coli F4 K88
+ infected animals, as reported by a previous study [
21]. In the present study, an oxidative damage model was established by using H
2O
2 in Caco-2 cells, aiming to evaluate the therapeutic effects of RDE on intestinal oxidative damage.
To establish an H
2O
2-induced oxidative injury model with Caco-2 cells, the dosage effects of H
2O
2 on cell viability was investigated firstly. The results showed that the H
2O
2 treatment significantly reduced cell viability at more than 0.8 mM, indicating that a high dosage of H
2O
2 inhibited the growth of the cells or was toxic to the cells. These findings are consistent with previous studies of H
2O
2 and Caco-2 cells [
29]. However, a wide concentration range of RDE (up to 200 μg/mL, equal to 53 μg/mL total phenolic compounds) did not show a negative effect on cell viability, suggesting that higher RDE containing higher phenolic compounds might have better pharmaceutical effectiveness. Moreover, our results demonstrated that 100 μg/mL of RDE completely recovered the cell viability that was compromised by 1 mM H
2O
2. Therefore, our results suggest that RDE exerts protective effects against H
2O
2-induced oxidative damage in intestinal epithelial cells in vitro.
H
2O
2-induced oxidative stress triggered an imbalanced redox state and excessive ROS accumulation in Caco-2 cells, which in turn induced inflammatory responses evidenced by an increased IL-8 level. IL-8, a chemokine that can be produced by epithelial cells, has been recognized as an indicator of the inflammatory response [
30]. The mediators can activate signal transduction cascades as well as inducing variations in transcription factors, such as Nrf-2, which mediate immediate cellular stress responses [
31]. The oxidative stress and inflammatory responses together exacerbated the damage of both cellular structure and biomacromolecules. After a 3 h treatment with H
2O
2 and following a 24 h treatment with 100 μg/mL of RDE, the viability of Caco-2 cells was significantly restored, accompanied by decreased levels of IL-8 and ROS, indicating the inflammatory responses and oxidative damage were alleviated. The anti-oxidative components in RDE including rutin and phenolic acids are highly effective at scavenging oxygen radicals [
32].
A recent study shows that rutin attenuates inflammatory responses induced by lipopolysaccharide in an in vitro mouse muscle cell (C2C12) model and supplementation of rutin or rutin-containing plant extracts may hold promising potential for attenuating oxidative stress and inflammation [
33]. In addition, RDE increased the ratio of reduced GSH/GSSG, and reduced the consumption of reduced GSH. The results indicate that RDE can alleviate the occurrence of inflammation and oxidative damage by scavenging ROS production directly.
To further investigate the therapeutic mechanism of RDE on H
2O
2-induced oxidative damage, the protein expression of Nrf-2 and gene expression of responsive gene HO-1 and antioxidative enzyme SOD, CAT, and GSH-Px were measured. The protein expression of Nrf-2 was induced (
Figure 3A) and the mRNA expression of HO-1 was significantly upregulated after the addition of RDE (
Figure 3B). In addition, the mRNA abundance of SOD and GSH-Px also showed the same trend as HO-1 (
Figure 3C). This study revealed that RDE activated Nrf-2, mediated the antioxidant gene expression, and enhanced the antioxidant capacity of cells, thereby preventing the inflammation response and oxidative damage.
The intact gut barrier is important to prevent cell damage and restore cellular function caused by intestinal inflammation [
10] and oxidative stress [
34]. The TEER and permeability, as measured by FD4 diffusion, were often used to evaluate the integrity and tightness of the barrier formed by epithelial cells. Caco-2 cells were measured until the stable TEER formed by the tight junction. The permeability of the barrier after the 24 h treatment was also investigated by measuring the fluorescence intensity of FITC-Dextran (FD4) in the basolateral side diffused from the apical side. The H
2O
2 treatment lowered the TEER value and increased the permeability, suggesting that H
2O
2 treatment led to the increase in cell permeability [
35], and resulted in a defective barrier function of cells. However, TEER values were increased and permeability was decreased by RDE treatment for 24 h, indicating that the barrier function of Caco-2 cells was improved significantly. A recent study showed that intact epithelial barrier functions are necessary in order to maintain the homeostatic state in response to physiological host-gut microbiome cross-talks, and therefore the maintenance of epithelial barrier function is crucial for alleviating gut inflammation [
36]. It has been reported that phytochemicals extracted from apples can increase the TEER value of Caco-2 cells [
37], and this might be attributed to the antioxidative effects of phytochemicals.
The morphology of the cytoskeleton and tight junction was visualized by β-actin and ZO-1 immunofluorescent staining. H2O2 treatment disorganized the β-actin fibrin and diffused cell tight junction protein ZO-1. This indicates that H2O2 caused oxidative damage to the cell membrane monolayer. The addition of RDE obviously restored cell structure and stabilized morphological characteristics of ZO-1.
In this study, the mRNA and protein abundance of tight junction proteins, including ZO-1, claudin-1, claudin-3, and occluding, were determined. When compared with the sole H
2O
2 treatment group, RDE supplemented to cells enhanced the mRNA abundance of tight junction protein claudin-1, claudin-3, and occludin, but decreased the ZO-1 mRNA level in the Caco-2 cells. Firstly, this might be attributed to the fact that the sensitivity of gene expression of the tight junction proteins was different when responding to H
2O
2 [
38]. The transcription of ZO-1 was more sensitive to H
2O
2, and it could rapidly respond to oxidative stress. Secondly, it may also be related to the ordinal expression of different tight junction proteins. Within 24 h after H
2O
2 treatment, intracellular H
2O
2 was still playing a role in cells, and the expression of ZO-1, which was sensitive to oxidative stress, was induced. However, when cells were treated with H
2O
2 for 3 h, followed by RDE incubation of cells for 24 h, ROS was partially removed by RDE due to its strong antioxidant effect. Therefore, the expression of ZO-1 was not upregulated.
Interestingly, claudin-3 and occludin could be upregulated by RDE treatment, indicating that there were some unknown components in RDE that could regulate claudin-3 and occludin gene expression. In terms of tight junction proteins expression, H
2O
2 treatment reduced the contents of ZO-1, claudin-1, claudin-3, and occludin significantly. This was not completely consistent with their mRNA expression results. Firstly, it can be attributed to protein expression lagging behind mRNA expression [
24]. In addition, H
2O
2 treatment significantly disrupted the structure of tight junction proteins, resulting in a decrease in the protein content. After RDE treatment, the protein content of ZO-1 and claudin-3 increased significantly, but the protein content of claudin-1 and occludin did not increase. It was also evident from the staining results that the ZO-1 structure has also been significantly repaired to enhance the cellular barrier function and viability. Based on our observations in this study, there could be two reasons to explain why RDE enhances cellular barrier function. Firstly, RDE is rich in antioxidants [
19,
32] that have the ability to scavenge ROS directly and repair the structure of tight junction proteins. Moreover, RDE is rich in unknown components that activate the Nrf-2 pathway to enhance the antioxidant capacity of cells and induce the expression of tight junction proteins.

 ,
, 


