Bioassay Directed Isolation, Biological Evaluation and in Silico Studies of New Isolates from Pteris cretica L.

 , ,
, ,  and
and
Abstract
1. Introduction
2. Material and Methods
2.1. Plant Collection and Identification
2.2. Extraction and Isolation of Compounds
2.2.1. 2-Ethyloctyl Maleate (F9)
2.2.2. 2-Ethylhexyl Maleate (CB18)
2.2.3. In Silico Drug Likeness and ADMET Properties of Active Compounds in P. cretica
2.3. Identification of Putative Therapeutic Target
2.4. Experimental Protocols for Biological Assays
2.5. Antibacterial Assay
2.6. Antioxidant Activity
2.7. Acetylcholinesterase (AChE) Inhibition Activity
2.8. α-Glucosidase (GluE) Inhibition Assay
2.9. Molecular Docking of Potential Targets with Bioactive Compounds
2.10. Molecular Dynamics Simulations and Binding Free Energy Calculations
3. Results and Discussion
3.1. Putative Therapeutic Target for Isolates
3.2. Antiproliferative Targets
3.3. Antioxidant and Antiinflammatory Targets
3.4. Neurodegenerative Mechanism
3.5. Biological Activities of Isolates
3.6. Antibacterial Activities
3.7. Antioxidant Activities
3.8. Enzyme Inhibition Activities
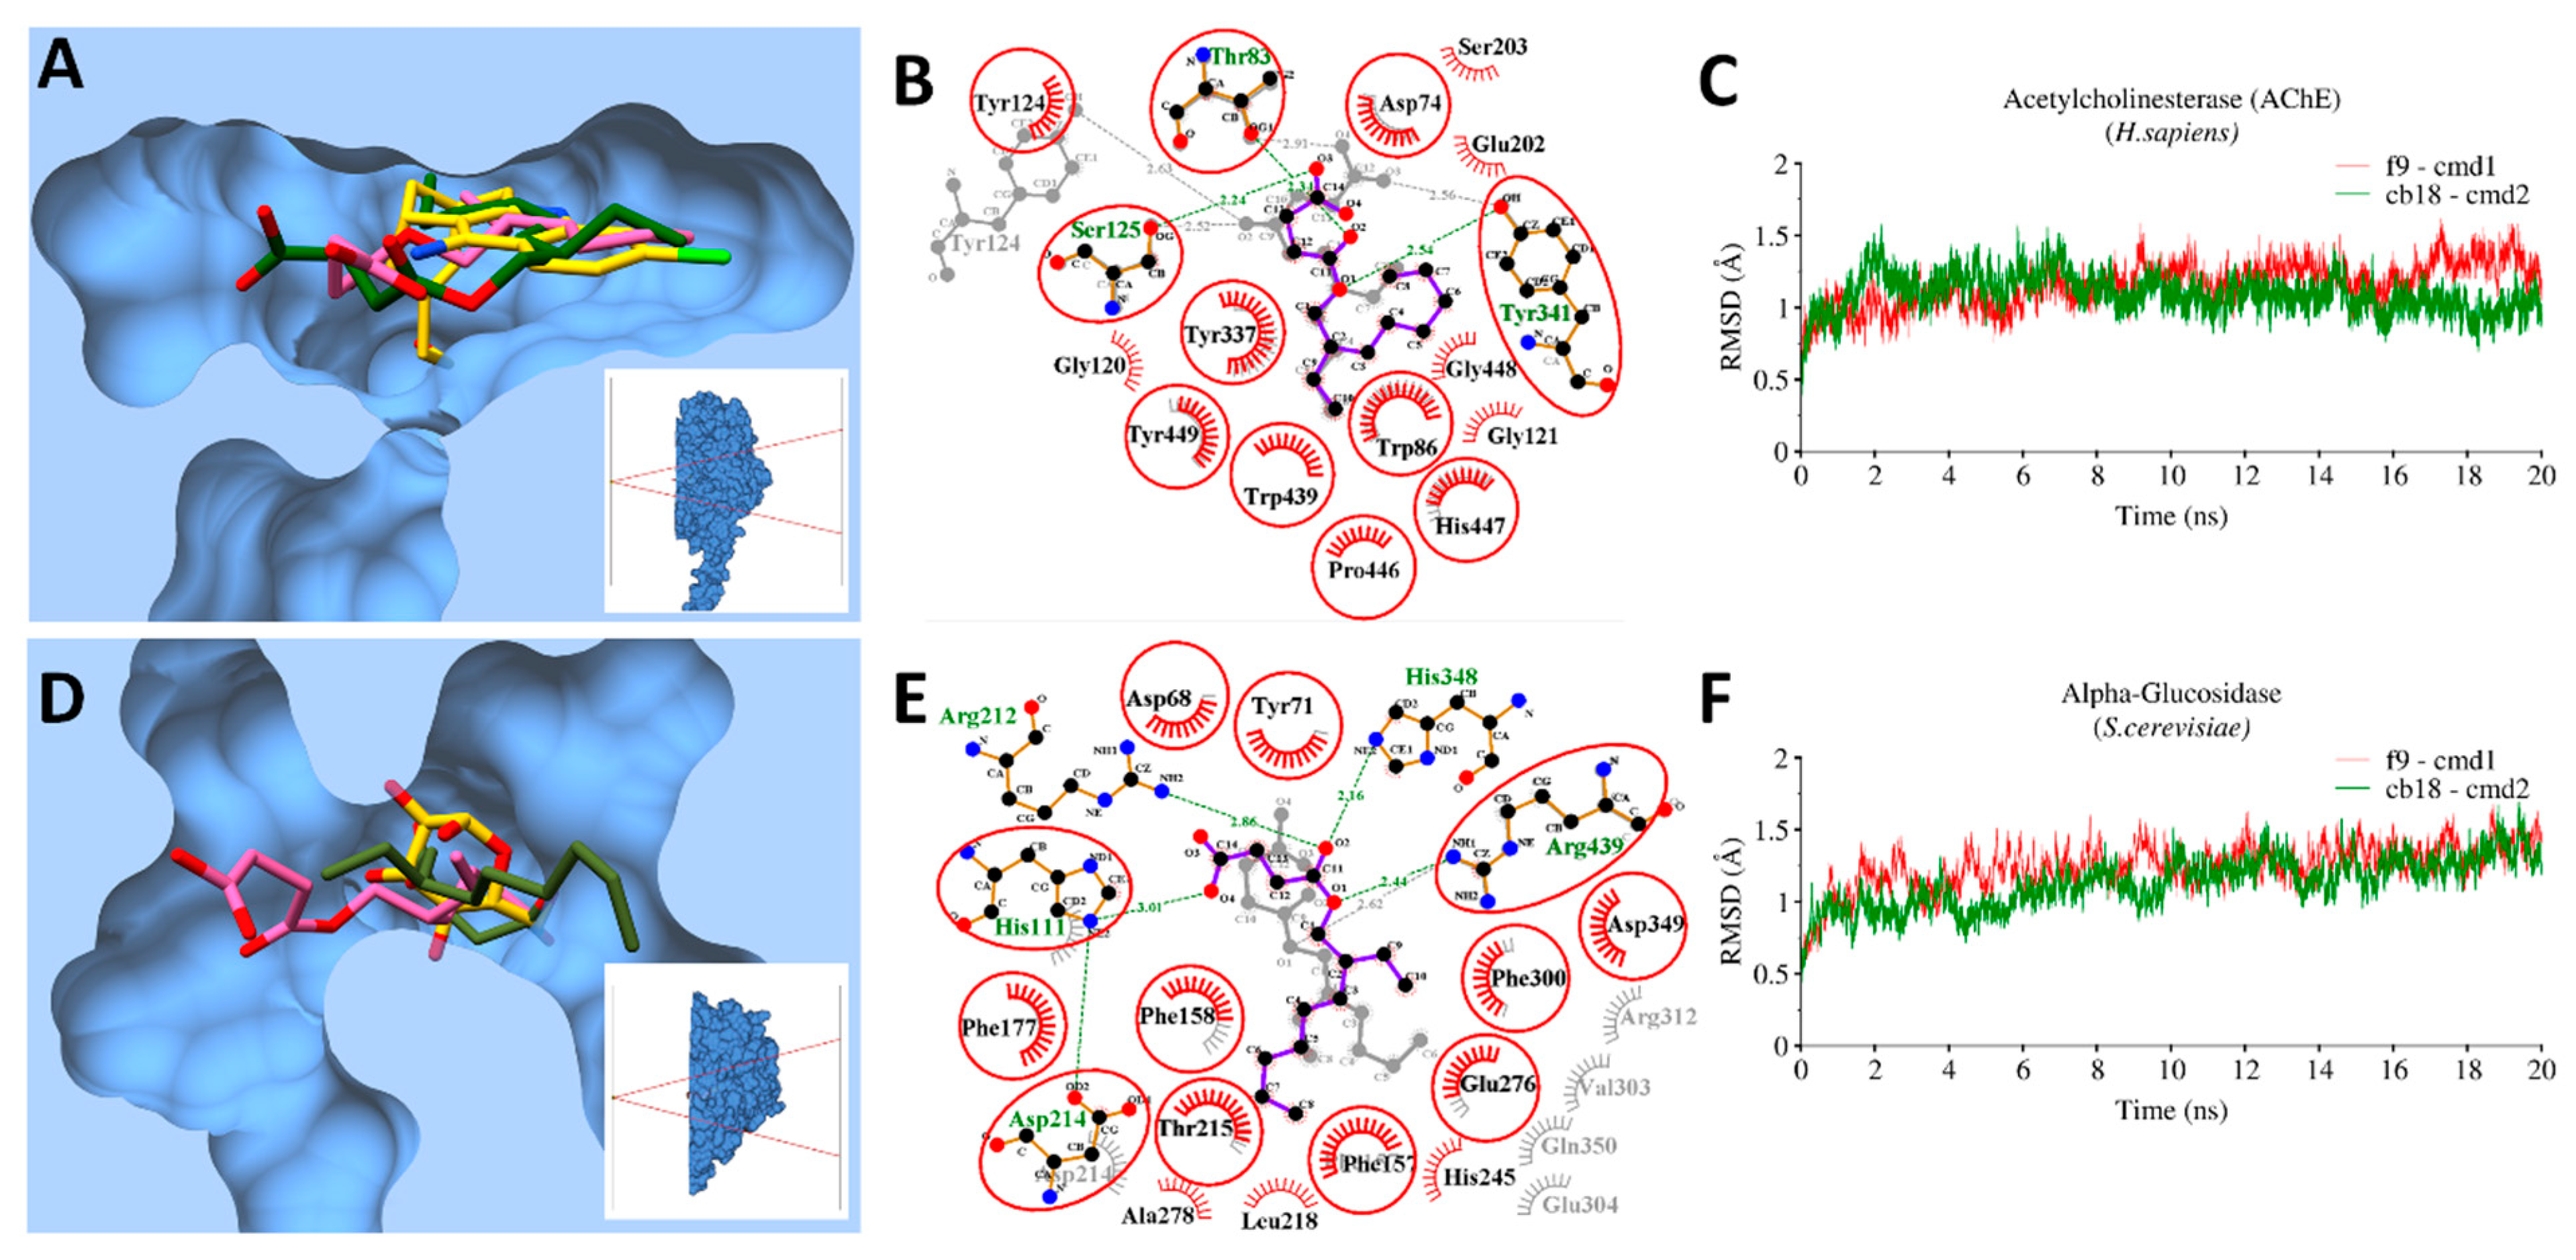
3.9. Molecular Docking and MD Simulations
3.9.1. Bacterial Targets
3.9.2. Enzymatic Targets
3.10. MMGBSA Binding Free Energy Calculations
4. Conclusions
Supplementary Materials
Author Contributions
Funding
Conflicts of Interest
References
- Raghavendra, M.; Satish, S.; Raveesha, K. Phytochemical analysis and antibacterial activity of Oxalis corniculata; a known medicinal plant. Myscience 2006, 1, 72–78. [Google Scholar]
- Şahin, F.; Karaman, I.; Güllüce, M.; Öğütçü, H.; Şengül, M.; Adıgüzel, A.; Öztürk, S.; Kotan, R. Evaluation of antimicrobial activities of Satureja hortensis L. J. Ethnopharmacol. 2003, 87, 61–65. [Google Scholar] [CrossRef]
- Newman, D.J.; Cragg, G.M. Natural Products as Sources of New Drugs from 1981 to 2014. J. Nat. Prod. 2016, 79, 629–661. [Google Scholar] [CrossRef] [PubMed]
- Zhang, L.; Rothfels, C.J.; Ebihara, A.; Schuettpelz, E.; Le Péchon, T.; Kamau, P.; He, H.; Zhou, X.-M.; Prado, J.; Field, A.; et al. A global plastid phylogeny of the brake fern genus Pteris (Pteridaceae) and related genera in the Pteridoideae. Cladistics 2015, 31, 406–423. [Google Scholar] [CrossRef]
- Pratibha, K.; Otaghvari, A.M.; Govindapyari, H.; Bahuguna, Y.M.; Uniyal, P. Some ethno-medicinally important pteridophytes of India. Int. J. Med. Arom. Plants 2011, 1, 18–22. [Google Scholar]
- Imperato, F. Luteolin 8-C-rhamnoside-7-O-rhamnoside from Pteris cretica. Phytochemistry 1994, 37, 589–590. [Google Scholar] [CrossRef]
- Saleem, F.; Khan, M.T.J.; Saleem, H.; Azeem, M.; Ahmed, S.; Shahid, N.; Altaf, H. Phytochemical, antimicrobial and antioxidant activities of Pteris cretica L. (Pteridaceae) extracts. Acta. Pol. Pharm. 2016, 73, 1397–1403. [Google Scholar] [PubMed]
- Diopan, V.; Babula, P.; Shestivska, V.; Adam, V.; Zemlicka, M.; Dvorska, M.; Hubalek, J.; Trnkova, L.; Havel, L.; Kizek, R. Electrochemical and spectrometric study of antioxidant activity of pomiferin, isopomiferin, osajin and catalposide. J. Pharm. Biomed. Anal. 2008, 48, 127–133. [Google Scholar] [CrossRef]
- Wondrak, G.T.; Villeneuve, N.F.; Lamore, S.D.; Bause, A.S.; Jiang, T.; Zhang, D.D. The cinnamon-derived dietary factor cinnamic aldehyde activates the Nrf2-dependent antioxidant response in human epithelial colon cells. Molecules 2010, 15, 3338–3355. [Google Scholar] [CrossRef]
- Adams, R.; Craig, P.; Parsons, O. Neuropsychology of dementia. Neurol. Clin. 1986, 4, 387–404. [Google Scholar] [CrossRef]
- Orhan, I.; Şener, B.; Choudhary, M.; Khalid, A. Acetylcholinesterase and butyrylcholinesterase inhibitory activity of some Turkish medicinal plants. J. Ethnopharmacol. 2004, 91, 57–60. [Google Scholar] [CrossRef] [PubMed]
- Hung, C.L.; Chen, C.C. Computational approaches for drug discovery. Drug Dev. Res. 2014, 75, 412–418. [Google Scholar] [CrossRef] [PubMed]
- Katsila, T.; Spyroulias, G.A.; Patrinos, G.P.; Matsoukas, M.T. Computational approaches in target identification and drug discovery. Comput. Struct. Biotechnol. J. 2016, 14, 177–184. [Google Scholar] [CrossRef] [PubMed]
- Macalino, S.J.; Gosu, V.; Hong, S.; Choi, S. Role of computer-aided drug design in modern drug discovery. Arch. Pharm. Res. 2015, 38, 1686–1701. [Google Scholar] [CrossRef] [PubMed]
- Xu, X. New concepts and approaches for drug discovery based on traditional Chinese medicine. Drug Discov. Today 2006, 3, 247–253. [Google Scholar] [CrossRef]
- Xiang, M.; Cao, Y.; Fan, W.; Chen, L.; Mo, Y. Computer-aided drug design: Lead discovery and optimization. Comb. Chem. High Throughput Screen. 2012, 15, 328–337. [Google Scholar] [CrossRef] [PubMed]
- Ramström, O.; Lehn, J.-M. Drug discovery by dynamic combinatorial libraries. Nat. Rev. Drug Discov. 2002, 1, 26. [Google Scholar] [CrossRef]
- Lehn, J.-M.; Eliseev, A.V. Dynamic combinatorial chemistry. Science 2001, 291, 2331–2332. [Google Scholar] [CrossRef]
- Terrett, N.K.; Gardner, M.; Gordon, D.W.; Kobylecki, R.J.; Steele, J. Combinatorial synthesis—the design of compound libraries and their application to drug discovery. Tetrahedron 1995, 51, 8135–8173. [Google Scholar] [CrossRef]
- Klebe, G. Virtual ligand screening: Strategies, perspectives and limitations. Drug Discov. Today 2006, 11, 580–594. [Google Scholar] [CrossRef]
- Ma, X.H.; Jia, J.; Zhu, F.; Xue, Y.; Li, Z.R.; Chen, Y.Z. Comparative analysis of machine learning methods in ligand-based virtual screening of large compound libraries. Comb. Chem. High Throughput Screen. 2009, 12, 344–357. [Google Scholar] [CrossRef] [PubMed]
- Waszkowycz, B. Structure-based approaches to drug design and virtual screening. Curr. Opin. Drug Discov. Devel. 2002, 5, 407–413. [Google Scholar] [PubMed]
- Cheng, T.; Li, Q.; Zhou, Z.; Wang, Y.; Bryant, S.H. Structure-based virtual screening for drug discovery: A problem-centric review. AAPS J. 2012, 14, 133–141. [Google Scholar] [CrossRef] [PubMed]
- Ekins, S.; Mestres, J.; Testa, B. In silico pharmacology for drug discovery: Methods for virtual ligand screening and profiling. Br. J. Pharmacol. 2007, 152, 9–20. [Google Scholar] [CrossRef] [PubMed]
- Kumar, A.; Zhang, K.Y. Hierarchical virtual screening approaches in small molecule drug discovery. Methods 2015, 71, 26–37. [Google Scholar] [CrossRef] [PubMed]
- Lavecchia, A.; Di Giovanni, C. Virtual screening strategies in drug discovery: A critical review. Cur. Med. Chem. 2013, 20, 2839–2860. [Google Scholar] [CrossRef]
- Hui-fang, L.; Qing, S.; Jian, Z.; Wei, F. Evaluation of various inverse docking schemes in multiple targets identification. J. Mol. Graph. Model. 2010, 29, 326–330. [Google Scholar] [CrossRef]
- Kharkar, P.S.; Warrier, S.; Gaud, R.S. Reverse docking: A powerful tool for drug repositioning and drug rescue. Future Med. Chem. 2014, 6, 333–342. [Google Scholar] [CrossRef]
- Böttcher, T.; Pitscheider, M.; Sieber, S.A. Natural products and their biological targets: Proteomic and metabolomic labeling strategies. Angew. Chem Int. Ed. 2010, 49, 2680–2698. [Google Scholar] [CrossRef]
- Cheng, K.W.; Wong, C.C.; Wang, M.; He, Q.Y.; Chen, F. Identification and characterization of molecular targets of natural products by mass spectrometry. Nucleic Acids Res. 2010, 29, 126–155. [Google Scholar] [CrossRef]
- Huang, C.-M.; Elmets, C.A.; De-chu, C.T.; Li, F.; Yusuf, N. Proteomics reveals that proteins expressed during the early stage of Bacillus anthracis infection are potential targets for the development of vaccines and drugs. Genom. Proteom. Bioinform. 2004, 2, 143–151. [Google Scholar] [CrossRef]
- Li, H.; Zheng, M.; Liu, X.; Jiang, H. Computational Approach for Drug Target Identification. Chem. Genom. 2012, 279. [Google Scholar]
- Liu, X.; Ouyang, S.; Yu, B.; Liu, Y.; Huang, K.; Gong, J.; Zheng, S.; Li, Z.; Li, H.; Jiang, H. PharmMapper server: A web server for potential drug target identification using pharmacophore mapping approach. Nucleic Acids Res. 2010, 38, W609–W614. [Google Scholar] [CrossRef] [PubMed]
- Kinnings, S.L.; Jackson, R.M. ReverseScreen3D: A structure-based ligand matching method to identify protein targets. J. Chem. Inf. Model. 2011, 51, 624–634. [Google Scholar] [CrossRef] [PubMed]
- Chen, Y.; Ung, C. Prediction of potential toxicity and side effect protein targets of a small molecule by a ligand–protein inverse docking approach. J. Mol. Graph. Model. 2001, 20, 199–218. [Google Scholar] [CrossRef]
- Li, H.; Gao, Z.; Kang, L.; Zhang, H.; Yang, K.; Yu, K.; Luo, X.; Zhu, W.; Chen, K.; Shen, J.; et al. TarFisDock: A web server for identifying drug targets with docking approach. Nucleic Acids Res. 2006, 34, W219–W224. [Google Scholar] [CrossRef] [PubMed]
- Wang, J.-C.; Chu, P.-Y.; Chen, C.-M.; Lin, J.-H. idTarget: A web server for identifying protein targets of small chemical molecules with robust scoring functions and a divide-and-conquer docking approach. Nucleic Acids Res. 2012, 40, W393–W399. [Google Scholar] [CrossRef]
- Wang, L.; Ma, C.; Wipf, P.; Liu, H.; Su, W.; Xie, X.-Q. TargetHunter: An in silico target identification tool for predicting therapeutic potential of small organic molecules based on chemogenomic database. AAPS J. 2013, 15, 395–406. [Google Scholar] [CrossRef]
- Zheng, R.; Chen, T.-S.; Lu, T. A comparative reverse docking strategy to identify potential antineoplastic targets of tea functional components and binding mode. Int. J. Mol. Sci. 2011, 12, 5200–5212. [Google Scholar] [CrossRef]
- Bhattacharjee, B.; Vijayasarathy, S.; Karunakar, P.; Chatterjee, J. Comparative reverse screening approach to identify potential anti-neoplastic targets of saffron functional components and binding mode. Asian Pac. J. Cancer Prev. 2012, 13, 5605–5611. [Google Scholar] [CrossRef]
- Bhattacharjee, B.; Chatterjee, J. Identification of proapoptopic, anti-inflammatory, anti-proliferative, anti-invasive and anti-angiogenic targets of essential oils in cardamom by dual reverse virtual screening and binding pose analysis. Asian Pac. J. Cancer Prev. 2013, 14, 3735–3742. [Google Scholar] [CrossRef] [PubMed]
- Kumar, R.P.; Manoj, M.; Kush, A.; Annadurai, R. In silico approach of azadirachtin binding with actins. Insect Biochem. Mol. Biol. 2007, 37, 635–640. [Google Scholar] [CrossRef] [PubMed]
- Kiss, R.; Szalai, F.; Sandor, M. Mcule.com: A public web service for drug discovery. Abstr. Pap. Am. Chem. Soc. 2012, 243. [Google Scholar] [CrossRef]
- Cheng, F.; Li, W.; Zhou, Y.; Shen, J.; Wu, Z.; Liu, G.; Lee, P.W.; Tang, Y. admetSAR: A comprehensive source and free tool for assessment of chemical ADMET properties. J. Chem. Inf. Model. 2012, 52, 3099–3105. [Google Scholar] [CrossRef] [PubMed]
- Liu, T.; Lin, Y.; Wen, X.; Jorissen, R.N.; Gilson, M.K. BindingDB: A web-accessible database of experimentally determined protein–ligand binding affinities. Nucleic Acids Res. 2006, 35, D198–D201. [Google Scholar] [CrossRef] [PubMed]
- Wishart, D.S.; Knox, C.; Guo, A.C.; Shrivastava, S.; Hassanali, M.; Stothard, P.; Chang, Z.; Woolsey, J. DrugBank: A comprehensive resource for in silico drug discovery and exploration. Nucleic Acids Res. 2006, 34, D668–D672. [Google Scholar] [CrossRef] [PubMed]
- Gao, Z.; Li, H.; Zhang, H.; Liu, X.; Kang, L.; Luo, X.; Zhu, W.; Chen, K.; Wang, X.; Jiang, H. PDTD: A web-accessible protein database for drug target identification. BMC Bioinform. 2008, 9, 104. [Google Scholar] [CrossRef] [PubMed]
- Wang, Y.; Bolton, E.; Dracheva, S.; Karapetyan, K.; Shoemaker, B.A.; Suzek, T.O.; Wang, J.; Xiao, J.; Zhang, J.; Bryant, S.H. An overview of the PubChem BioAssay resource. Nucleic Acids Res. 2009, 38, D255–D266. [Google Scholar] [CrossRef]
- Mangal, M.; Sagar, P.; Singh, H.; Raghava, G.P.; Agarwal, S.M. NPACT: Naturally occurring plant-based anti-cancer compound-activity-target database. Nucleic Acids Res. 2012, 41, D1124–D1129. [Google Scholar] [CrossRef] [PubMed]
- Ye, H.; Ye, L.; Kang, H.; Zhang, D.; Tao, L.; Tang, K.; Liu, X.; Zhu, R.; Liu, Q.; Chen, Y.Z.; et al. HIT: Linking herbal active ingredients to targets. Nucleic Acids Res. 2010, 39, D1055–D1059. [Google Scholar] [CrossRef] [PubMed]
- Sarker, S.D.; Nahar, L.; Kumarasamy, Y. Microtitre plate-based antibacterial assay incorporating resazurin as an indicator of cell growth, and its application in the in vitro antibacterial screening of phytochemicals. Methods 2007, 42, 321–324. [Google Scholar] [CrossRef] [PubMed]
- Taha, M.; Ismail, N.H.; Khan, A.; Shah, S.A.A.; Anwar, A.; Halim, S.A.; Fatmi, M.Q.; Imran, S.; Rahim, F.; Khan, K.M. Synthesis of novel derivatives of oxindole, their urease inhibition and molecular docking studies. Bioorg. Med. Chem. Lett. 2015, 25, 3285–3289. [Google Scholar] [CrossRef] [PubMed]
- Chapdelaine, P.; Tremblay, R.R.; Dube, J. P-Nitrophenol-alpha-D-glucopyranoside as substrate for measurement of maltase activity in human semen. Clin. Chem. 1978, 24, 208–211. [Google Scholar] [PubMed]
- Trott, O.; Olson, A.J. AutoDock Vina: Improving the speed and accuracy of docking with a new scoring function, efficient optimization, and multithreading. J. Comput. Chem. 2010, 31, 455–461. [Google Scholar] [CrossRef] [PubMed]
- Nachon, F.; Carletti, E.; Ronco, C.; Trovaslet, M.; Nicolet, Y.; Jean, L.; Renard, P.-Y. Crystal structures of human cholinesterases in complex with huprine W and tacrine: Elements of specificity for anti-Alzheimer’s drugs targeting acetyl-and butyryl-cholinesterase. Biochem. J. 2013, 453, 393–399. [Google Scholar] [CrossRef] [PubMed]
- Schwede, T.; Kopp, J.; Guex, N.; Peitsch, M.C. SWISS-MODEL: An automated protein homology-modeling server. Nucleic Acids Res. 2003, 31, 3381–3385. [Google Scholar] [CrossRef] [PubMed]
- Dennis, M.L.; Lee, M.D.; Harjani, J.R.; Ahmed, M.; DeBono, A.J.; Pitcher, N.P.; Wang, Z.C.; Chhabra, S.; Barlow, N.; Rahmani, R.; et al. 8-Mercaptoguanine Derivatives as Inhibitors of Dihydropteroate Synthase. Chem. Eur. J. 2018, 24, 1922–1930. [Google Scholar] [CrossRef] [PubMed]
- Lam, T.; Hilgers, M.T.; Cunningham, M.L.; Kwan, B.P.; Nelson, K.J.; Brown-Driver, V.; Ong, V.; Trzoss, M.; Hough, G.; Shaw, K.J.; et al. Structure-based design of new dihydrofolate reductase antibacterial agents: 7-(benzimidazol-1-yl)-2,4-diaminoquinazolines. J. Med. Chem. 2014, 57, 651–668. [Google Scholar] [CrossRef] [PubMed]
- Ahmed, B.; Ali Ashfaq, U.; Usman Mirza, M. Medicinal plant phytochemicals and their inhibitory activities against pancreatic lipase: Molecular docking combined with molecular dynamics simulation approach. Nat. Pro. Res. 2018, 32, 1123–1129. [Google Scholar] [CrossRef]
- Ferdous, S.; Mirza, M.U.; Saeed, U. Docking studies reveal phytochemicals as the long searched anticancer drugs for breast cancer. Int. J. Comp. Appl. 2013, 67, 1–5. [Google Scholar] [CrossRef]
- Yousuf, Z.; Iman, K.; Iftikhar, N.; Mirza, M.U. Structure-based virtual screening and molecular docking for the identification of potential multi-targeted inhibitors against breast cancer. Breast Cancer (Dove Med. Press) 2017, 9, 447–459. [Google Scholar] [CrossRef] [PubMed]
- Pettersen, E.F.; Goddard, T.D.; Huang, C.C.; Couch, G.S.; Greenblatt, D.M.; Meng, E.C.; Ferrin, T.E. UCSF Chimera—A visualization system for exploratory research and analysis. J. Comput. Chem. 2004, 25, 1605–1612. [Google Scholar] [CrossRef] [PubMed]
- Case, D.A.; Cheatham, T.E., III; Darden, T.; Gohlke, H.; Luo, R.; Merz, K.M., Jr.; Onufriev, A.; Simmerling, C.; Wang, B.; Woods, R.J. The Amber biomolecular simulation programs. J. Comput. Chem. 2005, 26, 1668–1688. [Google Scholar] [CrossRef] [PubMed]
- Iman, K.; Mirza, M.U.; Mazhar, N.; Vanmeert, M.; Irshad, I.; Kamal, M.A. In silico Structure-based Identification of Novel Acetylcholinesterase Inhibitors Against Alzheimer’s Disease. CNS Neurol. Disord. Drug Targets 2018, 17, 54–68. [Google Scholar] [CrossRef]
- Roe, D.R.; Cheatham, T.E., III. PTRAJ and CPPTRAJ: Software for processing and analysis of molecular dynamics trajectory data. J. Chem. Theory Comput. 2013, 9, 3084–3095. [Google Scholar] [CrossRef]
- Gohlke, H.; Kiel, C.; Case, D.A. Insights into protein–protein binding by binding free energy calculation and free energy decomposition for the Ras–Raf and Ras–RalGDS complexes. J. Mol. Biol. 2003, 330, 891–913. [Google Scholar] [CrossRef]
- Hayes, J.M.; Archontis, G. MM-GB (PB) SA calculations of protein-ligand binding free energies. In Molecular Dynamics-Studies of Synthetic and Biological Macromolecules; Wang, L., Ed.; InTech: Rijeka, Croatia, 2012. [Google Scholar]
- Herbst, R.S. Review of epidermal growth factor receptor biology. Int. J. Radiat. Oncol. Biol. Phys. 2004, 59, S21–S26. [Google Scholar] [CrossRef] [PubMed]
- Ciardiello, F. Epidermal growth factor receptor tyrosine kinase inhibitors as anticancer agents. Drugs 2000, 60, 25–32. [Google Scholar] [CrossRef]
- Lai, C.-J.; Bao, R.; Tao, X.U.; Wang, J.; Atoyan, R.; Qu, H.; Wang, D.G.; Yin, L.; Samson, M.; Forrester, J.; et al. CUDC-101, a multitargeted inhibitor of histone deacetylase, epidermal growth factor receptor, and human epidermal growth factor receptor 2, exerts potent anticancer activity. Can. Res. 2010, 70, 3647–3656. [Google Scholar] [CrossRef]
- Tamm, I.; Wang, Y.; Sausville, E.; Scudiero, D.A.; Vigna, N.; Oltersdorf, T.; Reed, J.C. IAP-family protein survivin inhibits caspase activity and apoptosis induced by Fas (CD95), Bax, caspases, and anticancer drugs. Can. Res. 1998, 58, 5315–5320. [Google Scholar]
- Stewart, Z.A.; Westfall, M.D.; Pietenpol, J.A. Cell-cycle dysregulation and anticancer therapy. Trends Pharmacol. Sci. 2003, 24, 139–145. [Google Scholar] [CrossRef]
- Sanchez-Martinez, C.; Gelbert, L.M.; Lallena, M.J.; de Dios, A. Cyclin dependent kinase (CDK) inhibitors as anticancer drugs. Bioorg. Med. Chem. Lett. 2015, 25, 3420–3435. [Google Scholar] [CrossRef] [PubMed]
- Rakoff-Nahoum, S. Cancer Issue: Why cancer and inflammation? Yale J. Biol. Med. 2006, 79, 123. [Google Scholar] [PubMed]
- Gupta, S.C.; Kim, J.H.; Prasad, S.; Aggarwal, B.B. Regulation of survival, proliferation, invasion, angiogenesis, and metastasis of tumor cells through modulation of inflammatory pathways by nutraceuticals. Cancer Metastasis Rev. 2010, 29, 405–434. [Google Scholar] [CrossRef] [PubMed]
- Kaminska, B. MAPK signalling pathways as molecular targets for anti-inflammatory therapy—from molecular mechanisms to therapeutic benefits. Biochim. Biophys. Acta. Prot. Proteom. 2005, 1754, 253–262. [Google Scholar] [CrossRef] [PubMed]
- Yadav, D.K.; Meena, A.; Srivastava, A.; Chanda, D.; Khan, F.; Chattopadhyay, S. Development of QSAR model for immunomodulatory activity of natural coumarinolignoids. Drug Des. Devel. Ther. 2010, 4, 173. [Google Scholar]
- Hardy, J.; Allsop, D. Amyloid deposition as the central event in the aetiology of Alzheimer’s disease. Trends Pharmacol. Sci. 1991, 12, 383–388. [Google Scholar] [CrossRef]
- Ghosh, A.K.; Brindisi, M.; Tang, J. Developing β-secretase inhibitors for treatment of Alzheimer’s disease. J. Neurochem. 2012, 120, 71–83. [Google Scholar] [CrossRef]
- Hoozemans, J.; Rozemuller, J.; Van Haastert, E.; Veerhuis, R.; Eikelenboom, P. Cyclooxygenase-1 and-2 in the different stages of Alzheimer’s disease pathology. Curr. Pharm. Des. 2008, 14, 1419–1427. [Google Scholar] [CrossRef]
- Rafii, M.S.; Aisen, P.S. Advances in Alzheimer’s disease drug development. BMC Med. 2015, 13, 62. [Google Scholar] [CrossRef]
- Ploia, C.; Antoniou, X.; Sclip, A.; Grande, V.; Cardinetti, D.; Colombo, A.; Canu, N.; Benussi, L.; Ghidoni, R.; Forloni, G.; et al. JNK plays a key role in tau hyperphosphorylation in Alzheimer’s disease models. J. Alzheimers Dis. 2011, 26, 315–329. [Google Scholar] [CrossRef] [PubMed]
- Wang, J.Z.; Grundke-Iqbal, I.; Iqbal, K. Kinases and phosphatases and tau sites involved in Alzheimer neurofibrillary degeneration. Eur. J. Neurosci. 2007, 25, 59–68. [Google Scholar] [CrossRef] [PubMed]
- Inestrosa, N.C.; Alvarez, A.; Perez, C.A.; Moreno, R.D.; Vicente, M.; Linker, C.; Casanueva, O.I.; Soto, C.; Garrido, J. Acetylcholinesterase accelerates assembly of amyloid-β-peptides into Alzheimer’s fibrils: Possible role of the peripheral site of the enzyme. Neuron 1996, 16, 881–891. [Google Scholar] [CrossRef]
- Tsurkan, L.G.; Hatfield, M.J.; Edwards, C.C.; Hyatt, J.L.; Potter, P.M. Inhibition of human carboxylesterases hCE1 and hiCE by cholinesterase inhibitors. Chem. Biol. Interact. 2013, 203, 226–230. [Google Scholar] [CrossRef] [PubMed]
- Robert Norman Jones, G. The Alzheimer pandemic: Is paracetamol to blame? Inflamm. Allergy Drug Targets 2014, 13, 2–14. [Google Scholar] [CrossRef][Green Version]
- Tobinick, E.; Gross, H.; Weinberger, A.; Cohen, H. TNF-alpha modulation for treatment of Alzheimer’s disease: A 6-month pilot study. Med. Gen. Med. 2006, 8, 25. [Google Scholar]
- Heckman, P.; Wouters, C.; Prickaerts, J. Phosphodiesterase inhibitors as a target for cognition enhancement in aging and Alzheimer’s disease: A translational overview. Curr. Pharm. Des. 2015, 21, 317–331. [Google Scholar] [CrossRef]
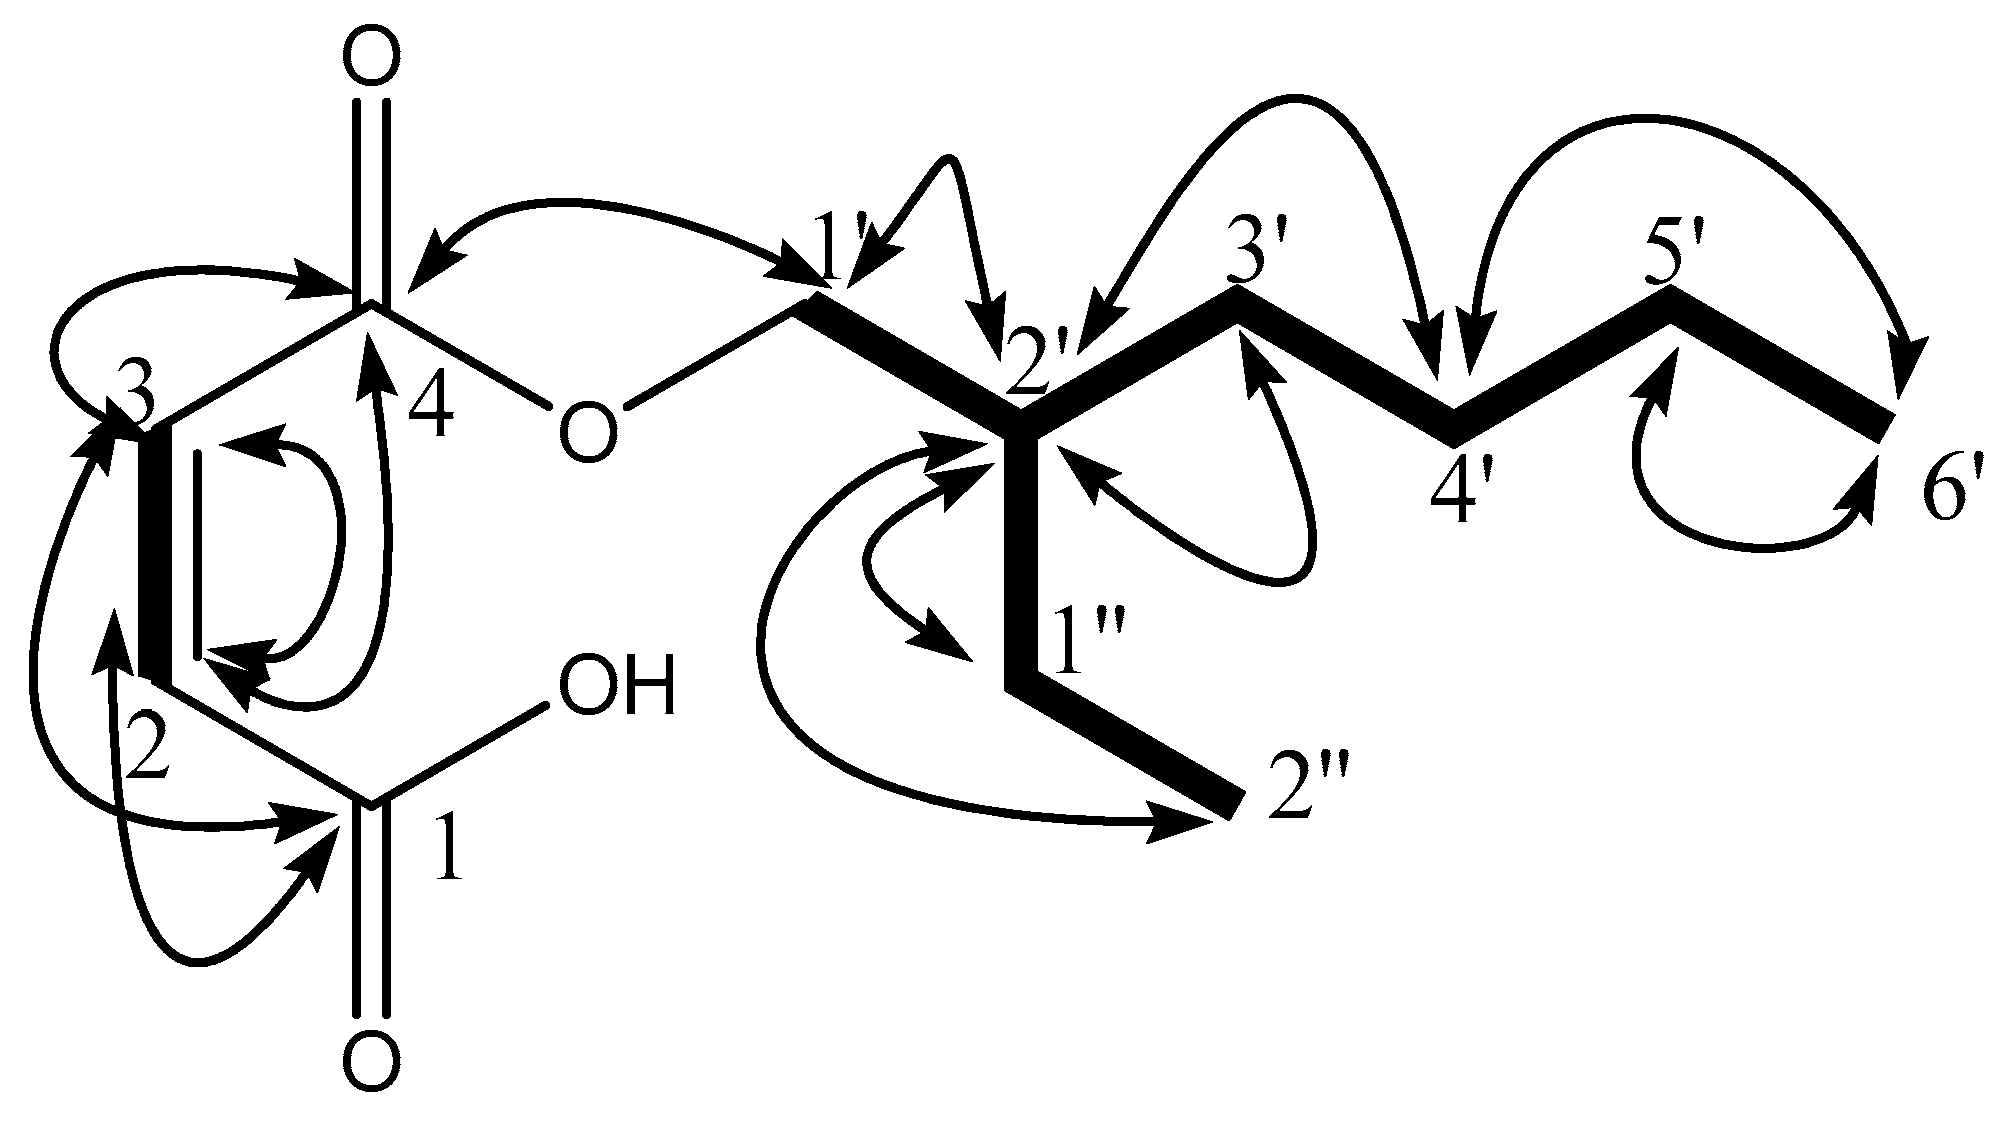
 ) and 1H-13C HMBC (
 ) correlations.
) and 1H-13C HMBC () correlations.
) correlations.
) and 1H-13C HMBC () correlations. ) and 1H-13C HMBC () correlations.
) and 1H-13C HMBC () correlations.
) and 1H-13C HMBC () correlations.


| Drug Target Proteins | F9 | CB18 | Experimental Evidence | ||
|---|---|---|---|---|---|
| Target Hit | Fit Score | Target Hit | Fit Score | ||
| EGFR | ✓ | 3.48 | ✓ | 4.96 | PubChem Bioassay |
| Estrogen receptor beta | n.a | n.a | ✓ | 3.996 | NPACT |
| Cytochrome P450 2C9 | ✓ | 4.22 | n.a | n.a | NPACT |
| Acetylcholinesterase (AChE) | ✓ | 4.52 | ✓ | 4.3 | PubChem Bioassay |
| TGF-beta receptor type-1 | ✓ | 3.75 | n.a | n.a | Drug Bank |
| phosphodiesterase-5 (PD-5) | ✓ | 4.72 | n.a | n.a | Drug Bank |
| Cell dependent kinase 2 | n.a | n.a | ✓ | 2.65 | PubChem Bioassay |
| Caspase 3 | ✓ | 4.67 | ✓ | 5.02 | NPACT |
| Deoxycytidine kinase | ✓ | 2.66 | n.a | n.a | Drug Bank |
| human carboxylesterase (hCE-1) | ✓ | 3.87 | n.a | n.a | PubChem Bioassay |
| Fibroblast growth factor receptor 1, FGFR1 | ✓ | 3.41 | ✓ | 4.96 | PubChem Bioassay |
| Caspase 7 | ✓ | 2.41 | n.a | n.a | PubChem Bioassay |
| STAT-3 | ✓ | 4.93 | ✓ | 5.39 | PubChem Bioassay |
| Cyclin dependent kinase 6 | ✓ | 3.81 | ✓ | 4.34 | Drug Bank |
| Cyclin A2 | n.a | n.a | ✓ | 3.95 | NPACT |
| p53 | ✓ | 4.19 | n.a | n.a | Drug Bank |
| glycogen synthase kinase-3β (GSK-3β) | ✓ | 4.17 | ✓ | 3.5 | Drug Bank |
| Apoptosis regulator Bcl-X | ✓ | 4.88 | n.a | n.a | PubChem Bioassay |
| nitric oxide synthase (NOS) | ✓ | 3.39 | ✓ | 3.1 | PubChem Bioassay |
| vascular endothelial growth factor, VEGF | ✓ | 3.44 | ✓ | 4.18 | PubChem Bioassay |
| MAP kinase 14 | ✓ | 3.63 | n.a | n.a | NPACT |
| Histone deacetylase 8 | ✓ | 4.26 | ✓ | 4.21 | PubChem Bioassay |
| Tumor necrosis factor-alpha | ✓ | 5.34 | ✓ | 4.97 | PubChem Bioassay |
| NF-κB | n.a | n.a | ✓ | 2.94 | PubChem Bioassay |
| Prothrombin | n.a | n.a | ✓ | 4.09 | Drug Bank |
| Ornithine aminotransferase, mitochondrial | ✓ | 3.78 | ✓ | 2.97 | PubChem Bioassay |
| Sepiapterin reductase | ✓ | 4.81 | n.a | n.a | NPACT |
| VEGFR2 | ✓ | 5.11 | ✓ | 4.62 | PubChem Bioassay |
| Cyclin dependent kinase 4 | n.a | n.a | ✓ | 2.54 | Drug Bank |
| cyclooxygenase-2, COX2 | ✓ | 4.14 | ✓ | 5.39 | Drug Bank |
| 3-phosphoinositide-dependent protein kinase 1 | n.a | n.a | ✓ | 4.41 | PubChem Bioassay |
| Beta-secretase 1 | ✓ | 3.18 | ✓ | 4.39 | Drug Bank |
| JNK1 | ✓ | 2.86 | ✓ | 3.47 | PubChem Bioassay |
| RAC-alpha serine/threonine-protein kinase | ✓ | 4.55 | n.a | n.a | PubChem Bioassay |
| Estradio 17-beta dehydrogenase-1 | ✓ | 3.97 | ✓ | 4.58 | PubChem Bioassay |
| Interleukin- 4 | ✓ | 2.67 | n.a | n.a | PubChem Bioassay |
| Compounds | E. coli | S. aureus | K. pneumoniae | S. flexneri | P. aeruginosa |
|---|---|---|---|---|---|
| F9 | 11.33 ± 0.66 | 14.00 ± 0.57 | - | - | - |
| CB18 | 14.33 ± 0.33 | 10.00 ± 0.00 | - | - | - |
| Ampicillin | 90.67 ± 0.66 | 95.00 ± 0.00 | 80.00 ± 0.00 | 90.66 ± 0.66 | 91.33 ± 0.88 |
| Ser. No. | Compounds | DPPH (IC50) mM |
|---|---|---|
| 1 | F9 | 02.17 ± 0.49 |
| 2 | CB18 | 02.93 ± 0.51 |
| 3 | Vitamin C | 0.029 ± 0.47 |
| Ser. No. | Compounds | Inhibition (%) at 0.5 mM AChE |
|---|---|---|
| 1 | F9 | N.D. |
| 2 | CB18 | 13.25 ± 0.14 |
| 3 | Eserine | 91.27 ± 1.17 |
| N.D. = not detected. | ||
| Ser. No. | Compounds | Inhibition (%) at 0.5 mM |
|---|---|---|
| 1 | F9 | 43.82 ± 0.17 |
| 2 | CB18 | 42.35 ± 0.19 |
| 3 | Acarbose | 92.23 ± 0.16 |
| Identified Targets | Bioactive Compounds | ΔEvdw | ΔEele | ΔEMM | ΔGp | ΔGnp | ΔGsol | ΔGtol |
|---|---|---|---|---|---|---|---|---|
| AChE | CB18 | −40.05 | −8.67 | −48.72 | 23.89 | −3.46 | 20.43 | −28.29 |
| F9 | −39.98 | −9.56 | −49.54 | 22.13 | −4.11 | 18.02 | −31.52 | |
| Gluco | CB18 | −45.64 | −10.21 | −55.85 | 23.68 | −7.69 | 15.99 | −39.86 |
| F9 | −43.54 | −11.33 | −54.87 | 26.39 | −6.44 | 19.95 | −34.92 | |
| DHPS (E. coli) | CB18 | −24.2 | −8.27 | −32.47 | 16.41 | −2.64 | 13.77 | −18.7 |
| F9 | −21 | −5.61 | −26.61 | 17.03 | −3.21 | 13.82 | −12.79 | |
| DHFR (S. aureus) | CB18 | −28.44 | −5.25 | −33.69 | 20.26 | −4.32 | 15.94 | −17.75 |
| F9 | −26.21 | −4.22 | −30.43 | 21.59 | −5.89 | 15.7 | −14.73 |
© 2019 by the authors. Licensee MDPI, Basel, Switzerland. This article is an open access article distributed under the terms and conditions of the Creative Commons Attribution (CC BY) license (http://creativecommons.org/licenses/by/4.0/).
Share and Cite
Saleem, F.; Mehmood, R.; Mehar, S.; Khan, M.T.J.; Khan, Z.-u.-D.; Ashraf, M.; Ali, M.S.; Abdullah, I.; Froeyen, M.; Mirza, M.U.; et al. Bioassay Directed Isolation, Biological Evaluation and in Silico Studies of New Isolates from Pteris cretica L. Antioxidants 2019, 8, 231. https://doi.org/10.3390/antiox8070231
Saleem F, Mehmood R, Mehar S, Khan MTJ, Khan Z-u-D, Ashraf M, Ali MS, Abdullah I, Froeyen M, Mirza MU, et al. Bioassay Directed Isolation, Biological Evaluation and in Silico Studies of New Isolates from Pteris cretica L. Antioxidants. 2019; 8(7):231. https://doi.org/10.3390/antiox8070231
Chicago/Turabian StyleSaleem, Farooq, Rashad Mehmood, Saima Mehar, Muhammad Tahir Javed Khan, Zaheer-ud-Din Khan, Muhammad Ashraf, Muhammad Sajjad Ali, Iskandar Abdullah, Matheus Froeyen, Muhammad Usman Mirza, and et al. 2019. "Bioassay Directed Isolation, Biological Evaluation and in Silico Studies of New Isolates from Pteris cretica L." Antioxidants 8, no. 7: 231. https://doi.org/10.3390/antiox8070231
APA StyleSaleem, F., Mehmood, R., Mehar, S., Khan, M. T. J., Khan, Z.-u.-D., Ashraf, M., Ali, M. S., Abdullah, I., Froeyen, M., Mirza, M. U., & Ahmad, S. (2019). Bioassay Directed Isolation, Biological Evaluation and in Silico Studies of New Isolates from Pteris cretica L. Antioxidants, 8(7), 231. https://doi.org/10.3390/antiox8070231