Article

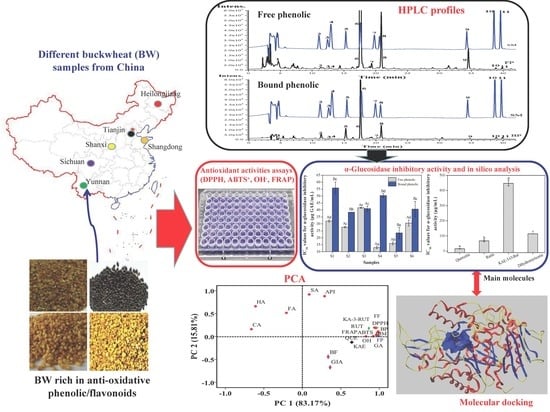
Free and Bound Phenolics of Buckwheat Varieties: HPLC Characterization, Antioxidant Activity, and Inhibitory Potency towards α-Glucosidase with Molecular Docking Analysis

College of Food Science and Engineering, Hainan University, Haikou 570228, China
*
Authors to whom correspondence should be addressed.
Antioxidants 2019, 8(12), 606; https://doi.org/10.3390/antiox8120606
Submission received: 25 October 2019 / Revised: 13 November 2019 / Accepted: 27 November 2019 / Published: 29 November 2019
(This article belongs to the Special Issue Phenolic Profiling and Antioxidant Capacity in Plants)

Abstract

:
Free and bound phenolic fractions from six buckwheat varieties were investigated for their compositions, antioxidant activities, and inhibitory effects on α-glucosidase. The results showed that different buckwheat varieties have significant differences in phenolic/flavonoid contents, and these contents were found in higher quantities in free form than in bound form. HPLC results revealed that rutin, quercetin, and kaempferol-3-O-rutinoside were the most abundant components in free and bound forms, whereas dihydromyricetin was found only in the bound form. Free phenolics showed higher antioxidant activities of DPPH, ABTS+, OH•, and FRAP than those of bound phenolics. Strong inhibitory effects against α-glucosidase by the free/bound phenolic fractions were found in all buckwheat varieties, and free phenolics showed stronger α-glucosidase inhibition than that of the corresponding bound phenolics. More importantly, the main phenolic compounds observed in the buckwheat varieties were subjected to molecular docking analysis to provide insight into their interactions with α-glucosidase. The contributions by individual phenolics to the observed variation was analysed by Pearson correlation coefficient analysis and principal component analysis. The present study provides a comprehensive comparison for the phenolic fractions of buckwheat varieties and identify the main contributors to antioxidant and α-glucosidase inhibitory activity.

Graphical Abstract

1. Introduction

Nowadays, the incidence of conditions related to metabolic syndrome is rapidly rising worldwide, including oxidative damage, high blood sugar, hypertension, hyperlipidaemic diseases, and so on [1,2]. Nutritionists have confirmed that oxidative stress and high-calorie diets were closely related to the occurrence of chronic metabolic syndrome [3]. Chemical drugs are somewhat effective in relieving these chronic diseases, but they can also cause drug dependence and serious side effects [4]. Phytochemicals, including phenolics/flavonoids, which are found in cereal foods or natural products, have been demonstrated to have important physiological functions, such as weight loss and antioxidant, anti-diabetic, anti-inflammatory, anti-glycosylation, and anti-proliferative effects [5,6,7,8].
Buckwheat (Fagopyrum esculentum Moench), as an important functional cereal food of the Polygonum family, is widely distributed in Asia, Europe, Africa, North America, and Oceania [9]. Generally, buckwheat includes two species: common buckwheat (Fagopyrum esculentum Moench) and tartary buckwheat (Fagopyrum tataricum Gaertn) [10]. Buckwheat has received much attention not only because of its delicious flavor and nutritional quality in terms of macro-nutrients, but also as a cereal raw material rich in flavonoid compounds, which may reduce chronic conditions including oxidative damage, diabetes, and hypertensive diseases [11,12,13]. Researchers have reported that flavonoid contents in buckwheat were 23–45 and 25–50 times greater than those in wheat and corn, respectively [14,15]. Moreover, the phytochemical composition of cereal crops mainly depends quantitatively and qualitatively on their genotypes and environmental factors that affect growth [16,17]. Although many studies have measured the total phenolic contents and antioxidant capacity in some buckwheat varieties [12,18], information remains limited regarding the characterization and contents of free phenolic (FP) and bound phenolic (BP) fractions of different buckwheat varieties and their corresponding in vitro biological activities (especially anti-diabetic effects). Furthermore, the contributions of the total phenolic contents (TPC), total flavonoid contents (TFC), and the content of individual phenolic on their bio-activities has not been clearly investigated.
The aim of the present work was to systematically investigate the HPLC characterizations, in vitro antioxidant activities, and inhibitory effects against α-glucosidase of FP and BP fractions from six buckwheat varieties. More importantly, the potential inhibitory mechanism against α-glucosidase by the main phenolic compounds in six buckwheat samples was clarified by molecular docking analysis. In addition, the contributions of the individual phenolics to the observed variation were analyzed by Pearson correlation coefficient analysis and principal component analysis. This work may provide a comprehensive comparison for the phenolic fractions of buckwheat varieties and identify the main contributors to antioxidant and α-glucosidase inhibitory activity.

2. Materials and Methods

2.1. Materials and Reagents

Six fresh buckwheat samples, named S1–S6, were collected from China in August 2018. All samples have not been broken, damaged, or spoiled. The buckwheat varieties were identified by professional researches. All phenolic standards (HPLC-grade, >99.7%) were obtained from Nanjing Herbal Origin Biotechnology Co., Ltd. (Nanjing, Jiangsu, China). ABTS (2-azino-bis [3-ethylbenzothiazoline-6-sulfonic acid] diammonium salt), DPPH (1,1-diphenyl-2-picrylhydrazyl), TPTZ (2,4,6-tris(2-pyridyl]-s-triazine), and Trolox were purchased from Sigma-Aldrich Chemical Co., Ltd. (St. Louis, MO, USA). Formic acid and acetonitrile were purchased from Fisher Scientific (Waltham, MA, USA); all were HPLC-grade. Other analytical-grade reagents used in the study were purchased from Guangzhou Damou Chemical Reagent Co., Ltd. (Guangzhou, China).

2.2. Extraction of FP and BP Fractions

Different buckwheat samples were first freeze-dried with vacuum freeze dryer FD-2B-80 (Shanghai Gipp Electronic Technology Co., Ltd., Shanghai, China). Then, the dried samples were ground to a fine powder by a micronizer and sifted through a 20-mesh sieve. FP and BP fractions were extracted following the reported method [19]. In brief, 2 g of the above powder samples were blended with 8 mL of 80% ethanol in a 15 mL tube. The mixture was kept in a water bath at 50 °C for 30 min and then centrifuged at 4000× g for 10 min at 4 °C. The procedure was repeated twice, and then the filtrate was combined. After FP extraction, the residues were used to extract BP. One gram of the above dried residues was hydrolyzed by adding 40 mL of 2 M NaOH at 30 °C for 4 h under a nitrogen atmosphere. Then, the resultant hydrolysate was acidified to pH 2 with 6 M hydrochloric acid. The mixture was first degreased three times with 100 mL hexane. The supernatants were combined, extracted three times with the solvents (diethyl ether:ethyl acetate = 1:1, v/v), and then evaporated under reduced pressure at 30 °C. After removing the diethyl ether and ethyl acetate, the samples were dissolved in 5 mL of 50% ethanol (v/v) to obtain BP fractions, which were stored at −20 °C before analysis.

2.3. Determination of Phenolic and Flavonoid Contents

The Folin–Ciocalteau method was applied to determine phenolic content of different fractions [20]. Gallic acid was employed as standard. The average value of triplicate data was expressed as mg of gallic acid equivalents per gram sample in dry weight (mg GAE/g DW).
Flavonoid content in both free and bound phenolic fractions were quantified according to the aluminum chloride colorimetric method [21]. Rutin was employed as the standard. The average value of triplicate data was expressed as mg rutin equivalents per gram sample in dry weight (mg RE/g DW).

2.4. Quantitative Analysis by HPLC

A Hitachi 1200 HPLC system (SHIMADZU, Kyoto, Japan) was used to separate and quantify the phenolic compounds in free and bound phenolic fractions from BW samples. The HPLC system was equipped with a diode array detector (SPD-10A, SHIMADZU). Chromatographic separation was achieved in a Zorbax Eclipse Plus C18 column (250 mm × 4.6 mm, 5 μm, Agilent, Santa Clara, CA, USA). The mobile phase used was 0.1% formic acid-H2O (phase A) and 0.1% formic acid-acetonitrile (phase B) with the gradient program as follows: 15% B at 0–5 min, 15–20% B at 5–10 min, 20–50% B at 10–40 min, 50–80% B at 40–55 min, and 15% B at 55–60 min. The flow-rate was kept at 0.8 mL/min at all times. The other chromatographic conditions used were as follows: the column was operated at 30 °C, the scanning detection wavelength ranged from 200 to 600 nm, and the injection volume was 10.0 μL. All samples were analyzed in triplicate, and the amount of phenolic compound was expressed as micrograms per gram sample in dried weight (μg/g DW).

2.5. Antioxidant Activity Assays

2.5.1. DPPH Radical Scavenging Activity Assay

The scavenging activity of DPPH free radicals was performed according to the reported method [22]. Briefly, 50 µL of the diluted sample extracts was mixed with 400 µL of 100 µM DPPH-methanol solution for 30 min at 25 °C. The absorbance was measured at 517 nm. Trolox solution (0–40 μg/mL) was used as the positive control. The results were expressed as µmol Trolox equivalents (TE)/g sample in DW (µmol TE/g DW).

2.5.2. ABTS+ Radical Scavenging Activity Assay

The scavenging activity of ABTS+ radical was measured according to the previously described method [23]. Trolox solution (0–40 μg/mL) was used as the positive control. The ABTS+ value was expressed as µmol Trolox equivalents (TE)/g sample in DW (µmol TE/g DW).

2.5.3. Hydroxyl (OH•) Radical Scavenging Activity Assay

The scavenging activity of OH• radical was measured using the reported method [24]. Briefly, 100 µL of the extract dilutions was mixed with 100 µL of 6 mM FeSO4 solution and 100 µL of 2.4 mM H2O2 solution. After incubating for 10 min at 25 °C, 100 µL of 6 mM salicylic acid was added to the reaction solution. The mixture was further incubated for 30 min at 25 °C; then, the absorbance was read at 510 nm. Trolox solution (0–40 μg/mL) was used as the positive control. The OH• value was expressed as µmol TE/g DW.

2.5.4. Ferric Reducing Antioxidant Power (FRAP) Assay

FRAP assay was performed on the basis of the described method [25]. Ferrous sulfate solution (0, 50, 200, 400, 600, 800, and 1000 M) was used to establish the standard curve. The FRAP values were expressed in µM ferrous sulfate equivalents per gram sample in dried weight (µM Fe(II)SE/g DW).

2.6. Determination of α-Glucosidase Inhibitory Activity

The α-glucosidase inhibitory activity of FP and BP fractions in different samples was measured according to the previously described method [26]. Firstly, 100 µL of 1 U/mL α-glucosidase in phosphate buffer solution (PBS, 0.1 M, pH 6.8) was mixed with 50 µL of the test extracts dilutions in a 2 mL tube. After incubation at 37 °C for 10 min, the reaction was begun by adding 100 µL of 5 mM p-NPG solution, and incubated for 20 min at 37 °C. The absorbance of the reaction solution was read at 405 nm in 15 min. The inhibiting activity of α-glucosidase (%) was calculated on the basic of the following equation:
α -Glucosidase inhibition activity  ( % )   =   [ Δ A cont Δ A s Δ A cont ]   ×   100 %
where ΔAcont = Abuffer+enzyme − Abuffer, and ΔAs = Aextract+enzyme − Aextract.

2.7. Molecular Docking Analysis

The ChemBio3D Ultra (CambridgeSoft Corporation, Massachusetts, United States) was used to draw the 2D structures of the main phenolic compounds in BW samples. It is worth noting that little information was available regarding the structure of α-glucosidase from Saccharomyces cerevisiae. Hence, its homologous structure (isomaltase, PDB ID: 3A4A) obtained from RCSB PDB was usually applied to conduct the docking test [27,28]. The Surflex-Dock Geom (SFXC) mode was used to perform docking analysis using SYBYL-X 2.0 software (Tripos, Inc., St. Louis, MO, USA). A docking score file was generated, and a C-score ≥ 4 was considered as a credible result. Several parameters including four score functions (T-score, PMF-score, D-score, and CHEM-score), hydrogen bond distances, and amino acid binding sites were used to explain the active inhibitory mechanisms of the main phenolics against α-glucosidase [29].

2.8. Statistical Analysis

All assays were conducted in triplicate. All values were expressed as the average value ± standard deviation (SD). SPSS Statistics version 17.0 (IBM SPSS, Chicago, IL, USA) was used to perform the statistical analyses. IC50 value was measured by Probit analysis on SPSS Statistics version 17.0. Significant differences (p < 0.05) were considered statistically significant. Correlation analysis between the analytes and the investigated bio-activities were evaluated using Pearson correlation.

3. Results and Discussion

3.1. Total Phenolic Contents (TPC) and Total Flavonoid Contents (TFC)

As shown in Table 1, significant differences were observed with respect to TPC and TFC in different buckwheat samples. The contents of free phenolic (FP) and free flavonoid (FF) in six buckwheat samples ranged between 5.18–13.74 mg GAE/g DW and 7.37–26.60 mg RE/g DW, respectively, while bound phenolic (BP) and bound flavonoid (BF) contents ranged between 0.63 and 0.96 mg GAE/g DW and 0.72 and 1.38 mg RE/g DW, respectively. It was found that FP and FF were the main contributors to TPC/TFC, accounting for over 90% of contents. Moreover, the FP/FF contents and TPC/TFC of the buckwheat sample from Shanxi were significantly higher (p < 0.05) than those of the samples from other genotypes and regions in China (Table 1).
Qin et al. (2010) reported that the FP contents (25.3 mg GAE/g DW) were higher than the BP contents (1.8 mg GAE/g DW) in tartary buckwheat bran [15]. Liu et al. (2019) confirmed that the highest phenolic content of 15 buckwheat varieties from China was only 7.32 mg GAE/g DW, which was lower than that of samples from Shanxi (13.74 mg GAE/g DW) [30]. In this work, we found that the average TPC and TFC of tartary buckwheat samples (TPC: 9.97 mg GAE/g DW; TFC: 19.26 mg RE/g DW) were significantly higher than those of the common buckwheat samples (TPC: 6.47 mg GAE/g DW; TFC: 10.87 mg RE/g DW) (p < 0.001). Owing to the genotypes and growth-influencing environmental factors of buckwheat varieties, significant differences were seen in TPC/TFC. Many studies have confirmed that phytochemical compositions of cereal crops mainly depend qualitatively and quantitatively on its genotypes and environmental factors that influence growth [30,31].

3.2. Quantitative HPLC Analysis of Phenolic Compositions

Phenolic compositions were preliminary identified by comparing retention time (RT), UV spectra, and the MS spectral data of standards (Table S1). The phenolic compositions of FP and BP fractions from six buckwheat samples were quantified by HPLC (Figure 1). As shown in Figure 1 and Table 2, it can be seen that phenolic compounds in buckwheat samples were divided into two categories: flavonoids and phenolic acid groups. The six flavonoid compounds included rutin, dihydromyricetin, kaempferol-3-O-rutinoside, quercetin, apigenin, and kaempferol. Five of these compounds existed in free and bound forms, except dihydromyricetin, which was only detected in BP fractions. Five phenolic acids including gallic acid, 4-hydroxybenzoic acid, 5-caffeoylquinic acid, syringic acid, and ferulic acid were detected in the free and bound fractions. Among them, rutin, kaempferol-3-O-rutinoside, and quercetin were the most predominant compounds that existed in both forms.
Regarding FP, the Shanxi sample included significantly higher (p < 0.05) rutin (6288.26 µg/g), kaempferol-3-O-rutinoside (3618.65 µg/g), and quercetin (1379.54 µg/g) than the other samples, which resulted in higher FPC and TPC (p < 0.05).
Significantly higher quantities of rutin, kaempferol-3-O-rutinoside, ferulic acid, quercetin, apigenin, and kaempferol were found in free form than those in bound form, which was consistent with the report described by Li et al. (2016) [10]. However, some phenolic acid compounds including gallic acid, 4-hydroxybenzoic acid, 5-caffeoylquinic acid, and syringic acid were significantly more common in bound form. Samples from Shangdong and Heilongjiang contained high bound gallic acid and syringic acid. Many studies have confirmed that rutin, quercetin, and isoquercitin were the most predominant compounds in buckwheat [32]. In the present work, in addition to quercetin and rutin, high kaempferol-3-O-rutinoside contents were also found in all buckwheat samples, which may be due to differences in genotypes and growth-influencing environmental factors [31].

3.3. Antioxidant Activities

Albishi et al. (2013) suggested that at least two test methods should be used to evaluate the in vitro antioxidant activity of samples, owing to different mechanisms involved in determining antioxidant capacity [33]. In this study, four independent methods including FRAP and the radical scavenging activities of DPPH, ABTS+, and OH• were used to comprehensively evaluate the antioxidant capacity of the FP and BP fractions from different buckwheat varieties.
The results showed that the antioxidant capacities of FP fractions of six buckwheat varieties varied significantly (p < 0.05). Meanwhile, DPPH levels of FP and BP fractions in different buckwheat samples ranged between 17.55–114.02 µmol TE/g DW and 4.30–7.68 µmol TE/g DW, respectively. For ABTS+ assays, FP and BP fractions yielded ABTS+ values of 69.19–175.66 µmol TE/g DW and 7.12–10.62 µmol TE/g DW, respectively. However, OH• levels of FP fractions in different buckwheat samples ranged between 32.92–82.64 µmol TE/g DW. The OH• values of BP fractions showed no significant differences (p > 0.05) among the different buckwheat samples. FRAP values of FP fractions in different buckwheat samples ranged between 29.58 and 84.72 mM FeS(II)E/g DW (Table 3). The highest antioxidant capacity of FP fractions was detected in the buckwheat sample from Shanxi (DPPH: 114.02 µmol TE/g DW; ABTS+: 175.66 µmol TE/g DW; OH•: 82.64 µmol TE/g DW; FRAP: 84.72 mM FeS(II)E/g DW), which was due to its high TPC/TFC and individual phenolic contents. Moreover, the antioxidant activities of FP fractions from different buckwheat samples were significantly higher than those of the BP fractions. More importantly, it was found that the average antioxidant activities (DPPH: 71.54 µmol TE/g DW; ABTS+: 138.48 µmol TE/g DW; OH•: 73.39 µmol TE/g DW; FRAP: 58.41 mM FeS(II)E/g DW) in tartary buckwheat samples were higher than those in common buckwheat samples (DPPH: 33.79 µmol TE/g DW; ABTS+: 89.05 µmol TE/g DW; OH•: 55.65 µmol TE/g DW; FRAP: 37.03 mM FeS(II)E/g DW). The results showed that FP contributes to the main antioxidant activities in buckwheat samples. Li et al. (2016) also confirmed that the FP fractions of buckwheat bran samples contributed to the main antioxidant activities [10]. In addition, higher phenolic contents resulted in stronger antioxidant activities. Xiang et al. (2019) reported that the phenolic contents of finger millets have a strong positive correlation with the oxygen radical absorbance capacity and ABTS+ radical scavenging activities (r = 0.948, r = 0.836, respectively; p < 0.01) [34].

3.4. Inhibitory Activity against α-Glucosidase

Some chemical drugs are widely applied to manage type II diabetes, but some side effects have been reported in their application [35]. Consequently, there is an urgent need to identify natural alternative products without side effects to manage type II diabetes. Many studies have confirmed that α-glucosidase inhibitors from cereal products, which had fewer side effects, played important roles in regulating blood glucose levels [36,37].
Figure 2A demonstrates that FP and BP fractions in different buckwheat samples tended to be strong α-glucosidase inhibitors. Moreover, these fractions all showed inhibitory activity against α-glucosidase in a concentration-dependent manner. It is worth noting that higher IC50 values indicated lower α-glucosidase inhibition. Furthermore, the highest α-glucosidase inhibition in FP fractions was found in Shanxi (IC50 = 13.00 ± 0.75 μg GAE/mL) and Shangdong (IC50 = 15.94 ± 0.98 μg GAE/mL) samples. The BP fractions of the Shangdong sample also showed strong α-glucosidase inhibition (IC50 = 23.51 ± 4.01 μg GAE/mL). Figure 2B displays the IC50 values for α-glucosidase inhibition by the main phenolic compounds from the buckwheat samples. It can be seen that the IC50 of quercetin was 15.71 ± 1.43 μg/mL, which was higher than those of rutin (68.16 ± 3.61 μg/mL), kaempferol-3-O-rutinoside (447.50 ± 17.27 μg/mL), and dihydromyricetin (114.45 ± 0.31 μg/mL) (p < 0.01). Many studies have stated that the inhibitory activities against digestive enzymes by cereal foods are due to phenolic/flavonoid compounds [38,39]. Wang et al. (2018) confirmed that flavonoid compounds, especially quercetin, possessed strong capacities for α-glucosidase inhibition [26]; Qin et al. (2013) also reported such a strong capacity by rutin in tartary buckwheat [40]. For buckwheat samples, higher flavonoid contents (rutin and quercetin) resulted in a stronger α-glucosidase inhibitory capacity.

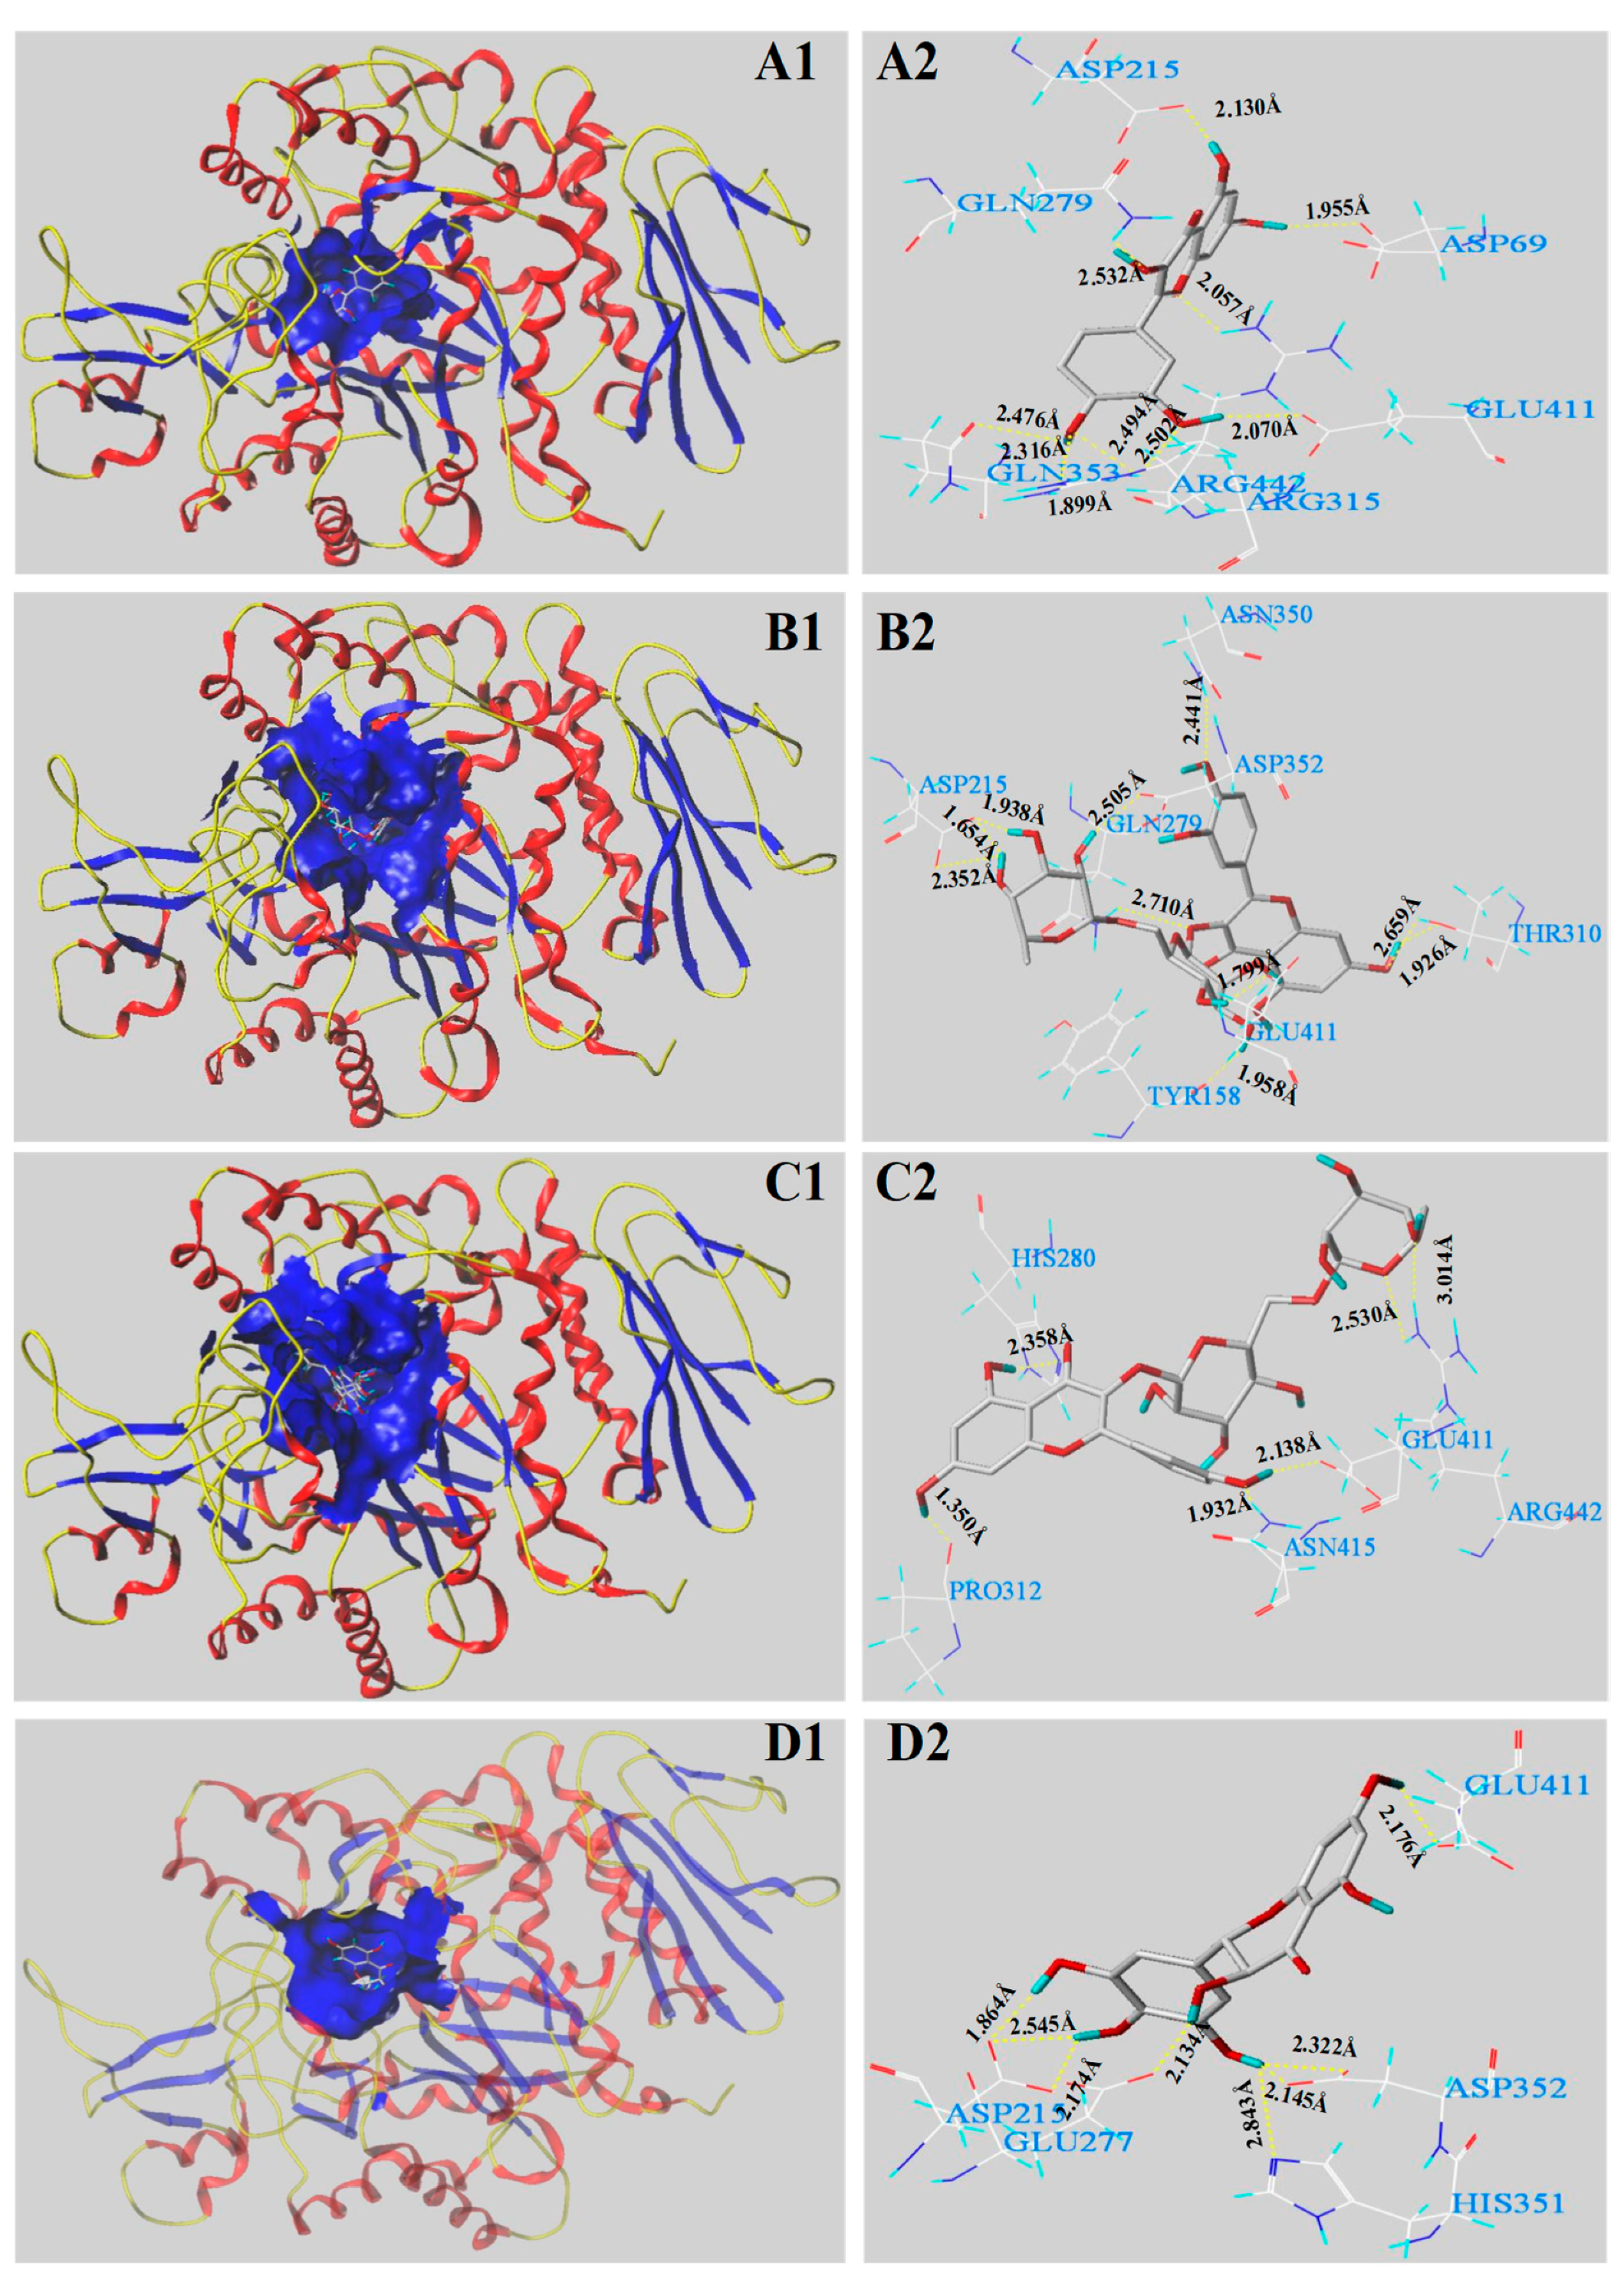
3.5. Molecular Docking Analysis

In the present work, the inhibitory mechanisms of the main four phenolic constituents in BW samples including quercetin, rutin, kaempferol-3-O-rutinoside, and dihydromyricetin against α-glucosidase were further illuminated by molecular docking analysis. Figure 3 and Table 4 show the docking results regarding interactions between the main phenolic molecules and α-glucosidase binding. As shown in Table 4, all four main phenolic molecules had C-scores ≥ 4, indicating reliable docking values. The T-score function, an important docking parameter, is a weighted sum of non-linear functions involving van der Waals surface distances between the ligand atoms and exposed receptor enzymes [27,29]. Quercetin, with a docking T-score of 6.37, exhibited strong hydrogen bonding interactions with α-glucosidase and formed ten H-bonds with the seven catalytic residues of Asp 69, Asp 215, Arg 315, Arg 442, Gln 353, Glu 411, and Gln 279 of the α-glucosidase receptor (Figure 3A1,A2 and Table 4). The H-bond distances ranged from 1.899 to 2.532 Å. Rutin, with a docking T-score of 5.94, formed ten H-bonds within 4 Å (distances of 1.654–2.710 Å) with seven amino acid catalytic residues (Asp 215, Asp 352, Asn 350, Tyr 158, Tyr 310, Glu 411, and Gln 279) of α-glucosidase (Figure 3B1,B2 and Table 4). Six H-bonds with five amino acid residues (Pro 312, Asn 415, Arg 442, Glu 411, and His 280) were observed for kaempferol-3-O-rutinoside, with a docking score of 4.68 (Figure 3C1,C2 and Table 4). The average H-bond distance was 2.220 Å. The docking score of dihydromyricetin was 5.32, indicating eight H-bond interactions with five active site residues (Asp 215, Asp 352, Glu 277, Glu 411, and His 351). The distances ranged from 1.864 to 2.843 Å (Figure 3D1,D2 and Table 4).
The results clearly showed that the phenolic compound structures influenced the inhibitory effects on α-glucosidase. Among them, the numbers of H-bonds and active sites residues played important roles in exerting the catalytic functions of the complex of the α-glucosidase receptor and ligands. When the main four phenolics were docked with α-glucosidase, the numbers of formed active site residues were ordered as follows: quercetin (7) = rutin (7) > dihydromyricetin (5) = kaempferol-3-O-rutinoside (5); those of the formed H-bonds were as follows: quercetin (10) = rutin (10) > dihydromyricetin (8) > kaempferol-3-O-rutinoside (6). As a result, quercetin showed the strongest α-glucosidase inhibition (Figure 2B). Although quercetin and rutin docked with α-glucosidase exhibited equal numbers of H-bonds and active site residues, there were significant differences in the capacity for α-glucosidase inhibition. This may be because these different molecules had different residue interaction sites with α-glucosidase. Both quercetin and rutin interacted with the amino acid residues Glu 411 and Gln 279, indicating that these two residues may be the important catalytic sites of α-glucosidase. However, kaempferol-3-O-rutinoside formed an H-bond with Asp 415, indicating that it may bind to the active site of α-glucosidase to inhibit its catalytic activity. Consequently, kaempferol-3-O-rutinoside exhibited the weakest inhibitory effect against α-glucosidase. It was found that Glu 411 bound with each of the four phenolics, implying that it may exert important functions in the catalytic reaction of α-glucosidase. Many studies also verified that Asp 215 and Glu 411 were the important active sites involved in this catalytic reaction [28,34]. In addition, the formation of hydrogen bonds between the hydroxyl group at C-3 or C-4′ of the molecules (i.e., quercetin and rutin) and the active site residues may produce a higher inhibitory ability towards α-glucosidase compared to kaempferol-3-O-rutinoside, which was consistent with the results reported by Zeng et al. (2016) [41]. Rasouli et al. (2017) also reported that the hydrogen bonds and active site residues formed by the ligand molecules and receptor enzymes exerted important effects on α-glucosidase inhibitory activities [42].

3.6. Correlations between the Investigated Bio-Activities and Phenolic Compositions

To explore the effect of the phenolic compounds on the investigated bio-activities in different buckwheat varieties, correlations among the examined variables were elucidated by Pearson correlation coefficient analysis [43].
As shown in Table 5, correlation coefficients were determined for FP vs. DPPH (r = 0.990, p < 0.001), ABTS+ (r = 0.983, p < 0.01), OH• (r = 0.851, p < 0.05), FRAP (r = 0.998, p < 0.001), and α-glucosidase inhibitory activity (r = 0.671, p < 0.05). BP fractions of buckwheat were also significantly correlated to DPPH (r = 0.583, p < 0.05), ABTS+ (r = 0.932, p < 0.01), OH (r = 0.803, p < 0.05), FRAP (r = 0.947, p < 0.01), and α-glucosidase inhibitory activity (r = 0.604, p < 0.05). The antioxidant activities were also significantly positive correlated to FF and BF contents (p < 0.05). Meanwhile, the antioxidant activities including DPPH, ABTS+, OH•, and FRAP values were significantly positively correlated to gallic acid, rutin, dihydromyricetin, quercetin, and kaempferol-3-O-rutinoside contents (p < 0.05). A positive correlation was detected between FP contents and α-glucosidase inhibitory activity (r = 0.671, r = 0.723, p < 0.05). Inhibitory activity against α-glucosidase was also significantly correlated to dihydromyricetin, rutin, kaempferol-3-O-rutinoside, quercetin, and kaempferol contents (r = 0.765, 0.803, 0.551, 0.715, and 0.618, respectively; p < 0.05). Among them, three phenolic compounds including rutin, kaempferol-3-O-rutinoside, and quercetin contributed mainly to the investigated bio-activities of different buckwheat varieties, whereas rutin, kaempferol-3-O-rutinoside, and dihydromyricetin contributed to the bio-activities of BP fractions among the varieties. It is worth noting that the correlation analysis results will give more reliable results if a greater number of samples were obtained.

3.7. Principal Component Analysis (PCA)

PCA is widely used to reduce the dimensionality and increase the interpretability of large datasets. To systematically and fully investigate the contributions of the individual phenolics to the variables investigated, PCA was carried out using FP, BP, FF, BF, the individual phenolic contents, antioxidant activities (DPPH, ABTS+, OH•, and FRAP values), and α-glucosidase inhibitory activity (IC50) for different buckwheat samples.
PCA yielded two principal components (with an eigenvalue higher than 1) explaining 98.98% of the total variances in the data to simplify the analysis of the results. The loading plot illustrates the relationship between the investigated variables (Figure 4). The two principal components PC1 and PC2 accounted for 83.17% and 15.81% of the total variation, respectively. Among them, PC1 separated the samples based on FP, BP, FF, DPPH, ABTS+, OH•, FRAP values, rutin, kaempferol-3-O-rutinoside, dihydromyricetin, and quercetin, which are present in the upper right square. The variables were separated along PC2 by differences observed in 4-hydroxybenzoic acid, ferulic acid, and 5-caffeoylquinic acid, which are present in the upper left square. The results demonstrated that FP, BP, FF, rutin, kaempferol-3-O-rutinoside, dihydromyricetin, and quercetin were closely correlated with DPPH, ABTS+, OH•, and FRAP values, which was consistent with the results of Pearson correlation coefficient analysis. Therefore, the scatter plot produced by PCA may be used to reduce the dimensionality and interpret the differences among the variables in large datasets.

4. Conclusions

In this study, the characterizations and contents of FP and BP fractions in different buckwheat varieties and their corresponding in vitro biological activities (especially antioxidant and anti-diabetic) were first reported. The results showed that the TPC and TFC of tartary buckwheat were significant higher than those of common buckwheat. Moreover, for all tartary buckwheat varieties, phenolic/flavonoid contents in free form were found in greater quantities than those in bound form. HPLC results revealed that rutin, quercetin, and kaempferol-3-O-rutinoside were the most abundant components found in free and bound forms, whereas dihydromyricetin was only found in BP. FP showed higher antioxidant activities of DPPH, ABTS+, OH•, and FRAP than those of BP. Among them, FP in buckwheat samples from Shanxi exhibited the highest antioxidant activity and inhibitory activity towards α-glucosidase. In addition, the strong inhibitory effects against α-glucosidase by FP and BP fractions in buckwheat varieties were illuminated by molecular docking analysis. The contributions of the individual phenolics to the investigated bio-activities were analyzed by Pearson correlation coefficient analysis and PCA. The present study demonstrated that phenolic fractions (especially free forms) of different buckwheat samples had strong antioxidant activities and inhibitory effects on α-glucosidase and provided evidence for the qualitative evaluation of buckwheat varieties.

Supplementary Materials

The following are available online at https://www.mdpi.com/2076-3921/8/12/606/s1, Table S1: Identification of free and bound phenolic compounds from buckwheat samples by HPLC-DAD-ESI-qTOF/MS. FP, free phenolic; BP, bound phenolic.

Author Contributions

H.Z. and L.Y. prepared the experimental design and conducted the analytical experiments. L.W. supervised and wrote the manuscript. S.L. helped with valuable comments on the manuscript. C.L. performed data analyses and helped with comments on the manuscript.

Funding

This work was supported by the Scientific Research Foundation of Hainan University (no. KYQD1901) and the Funding for the Construction of World First Class Discipline of Hainan University (no. RZZX201915).

Conflicts of Interest

The authors declared no conflict of interest.

Abbreviations

BWbuckwheat
DWdried weight
TPCtotal phenolic content
TFCtotal flavonoid content
FPfree phenolic
BPbound phenolic
FFfree flavonoid
BFbound flavonoid
GAEgallic acid equivalents
RErutin equivalents
TEtrolox equivalents
DPPH1,1-diphenyl-2-picrylhydrazyl
ABTS2, 2-azino-bis (3-ethylbenzothiazoline-6-sulfonic acid) diammonium salt
FRAPferric reducing/antioxidant power
TPTZ2,4,6-tris(2-pyridyl)-s-triazine

References

  1. Rosety, I.; Elosegui, S.; Pery, M.T.; Fornieles, G.; Rosety, J.M.; Díaz, A.J.; Rodríguezpareja, A.; Brenes, F.; Rosetyrodríguez, M.; Ordonez, F.J. Association between abdominal obesity and seminal oxidative damage in adults with metabolic syndrome. Rev. Med. Chile 2014, 142, 732–737. [Google Scholar] [CrossRef] [PubMed]
  2. Kornicka, K.; Houston, J.; Marycz, K. Dysfunction of mesenchymal stem cells isolated from metabolic syndrome and Type 2 diabetic patients as result of oxidative stress and autophagy may limit their potential therapeutic use. Stem. Cell. Rev. Rep. 2018, 14, 337–345. [Google Scholar] [CrossRef] [PubMed]
  3. Ito, J.; Nakagawa, K.; Kato, S.; Miyazawa, T.; Kimura, F.; Miyazawa, T. The combination of maternal and offspring high-fat diets causes marked oxidative stress and development of metabolic syndrome in mouse offspring. Life Sci. 2016, 151, 70–75. [Google Scholar] [CrossRef] [PubMed]
  4. Nanjan, M.J.; Mohammed, M.; Kumar, B.R.P.; Chandrasekar, M.J.N. Thiazolidinediones as antidiabetic agents: A critical review. Bioorg. Chem. 2018, 77, 548–567. [Google Scholar] [CrossRef] [PubMed]
  5. Ghasemzadeh, A.; Jaafar, H.Z.; Rahmat, A. Antioxidant activities, total phenolics and flavonoids content in two varieties of Malaysia young ginger (Zingiber officinale Roscoe). Molecules 2010, 15, 4324–4333. [Google Scholar] [CrossRef] [PubMed]
  6. Alu’Datt, M.H.; Ereifej, K.; Abu-Zaiton, A.; Alrababah, M.; Almajwal, A.; Rababah, T.; Yang, W. Anti-oxidant, anti-diabetic, and anti-hypertensive effects of extracted phenolics and hydrolyzed peptides from barley protein fractions. Int. J. Food Prop. 2012, 15, 781–795. [Google Scholar] [CrossRef]
  7. Nam, T.G.; Lim, T.G.; Lee, B.H.; Lim, S.; Kang, H.; Eom, S.H.; Yoo, M.; Jang, H.W.; Kim, D.O. Comparison of anti-Inflammatory effects of flavonoid-Rich common and tartary buckwheat sprout extracts in lipopolysaccharide-stimulated RAW 264.7 and peritoneal macrophages. Oxid. Med. Cell. Longev. 2017, 2017, 9658030. [Google Scholar] [CrossRef]
  8. Li, Y.Q.; Zhou, F.C.; Gao, F.; Bian, J.S.; Shan, F. Comparative evaluation of quercetin, isoquercetin and rutin as inhibitors of α-glucosidase. J. Agric. Food Chem. 2009, 57, 11463–11468. [Google Scholar] [CrossRef]
  9. Sedej, I.; Sakač, M.; Mandić, A.; Mišan, A.; Tumbas, V.; Čanadanović-Brunet, J. Buckwheat (Fagopyrum esculentum Moench) grain and fractions: Antioxidant compounds and activities. J. Food Sci. 2012, 77, 954–959. [Google Scholar] [CrossRef]
  10. Li, F.; Zhang, X.; Zheng, S.; Lu, K.; Zhao, G.; Jian, M. The composition, antioxidant and anti-proliferative capacities of phenolic compounds extracted from tartary buckwheat bran (Fagopyrum tartaricum (L.) Gaerth). J. Funct. Foods 2016, 22, 145–155. [Google Scholar] [CrossRef]
  11. Chandramohan, G.; Alnumair, K.S.; Veeramani, C.; Alsaif, M.A.; Almajwal, A.M. Protective effect of kaempferol, a flavonoid compound, on oxidative mitochondrial damage in streptozotocin-induced diabetic rats. Progr. Nutr. 2015, 17, 3. [Google Scholar]
  12. Lee, K.H.; Choib, E.M. Myricetin, a naturally occurring flavonoid, prevents 2-deoxy-ribose induced dysfunction and oxidative damage in osteoblastic MC3T3-E1 cells. Eur. J. Pharmacol. 2008, 591, 1–6. [Google Scholar] [CrossRef] [PubMed]
  13. Li, S.Q.; Zhang, Q.H. Advances in the development of functional foods from buckwheat. Crit. Rev. Food Technol. 2001, 41, 451–464. [Google Scholar] [CrossRef] [PubMed]
  14. Uddin, M.R.; Li, X.H.; Yeonbok, K.; Soocheon, C.; Sunju, K.; Sangun, P. Phenolic compoundsin different organs of tartary buckwheat (Fagopyrum tataricum Gaertn.) cultivars. Aust. J. Crop. Sci. 2013, 7, 1861–1865. [Google Scholar]
  15. Qin, P.Y.; Wang, Q.A.; Shan, F.; Hou, Z.H.; Ren, G.X. Nutritional composition and flavonoids content of flour from different buckwheat cultivars. Int. J. Food Sci. Technol. 2010, 45, 951–958. [Google Scholar] [CrossRef]
  16. Lu, Y.; Lv, J.; Hao, J.; Niu, Y.; Whent, M.; Costa, J.; Yu, L. Genotype, environment, and their interactions on the phytochemical compositions and radical scavenging properties of soft winter wheat bran. LWT Food Sci. Technol. 2015, 60, 277–283. [Google Scholar] [CrossRef]
  17. Mpofu, A.; Sapirstein, H.D.; Beta, T. Genotype and environmental variation in phenolic content, phenolic acid composition, and antioxidant activity of hard spring wheat. J. Agric. Food Chem. 2006, 54, 1265–1270. [Google Scholar] [CrossRef]
  18. Vollmannová, A.; Margitanová, E.; Tóth, T.; Timoracká, M.; Urminská, D.; Bojn Anská, T.; Čičová, I. Cultivar influence on total polyphenol and rutin contents and total antioxidant capacity in buckwheat, amaranth, and quinoa seeds. Czech J. Food Sci. 2013, 31, 589–595. [Google Scholar] [CrossRef]
  19. Dvořáková, M.; Guido, L.F.; Dostálek, P.; Skulilová, Z.; Moreira, M.M.; Barros, A.A. Antioxidant properties of free, soluble ester and insoluble-bound phenolic compounds in different barley varieties and corresponding malts. J. Inst. Brew. 2012, 114, 27–33. [Google Scholar] [CrossRef]
  20. Camarena-Tello, J.C.; Martínez-Flores, H.E.; Garnica-Romo, M.G.; Padilla-Ramírez, J.S.; Saavedra-Molina, A.; Alvarez-Cortes, O.; Bartolomé-Camacho, M.C.; Rodiles-López, J.O. Quantification of phenolic compounds and in vitro radical scavenging abilities with leaf extracts from two varieties of Psidium guajava L. Antioxidants 2018, 7, 34. [Google Scholar] [CrossRef]
  21. Tuyen, P.T.; Xuan, T.D.; Khang, D.T.; Ahmad, A.; Quan, N.V.; Tu, A.T.; Anh, H.; Minh, T.N. Phenolic compositions and antioxidant properties in bark, flower, inner skin, kernel and leaf extracts of Castanea crenata Sieb. et Zucc. Antioxidants 2017, 6, 31. [Google Scholar] [CrossRef] [PubMed]
  22. Wang, L.; Luo, Y.; Wu, Y.N.; Xia, F.G.; Wu, Z.Q. Quickly verifying the antioxidant contribution of the individual composition in natural antioxidants by HPLC-free radical scavenging detection. LWT Food Sci. Technol. 2018, 96, 461–468. [Google Scholar] [CrossRef]
  23. Qin, Y.; Wang, L.; Liu, Y.; Zhang, Q.; Li, Y.; Wu, Z. Release of phenolics compounds from Rubus idaeus L. dried fruits and seeds during simulated in vitro digestion and their bio-activities. J. Funct. Foods 2018, 46, 57–65. [Google Scholar] [CrossRef]
  24. Husain, S.R.; Cillard, J.; Cillard, P. Hydroxyl radical scavenging activity of flavonoids. Phytochem 1987, 26, 2489–2491. [Google Scholar] [CrossRef]
  25. Wang, L.; Lin, X.; Zhang, J.; Zhang, W.; Hu, X.; Li, W.; Liu, S. Extraction methods for the releasing of bound phenolics from Rubus idaeus L. leaves and seeds. Ind. Crop. Prod. 2019, 135, 1–9. [Google Scholar] [CrossRef]
  26. Wang, L.; Liu, Y.; Luo, Y.; Huang, K.; Wu, Z. Quickly screening for potential α-glucosidase inhibitors from guava leaves tea by bioaffinity ultrafiltration coupled with HPLC-ESI-TOF/MS Method. J. Agric. Food Chem. 2018, 66, 1576–1582. [Google Scholar] [CrossRef]
  27. Zhang, C.; Ma, Y.; Gao, F.; Zhao, Y.; Cai, S.; Pang, M. The free, esterified, and insoluble-bound phenolic profiles of Rhus chinensis mill. fruits and their pancreatic lipase inhibitory activities with molecular docking analysis. J. Funct. Foods 2018, 40, 729–735. [Google Scholar] [CrossRef]
  28. Wu, L.F.; Liu, Y.F.; Qin, Y.; Wang, L.; Wu, Z.Q. HPLC-ESI-qTOF-MS/MS characterization, antioxidant activities and inhibitory ability of digestive enzymes with molecular docking analysis of various parts of raspberry (Rubus ideaus L.). Antioxidants 2019, 8, 274. [Google Scholar] [CrossRef]
  29. Zhang, X.; Jia, Y.; Ma, Y.; Cheng, G.; Cai, S. Phenolic composition, antioxidant properties, and inhibition toward digestive enzymes with molecular docking analysis of different fractions from Prinsepia utilis royle fruits. Molecules 2018, 23, 3373. [Google Scholar] [CrossRef]
  30. Liu, Y.; Cai, C.; Yao, Y.; Xu, B. Alteration of phenolic profiles and antioxidant capacities of common buckwheat and tartary buckwheat produced in China upon thermal processing. J. Sci. Food Agric. 2019, 99, 5565–5576. [Google Scholar] [CrossRef]
  31. Nyström, L.; Lampi, A.M.; Andersson, A.A.M.; Kamaleldin, A.; Gebruers, K.; Courtin, C.M.; Delcour, J.A.; Li, L.; Ward, J.L.; Fraś, A. Phytochemicals and dietary fiber components in rye varieties in the HEATHGRAIN diversity screen. J. Agric. Food Chem. 2008, 56, 9758–9767. [Google Scholar] [CrossRef] [PubMed]
  32. Lee, C.C.; Shen, S.R.; Lai, Y.J.; Wu, S.C. Rutin and quercetin, bioactive compounds from tartary buckwheat, prevent liver inflammatory injury. Food Funct. 2013, 4, 794–802. [Google Scholar] [CrossRef] [PubMed]
  33. Albishi, T.; John, J.A.; Al-Khalifa, A.S.; Shahidi, F. Phenolic content and antioxidant activities of selected potato varieties and their processing by-products. J. Funct. Foods 2013, 5, 590–600. [Google Scholar] [CrossRef]
  34. Xiang, J.; Li, W.; Ndolo, V.U.; Beta, T. A comparative study of the phenolic compounds and in vitro antioxidant capacity of finger millets from different growing regions in Malawi. J. Cereal Sci. 2019, 87, 143–149. [Google Scholar] [CrossRef]
  35. Deng, Y.T.; Lin-Shiau, S.Y.; Shyur, L.F.; Lin, J.K. Pu-erh tea polysaccharides decrease blood sugar by inhibition of α-glucosidase activity in vitro and in mice. Food Funct. 2015, 6, 1539–1546. [Google Scholar] [CrossRef]
  36. Laar, F.A.V.D.; Lucassen, P.L.; Akkermans, R.P.; Van De Lisdonk, E.H.; Rutten, G.E.; Van Weel, C. α-Glucosidase inhibitors for patients with Type 2 diabetes. Diabetes Care 2005, 28, 154–163. [Google Scholar] [CrossRef] [Green Version]
  37. Jeong, E.Y.; Cho, K.S.; Lee, H.S. α-amylase and α-glucosidase inhibitors isolated from Triticum aestivum L. sprouts. J. Korean Soc. Appl. Biol. 2012, 55, 47–51. [Google Scholar] [CrossRef]
  38. Pramai, P.; Abdul Hamid, N.A.; Mediani, A.; Maulidiani, M.; Abas, F.; Jiamyangyuen, S. Metabolite profiling, antioxidant, and α-glucosidase inhibitory activities of germinated rice: Nuclear-magnetic-resonance-based metabolomics study. J. Food Drug Anal. 2018, 26, 47–57. [Google Scholar] [CrossRef] [Green Version]
  39. Yang, Y.; Wei, S.; Zhou, M.J.; Ren, G.X. Antioxidant and α-glucosidase inhibitory activity of colored grains in China. J. Agric. Food Chem. 2010, 58, 770–774. [Google Scholar]
  40. Qin, P.; Wu, L.; Yao, Y.; Ren, G. Changes in phytochemical compositions, antioxidant and α-glucosidase inhibitory activities during the processing of tartary buckwheat tea. Food Res. Int. 2013, 50, 562–567. [Google Scholar] [CrossRef]
  41. Zeng, L.; Ding, H.F.; Hua, X.; Zhang, G.W.; Gong, D.M. Galangin inhibits α-glucosidase activity and formation of non-enzymatic glycation products. Food Chem. 2019, 271, 70–79. [Google Scholar] [CrossRef] [PubMed]
  42. Rasouli, H.; Hosseinighazvini, S.M.; Adibi, H.; Khodarahmi, R. Differential α-amylase/α-glucosidase inhibitory activities of plant-derived phenolic compounds: A virtual screening perspective for the treatment of obesity and diabetes. Food Funct. 2017, 8, 1942–1954. [Google Scholar] [CrossRef] [PubMed]
  43. Jolliffe, I.T.; Cadima, J. Principal component analysis: A review and recent developments. Philos. Trans. R. Soc. A 2016, 374, 20150202. [Google Scholar] [CrossRef] [PubMed]
Figure 1. HPLC chromatograms (280 nm) of free (A) and bound phenolic fractions (B) of buckwheat. Peaks identification and their MS data are shown in Table S1. 1, Gallic acid; 2, 4-hydroxybenzoic acid; 3, 5-caffeoylquinic acid; 4, syringic acid; 5, dihydromyricetin; 6, rutin; 7, ferulic acid; 8, kaempferol-3-O-rutinoside; 9, quercetin; 10, apigenin; 11, kaempferol.
Antioxidants 08 00606 g001
Figure 2. The α-glucosidase inhibitory activity (IC50) of free and bound phenolic fractions (A) in different buckwheat samples and their main phenolics molecules (B). QUE, quercetin; RUT, rutin; KAE-3-O-RUT, Kaempferol-3-O-rutinoside. DIM, dihydromyricetin. Different uppercase letters (A,B) mean statistically significant differences in free and bound phenolic fractions of different samples. Different lowercase letters (a–e) mean statistically significant differences following different samples/analytes at the same fraction.
Antioxidants 08 00606 g002
Figure 3. Molecular docking of four main phenolic compounds with the α-glucosidase. The 3D docking structures of four phenolic compounds were inserted into the hydrophobic cavity of the α-glucosidase (blue): quercetin (A1); rutin (B1); kaempferol-3-O-rutinoside (C1); dihydromyricetin (D1). The conformation of active molecules interactions with amino acid residues in the active site of α-glucosidase: quercetin (A2); rutin (B2); kaempferol-3-O-rutinoside (C2); dihydromyricetin (D2) with residues in the active sites of the α-glucosidase, respectively. The yellow dashed line represented hydrogen bonds.
Antioxidants 08 00606 g003
Figure 4. Loading plot of principal component analysis (PCA) from the variation observed of six buckwheat samples. FP, free phenolic; FF, free flavonoid; BP, bound phenolic; BF, bound flavonoid; GA, gallic acid; HA, 4-hydroxybenzoic acid; CA, 5-caffeoylquinic acid; SA, syringic acid; DIM, dihydromyricetin; RUT, rutin; FA, ferulic acid; KAE-3-RUT, kaempferol-3-O-rutinoside; QUE, quercetin; API, apigenin; KAE, kaempferol; DPPH, 1,1-diphenyl-2-picrylhydrazyl; ABTS+, 2, 2-azino-bis (3-ethylbenzothiazoline-6-sulfonic acid) diammonium salt; FRAP, ferric reducing/antioxidant power; OH•, hydroxyl radical.
Antioxidants 08 00606 g004
Table 1. Specific information, free and bound phenolic/flavonoid contents of the six buckwheat samples from China.
Abbre.Collect LocationTypeColorPhenolic Contents (mg GAE/g DW)Flavonoid Contents (mg RE/g DW)
FPBPTPFFBFTF
S1Tianjin, ChinaTartary buckwheatBlack7.69 ± 0.35c0.73 ± 0.04b8.42 ± 0.39d14.48 ± 0.26d1.07 ± 0.04b15.55 ± 0.30d
S2Sichuan, ChinaCommon buckwheatGreen black5.33 ± 0.27a0.96 ± 0.02c6.29 ± 0.28b7.37 ± 0.21a1.17 ± 0.03b8.54 ± 0.23a
S3Yunnan, ChinaCommon buckwheatBlack6.57 ± 0.25b0.74 ± 0.02b7.31 ± 0.27c11.88 ± 0.53c1.28 ± 0.09c13.16 ± 0.57c
S4Shanxi, ChinaTartary buckwheatLight yellow13.74 ± 0.24d0.66 ± 0.03a14.40 ± 0.25e26.60 ± 0.86e0.72 ± 0.01a27.32 ± 0.79e
S5Shangdong, ChinaCommon buckwheatDark yellow5.18 ± 0.25a0.63 ± 0.03a5.81 ± 0.27a10.07 ± 0.12b0.85 ± 0.03a10.92 ± 0.12b
S6Heilongjiang, ChinaTartary buckwheatDark green6.19 ± 0.01b0.90 ± 0.03c7.09 ± 0.05c13.53 ± 0.85d1.38 ± 0.04c14.91 ± 0.87c
Different lowercase letters (a–e) mean statistically significant differences following different samples at the same fractions (p < 0.05). FP, free phenolic; BP, bound phenolic; TP, total phenolic; FF, free flavonoid; BF, bound flavonoid; TF, total flavonoid.
Table 2. Individual phenolic compounds contents in free and bound fractions of six buckwheat samples from China.
AnalytesStatusContents (μg/g DW)
S1S2S3S4S5S6
Gallic acid (GA)FP22.96 ± 5.4c13.30 ± 2.60b9.55 ± 1.56a75.01 ± 1.53dNDND
BP67.06 ± 0.82a64.76 ± 0.75a71.18 ± 3.12b60.66 ± 1.07a68.73 ± 0.38b59.79 ± 1.00a
TP90.02 ± 4.99d78.05 ± 3.32c80.74 ± 4.90c135.67 ± 1.31e68.73 ± 0.38b59.79 ± 1.00a
4-Hydroxybenzoic acid (4-HA)FP99.39 ± 0.71a97.63 ± 1.07a96.80 ± 0.40a93.26 ± 0.55a122.57 ± 1.23c102.64 ± 8.18b
BP175.29 ± 6.65d165.75 ± 3.58c78.85 ± 5.33b164.31 ± 8.44c193.72 ± 10.89e61.57 ± 7.28a
TP274.68 ± 6.53d263.38 ± 2.55c175.65 ± 4.95b257.58 ± 8.04c296.58 ± 12.12e164.21 ± 6.72a
5-Caffeoylquinic acid (5-CA)FP4.20 ± 0.06b6.73 ± 6.03c17.68 ± 2.06dND19.55 ± 0.71d2.20 ± 0.09a
BP33.82 ± 2.43b2.61 ± 0.99a46.96 ± 0.01cNDNDND
TP38.02 ± 2.49d9.65 ± 5.43b64.64 ± 2.06eND19.55 ± 0.71c2.20 ± 0.09a
Syringic acid (SA)FPND19.39 ± 0.44aND31.99 ± 3.35b36.75 ± 0.51b34.50 ± 7.91b
BP66.97 ± 2.43d27.46 ± 1.97c6.69 ± 0.47b25.74 ± 2.76c4.28 ± 0.16a6.93 ± 1.21b
TP66.97 ± 2.43d46.85 ± 1.96b6.69 ± 0.47a57.73 ± 4.90c41.03 ± 0.64b41.44 ± 6.90b
Dihydromyricetin (DIM)FPNDNDNDNDNDND
BP123.13 ± 12.37c299.93 ± 1.43e83.25 ± 0.57b148.95 ± 0.42d57.94 ± 0.50a57.85 ± 0.14a
TP123.13 ± 12.37c299.93 ± 1.43e83.25 ± 0.57b148.95 ± 0.42d57.94 ± 0.50a57.85 ± 0.14a
Rutin (RUT)FP3813.38 ± 110.33a1294.63 ± 38.38b3273.15 ± 86.34d6288.26 ± 144.01f2646.60 ± 142.33c3409.12 ± 66.11e
BP244.75 ± 7.45b236.66 ± 11.82b324.15 ± 21.98c85.02 ± 4.76a222.05 ± 11.55c416.83 ± 10.87d
TP4058.13 ± 107.06e1531.29 ± 32.71a3597.30 ± 64.89c6373.28 ± 148.57f2868.66 ± 140.69b3825.95 ± 76.95d
Ferulic acid (FA)FPND9.26 ± 0.18a12.77 ± 0.31b9.69 ± 0.21a10.95 ± 0.37a12.39 ± 0.17b
BP3.88 ± 0.10a3.41 ± 0.13a3.71 ± 0.19a6.32 ± 0.83b3.15 ± 0.11a3.08 ± 0.09a
TP3.88 ± 0.10a12.67 ± 0.29b16.49 ± 0.37c16.01 ± 0.68c14.10 ± 0.41b15.46 ± 0.10c
Kaempferol-3-O-rutinoside (KAE-3-RUT)FP1639.34 ± 56.63d511.06 ± 15.67a1100.85 ± 31.49c3618.65 ± 111.97e979.31 ± 50.05b1077.41 ± 21.29c
BP212.33 ± 6.29c215.77 ± 13.92c229.35 ± 20.47d43.34 ± 1.34a161.17 ± 13.32b230.85 ± 16.41d
TP1851.67 ± 54.34d726.83 ± 14.66a1330.20 ± 12.43b3661.99 ± 111.75d1140.48 ± 49.60c1146.31 ± 37.59c
Quercetin (QUE)FP262.14 ± 3.35b872.93 ± 21.23d328.32 ± 8.74c1379.54 ± 33.82e144.05 ± 1.68a141.03 ± 2.03a
BP49.51 ± 0.38a52.56 ± 2.91b47.99 ± 0.16a58.35 ± 0.17c48.38 ± 0.03a47.96 ± 0.11a
TP311.65 ± 3.69b925.49 ± 21.13d376.30 ± 8.61c1437.89 ± 33.96e192.43 ± 1.71a188.99 ± 2.10a
Apigenin (API)FP110.25 ± 1.31b108.97 ± 0.03a108.86 ± 0.13a114.07 ± 0.58b113.94 ± 2.47b113.70 ± 2.87b
BP70.58 ± 2.28a77.41 ± 6.94b79.33 ± 2.38b82.69 ± 0.53b82.53 ± 0.88b79.25 ± 1.09b
TP180.83 ± 3.57a186.38 ± 6.92b188.19 ± 2.33b196.76 ± 0.62c196.48 ± 2.55c192.95 ± 3.66b
Kaempferol (KAE)FP106.24 ± 0.21a139.15 ± 1.38b108.39 ± 0.39a140.10 ± 1.12b101.03 ± 0.05a100.90 ± 0.08a
BP64.98 ± 0.31a64.20 ± 0.17a62.36 ± 0.07a62.90 ± 0.02a62.37 ± 0.02a63.75 ± 0.17a
TP171.22 ± 0.52b203.35 ± 1.22c170.75 ± 0.42b203.00 ± 1.10c163.40 ± 0.07a164.65 ± 0.09a
Different lowercase letters (a–e) mean statistically significant differences following different samples at the same status (p < 0.05). FP, free phenolic; BP, bound phenolic; TP, total phenolic. N.D. not detected.
Table 3. The antioxidant activities of free and bound phenolic fractions of different buckwheat samples.
Antioxidant ActivitiesStatusS1S2S3S4S5S6
DPPH (μmol TE/g DW)FP44.97 ± 1.86d17.55 ± 3.10a37.35 ± 3.46c114.02 ± 0.36e26.69 ± 2.24b39.38 ± 1.29 c
BP4.30 ± 0.51a7.68 ± 0.20d5.65 ± 0.43b5.54 ± 1.16b6.46 ± 1.84c6.40 ± 0.35c
TP49.27 ± 2.37d25.23 ± 3.30a43.00 ± 3.89c119.56 ± 1.52e33.15 ± 4.08b45.78 ± 1.64c
ABTS+ (μmol TE/g DW)FP119.12 ± 1.32d69.19 ± 0.30a93.50 ± 1.09c175.66 ± 1.57e75.80 ± 2.28b92.12 ± 1.31c
BP9.01 ± 0.27a11.54 ± 0.20c9.75 ± 0.69a8.92 ± 0.42a7.12 ± 0.44b10.62 ± 0.20c
TP128.13 ± 1.59c80.73 ± 0.50a103.5 ± 1.78b184.58 ± 1.99d82.92 ± 2.72a102.74 ± 1.51b
OH• (μmol TE/g DW)FP53.69 ± 0.84c56.26 ± 1.29c32.92 ± 1.90a82.64 ± 1.70d36.13 ± 3.16a42.02 ± 3.44b
BP14.17 ± 0.55a14.54 ± 0.43a13.26 ± 0.50a13.23 ± 0.74a13.90 ± 0.29a13.43 ± 0.71a
TP67.86 ± 1.39b70.80 ± 1.72b46.18 ± 2.40a95.87 ± 2.44c50.03 ± 3.45a56.45 ± 4.15a
FRAP (mM FeS(II) E/g DW)FP43.77 ± 1.48c31.70 ± 0.33a38.82 ± 0.22b84.72 ± 3.29d29.58 ± 1.31a37.06 ± 1.79b
BP2.90 ± 0.18a4.35 ± 0.31c3.41 ± 0.16b2.95 ± 0.12a2.23 ± 0.14a3.84 ± 0.03b
TP46.67 ± 1.66b36.05 ± 0.64a43.23 ± 0.38b87.67 ± 3.41c31.81 ± 1.45a40.90 ± 1.82b
Different lowercase letters (a–e) mean statistically significant differences following different samples (p < 0.05) at the same status. FP, free phenolic; BP, bound phenolic; TP, total phenolic. N.D. not detected.
Table 4. The analysis results of the main phenolic analytes’ ligands docking into α-glucosidase.
Main PhenolicsC-ScoreT-ScorePMF-ScoreCHEM-ScoreG-ScoreD-Score
Quercetin56.37−137.893−27.110−173.998−143.148
Rutin45.94−260.712−31.241−310.716−278.108
Kaempferol-3-O-rutinoside44.68−147.036−26.576−210.020−220.257
Dihydromyricetin45.50−167.849−29.871−287.447−247.370
Table 5. Correlation matrix between the major phenolic compounds and the investigated bio-activities.
AnalytesCorrelations Matrix
DPPHABTS+OH•FRAPGIA (IC50)
FP0.990***0.983**0.851*0.998***−0.671*
BP0.583*0.932**0.803*0.947**−0.604*
FF0.994***0.981**0.765*0.974**−0.723*
BF0.731*0.572*0.686*0.601*−0.622*
GA0.933**0.931**0.924**0.970**−0.585
4-HA0.4550.5130.546*0.535*−0.478
5-CA0.5450.587*0.750*0.577*−0.324
SA0.2080.3710.1980.151−0.401
DIM0.934**0.938**0.877*0.912**−0.765*
RUT0.959**0.963**0.633*0.921**−0.803*
FA0.550*0.2510.2990.092−0.396
KAE-3-O-RUT0.992**0.985**0.804*0.982**−0.551*
QUE0.952*0.699*0.895**0.895*−0.715*
API0.4780.3750.2450.382−0.348
KAE0.4530.4020.800*0.558−0.618*
* Correlation was significant at the 0.05 level (two-tailed). ** Correlation was significant at the 0.01 level (two-tailed). *** Correlation was significant at the 0.001 level (two-tailed).

