Article

Dietary Probiotic Bacillus subtilis AAHM-BS2360 and Its Postbiotic Metabolites Enhance Growth, Immunity, and Resistance to Edwardsiellosis in Pangasianodon hypophthalmus

by
Nugroho Wiratama
1,2,3,
Pakapon Meachasompop
1,2,
Benchawan Kumwan
1,2,
Yosapon Adisornprasert
1,2,
Prapansak Srisapoome
1,2,
Phornphan Phrompanya
4,
Patcharapong Thangsunan
5,6,
Pattanapong Thangsunan
6,7,
Kanokporn Saenphet
8,
Supap Saenphet
8,
Wararut Buncharoen
8,* and
Anurak Uchuwittayakul
1,2,*
1
Laboratory of Aquatic Animal Health Management, Department of Aquaculture, Faculty of Fisheries, Kasetsart University, Bangkok 10900, Thailand
2
Center of Excellence in Aquatic Animal Health Management, Faculty of Fisheries, Kasetsart University, Bangkok 10900, Thailand
3
PT. Central Proteinaprima, Tbk, Treasury Tower Lt. 8, District 8 SCBD Lot. 28, Senayan, Jakarta 12190, Indonesia
4
Department of Biological Science, Faculty of Science, Ubon Ratchathani University, Warin Chamrap District, Ubon Ratchathani 34190, Thailand
5
Office of Research Administration, Chiang Mai University, Chiang Mai 50200, Thailand
6
Division of Biochemistry and Biochemical Innovation, Department of Chemistry, Faculty of Science, Chiang Mai University, Chiang Mai 50200, Thailand
7
Center of Excellence for Innovation in Chemistry, and Research Laboratory on Advanced Materials for Sensor and Biosensor Innovation, Material Science Research Center, Faculty of Science, Chiang Mai University, Chiang Mai 50200, Thailand
8
Department of Biology, Faculty of Science, Chiang Mai University, Chiang Mai 50200, Thailand
*
Authors to whom correspondence should be addressed.
Antioxidants 2025, 14(6), 629; https://doi.org/10.3390/antiox14060629
Submission received: 17 April 2025 / Revised: 21 May 2025 / Accepted: 22 May 2025 / Published: 23 May 2025

Abstract

:
Edwardsiellosis, caused by Edwardsiella tarda, poses a significant threat to the aquaculture industry, particularly in pangasius farming. This study investigates the effects of probiotic Bacillus subtilis AAHM-BS2360 and its postbiotic metabolites on growth performance, immune responses, antioxidative activity, and disease resistance against E. tarda infection. A total of 240 healthy pangasius (37.0 ± 4.9 g) were divided into four treatment groups with four replicate tanks each, as follows: (1) the Control group, which received feed top-dressed with 100 mL of 0.85% NaCl/kg diet; (2) the Probiotic group, which received feed supplemented with 100 mL of B. subtilis AAHM-BS2360 cells at the concentration of 1 × 10¹² CFU/kg diet; (3) the Postbiotic group, which received feed supplemented with B. subtilis AAHM-BS2360 cell-free supernatant 100 mL/kg diet; and (4) the Pro + Post group, which received a combination of B. subtilis AAHM-BS2360 cells and cell-free supernatant. After 30 days of feeding treatment, biochemical serum analysis revealed a significant increase in the AST/ALT ratio in the Postbiotic group. The Probiotic and Postbiotic treatments increased lysozyme activity in mucus, indicating an innate immune response to pathogens. The Pro + Post group exhibited the highest levels of catalase (CAT) in serum and upregulated antioxidant-related genes. All treatment groups receiving B. subtilis AAHM-BS2360, metabolites, and their combinations showed significant upregulation of immune-related genes, like lygl1, tgfb, b2ml, and tnf. The expression of proinflammatory genes (litaf, ifngr1l, c3, il13, and il1b) increased, with the most pronounced effects observed in the Pro + Post group. The Probiotic group showed significant upregulation of the growth-related gene igf1. Meanwhile, the Pro + Post group showed significantly higher values in SGR and ADG parameters, with values of 3.29 ± 0.98%/day and 1.42 ± 0.52 g/day respectively (p < 0.05). Survival rates were significantly higher in the Pro + Post (87.5%), Postbiotic (84.37%), and Probiotic (81.25%) groups when challenged with E. tarda. Dietary supplementation with B. subtilis AAHM-BS2360, its metabolites, and their combination enhanced immune response, reduced oxidative stress, and improved growth performance in pangasius, highlighting its potential as a functional feed additive for sustainable aquaculture.

1. Introduction

Pangasianodon hypophthalmus, commonly known as striped catfish, iridescent shark catfish, and pangasius, holds a prominent position in the global whitefish market. It contributes over 3.3 million tons annually and a value of USD 4.03 billion in 2022. Pangasius production is expected to grow up to 66.7% by 2030 to meet global demand, an increasing trend starting from December 2023, where the level of consumer confidence index in the United States for seafood products increased by 2.3%, as well as China’s growing market demand by establishing cooperation with several major catfish production countries [1,2,3]. The increasing demand for pangasius is likely to exert significant pressure on the aquafeed industry, with forecasts predicting an annual growth rate of 30% [4]. These developments present opportunities for increased pangasius production and market expansion, leading to the establishment of a thriving domestic and export pangasius farming industry. Pangasius farming not only enhances sustainability and competitiveness in national aquaculture but also serves as a crucial livelihood strategy for millions of people worldwide, and accessibility to low-income communities contributes to food security [5,6].
Pangasius production’s rapid expansion has caused health challenges, especially infectious diseases like Edwardsiellosis caused by Edwardsiella tarda. E. tarda is a Gram-negative bacterium in the family Enterobacteriaceae that causes systemic infections like hemorrhagic septicaemia, white nodules on internal organs, and has been confirmed zoonotic to humans [7,8]. Mass mortality caused by E. tarda has been reported in several pangasius farms in Kerala and Andhra Pradesh, India [9,10]. The overuse of antibiotics beyond the recommended dosage has been identified as a contributing factor to the rising prevalence of antibiotic resistance in Pangasius, a phenomenon observed in Bangladesh and Indonesia [11,12].
An environmentally friendly approach is needed to enhance pangasius’ immune response against Edwardsiellosis. Functional feed additives like probiotics, prebiotics, postbiotics, and synbiotics maintain a healthy gut microbiome, producing antimicrobial compounds, stimulating growth, and strengthening disease resistance in aquatic organisms [13,14,15]. Recent studies have underscored the potential of Bacillus spp. in aquaculture by showcasing its ability to develop the immune system (nonspecific and specific immunity) and induce different types of cytokines, namely tumor necrosis factor (tnf), interleukin (il6, il1b, il8, il10), and myd88 [16]. In addition to the utilization of viable microorganisms belonging to Bacillus spp., the metabolite components of these microorganisms have been shown to enhance gastrointestinal health, reduce inflammation, and act as antibacterial and antifungal agents. The composition of bioactive metabolites termed postbiotics encompasses cell-free supernatant (CFS), cell-free spent media (CFSM), short-chain fatty acids (SCFAs), vitamins, various amino acids, enzymes, exopolysaccharides, and bacterial lysates [17,18].
Bacillus subtilis AAHM-BS2360 isolates, derived from the intestinal tract of healthy pangasius, have been found to contain bioactive components, including viable microorganisms (probiotics) as well as inert substrates or cell-free supernatants (CFSs or postbiotics). These components provide various advantages, serving as natural enhancers for the health and production of pangasius. Despite promising findings on probiotics and postbiotics of Bacillus spp. in aquaculture, a comprehensive understanding of their impacts on pangasius growth, antioxidative responses, proinflammatory responses, and immunity against E. tarda infections is lacking. This study investigates the impact of administering probiotic Bacillus subtilis AAHM-BS2360 and its bioactive components on pangasius growth and immune defenses. It specifically examines bactericidal and lysozyme activity and evaluates fish health through serum biochemical analysis. Furthermore, the study analyzes growth performance and explores the expression of proinflammatory, stress antioxidant, and immune-related genes of treated fish. These novelties provide key insights into current advancements in aquaculture additives, helping to foster a modern and thriving aquaculture industry.

2. Materials and Methods

2.1. Ethical Statement

The aquatic animal experiments were conducted following the Ethical Principles and Guidelines for the Use of Animals outlined by the National Research Council of Thailand, which governs the care and use of animals for research purposes. This protocol received approval from the Animal Ethics Committee at Kasetsart University in Thailand (Approval ID: ACKU67-FIS-015) on 20 May 2024.

2.2. Pangasius Husbandry

A total of 1000 pangasius fingerlings, with an average weight of 3.0 ± 0.5 g, were purchased from a local hatchery in Nakhon Pathom, Thailand, and subsequently transported to 3000 L freshwater nursery tank at the Center of Excellence in Aquatic Animal Health Management (CE AAHM), Faculty of Fisheries, Kasetsart University, Bangkok, Thailand. During the nursery stage, pangasius fingerlings were fed Higade 9006T (Charoen Pokphand Foods PCL, Bangkok, Thailand) commercial floating pellets three times daily with a feeding rate of 8.0% of body weight. The pellets contained 42.0% crude protein, 6.0% fat, 3.0% fiber, and 10.0% moisture. After a three-week nursery stage, the pangasius was transitioned to CP 9920D feed (Charoen Pokphand Foods PCL, Thailand) thrice daily at 5% of their body weight. The fish feed has a nutritional composition of 25% crude protein, 3% fat, 8% fiber, and 12% moisture.
A total of 240 pangasius from the nursery tank, with an average weight of 37.0 ± 4.9 g, were equally distributed among sixteen experimental tanks of 200 L and maintained with full aeration. The water quality was closely monitored and controlled weekly to ensure its optimal level for fish, with pH value within the range of 7.56–7.66, dissolved oxygen levels within the range of 3–5 ppm, temperature within the range of 28.69–28.97 °C, alkalinity values within the range of 111.4–113.3 mg/L as CaCO3, and nitrite levels within the range of 0.09–0.12 ppm. The initial biomass and average weight per tank were recorded before the experiment.

2.3. Bacterial Cultivation and Preparation of Experimental Diets

The Bacillus subtilis AAHM-BS2360 was obtained and initially identified by the Centre of Excellence in Aquatic Animal Health Management (CE AAHM), Faculty of Fisheries, Kasetsart University, Thailand. Initially isolated from the intestinal tract of a healthy pangasius from an earthen pond, it demonstrates significant in vitro antagonistic activity against E. tarda.
B. subtilis AAHM-BS2360 was routinely cultivated in tryptic soy broth (TSB, DifcoTM, Baltimore, MD, USA) at pH 7.4 and incubated at 37 °C for 18–24 h. Bacterial density was standardized to 1 × 10¹² CFU/mL using a UV-Vis spectrophotometer (600 nm, Thermo Fisher Scientific, Waltham, MA, USA), reaching an absorbance value of 1.4 for the combination of Probiotics and Postbiotics (Pro + Post) group. The culture was centrifuged at 3500× g for 10 min to obtain two fractions: the cell-free supernatant or postbiotic metabolite (Postbiotic group) and the pellet (Probiotic group). The supernatant was directly used for diet supplementation, while the pellet was washed, resuspended in 0.85% NaCl with the same initial concentration of 1 × 10¹² CFU/mL, and subsequently used to supplement the diets of the Probiotic treatment group.
The experimental diet was prepared daily by enriching the commercial feed (CP 9920D) following a completely randomized design with four treatment groups, each consisting of four replicates containing 15 fish per replicate (60 fish/group). The groups were as follows: (1) the Control group, fed with regular feed top-dressed with 100 mL of 0.85% NaCl/kg diet; (2) the Probiotic group, which received feed supplemented with 100 mL of B. subtilis AAHM-BS2360 cells at the concentration of 1 × 10¹² CFU/kg diet; (3) the Postbiotic group, which received feed supplemented with B. subtilis AAHM-BS2360 cell-free supernatant 100 mL/kg diet; and (4) the Pro + Post group, which received feed supplemented with a combination of B. subtilis AAHM-BS2360 cells and cell-free supernatant. The feeding experiment was conducted for 30 days, with a feeding rate of 4% body weight.

2.4. Growth Performance

The fish growth rates were determined through the calculation of the average daily growth rate (ADG) and the specific growth rate (SGR). The fish samples were weighed on a two-digit electronic scale. Daily records of feed consumption were diligently maintained, allowing for the computation of the feed conversion ratio (FCR). The detailed formulas for these calculations were provided by Bunnoy et al. [19].

2.5. Sample Collection

Following thirty days of dietary treatment, samples of tissue, including gills, skin mucus, whole blood, intestine, liver, and head kidney, were collected from eight fish/group (two fish/tank). These tissues were preserved in TriZOLTM reagent (Thermo Fisher Scientific, Waltham, MA, USA) for gene expression assays and stored at −80 °C. Additionally, samples of tissues were placed in 1.5 mL tubes for immune parameter and antioxidant analyses, and stored at −20 °C. The whole blood (without anticoagulant) was collected in 1.5 mL tubes and allowed to clot at ambient temperature. After clotting, serum was separated by centrifugation at 3500× g for 15 min, then stored at −80 °C for further analysis. Eight fish per group were also sampled 24 h after the challenge test (according to Section 2.11), with head kidney, intestine, and whole blood collected for gene expression analysis.

2.6. Parameter of Serum Biochemical

The instrument utilized for serum biochemical assay was the Pushkang veterinary coagulation and chemistry combo analyzer, model MSC100V (Zhejiang PushKang Biotechnology Co., Ltd., Shaoxing, China). The reagent panel employed was the veterinary general chemistry 23 panel (CAT. no VE60010). The serum samples were immediately analyzed for the measurement of 23 biochemical parameters: albumin (ALB), total protein (TP), alkaline phosphatase (ALP), alanine aminotransferase (ALT), aspartate aminotransferase (AST), gamma-glutamyl transferase (GGT), direct bilirubin (DBIL), total bilirubin (TBIL), globulin (GLB), indirect bilirubin (IBIL), urea, calcium (Ca), creatinine (Crea), cholesterol, glucose (GLU), amylase (AMY), total bile acids (TBA), creatine kinase (CK), total carbon dioxide (tCO2), inorganic phosphorus (P), albumin/globulin ratio (ALB/GLB), urea/creatinine ratio (Urea/Crea), and AST/ALT ratio (AST/ALT).

2.7. Humoral Innate Immune Responses Assays

2.7.1. Bactericidal Activity

The bactericidal activity assay was performed according to the previously published report [20]. A virulent freshwater fish pathogen E. tarda was routinely cultured in TSB medium using the conditions described in Section 2.3. This pathogen was utilized to evaluate the bactericidal activity of the mucus and serum samples. The concentration of E. tarda in the bacterial suspension was adjusted to 1 × 10⁵ CFU/mL in sterile phosphate-buffered saline (PBS), pH 7.4, by measuring the absorbance at 600 nm. Subsequently, 40 μL of each sample was gently mixed with 10 μL of 1 × 10⁵ CFU/mL E. tarda at room temperature for 90 min, and the survival of E. tarda was determined by counting the number of colonies on trypticase soy agar (TSA) (Merck KGaA, Darmstadt, Germany) plates after 24 h. After the incubation period, the bacterial colonies were counted as presented on the TSA plates. The bactericidal activity was determined using the following formula: BA (%) = [(T0 − T24)/T0] × 100, where T0 is the total initial bacterial count and T24 is the number of bacteria remaining on the plate after 24 h.

2.7.2. Lysozyme Activity

The lysozyme activity was quantified using the approach adapted from the methodology originally proposed by Parry et al. [21]. A solution Micrococcus lysodeikticus (Sigma-Aldrich, Darmstadt, Germany) was prepared at a concentration of 0.2 mg/mL in phosphate-buffered saline (PBS) with pH 6.2. Subsequently, 10 µL of fish serum and mucus were added to a flat-bottomed microtiter plate, followed by the addition of 250 µL of M. lysodeikticus solution to each well. The decrease in absorbance at 540 nm was measured using a microplate spectrophotometer reader (iMark™ Microplate Absorbance Reader, BIO-RAD, Hercules, CA, USA), followed by incubation of the plate at room temperature for a period of 0 and 5 min. The units of lysozyme activity were calculated, where one unit is defined as the quantity of enzyme required to reduce the absorbance by 0.001 per minute, as described by Sukhsangchan et al. [22].

2.8. Determination of Oxidative Stress and Antioxidant Status of Target Organs

The tissues selected for antioxidative analysis included the serum, liver, intestine, skin, and gills. Fifty milligrams of each organ was accurately weighed and combined with 1 mL of PBS (0.1 M, pH 7.4). The mixture was then homogenized and centrifuged at 1100× g for 10 min at 4 °C. The supernatant was carefully transferred to a microcentrifuge tube and stored at −20 °C to ensure optimal conditions for subsequent analysis.

2.8.1. Measurement of Catalase (CAT) Activity

CAT activity was examined according to the method adapted from Maehly [23]. One hundred microliters of the sample supernatant was mixed with 2.5 mL of phosphate buffer (50 mM, pH 5.0) and 0.4 mL of hydrogen peroxide (5.9 mM). The change in absorbance at 240 nm was recorded using a spectrophotometer every 30 s for 2 min. CAT activity in the sample was calculated by comparing it to the activity of the CAT standard. The CAT activity in the sample was expressed as units per minute per milligram of protein.

2.8.2. Measurement of Glutathione Peroxidase (GPx) Activity

The measurement of GPx enzyme activity was conducted following the method adapted from Mohandas et al. [24]. A reaction mixture was prepared by combining the following components: 100 µL of sample supernatant, 1.49 mL of 0.1 M phosphate buffer (pH 7.4), 100 µL of 1 mM EDTA, 100 µL of 1 mM sodium azide, 50 µL of glutathione reductase (1 U/mL), 50 µL of 1 mM glutathione, 100 µL of 0.2 mM NADPH, and 10 µL of 0.25 mM H2O2. GPx activity was measured by monitoring the oxidation of NADPH at a wavelength of 340 nm at 25 °C. Enzymatic activity was expressed as µM of NADPH oxidized per minute per milligram (min−1mg−1) of protein, with a molar extinction coefficient of 6.22 × 10³ M−1 cm−1.

2.8.3. Measurement of Glutathione Reductase (GR) Enzyme Activity

The activity of the GR enzyme was measured using the method modified by Sahreen et al. [25]. A reaction mixture was prepared by combining 100 µL of the sample supernatant with 100 µL of phosphate buffer (0.1 M, pH 7.6), 100 µL of oxidized glutathione (1 mM), and 100 µL of NADPH (0.1 mM). The mixture was incubated at 25 °C, and the absorbance was recorded at 340 nm. The GR enzyme activity was expressed as µM of NADPH oxidized min−1mg−1 of protein, calculated using a molar extinction coefficient of 6.22 × 10³ M−1 cm−1.

2.8.4. Measurement of Reduced Glutathione (GSH) Content

The glutathione (GSH) content was determined using the method adapted from Jollow et al. [26]. The reaction mixture consisted of 1 mL of 4% w/v sulfosalicylic acid and 1 mL of the sample supernatant. After mixing thoroughly, the mixture was incubated at 4 °C for 1 h. Following incubation, the mixture was centrifuged at 1100× g at 4 °C for 20 min, and the supernatant was collected. A 100 µL aliquot of the supernatant was then mixed with 2.9 mL of a reaction solution containing 100 mM phosphate buffer (pH 7.4) and 100 mM 5,5′-dithiobis (2-nitrobenzoic acid) (DTNB). The absorbance of the resulting yellow chromogen was determined at 412 nm. A calibration curve for GSH was then generated, and the GSH content in the sample was expressed as nmol/mg of protein.

2.8.5. Measurement of Glutathione-S-Transferase (GST) Activity

GST activity was assessed using the method described by Habig et al. [27]. A reaction mixture was prepared by combining 300 µL of the sample supernatant with 1.475 mL of 0.1 M phosphate buffer (pH 6.5), 200 µL of reduced glutathione (1 mM), and 25 µL of 1-Chloro-2,4-dinitrobenzene (CDNB) (1 mM). The absorbance of the resulting mixture at 340 nm was measured. Enzyme activity was calculated as nmol of CDNB conjugate in units per minute per milligram of protein, with a molar extinction coefficient of 9.6 × 10³ M−1 cm−1.

2.8.6. Measurement of Malondialdehyde (MDA) Content

The MDA content in the samples was assessed using the thiobarbituric acid reactive substances (TBARS) assay, as described in the previous studies [28,29]. A 100 µL aliquot of the sample supernatant was mixed with 450 µL normal saline solution (0.85% w/v), 1000 µL of trichloroacetic acid (TCA, 10% w/v), and 200 µL of thiobarbituric acid (TBA, 0.67% w/v). The reaction mixture was boiled for 30 min and cooled. Subsequently, 2 mL of distilled water was added, and the mixture was centrifuged at 1100× g for 10 min. The supernatant was collected, and the absorbance was measured using a spectrophotometer at 532 nm. The resulting value was used to calculate the MDA content by comparing it with a standard curve of tetramethoxypropane (TMP). The MDA amount in the sample is expressed as nmol/mg of protein.

2.8.7. Measurement of Superoxide Dismutase (SOD) Activity

SOD activity was measured using the modified method obtained from Takada et al. [29,30]. A 100 µL aliquot of the sample supernatant was mixed with 1 mL of a solution containing 0.1 mM xanthine, 0.025 mM nitro blue tetrazolium salt, 0.1 mM disodium ethylenediaminetetraacetate dihydrate, 60 mM sodium carbonate buffer (pH 10.2), and xanthine oxidase. The change in absorbance at 560 nm was measured every 30 s for 2 min, and the calibration curve for the SOD standard was plotted. The SOD activity in the sample was expressed as units per minute per milligram of protein.

2.9. cDNA Preparation and Gene Expression Analysis Using Quantitative Reverse Transcription PCR (qRT-PCR)

Total RNA was extracted from head kidney, gills, intestine, whole blood, liver, and spleen samples according to TriZOLTM manual protocol (Thermo Fisher Scientific, Waltham, MA, USA). The total RNA was quantified using a NanoDrop™ spectrophotometer (Thermo Fisher Scientific, Waltham, MA, USA). A total of 1 µg of total RNA was used as a template to synthesize first-strand complementary DNAs (cDNAs) using Maxime™ RT PreMix (iNtRON Biotechnology, Seongnam-si, Republic of Korea). The synthesized first-strand cDNA was stored at −20 °C for further analysis.
The quantitative real-time PCR (qRT-PCR) assay was performed using 2× RealMODTM Green W2 2× qPCR Mix-SYBR® (iNTRON Biotechnology, Republic of Korea) in an Azure CieloTM real-time PCR (Azure biosystems, Dublin, CA, USA). The qPCR cycling conditions consisted of an initial condition of one cycle of 95 °C for 5 min, 40 cycles of 95 °C for 30 s, 60 °C for 30 s, 72 °C for 90 s, and a final extension at 72 °C for 10 min. The housekeeping genes, including actb1 and rna18s, were used to standardize mRNA and cDNA quantities, to ensure consistency and reliability of the results. The target genes were analyzed using qRT-PCR to assess non-specific immune-related genes, proinflammatory genes, antioxidant-related genes, and growth-related genes.
All primers were standardized to ensure amplification efficiency before the qRT-PCR analysis. The relative expression levels of genes in the fish tissues were calculated using the 2−ΔΔCT analysis according to the protocol of Livak and Schmittgen [31]. The primer sequences of all targeted genes are detailed in Table 1.

2.10. Disease Resistance and Survival Rate (SR) After E. tarda Challenges

At the end of the experiment, 40 fish were randomly selected from each group (10 fish per replicate) and transferred to 250 L fiberglass tanks with full aeration. These fish were then subjected to intraperitoneal (i.p) injection with E. tarda. The cultivation of E. tarda was routinely carried out in TSB, and the concentration was adjusted using a spectrophotometer as described in Section 2.3.
Each fish was injected with a 100 μL solution containing E. tarda at a concentration of 1 × 10⁸ CFU/mL (1 × 10⁷ CFU/fish). The optimum concentrations and dosages were determined based on preliminary 14-day LD50 tests conducted on the fish. At 24 h post-infection, eight surviving fish from each group were selected for sampling gene expression parameters as described in the previous section. Daily mortality rates were recorded for 14 days, and the survival rate (SR) was analyzed using the Kaplan–Meier method [32].

2.11. Statistical Data Analysis

The statistical analysis was performed using GraphPad Prism 10 version 10.4.1 for macOS (GraphPad Software, Boston, MA, USA), employing one-way analysis of variance (ANOVA) followed by Tukey’s multiple comparison test after passing the Shapiro–Wilk test to assess the normality of data distribution. Survival curves were created using GraphPad Prism 10 to visualize the survival rate profile over time. Data are shown as means ± standard deviations (SD). Letter superscripts and asterisks (*) indicate statistical significance differences among groups, with a threshold of p < 0.05. Statistical significance was determined at p-values of * (p < 0.05), ** (p < 0.01), and *** (p < 0.001).

3. Results

3.1. Serum Biochemical Analysis

Most serum biochemical analysis results showed non-significant values for all treatments across all biochemical test parameters (p > 0.05), except for the AST/ALT ratio parameter, which exhibited significant values in the postbiotic B. subtilis AAHM-BS2360 treatment compared to the control (p < 0.05). The serum biochemical values are presented in Figure 1A–W.
The albumin parameters in all treatment groups exhibited mean values ranging from 0.633 to 4.5 g/dL, while the globulin levels demonstrated mean values from 29.17 to 78.33 g/L. The ALB/GLB ratio attained a mean value of 0.18. The mean concentrations of bilirubin in serum samples, comprising DBIL, IBIL, and TBIL, were found to be 0.475 mg/dL, 1.499 mg/dL, and 17.541 mg/dL, respectively. Furthermore, a similar pattern was observed across all treatments for the parameters of urea, creatine, and inorganic phosphorus, with values of 5.415 mg/dL, 0.5 mg/dL, and 0.62 mg/dL, respectively. The urea/creatine ratio obtained a mean value of 2.65.
The mean value of total protein parameters ranged from 3.43 g/dL to 8.23 g/dL, while the GGT content demonstrated a mean value of 3.61 U/L. The tCO2 levels exhibited an average value of 9.9 mmol/L, and alkaline phosphatase levels exhibited a range of 51.67–116.8 U/L. The cholesterol and glucose levels in serum samples exhibited an average range of 85.70–214.0 mg/dL and 141.1–199.3 mg/dL, respectively. Calcium and amylase levels demonstrated mean values of 12.32 mg/dL and 52.01 U/L.
The range of mean values of total bile acid levels across all treatments was found to be between 0.7 and 9.3 µmol/L, while the mean value of creatine kinase was recorded as 783.9 U/L. Furthermore, the range of mean values of ALT and AST in all treatments was determined to be 3.167–18.2 U/L and 37.5–446.6 U/L, respectively. The AST/ALT ratio exhibited a range of mean values from 7.9 to 53.0, indicating that Postbiotic treatment resulted in a significant increase compared to the control treatment (p < 0.05).

3.2. Nonspecific Humoral Immune Responses

3.2.1. Bactericidal Activity

The investigation revealed no statistically significant differences in bactericidal activity parameters between the serum and mucus samples among groups (p > 0.05). The bactericidal activity values for each group are presented in Figure 2A,B.

3.2.2. Lysozyme Activity

Statistical analysis of lysozyme activity in mucus samples revealed a substantial increase in both Probiotic and Postbiotic treatments in comparison to the Control group (p < 0.05; p < 0.01), with values recorded at 1220 ± 194.1 units/mL and 1487 ± 234.7 units/mL, respectively, as depicted in Figure 2C. The serum samples exhibited comparable lysozyme activity parameters across all treatment groups (p > 0.05), as illustrated in Figure 2D.

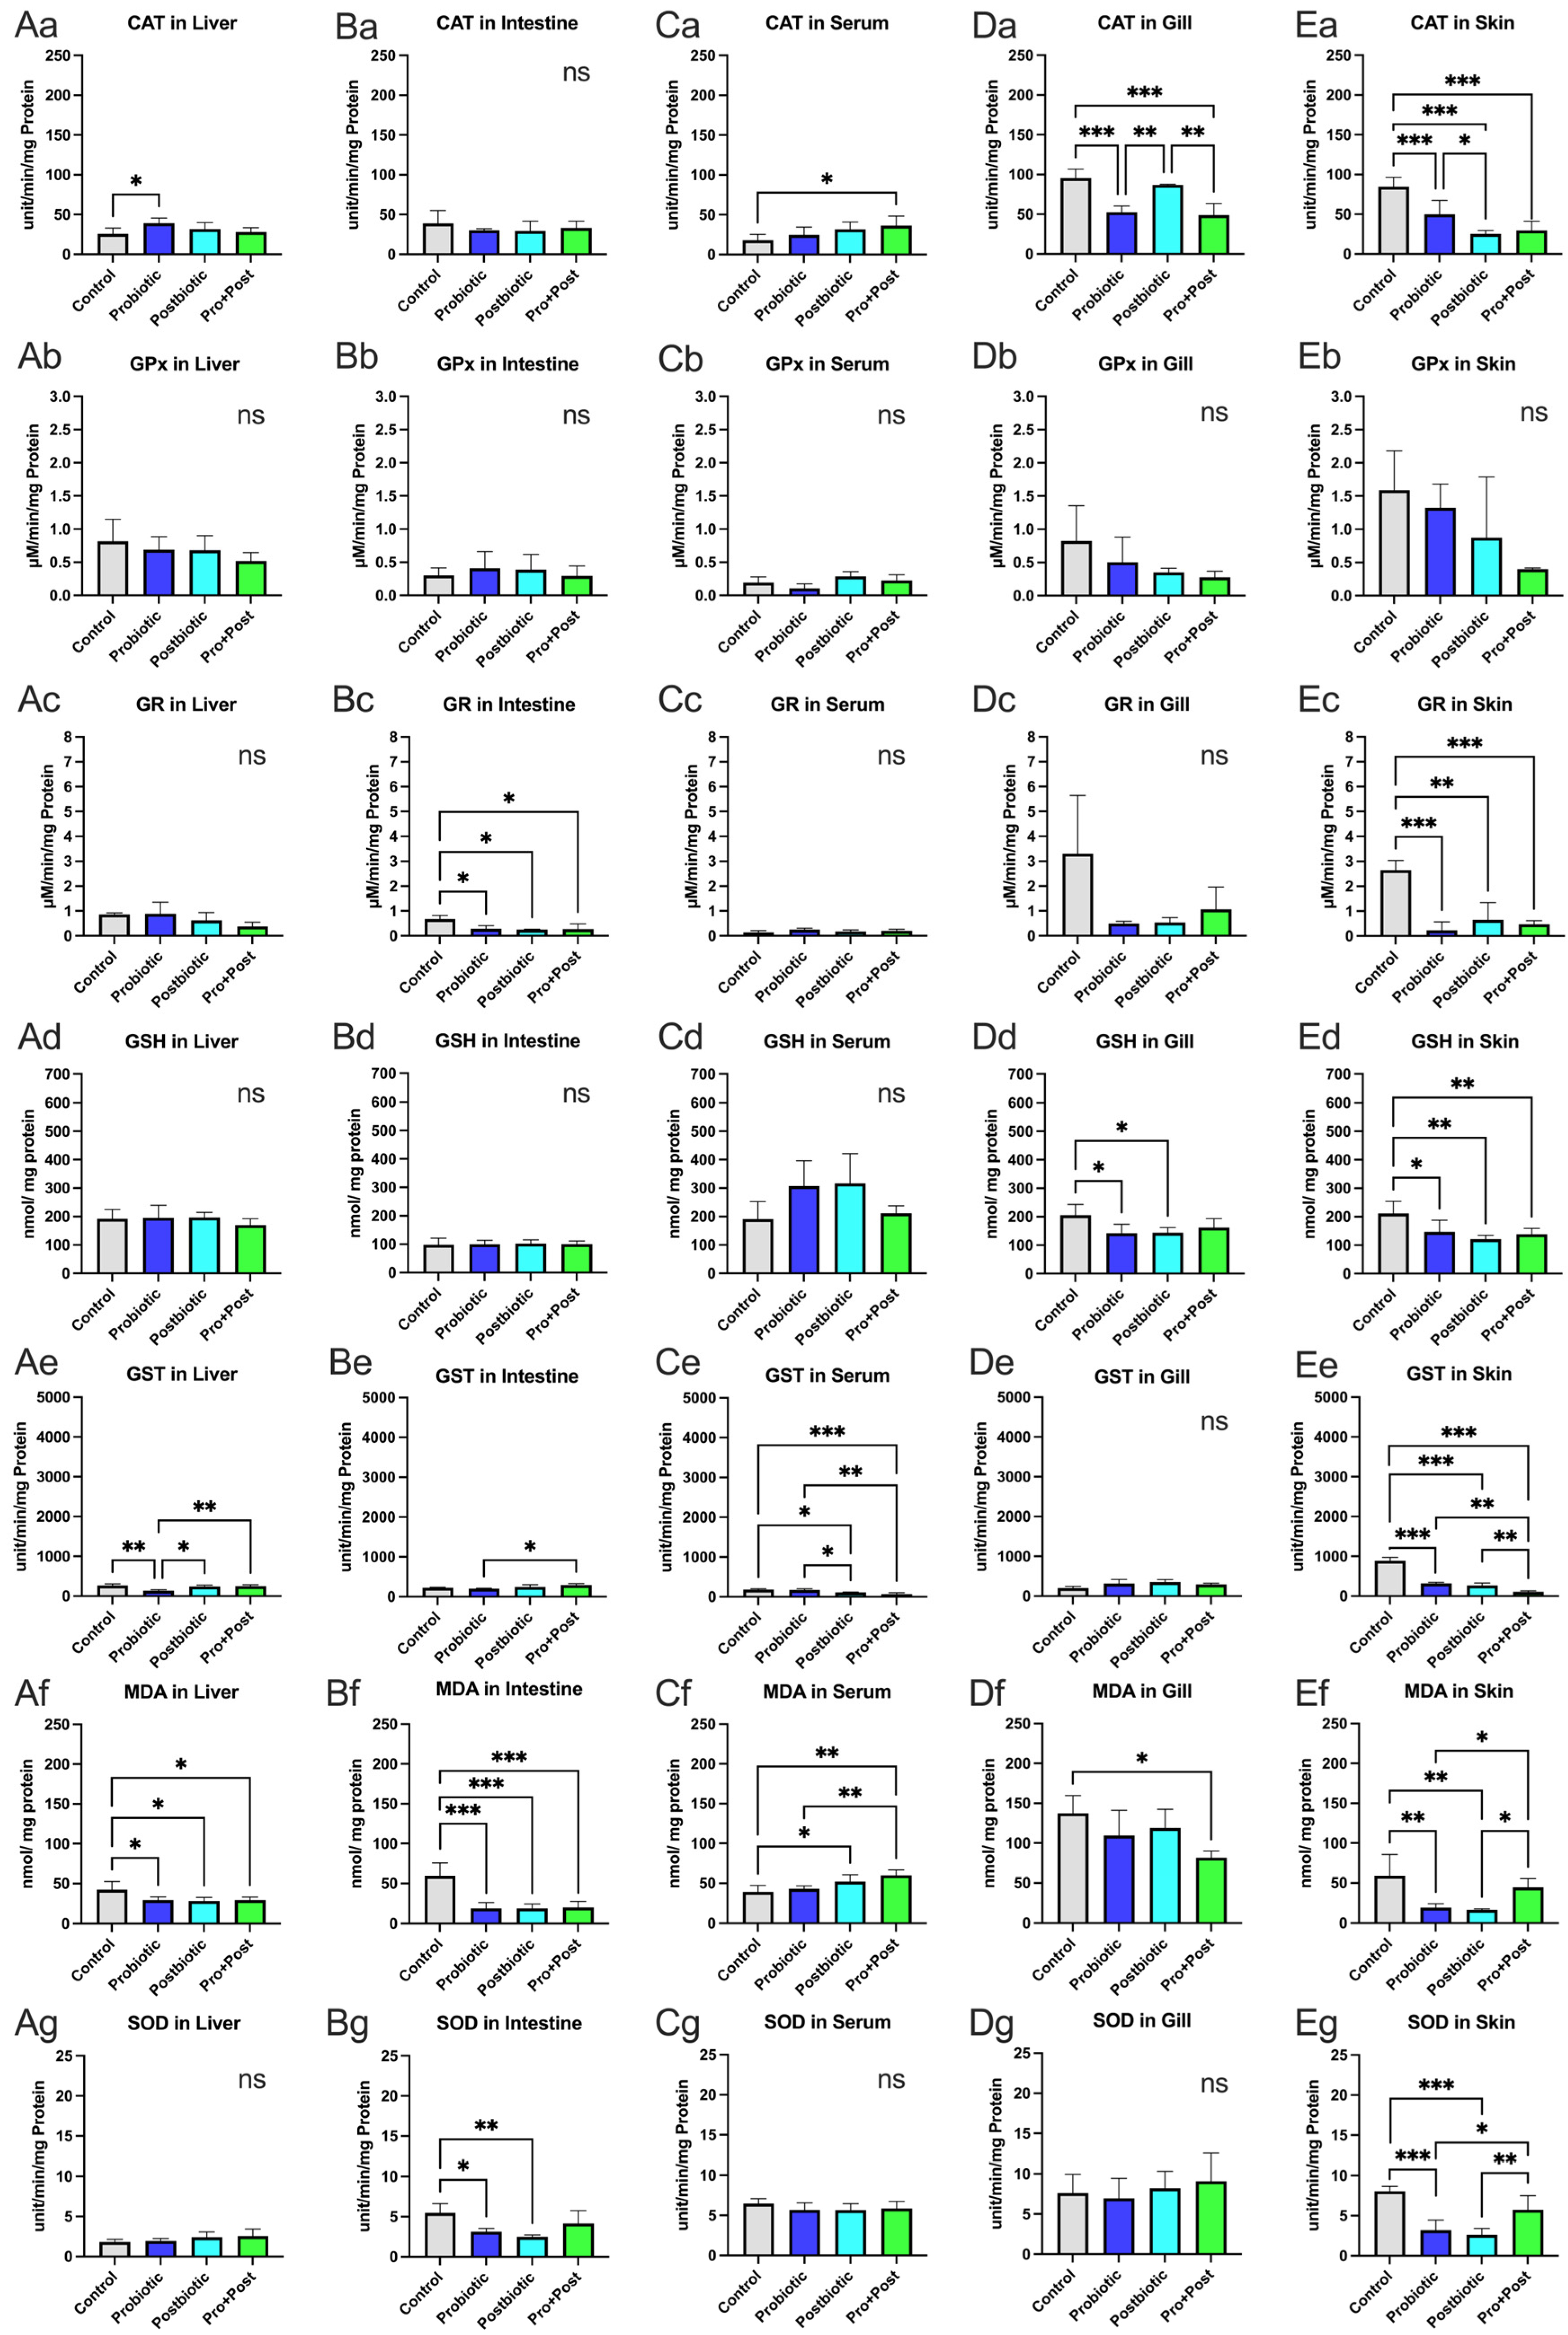
3.3. Responses of Oxidative Stress and Antioxidant Activity

3.3.1. Liver

The GPx, GR, and SOD activities and the GSH level in the liver showed no significant differences among the treatments (p > 0.05). CAT activity was significantly higher in the Probiotic group compared to the Control (p < 0.05), with a peak of 39.12 ± 6.45 units/min/mg protein. The Control group had the highest GST and MDA levels. GST was significantly lower in the Probiotic group compared to the Control, Postbiotic, and Pro + Post groups (p < 0.01; p < 0.05). All B. subtilis AAHM-BS2360-treated groups showed significant reduction in MDA levels compared to the Control group (p < 0.05). The graphical details are presented in Figure 3(Aa–Ag).

3.3.2. Intestine

The MDA levels in the intestine were highest in the Control group (59.28 ± 16.37 nmol/mg protein) and significantly differed from all treatments (p < 0.001). The GR and SOD levels were also highest in the Control group, with significant differences from other groups (p < 0.05; p < 0.01). The Pro + Post group showed a significant increase in GST activity (294.1 ± 31.26 units/min/mg protein) compared to the Probiotic group (p < 0.05). No significant differences were found in CAT and GPx activities and GSH levels across the treatments (p > 0.05) (Figure 3(Ba–Bg)).

3.3.3. Serum

The GPx, GR, and SOD activities and GSH level showed no significant differences among groups (p > 0.05). The Pro + Post group showed the highest CAT activity and MDA level (36.3 ± 11.93 units/min/mg protein; 59.97 ± 6.68 nmol/mg protein), significantly higher than the Control (p < 0.05; p < 0.01) and Probiotic groups (p < 0.01). The Postbiotic group also showed higher MDA level than the Control group (p < 0.05). For GST, the Control group had significantly higher values than the Postbiotic and Pro + Post groups (p < 0.05; p < 0.001), while the Probiotic group showed the highest GST activity (173.5 ± 29.31 nM/min/mg protein), significantly exceeding Postbiotic and Pro + Post treatments (p < 0.05; p < 0.01) (Figure 3(Ca–Cg)).

3.3.4. Gills

The Control group showed the highest CAT activity (95.43 ± 11.31 units/min/mg protein), significantly exceeding those in the Probiotic and Pro + Post groups (p < 0.001). The Postbiotic group also had significantly higher CAT activity than the Probiotic and Pro + Post groups (p < 0.01). GSH levels in the Control group differed significantly from the Probiotic and Postbiotic groups (p < 0.05), while MDA was significantly higher than in the Pro + Post group (p < 0.05). No significant differences were found in GPx, GR, GST, and SOD across the treatments (p > 0.05) (Figure 3(Da–Dg)).

3.3.5. Skin

Oxidative status in the skin showed that the Control group had the highest values for most parameters, except GPx, which showed no significant differences across the treatments (0.39–1.58 µM/min/mg protein; p > 0.05). CAT activities were significantly higher in the Control group compared to all groups (p < 0.001), with the Probiotic group also higher than the Postbiotic group (p < 0.05).
GR activity and GSH level followed a similar trend, with the Control group significantly higher than all other treatments (p < 0.05; p < 0.01; p < 0.001). For GST, the Control group (888.2 ± 86.23 nM/min/mg protein) was significantly higher than all B. subtilis AAHM-BS2360-treated groups (p < 0.001), and the Probiotic and Postbiotic groups differed from the Pro + Post group (p < 0.01). In MDA and SOD, the Control and Pro + Post group showed significantly higher values than the Probiotic and Postbiotic groups (p < 0.05; p < 0.01; p < 0.001) (Figure 3(Ea–Eg)).

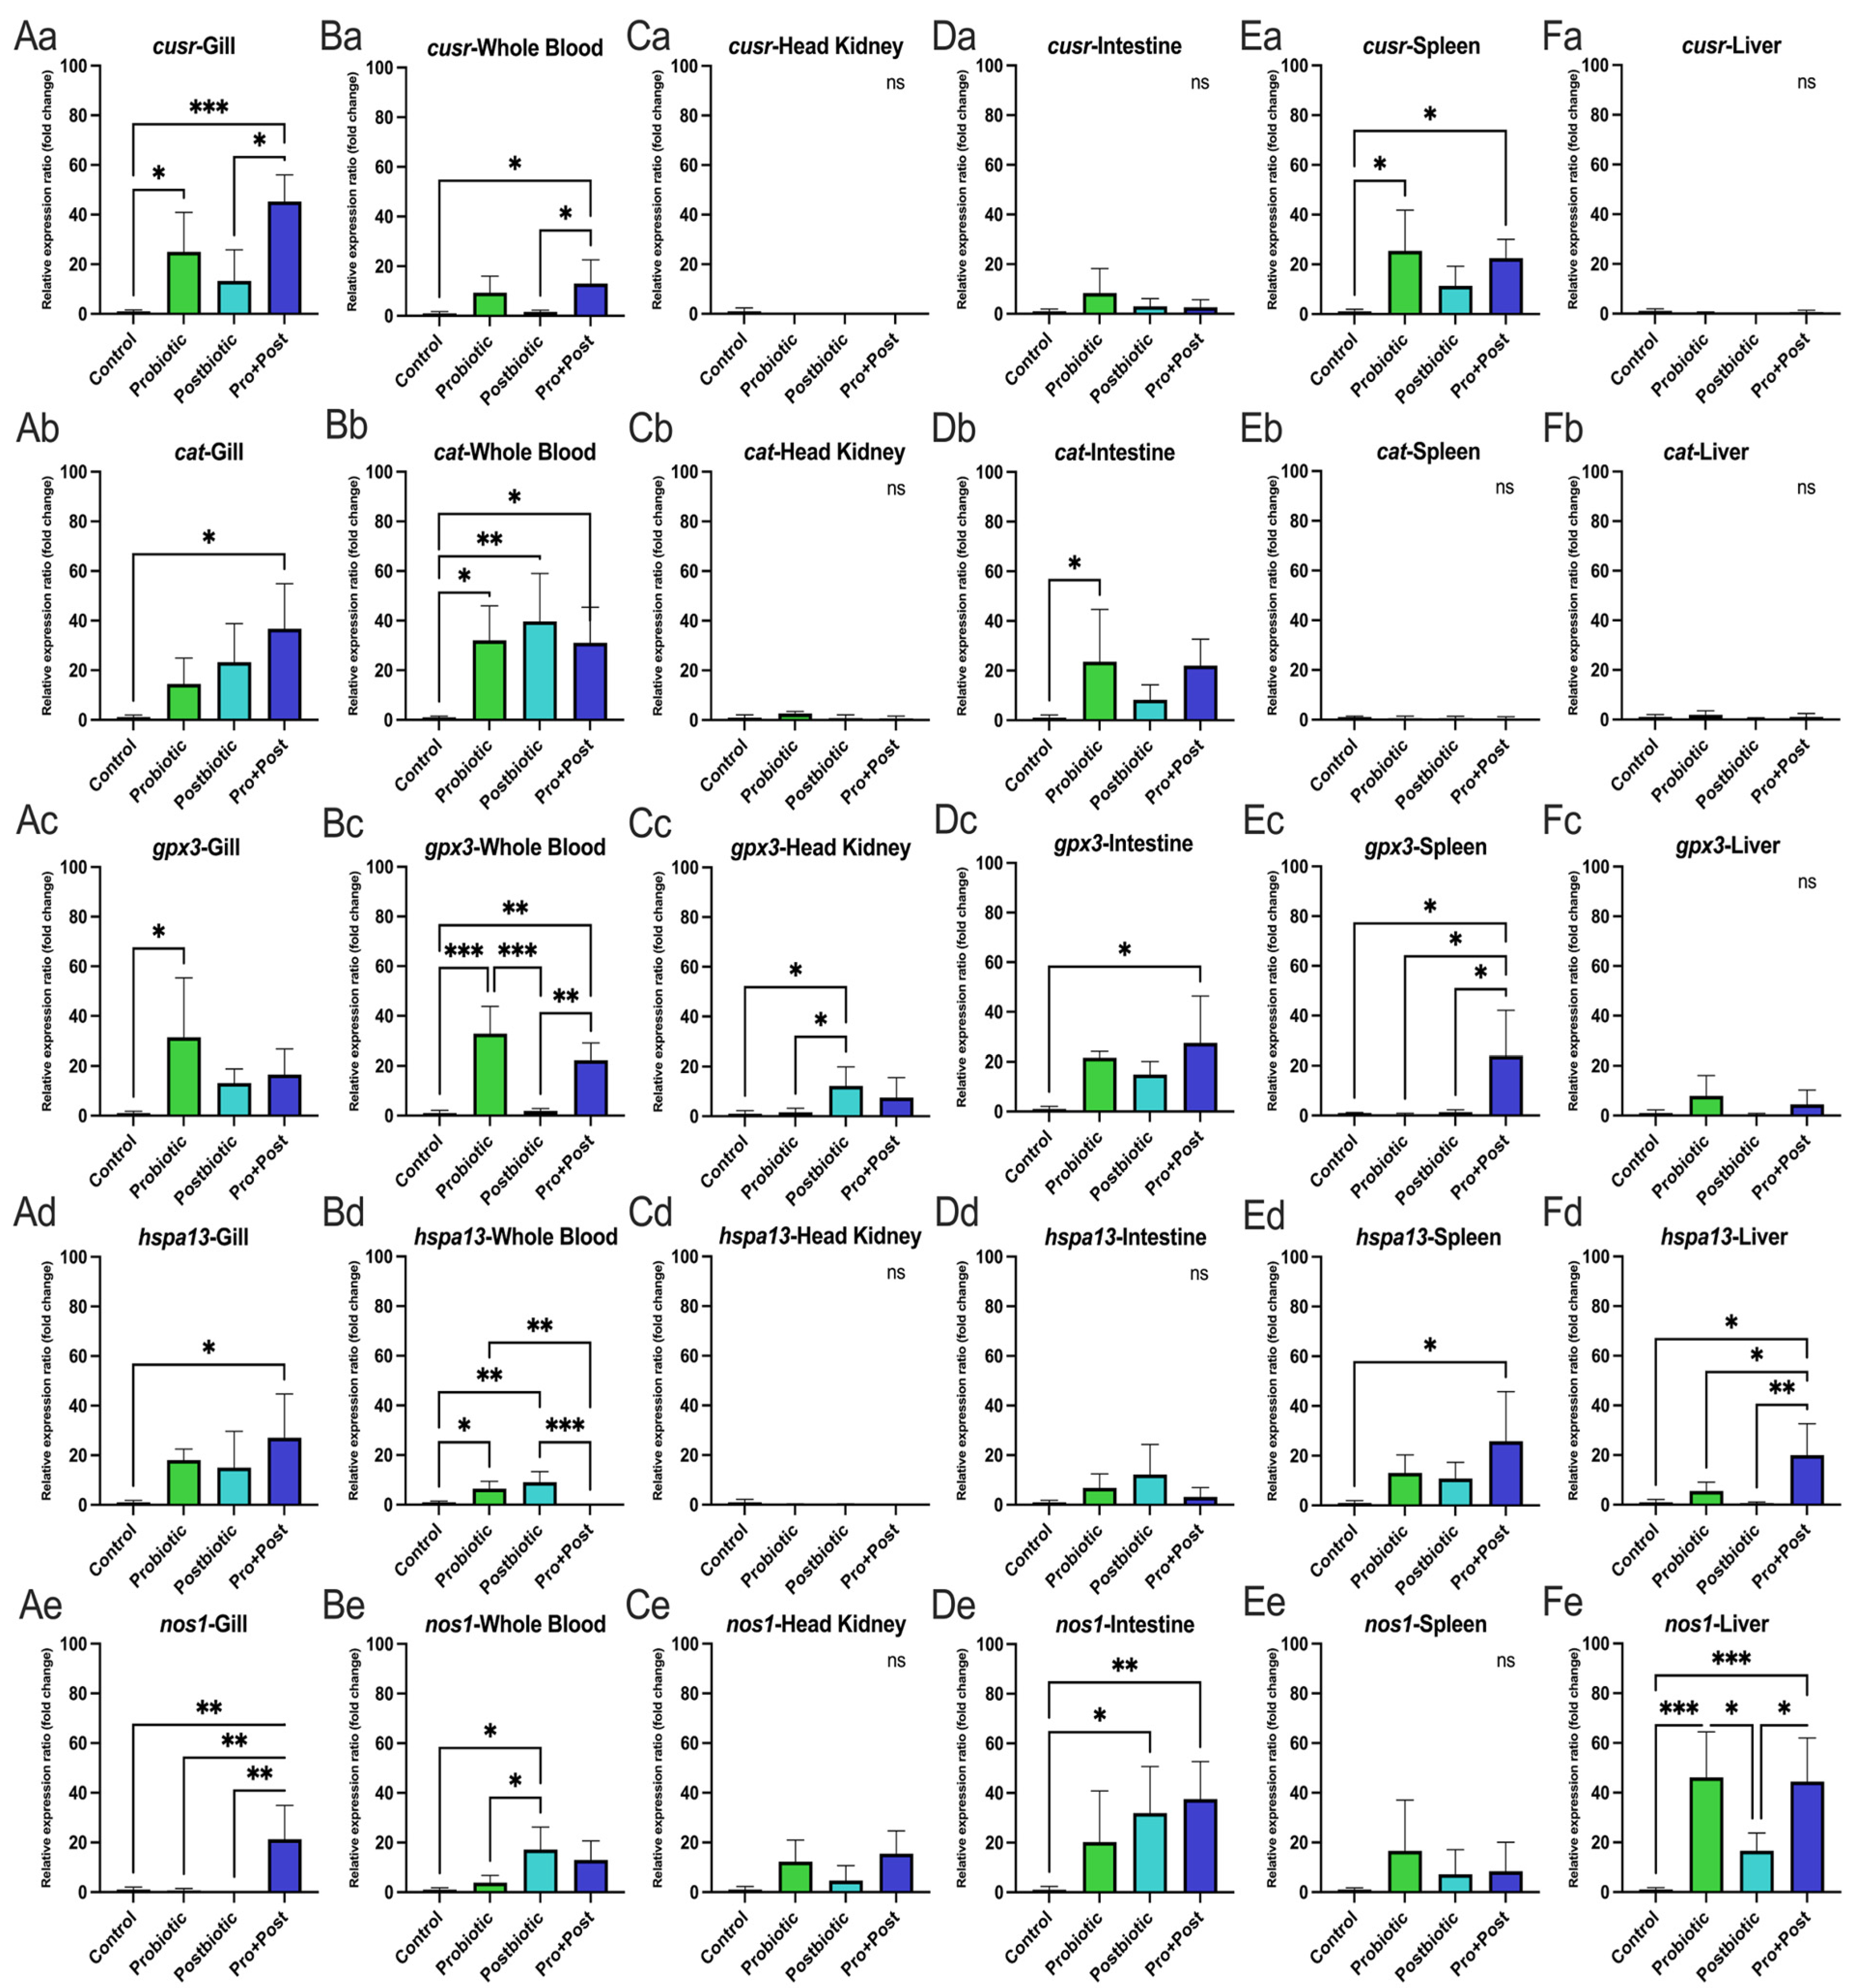
3.4. Oxidative Stress and Antioxidant-Related Gene Expression

3.4.1. Following a 30-Day Supplementation with Probiotic, Postbiotic, and Their Combination Derived from B. subtilis AAHM-BS2360

The Pro + Post group showed significant upregulation of cusr gene expression in the gill and whole blood compared to the Control and Postbiotic group (p < 0.05; p < 0.001), as well as significantly higher in the spleen compared to the Control group (p < 0.05). The Probiotic group showed increased cusr expression in the gills and spleen compared to the Control group (p < 0.05) (Figure 4(Aa,Ba,Ea)). No significant differences were observed in the head kidney, intestine, or liver across treatments (p > 0.05) (Figure 4(Ca,Da,Fa)).
In whole blood, all B. subtilis AAHM-BS2360-based treatments (Probiotic, Postbiotic, Pro + Post) showed higher cat expression compared to the Control group (p < 0.05; p < 0.01). In the gills, the Pro + Post group showed a significant increase of cat gene over the Control (p < 0.05), while in the intestine, the Probiotic group exhibited significant upregulation compared to the Control group (p < 0.05) (Figure 4(Ab,Bb,Db)). No significant differences were observed in the head kidney, spleen, or liver (p > 0.05) (Figure 4(Cb,Eb,Fb)).
Expression of the antioxidant-related gpx3 gene showed no significant differences in the liver across treatments (p > 0.05) (Figure 4(Fc)). However, the Probiotic group showed significant gpx3 upregulation in the gills (p < 0.05) compared to the Control group and in whole blood compared to the Control and Postbiotic groups (p < 0.001). The Pro + Post group also showed higher gpx3 expression in whole blood compared to the Postbiotic and Control groups (p < 0.01). In the head kidney, the Postbiotic group had significantly higher gpx3 expression than the Control and Probiotic groups (p < 0.05). The Pro + Post group showed elevated gpx3 expression in the intestine and spleen compared to the Control group and other treatments, respectively (p < 0.05) (Figure 4(Ac,Bc,Cc,Dc,Ec)).
The Pro + Post group showed significant upregulation of the hspa13 gene in the gill, spleen, and liver compared to the Control group (p < 0.05). In the liver, hspa13 expression was also significantly higher in the Pro + Post group than in the Probiotic and Postbiotic groups (p < 0.05; p < 0.01). In whole blood, the Probiotic and Postbiotic groups had significantly higher hspa13 expression than both the Control and Pro + Post groups (p < 0.05; p < 0.001) (Figure 4(Ad,Bd,Ed,Fd)). No significant differences were observed in the head kidney and intestine (p > 0.05) (Figure 4(Cd,Dd))
As shown in Figure 4(Ce,Ee), nos1 expression showed no significant differences in the head kidney and spleen across treatments (p > 0.05). In the gills, the Pro + Post group showed significantly higher nos1 expression than all other groups (p < 0.01). In whole blood, the Postbiotic group had the highest nos1 expression, significantly exceeding the Control and Probiotic groups (p < 0.05). In the intestine, both Pro + Post and Postbiotic groups showed elevated nos1 expression compared to the Control group (p < 0.01; p < 0.05). In the liver, nos1 was significantly upregulated in the Probiotic and Pro + Post groups compared to the Control and Postbiotic groups (p < 0.05; p < 0.001) (Figure 4(Ae,Be,De,Fe)).

3.4.2. Post-Challenge with E. tarda

In whole blood, cusr expression was significantly higher in all treated groups compared to the Control group (p < 0.05). Similarly, gpx3 and nos1 were significantly upregulated in the Postbiotic group compared to all other treatments (p < 0.05; p < 0.01; p < 0.001). For hspa13, the Postbiotic group showed significantly higher expression than the Pro + Post and Control groups, while the Probiotic group also showed increased hspa13 expression compared to the Control group (p < 0.05; p < 0.01) (Figure 5A,G,J,M). Expression of the cat gene showed no significant differences among treatments (p > 0.05) (Figure 5D).
In the intestine, only the hspa13 gene was significantly upregulated in the Postbiotic group compared to the Control and Probiotic groups (p < 0.05; p < 0.01), while the Pro + Post group also showed higher hspa13 expression than Control (p < 0.05) (Figure 5K). No significant differences were observed in cusr, cat, gpx3, or nos1 expression in the intestine across treatments (p > 0.05) (Figure 5B,E,H,N).
In the head kidney, cusr and cat gene expression showed no significant differences among treatments (p > 0.05) (Figure 5C,F). However, the gpx3 gene was significantly upregulated in the Postbiotic group compared to the Probiotic and Control groups (p < 0.05). Both Postbiotic and Pro + Post groups showed increased hspa13 expression compared to the Control group (p < 0.01; p < 0.001), with the Pro + Post group also differing significantly from the Probiotic group (p < 0.01). Notably, nos1 expression was significantly elevated in the Pro + Post group compared to all other treatments (p < 0.01, p < 0.001) (Figure 5I,L,O).

3.5. Non-Specific Immune-Related Gene Expression

3.5.1. Following a 30-Day Supplementation with Probiotic, Postbiotic, and Their Combination Derived from B. subtilis AAHM-BS2360

All treatments containing B. subtilis AAHM-BS2360 significantly upregulated lygl1 genes in the gills compared to the Control group (p < 0.01; p < 0.001). The Pro + Post group showed the strongest activation of tgfb and tnf compared to all treatment groups (p < 0.05; p < 0.01; p < 0.001). For b2ml, the Pro + Post group showed significantly higher expression than the Control and Probiotic group (p < 0.01). The Postbiotic group also upregulated tnf gene compared to the Control group (p < 0.05) (Figure 6A,G,M,S).
No significant differences in lygl1 expression were observed in whole blood and liver across treatments (p > 0.05). In the intestine, the Pro + Post group showed the highest lygl1 expression compared to all groups (p < 0.01; p < 0.001). In the head kidney, the Probiotic group had the highest lygl1 expression (p < 0.05; p < 0.01), while in the spleen, the Postbiotic group showed significantly elevated lygl1 gene expression compared to all other treatments (p < 0.05; p < 0.01) (Figure 6B–F).
For the tgfb gene, the Probiotic group showed significantly higher expression in the head kidney compared to the Pro + Post group (p < 0.05). A similar pattern was seen in the liver, where tgfb expression was higher in the Probiotic group than in the Control and Pro + Post groups (p < 0.01; p < 0.05). No significant differences were observed in whole blood, intestine, or spleen across treatments (p > 0.05) (Figure 6I–L).
In the liver, no significant differences were found in tnf and b2ml expression across treatments (p > 0.05) (Figure 6R,X). The Postbiotic group showed significant upregulation of tnf in whole blood, head kidney, and intestine compared to the Control group (p < 0.05; p < 0.01; p < 0.001), and exceeded the Probiotic group in whole blood (p < 0.05) and the Pro + Post group in the head kidney (p < 0.001). The Probiotic and Pro + Post groups showed significant upregulation of tnf gene in head kidney, spleen, and intestine compared to each Control group, respectively (p < 0.01; p < 0.05) (Figure 6N–Q).
The b2ml gene expression was significantly higher in the Postbiotic group compared to the Control group in whole blood (p < 0.05). The Probiotic group showed upregulated b2ml in the head kidney and intestine compared to the Control group (p < 0.05; p < 0.01) and was also significantly higher than both Postbiotic and Pro + Post groups in the head kidney (p < 0.05). In the spleen, b2ml was significantly upregulated in the Probiotic group compared to the Control group (p < 0.05), while the Pro + Post group showed the highest b2ml expression, significantly exceeding the Control and Postbiotic groups (p < 0.01) (Figure 6T–W).

3.5.2. Post-Challenge with E. tarda

In whole blood, lygl1 expression was significantly higher in the Postbiotic group compared to the Control and Probiotic groups (p < 0.05), while tgfb, tnf, and b2ml showed no significant differences among treatments (Figure 7A,D,G,J).
In the intestine, lygl1 expression was highest in the Postbiotic group, significantly exceeding all other treatments (p < 0.01; p < 0.001). The tgfb expression was significantly elevated in both the Postbiotic and Pro + Post groups compared to the Control and Probiotic groups (p < 0.01). The tnf gene expression was also significantly upregulated in the Probiotic and Postbiotic groups compared to the Control group (p < 0.05). However, b2ml expression showed no significant differences among treatments (p > 0.05) (Figure 7B,E,H,K). In the head kidney, no significant changes were observed in any immune gene expression across treatment groups (p > 0.05) (Figure 7C,F,I,L).

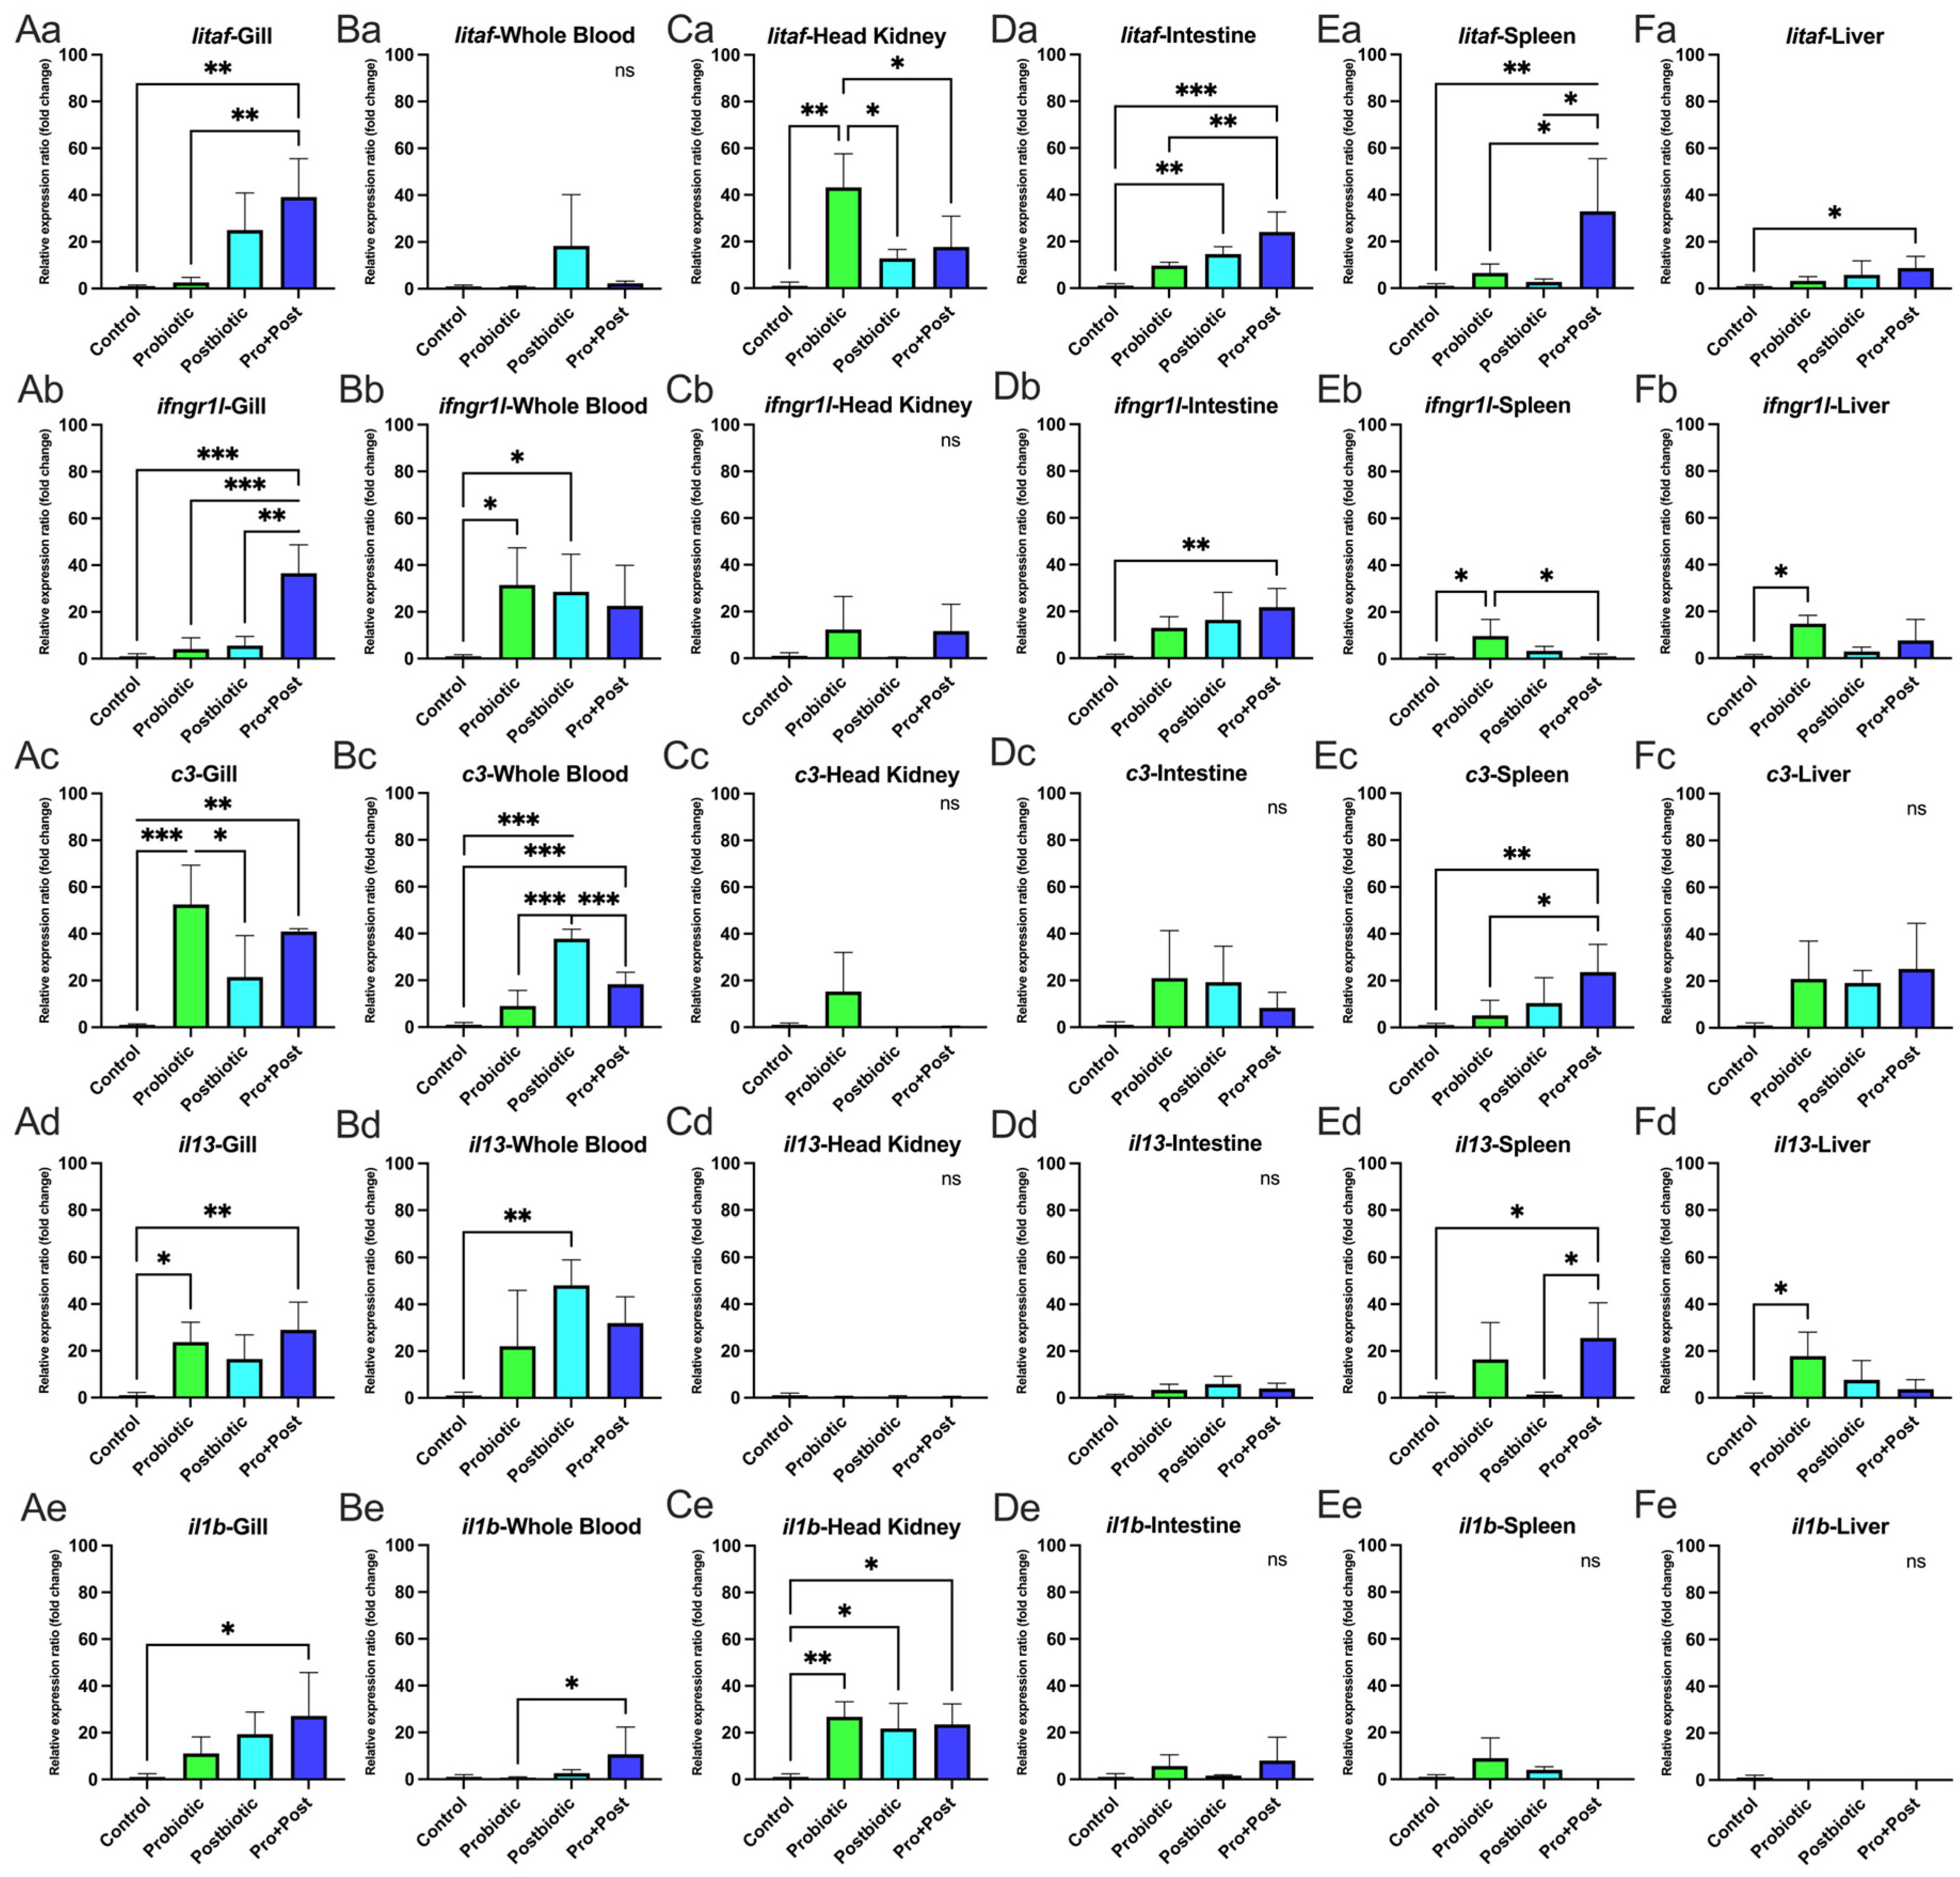
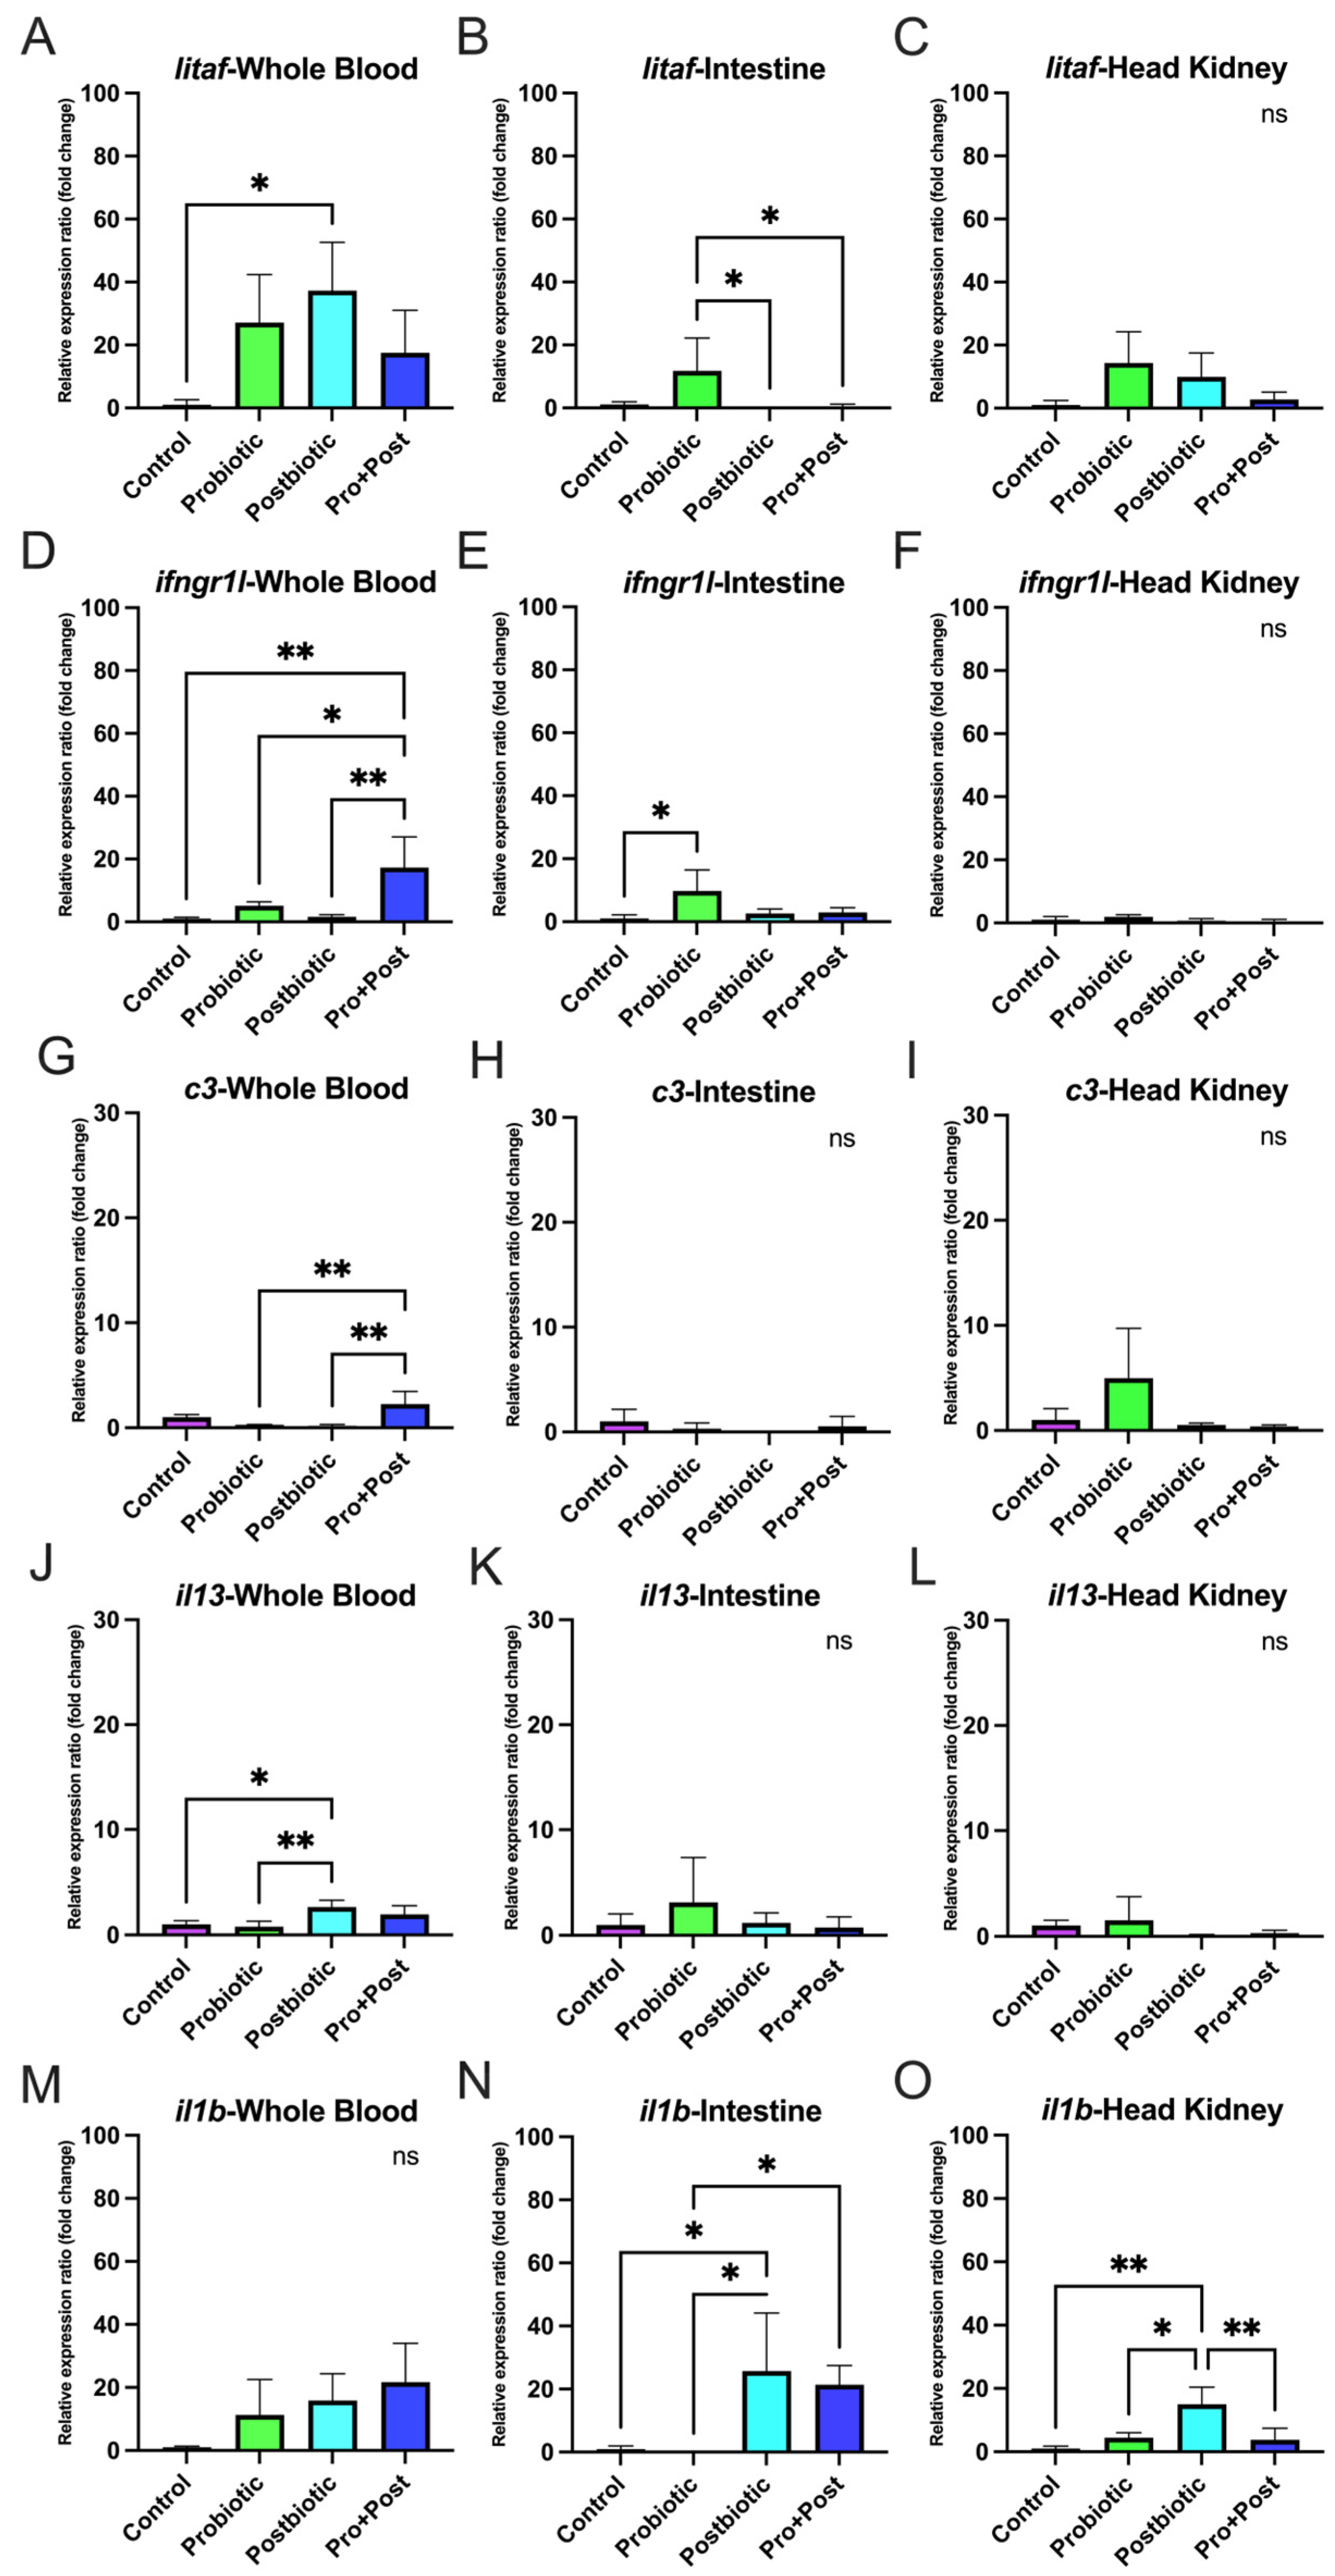
3.6. Proinflammatory-Related Gene Expression

3.6.1. Following a 30-Day Supplementation with Probiotic, Postbiotic, and Their Combination Derived from B. subtilis AAHM-BS2360

No significant differences in expression were observed for litaf in whole blood, ifngr1l in the head kidney, c3 in the head kidney, intestine, and liver, il13 in the head kidney and intestine, or il1b in the intestine, spleen, and liver (p > 0.05) (Figure 8(Ba,Cb–Cd,Dc–De,Ee,Fc,Fe)).
The Pro + Post group showed significantly higher litaf expression than the Control group in the gill, intestine, spleen, and liver (p < 0.05; p < 0.01; p < 0.001). Compared to the Probiotic group, litaf was also significantly upregulated in the Pro + Post group in the gill, intestine, and spleen (p < 0.05; p < 0.01). In the spleen, litaf expression in the Pro + Post group was significantly higher than in the Postbiotic group (p < 0.05). In the head kidney, the Probiotic group dominated significantly litaf expression compared to other groups (p < 0.05; p < 0.01), while in the intestine, the Postbiotic group exhibited substantially higher litaf expression than the Control group (p < 0.01). Detailed graphs of litaf gene are presented in Figure 8(Aa,Ca,Da,Ea,Fa).
The Pro + Post group showed significantly elevated ifngr1l expression in the gills compared to other groups (p < 0.01; p < 0.001) and in the intestine compared to the Control group (p < 0.01). The Probiotic group exhibited increased ifngr1l expression in whole blood, spleen, and liver to the Control group (p < 0.05) and showed higher expression in the spleen than the Pro + Post group (p < 0.05). Additionally, the Postbiotic group displayed significantly upregulated ifngr1l expression in whole blood compared to the Control (p < 0.05) (Figure 8(Ab,Bb,Db,Eb,Fb)).
In the gills, c3 expression was significantly elevated in the Probiotic and Pro + Post groups compared to the Control group (p < 0.01; p < 0.001), with the Probiotic group also showing higher expression than the Postbiotic group (p < 0.05). In whole blood, the Postbiotic group exhibited the highest c3 expression, surpassing to other treatments (p < 0.001), while the Pro + Post group also showed significantly higher expression than Control (p < 0.001). In the spleen, c3 expression was significantly upregulated in the Pro + Post group compared to the Probiotic and Control groups (p < 0.05; p < 0.001) (Figure 8(Ac,Bc,Ec)).
The il13 gene was significantly upregulated in the gills and liver of the Probiotic group compared to the Control group (p < 0.05). In the gills, the Pro + Post group also showed higher il13 expression than the Control group (p < 0.01). In whole blood, the Postbiotic group had significantly elevated il13 expression compared to the Control group (p < 0.01), while the Pro + Post group showed higher expression than both the Control and Postbiotic groups (p < 0.05) (Figure 8(Ad,Bd,Ed,Fd)).
In the gills, il1b expression was significantly upregulated in the Pro + Post group compared to the Control group (p < 0.05). In whole blood, il1b expression in the Pro + Post group differed significantly from the Probiotic group (p < 0.05). In the head kidney, all B. subtilis AAHM-BS2360-based treatments (Probiotic, Postbiotic, and Pro + Post) showed significantly higher il1b expression compared to the Control group (p < 0.05; p < 0.01) (Figure 8(Ae,Be,Ce)).

3.6.2. Post-Challenge with E. tarda

In whole blood, the Postbiotic group showed significantly higher litaf and il13 expression than the Control group (p < 0.05), and the il13 gene was also significantly elevated compared to the Probiotic group (p < 0.01). The Pro + Post group significantly upregulated ifngr1l (p < 0.01; p < 0.05) and c3 (p < 0.01) compared to other treatments. No significant differences in il1b expression were observed across treatments in whole blood (p > 0.05) (Figure 9A,D,G,J,M).
In the intestine, the Probiotic group significantly increased litaf expression compared to the Postbiotic and Pro + Post groups (p < 0.05), and ifngr1l compared to the Control group (p < 0.05). The Postbiotic group significantly upregulated il1b compared to the Control and Probiotic groups, while the Pro + Post group also showed higher il1b expression than the Probiotic group (p < 0.05). No significant differences were found in c3 and il13 expression in the intestine (p > 0.05) (Figure 9B,E,H,K,N). The investigation revealed that the gene expression levels of litaf, ifngr1l, c3, and il13 in all treatment groups were not significantly different (p > 0.05), which was a notable observation in the head kidney. However, a significant upregulation of the il1b gene was observed in the Postbiotic treatment group in comparison to all alternative treatments (p < 0.05; p < 0.01) (Figure 9C,F,I,L,O).

3.7. Growth-Related Gene Expression

The results of the qRT-PCR analysis revealed a significant increase in the activity of the igf1 gene in the Probiotic treatment group in comparison to the Control and Postbiotic treatments (p < 0.05) (Figure 10A). However, the gh1 gene expression did not show significant differences in all treatments (p > 0.05) (Figure 10B).

3.8. Growth Performance Analysis

The Probiotic and Pro + Post treatment groups significantly increased the SGR value compared with the Control group (p < 0.05). The Pro + Post group had a significantly higher ADG value than the Control group (p < 0.05). Despite the absence of a statistically significant difference in FCR values across all treatments (p > 0.05), the group’s treatment containing B. subtilis AAHM-BS2360 exhibited superior performance in terms of growth and feed efficiency, as evidenced by the average values. The data are presented in Table 2.

3.9. Histopathology

The histopathological examination of the gills demonstrated the absence of proliferation and hyperplasia of mucous cells, characterized by a normal lamellae structure. (Figure 11A–D). The liver analysis revealed unremarkable hepatocyte nuclei and an absence of congestion in the sinusoids, though low levels of hydropic degeneration were observed (Figure 11E–H). The head kidney exhibited normal conditions devoid of inflammation or necrosis of the hematopoietic tissue (Figure 11I–L). The melano-macrophage centers (MMC) in the spleen exhibited immune response activity in all treatments, devoid of any observed congestion or lymphoid depletion (Figure 11M–P). The intestinal villi were observed to be intact, characterized by a clear epithelial lining and goblet cells. This observation is indicative of optimal tissue health and structural integrity (Figure 11Q–T).

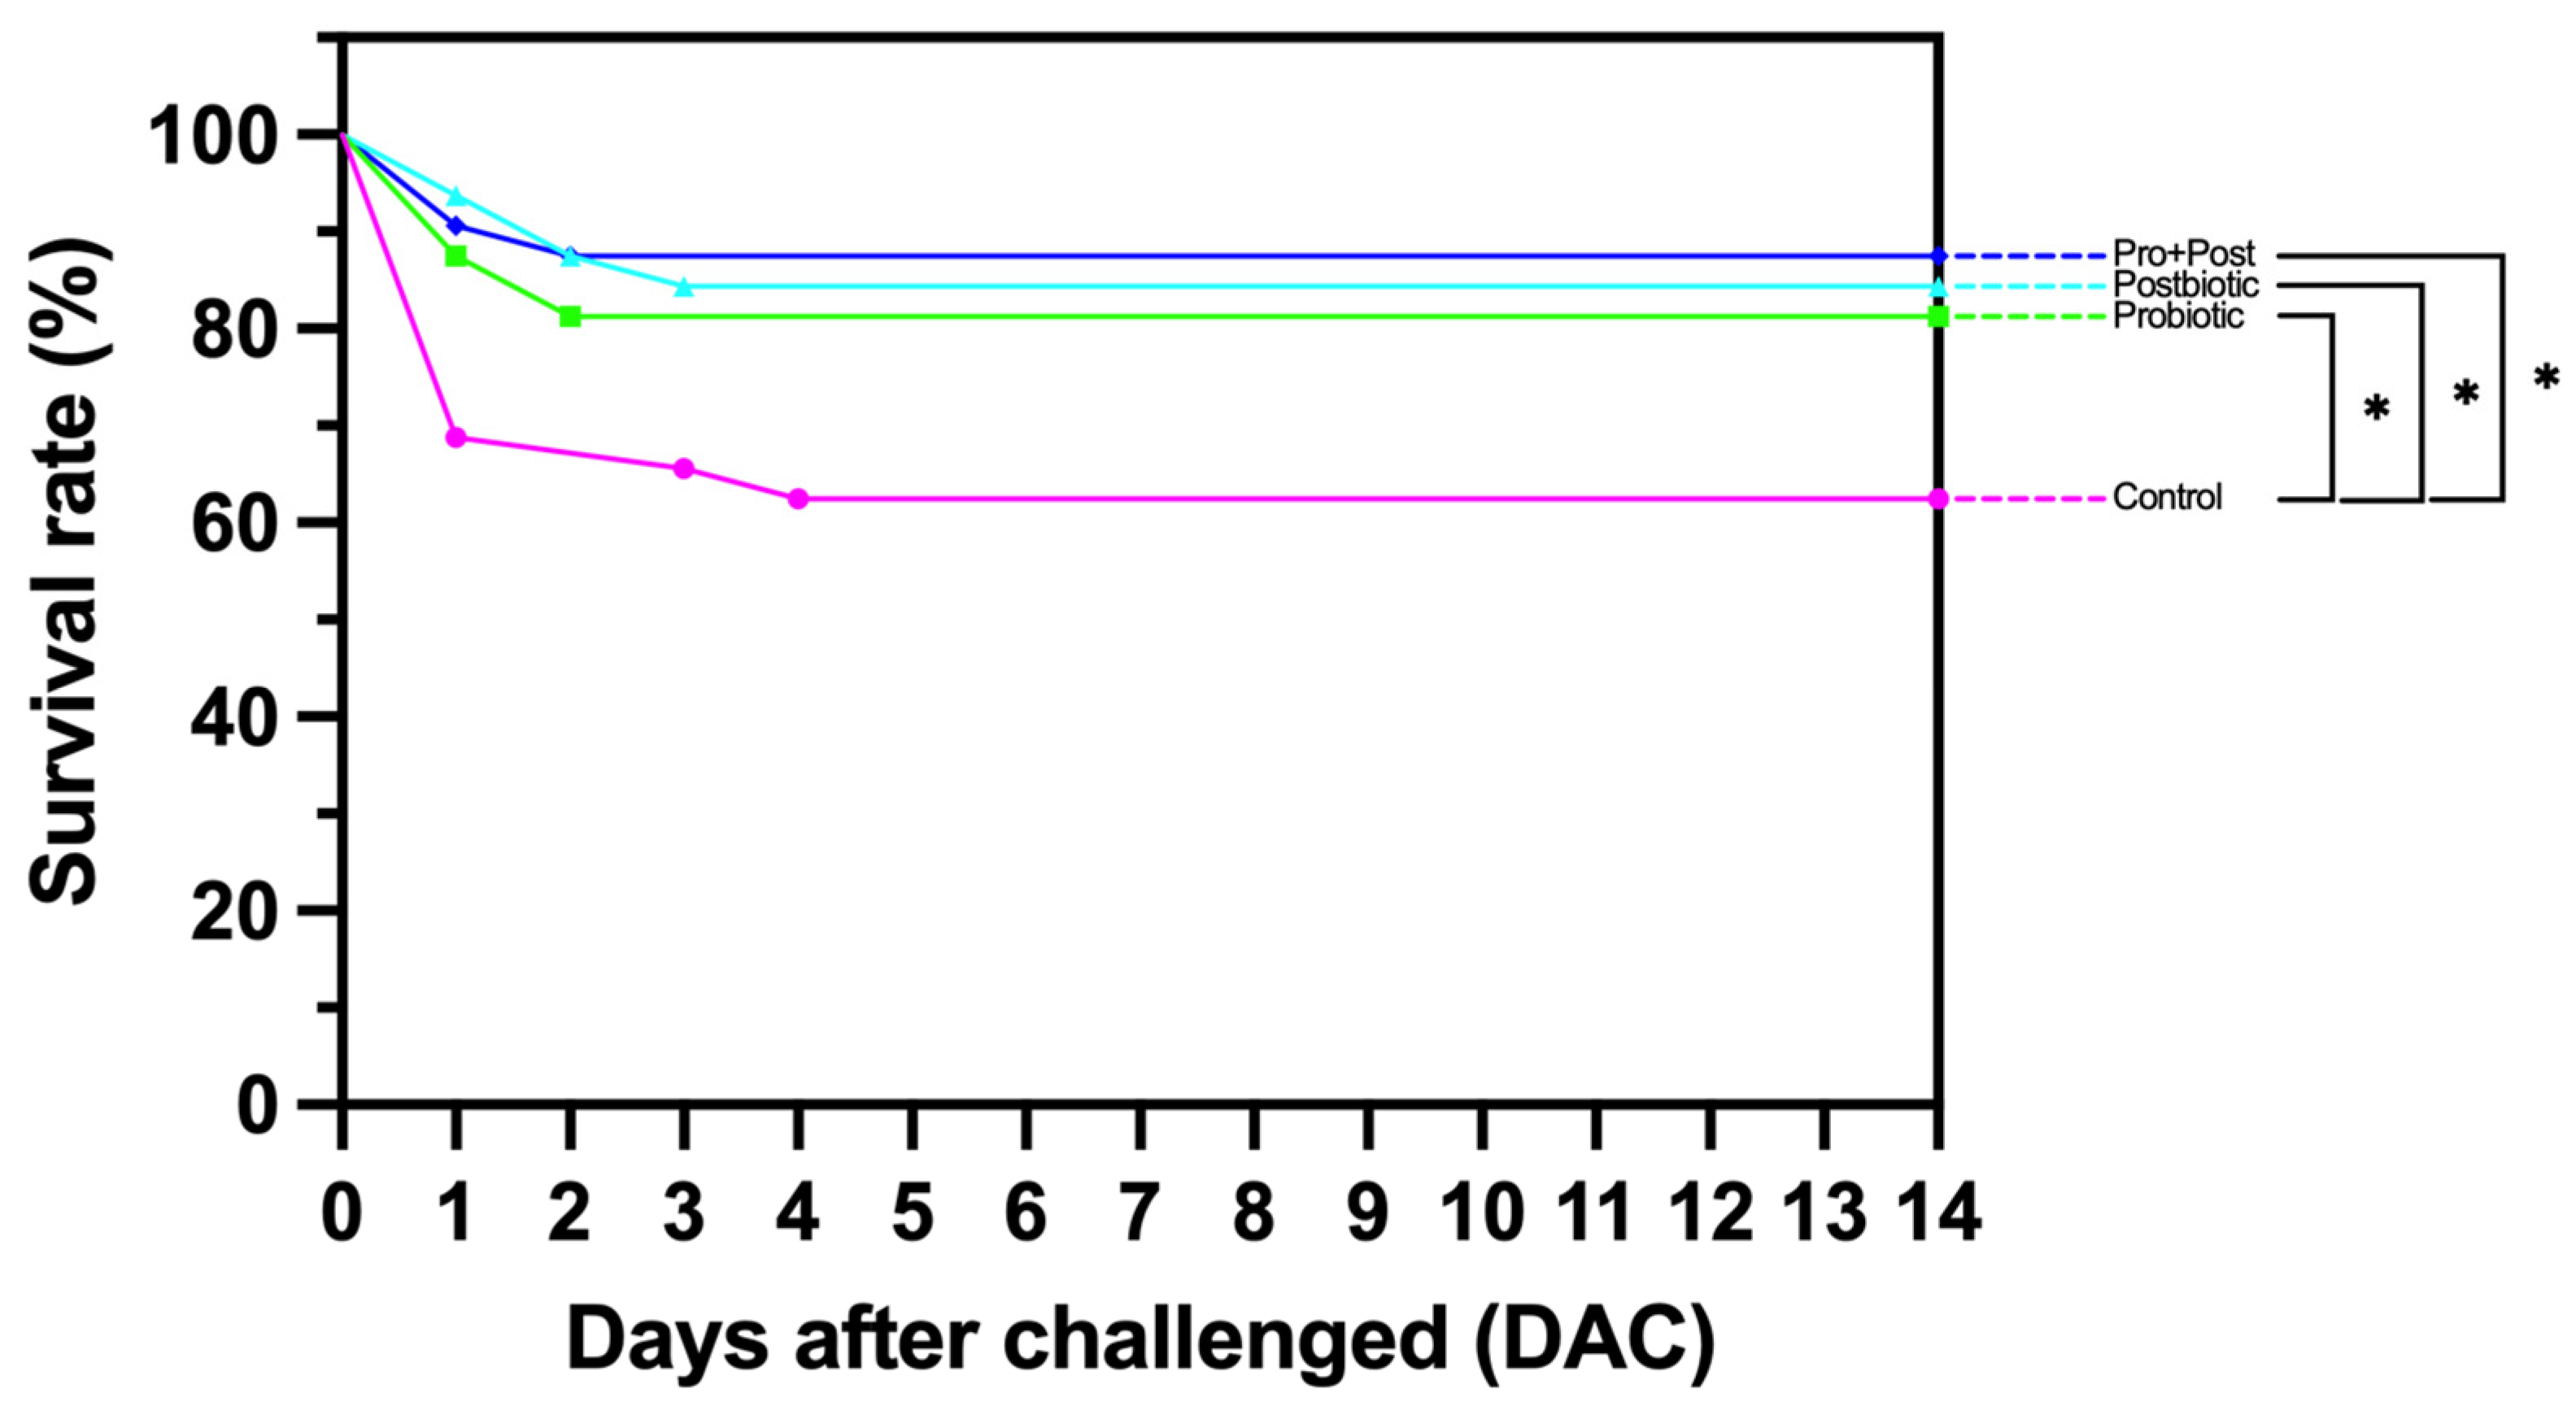
3.10. Survival Rate Analysis Following Post-Challenge Against E. tarda

The survival rate analysis revealed that the Pro + Post treatment group exhibited the highest survival rate of 87.5%, which was significantly different from the Control group with a value of 62.5% (p < 0.05). The Postbiotic and Probiotic groups demonstrated a survival rate of 84.37% and 81.25%, respectively, which was significantly different from the Control group (p < 0.05) (Figure 12).

4. Discussion

This study demonstrates the potential of Bacillus subtilis AAHM-BS2360 and its postbiotic metabolites as functional feed additives that improve growth performance, modulate immune responses, and reduce oxidative stress in P. hypophthalmus challenged with Edwardsiella tarda. No significant alterations in most serum biochemical parameters suggest that B. subtilis AAHM-BS2360 and its derivatives are safe and non-toxic. Serum biochemical profiles provide valuable information regarding the health status of pangasius and act as a monitoring tool for significant physiological stress or organ dysfunction in pangasius [33,34]. However, a noteworthy exception was observed for the AST/ALT ratio, which exhibited a considerable increase in the Postbiotic group, primarily attributable to the markedly augmented levels of AST as opposed to the comparatively lower levels of ALT.
In addition, a low range of ALT levels was also found in the 10 mg/kg ethanolic Kratom crude extract treatment in tilapia, the multivalent oral vaccine hydrogel in Asian seabass, and the treatment yeast extract supplemented feed in pangasius [29,35,36]. An increase in the AST/ALT ratio may reflect a transient hepatic response to bioactive compounds. Elevated AST/ALT ratios have been linked to an increase in oxidative stress conditions in the liver of fish and show the accumulation of microvacuoles, indicating lipid deposits in the liver [37,38]. Lipid peroxidase is closely associated with oxidative stress conditions. The extent of damage can be quantified by measuring malondialdehyde (MDA) levels and oxidative stress genes in the target organs [39]. The MDA enzyme analysis in the serum samples of the Postbiotic group showed a significant increase compared to the Control group. However, the MDA levels in the liver of the Control group were more dominant. To verify the physiological condition of the liver, histopathological analysis was also performed, which provided an overview of the health of the fish liver. Excessive lipid consumption can lead to increased lipid deposition in the liver, resulting in cell swelling, nuclear translocation, accumulation of lipid droplets, and an increase in hepatocyte diameter [40]. In contrast, the benefits of probiotics and their postbiotic metabolites in alleviating hepatic lipid accumulation and oxidative stress by augmenting uridine circulation are noteworthy [41]. Histological analysis of the liver revealed no evidence of lipid droplets or fatty degeneration. In general, the organs were in satisfactory condition and did not exhibit substantial tissue damage.
A significant increase in lysozyme activity in mucus samples from both the probiotic and postbiotic groups indicates enhanced mucosal immunity. Lysozyme is a key innate immune enzyme that hydrolyzes bacterial cell walls, offering first-line protection against pathogens [42]. These findings suggest that the postbiotic metabolites of B. subtilis AAHM-BS2360 may enhance the synthesis of antimicrobial peptides, lysozyme, or beneficial microbial metabolites within the mucus thereby impeding the proliferation of pathogens [16]. These mechanisms encompass stimulation of innate immunity factors, production of antimicrobial metabolites, modulation of skin microbiota, activation of mucosal immunity, and enhancement of barrier integrity [43,44,45]. A comparable enhancement of lysozyme activity in mucus has been observed in the context of probiotic Pediococcus acidilactici feeding in tilapia [46]. Although bactericidal activity did not differ significantly among groups, the upregulation of innate immune-related genes such as lygl1 and b2ml suggests immunomodulatory effects at the molecular level [47,48].
The decline in MDA levels across the liver, intestine, gills, and skin samples in the treatment group, in conjunction with the incorporation of B. subtilis AAHM-BS2360 components in the feed, signifies a reduction in lipid peroxidation, a process initiated by reactive oxygen species (ROS), including superoxide radicals, hydrogen peroxide, and hydroxyl radicals. MDA, being reactive, can interact with proteins, DNA, and lipids, resulting in cellular damage and apoptosis. Increased MDA levels lead to reduced growth performance of pangasius, attributed to a decrease in antioxidant function and inflammatory response, which are biomarkers of oxidative stress in pangasius [49,50]. Similarly, Liu et al. [51] also showed an increase in MDA in striped catfish due to excessive histamine exposure. In addition to the decrease in MDA levels, the B. subtilis AAHM-BS2360 component in the target organ also increased catalase (CAT) activity. The Probiotic group showed increased CAT activity in the liver, the Pro + Post group showed increased CAT in serum, and the Postbiotic group showed increased CAT levels in the gill. Catalase (CAT) functions as an antioxidant enzyme that decomposes H2O2 into water (H2O) and oxygen (O2), thus preventing oxidative damage. Catalase cooperates with superoxide dismutase (SOD), which converts superoxide radicals (O2-) into H2O2, which is then neutralized by catalase. In conditions where catalase is present in low concentrations, glutathione peroxide (GPX) can also reduce H2O2 using glutathione (GSH). Catalase is essential in maintaining cellular redox balance, protecting cells from oxidative damage and maintaining physiological homeostasis [49,52]. In the present study, the treatment group of metabolite components of B. subtilis AAHM-BS2360 did not demonstrate a significant increase in the activity of other antioxidant enzymes, such as GPx, GR, GSH, GST, and SOD, when compared to the Control group. This may be attributed to the effective treatment in suppressing ROS production, thereby ensuring that other antioxidant enzymes do not need to be activated excessively, and the physiological regulation of the body adjusts the production of antioxidant enzymes as required, as shown in the study on the effects of probiotic, parabiotic, and postbiotic B. subtilis on Asian seabass and tilapia [53,54].
The finding of antioxidant enzyme activity is consistent with the results of the antioxidant gene expression analysis, which also exerted a positive effect on all treatment groups of B. subtilis AAHM-BS2360 metabolite components. In response to a subsequent challenge with E. tarda, both the Postbiotic and Pro + Post groups exhibited a predominant modulation of antioxidant gene expression in response to infection. The production of bioactive metabolites, such as peptides, exopolysaccharides, antioxidant enzymes, and surfactants, by Bacillus spp. has been demonstrated to enhance the activity of the internal antioxidant system in fish [55,56]. The regulation of key antioxidant genes and oxidative stress responses further supports the role of B. subtilis AAHM-BS2360 in providing effective protection in preventing oxidative stress in pangasius, which is consistent with previous reports of probiotic-mediated oxidative stress reduction in several fish species [54,57,58,59].
The present study investigates the modulatory effects of a dietary treatment containing B. subtilis AAHM-BS2360 on the expression of immune-related genes (lygl1, tgfb, tnf, b2ml) and proinflammatory genes (litaf, ifngr1l, c3, il13, il1b) in various target organs. This finding suggests that B. subtilis AAHM-BS2360 supplementation enhances both innate and adaptive immunity, exhibiting broad immunomodulatory effects, especially in enhancing non-specific immune responses, immune signaling and cytokine response, both post-feeding and challenge tests with pathogenic bacteria [60]. The upregulation of lygl1, tgfb, tnf, and b2ml gene expression in gills tissue in the Pro + Post group highlights the role of B. subtilis AAHM-BS2360 in modulating mucosal immunity, which is critical for protecting fish from waterborne pathogens [61]. In addition, the upregulation of immune genes was also seen to be dominant in the Postbiotic treatment after the challenge test with E. tarda. The Pro + Post group also demonstrated a marked tendency for proinflammatory gene expression activity. The probiotic strain Pseudomonas aeruginosa FARP72, administered at 108 cells/g of feed in pangasius, significantly enhanced the innate immune response and proinflammatory gene. This was evident in increased lysozyme activity after 30 days and elevated gene expression of c3 and il1b in liver and kidney organs after 1 day of intraperitoneal injection with E. tarda [62]. In summary, potential therapeutic interventions like dietary modification, probiotics, postbiotics, and gut microbiota transplantation may reduce oxidative stress and inflammation linked to metabolic syndrome by altering the gut microbiota and epigenetic changes [63,64].
The present study set out to assess the impact of a feeding formulation containing cell components and metabolites of B. subtilis AAHM-BS2360 on the growth of pangasius. Supplementation with Bacillus subtilis AAHM-BS2360 metabolite components significantly impacted specific growth rate (SGR), particularly in the Probiotic and Pro + Post groups. This effect was corroborated by the significant upregulation of the igf1 gene expression in the Probiotic group. The expression of igf1 gene provides valuable insights into the molecular mechanisms that stimulate tissue growth, offering a comprehensive understanding of successful aquaculture [65]. Furthermore, an increase in % SGR was demonstrated following 60 days of feeding probiotic B. aerius B81e to Pangasius bocourti [66]. Bacillus subtilis-supplemented feed was also reported to have a positive impact on the growth performance of hybrid grouper [67].
Following the challenge posed by the pathogenic bacteria E. tarda, the Pro + Post group demonstrated the highest survival rate, reaching an impressive 87.5%. This was closely followed by the Postbiotic group, which achieved a survival rate of 84.37%. The Probiotic group also performed exceptionally well, with a survival rate of 81.25%. To provide a point of comparison with the present study, a challenge test against Aeromonas hydrophila FW52 in Pangasius bocourti using probiotic Bacillus aerius B81e resulted in an SR of 77.3% [66], while probiotic B. velezensis JW achieved an SR of 80% against A. hydrophila in Carassius auratus [68]. Furthermore, a probiotic mixture comprising Bacillus subtilis, Enterococcus faecium, Lactobacillus plantarum, and Saccharomyces cerevisiae has been shown to yield an SR of 60% in pangasius fry in response to A. hydrophila injection [69]. In a similar study, the use of Bacillus subtilis CFS in Asian seabass led to an SR of 69.3% [53]. These comparative data demonstrate the superior protective effects of the combination of postbiotic metabolite and probiotic B. subtilis AAHM-BS2360 against pathogenic infection in pangasius.

5. Conclusions

Overall, these findings underscore the potential of B. subtilis AAHM-BS2360 as a functional feed additive in pangasius aquaculture. The supplementation of B. subtilis AAHM-BS2360 as probiotics resulted in a significant enhancement of growth performance and immune gene expression. In contrast, the supplementation of the postbiotic metabolite component of B. subtilis AAHM-BS2360 demonstrated a remarkable augmentation in lysozyme activity within the mucus, which serves as the fish’s innate immune barrier against pathogens. Furthermore, the post-challenge response with E. tarda revealed an upregulation of immune and proinflammatory genes. The combination of probiotics and postbiotics (Pro + Post) offered broad-spectrum immunomodulatory benefits, which could be advantageous in disease management strategies. It excelled in modulating proinflammatory and antioxidant gene expression, significantly dominating the challenge test with the highest SR. Future research should explore the long-term effects of B. subtilis AAHM-BS2360 supplementation and its potential application to other aquaculture species.

Author Contributions

Investigation, validation, formal analysis, writing—original draft, N.W.; methodology, investigation, N.W., W.B., B.K., P.M., Y.A. and P.P.; writing—review and editing, W.B., P.S., P.T. (Patcharapong Thangsunan), P.T. (Pattanapong Thangsunan), K.S. and S.S.; methodology, validation, formal analysis, writing—review and editing, W.B. and A.U.; conceptualization, funding acquisition, validation, formal analysis, A.U. All authors have read and agreed to the published version of the manuscript.

Funding

This research was supported by the Faculty of Fisheries, Kasetsart University, Thailand.

Institutional Review Board Statement

The aquatic animal experiments were conducted following the Ethical Principles and Guidelines for the Use of Animals outlined by the National Research Council of Thailand, which governs the care and use of animals for research purposes. This protocol received approval from the Animal Ethics Committee at Kasetsart University in Thailand (Approval ID: ACKU67-FIS-015) on 20 May 2024.

Informed Consent Statement

Not applicable.

Data Availability Statement

The data presented in this study are available in this manuscript.

Acknowledgments

The authors would like to express their gratitude to the lab staff in the Center of Excellence in Aquatic Animal Health Management (CE AAHM) at the Faculty of Fisheries, Kasetsart University, Bangkok, Thailand, who have provided invaluable assistance and support, both mental and energetic, until this research could finally run smoothly.

Conflicts of Interest

Author N.W. belongs to Company Name PT. Central Proteinaprima. The company had no role in the design of the study; in the collection, analyses, or interpretation of data; in the writing of the manuscript; or in the decision to publish the results.

References

  1. FishStatJ. FishStat: Global Aquaculture Production 1950–2022, 4.03.04; FAO: Rome, Italy, 2024. [Google Scholar]
  2. FAO. International markets for fisheries and aquaculture products—First issue 2024, with January September 2023 statistics. In GLOBEFISH Highlights; FAO: Rome, Italy, 2024. [Google Scholar] [CrossRef]
  3. Kobayashi, M.; Msangi, S.; Batka, M.; Vannuccini, S.; Dey, M.M.; Anderson, J.L. Fish to 2030: The Role and Opportunity for Aquaculture. Aquac. Econ. Manag. 2015, 19, 282–300. [Google Scholar] [CrossRef]
  4. Hasan, M.R.; Shipton, T.A. Aquafeed value chain analysis of striped catfish in Vietnam. Aquaculture 2021, 541, 736798. [Google Scholar] [CrossRef]
  5. Nguyen, T.A.T.; Jolly, C.M. Global value chain and food safety and quality standards of Vietnam pangasius exports. Aquac. Rep. 2020, 16, 100256. [Google Scholar] [CrossRef]
  6. FAO. The State of World Fisheries and Aquaculture 2024. Blue Transformation in Action; FAO: Rome, Italy, 2024. [Google Scholar] [CrossRef]
  7. Fan, Y.; Zheng, J.; Lin, M.; Weng, Q.; Huang, L.; Yan, Q. Identification of antibiotic-resistance markers of Edwardsiella tarda using aptamers. Food Biosci. 2024, 59, 104028. [Google Scholar] [CrossRef]
  8. Pakingking, R.V.; Nguyen, V.V. Chapter 26—Edwardsiellosis. In Aquaculture Pathophysiology; Kibenge, F.S.B., Baldisserotto, B., Chong, R.S.-M., Eds.; Academic Press: Cambridge, MA, USA, 2022; pp. 345–356. [Google Scholar] [CrossRef]
  9. Joseph, T.C.; Dinesh, R.; Shaheer, P.; Murugadas, V.; Rekha, M.; Lalitha, K.V. Outbreak of Edwardsiella tarda in Cultured Pangasius hypophthalmus (Sauvage, 1878). Fish. Technol. 2019, 56, 151–157. [Google Scholar]
  10. Shetty, M.; Maiti, B.; Venugopal, M.N.; Karunasagar, I.; Karunasagar, I. First isolation and characterization of Edwardsiella tarda from diseased striped catfish, Pangasianodon hypophthalmus (Sauvage). J. Fish. Dis. 2014, 37, 265–271. [Google Scholar] [CrossRef]
  11. Lassen, S.B.; Ahsan, M.E.; Islam, S.R.; Zhou, X.Y.; Razzak, M.A.; Su, J.Q.; Brandt, K.K. Prevalence of antibiotic resistance genes in Pangasianodon hypophthalmus and Oreochromis niloticus aquaculture production systems in Bangladesh. Sci. Total Environ. 2022, 813, 151915. [Google Scholar] [CrossRef] [PubMed]
  12. Wiratama, N.; Uchuwittayakul, A.; Susanto, Y.; Utari, H.B.; Muna, N.; Satriagasa, M.C. Mapping spatial analysis of fish disease incidence and antibiotic resistance trends in selected provinces of Indonesia. IOP Conf. Ser. Earth Environ. Sci. 2024, 1392, 012004. [Google Scholar] [CrossRef]
  13. Sam-on, M.F.S.; Mustafa, S.; Hashim, A.M.; Yusof, M.T.; Zulkifly, S.; Roslan, M.A.H. Determination of prebiotic utilisation capability of potential probiotic Bacillus velezensis FS26 through in silico and in vitro approaches. Food Biosci. 2023, 53, 102566. [Google Scholar] [CrossRef]
  14. Saengrung, J.; Bunnoy, A.; Du, X.; Huang, L.; An, R.; Liang, X.; Srisapoome, P. Effects of ribonucleotide supplementation in modulating the growth of probiotic Bacillus subtilis and the synergistic benefits for improving the health performance of Asian seabass (Lates calcarifer). Fish. Shellfish. Immunol. 2023, 140, 108983. [Google Scholar] [CrossRef]
  15. Bunnoy, A.; Na-Nakorn, U.; Kayansamruaj, P.; Srisapoome, P. Acinetobacter Strain KUO11TH, a Unique Organism Related to Acinetobacter pittii and Isolated from the Skin Mucus of Healthy Bighead Catfish and Its Efficacy Against Several Fish Pathogens. Microorganisms 2019, 7, 549. [Google Scholar] [CrossRef] [PubMed]
  16. Amoah, K.; Tan, B.; Zhang, S.; Chi, S.; Yang, Q.; Liu, H.; Yang, Y.; Zhang, H.; Dong, X. Host gut-derived Bacillus probiotics supplementation improves growth performance, serum and liver immunity, gut health, and resistive capacity against Vibrio harveyi infection in hybrid grouper (female Epinephelus fuscoguttatus × male Epinephelus lanceolatus). Anim. Nutr. 2023, 14, 163–184. [Google Scholar] [CrossRef] [PubMed]
  17. Da, M.; Sun, J.; Ma, C.; Li, D.; Dong, L.; Wang, L.S.; Chen, F. Postbiotics: Enhancing human health with a novel concept. eFood 2024, 5, e180. [Google Scholar] [CrossRef]
  18. Khalid, F.; Khalid, A.; Fu, Y.; Hu, Q.; Zheng, Y.; Khan, S.; Wang, Z. Potential of Bacillus velezensis as a probiotic in animal feed: A review. J. Microbiol. 2021, 59, 627–633. [Google Scholar] [CrossRef]
  19. Bunnoy, A.; Na-Nakorn, U.; Srisapoome, P. Probiotic Effects of a Novel Strain, Acinetobacter KU011TH, on the Growth Performance, Immune Responses, and Resistance against Aeromonas hydrophila of Bighead Catfish (Clarias macrocephalus Gunther, 1864). Microorganisms 2019, 7, 613. [Google Scholar] [CrossRef]
  20. Meachasompop, P.; Bunnoy, A.; Keaswejjareansuk, W.; Dechbumroong, P.; Namdee, K.; Srisapoome, P. Development of Immersion and Oral Bivalent Nanovaccines for Streptococcosis and Columnaris Disease Prevention in Fry and Fingerling Asian Seabass (Lates calcarifer) Nursery Farms. Vaccines 2023, 12, 17. [Google Scholar] [CrossRef]
  21. Parry, R.M.; Chandan, R.C.; Shahani, K.M. A Rapid and Sensitive Assay of Muramidase. Proc. Soc. Exp. Biol. Med. 1965, 119, 384–386. [Google Scholar] [CrossRef] [PubMed]
  22. Sukhsangchan, R.; Phaksopa, J.; Uchuwittayakul, A.; Chou, C.C.; Srisapoome, P. Effects of Zinc Oxide Nanoparticles (ZnO NPs) on Growth, Immune Responses and Histopathological Alterations in Asian Seabass (Lates calcarifer, Bloch 1790) under Low-Salinity Conditions. Animals 2024, 14, 2737. [Google Scholar] [CrossRef]
  23. Maehly, A.C. The Assay of Catalases and Peroxidases. In Methods of Biochemical Analysis; John Wiley & Sons, Inc.: Hoboken, NJ, USA, 1954; pp. 357–424. [Google Scholar] [CrossRef]
  24. Mohandas, J.; Marshall, J.J.; Duggin, G.G.; Horvath, J.S.; Tiller, D.J. Differential distribution of glutathione and glutathione-related enzymes in rabbit kidney: Possible implications in analgesic nephropathy. Biochem. Pharmacol. 1984, 33, 1801–1807. [Google Scholar] [CrossRef]
  25. Sahreen, S.; Khan, M.R.; Khan, R.A.; Alkreathy, H.M. Protective effects of Carissa opaca fruits against CCl4-induced oxidative kidney lipid peroxidation and trauma in rat. Food Nutr. Res. 2017, 59, 28438. [Google Scholar] [CrossRef]
  26. Jollow, D.J.; Mitchell, J.R.; Zampaglione, N.; Gillette, J.R. Bromobenzene-Induced Liver Necrosis. Protective Role of Glutathione and Evidence for 3,4-Bromobenzene Oxide as the Hepatotoxic Metabolite. Pharmacology 2008, 11, 151–169. [Google Scholar] [CrossRef] [PubMed]
  27. Habig, W.H.; Pabst, M.J.; Jakoby, W.B. Glutathione S-Transferases: The first enzymatic step in mercapturic acid formation. J. Biol. Chem. 1974, 249, 7130–7139. [Google Scholar] [CrossRef]
  28. Uchiyama, M.; Mihara, M. Determination of malonaldehyde precursor in tissues by thiobarbituric acid test. Anal. Biochem. 1978, 86, 271–278. [Google Scholar] [CrossRef] [PubMed]
  29. Paankhao, N.; Sangsawang, A.; Kantha, P.; Paankhao, S.; Promsee, K.; Soontara, C.; Kongsriprapan, S.; Srisapoome, P.; Kumwan, B.; Meachasompop, P.; et al. Antioxidant and antibacterial efficiency of the ethanolic leaf extract of Kratom (Mitragyna speciosa (Korth.) Havil) and its effects on growth, health, and disease resistance against Edwardsiella tarda infection in Nile tilapia (Oreochromis niloticus). Fish. Shellfish. Immunol. 2024, 152, 109771. [Google Scholar] [CrossRef] [PubMed]
  30. Takada, Y.; Noguchi, T.; Okabe, T.; Kajiyama, M. Superoxide dismutase in various tissues from rabbits bearing the Vx-2 carcinoma in the maxillary sinus. Cancer Res. 1982, 42, 4233–4235. [Google Scholar]
  31. Livak, K.J.; Schmittgen, T.D. Analysis of Relative Gene Expression Data Using Real-Time Quantitative PCR and the 2−ΔΔCT Method. Methods 2001, 25, 402–408. [Google Scholar] [CrossRef]
  32. Cox, T.F.; Czanner, G. A practical divergence measure for survival distributions that can be estimated from Kaplan-Meier curves. Stat. Med. 2016, 35, 2406–2421. [Google Scholar] [CrossRef]
  33. Kumar, S.; Raman, R.P.; Prasad, K.P.; Srivastava, P.P.; Kumar, S.; Rajendran, K.V. Effects on haematological and serum biochemical parameters of Pangasianodon hypophthalmus to an experimental infection of Thaparocleidus sp. (Monogenea: Dactylogyridae). Exp. Parasitol. 2018, 188, 1–7. [Google Scholar] [CrossRef]
  34. Hasan, N.A.; Haque, M.M.; Bashar, A.; Hasan, M.T.; Faruk, M.A.R.; Ahmed, G.U. Effects of dietary Papaveraceae extract on growth, feeding response, nutritional quality and serum biochemical indices of striped catfish (Pangasianodon hypophthalmus). Aquac. Rep. 2021, 21, 100793. [Google Scholar] [CrossRef]
  35. Uchuwittayakul, A.; Thompson, K.D.; Thangsunan, P.; Phaksopa, J.; Buncharoen, W.; Saenphet, K.; Kumwan, B.; Meachasompop, P.; Saenphet, S.; Wiratama, N.; et al. Evaluation of a hydrogel platform for encapsulated multivalent Vibrio antigen delivery to enhance immune responses and disease protection against vibriosis in Asian seabass (Lates calcarifer). Fish. Shellfish. Immunol. 2025, 160, 110230. [Google Scholar] [CrossRef]
  36. Hoque, F.; Abraham, T.J.; Dash, G.; Boda, S.; Nagesh, T.S.; Ghosh, T.K.; Joardar, S.N.; Sundaray, J.K. Effect of Dietary Yeast Extract on the Innate Immunity, Serum Biochemistry and Disease Resistance of Pangasius pangasius Against Edwardsiella tarda Infection. Proc. Zool. Soc. 2024, 77, 47–57. [Google Scholar] [CrossRef]
  37. Abdelkhalek, N.K.; Ghazy, E.W.; Abdel-Daim, M.M. Pharmacodynamic interaction of Spirulina platensis and deltamethrin in freshwater fish Nile tilapia, Oreochromis niloticus: Impact on lipid peroxidation and oxidative stress. Environ. Sci. Pollut. Res. Int. 2015, 22, 3023–3031. [Google Scholar] [CrossRef] [PubMed]
  38. Trejo-Escamilla, I.; López, L.M.; Gisbert, E.; Sanchez, S.; Rodarte-Venegas, D.; Álvarez, C.A.; Galaviz, M.A. Soybean protein concentrate as a protein source for totoaba (Totoaba macdonaldi) juveniles: Effect on intermediary metabolism and liver histological organization. Comp. Biochem. Physiol. Part A Mol. Integr. Physiol. 2021, 262, 111062. [Google Scholar] [CrossRef] [PubMed]
  39. He, L.; Zhang, Y.; Cao, Q.; Shan, H.; Zong, J.; Feng, L.; Jiang, W.; Wu, P.; Zhao, J.; Liu, H.; et al. Hepatic Oxidative Stress and Cell Death Influenced by Dietary Lipid Levels in a Fresh Teleost. Antioxidants 2024, 13, 808. [Google Scholar] [CrossRef]
  40. Lu, K.-L.; Xu, W.-N.; Liu, W.-B.; Wang, L.-N.; Zhang, C.-N.; Li, X.-F. Association of Mitochondrial Dysfunction with Oxidative Stress and Immune Suppression in Blunt Snout Bream Megalobrama amblycephala Fed a High-Fat Diet. J. Aquat. Anim. Health 2014, 26, 100–112. [Google Scholar] [CrossRef]
  41. Xu, R.; Wang, T.; Ding, F.F.; Zhou, N.N.; Qiao, F.; Chen, L.Q.; Du, Z.Y.; Zhang, M.L. Lactobacillus plantarum Ameliorates High-Carbohydrate Diet-Induced Hepatic Lipid Accumulation and Oxidative Stress by Upregulating Uridine Synthesis. Antioxidants 2022, 11, 1238. [Google Scholar] [CrossRef]
  42. Wu, T.; Jiang, Q.; Wu, D.; Hu, Y.; Chen, S.; Ding, T.; Ye, X.; Liu, D.; Chen, J. What is new in lysozyme research and its application in food industry? A review. Food Chem 2019, 274, 698–709. [Google Scholar] [CrossRef]
  43. Etyemez Buyukdeveci, M.; Cengizler, I.; Balcazar, J.L.; Demirkale, I. Effects of two host-associated probiotics Bacillus mojavensis B191 and Bacillus subtilis MRS11 on growth performance, intestinal morphology, expression of immune-related genes and disease resistance of Nile tilapia (Oreochromis niloticus) against Streptococcus iniae. Dev. Comp. Immunol. 2023, 138, 104553. [Google Scholar] [CrossRef]
  44. Say, P.; Nimikul, S.; Bunnoy, A.; Na-Nakorn, U.; Srisapoome, P. Long-Term Application of a Synbiotic Chitosan and Acinetobacter KU011TH Mixture on the Growth Performance, Health Status, and Disease Resistance of Hybrid Catfish (Clarias gariepinus × C. macrocephalus) during Winter. Microorganisms 2023, 11, 1807. [Google Scholar] [CrossRef]
  45. Say, P.; Nimitkul, S.; Bunnoy, A.; Na-Nakorn, U.; Srisapoome, P. Effects of the combination of chitosan and Acinetobacter KU011TH on the growth and health performances and disease resistance of juvenile hybrid catfish (Clarias gariepinus × C. macrocephalus). Fish Shellfish Immunol. 2023, 142, 109177. [Google Scholar] [CrossRef]
  46. Mohammadi, G.; Hafezieh, M.; Karimi, A.A.; Azra, M.N.; Van Doan, H.; Tapingkae, W.; Abdelrahman, H.A.; Dawood, M.A.O. The synergistic effects of plant polysaccharide and Pediococcus acidilactici as a synbiotic additive on growth, antioxidant status, immune response, and resistance of Nile tilapia (Oreochromis niloticus) against Aeromonas hydrophila. Fish Shellfish Immunol. 2022, 120, 304–313. [Google Scholar] [CrossRef]
  47. Jia, R.; Li, Y.; Cao, L.; Du, J.; Zheng, T.; Qian, H.; Gu, Z.; Jeney, G.; Xu, P.; Yin, G. Antioxidative, anti-inflammatory and hepatoprotective effects of resveratrol on oxidative stress-induced liver damage in tilapia (Oreochromis niloticus). Comp. Biochem. Physiol. C Toxicol. Pharmacol. 2019, 215, 56–66. [Google Scholar] [CrossRef]
  48. Chen, W.; Gao, F.; Chu, F.; Zhang, J.; Gao, G.F.; Xia, C. Crystal structure of a bony fish beta2-microglobulin: Insights into the evolutionary origin of immunoglobulin superfamily constant molecules. J. Biol. Chem. 2010, 285, 22505–22512. [Google Scholar] [CrossRef]
  49. Song, C.; Sun, C.; Liu, B.; Xu, P. Oxidative Stress in Aquatic Organisms. Antioxidants 2023, 12, 1223. [Google Scholar] [CrossRef] [PubMed]
  50. Peng, C.; Fu, X.; Zhang, Y.; Zhang, H.; Ye, Y.; Deng, J.; Tan, B. Effects of Malondialdehyde on Growth Performance, Gastrointestinal Health, and Muscle Quality of Striped Catfish (Pangasianodon hypophthalmus). Antioxidants 2024, 13, 1524. [Google Scholar] [CrossRef]
  51. Liu, Y.; Fu, X.; Huang, H.; Fan, J.; Zhou, H.; Deng, J.; Tan, B. High Dietary Histamine Induces Digestive Tract Oxidative Damage in Juvenile Striped Catfish (Pangasianodon hypophthalmus). Antioxidants 2022, 11, 2276. [Google Scholar] [CrossRef]
  52. Hoseinifar, S.H.; Yousefi, S.; Van Doan, H.; Ashouri, G.; Gioacchini, G.; Maradonna, F.; Carnevali, O. Oxidative Stress and Antioxidant Defense in Fish: The Implications of Probiotic, Prebiotic, and Synbiotics. Rev. Fish. Sci. Aquac. 2020, 29, 198–217. [Google Scholar] [CrossRef]
  53. Jafarzadeh, F.; Roomiani, L.; Dezfoulnejad, M.C.; Baboli, M.J.; Sary, A.A. Harnessing paraprobiotics and postbiotics for enhanced immune function in Asian seabass (Lates calcarifer): Insights into pattern recognition receptor signaling. Fish. Shellfish. Immunol. 2024, 151, 109725. [Google Scholar] [CrossRef]
  54. Elbahnaswy, S.; Elshopakey, G.E.; Abdelwarith, A.A.; Younis, E.M.; Davies, S.J.; El-Son, M.A.M. Immune protective, stress indicators, antioxidant, histopathological status, and heat shock protein gene expression impacts of dietary Bacillus spp. against heat shock in Nile tilapia, Oreochromis niloticus. BMC Vet. Res. 2024, 20, 469. [Google Scholar] [CrossRef] [PubMed]
  55. Tao, L.-T.; Lu, H.; Xiong, J.; Zhang, L.; Sun, W.-W.; Shan, X.-F. The application and potential of postbiotics as sustainable feed additives in aquaculture. Aquaculture 2024, 592, 741237. [Google Scholar] [CrossRef]
  56. Chaudhari, A.; Dwivedi, M.K. The concept of probiotics, prebiotics, postbiotics, synbiotics, nutribiotics, and pharmabiotics. In Probiotics in the Prevention and Management of Human Diseases; Academic Press: Cambridge, MA, USA, 2022; pp. 1–11. [Google Scholar] [CrossRef]
  57. Qi, X.; Luo, F.; Zhang, Y.; Wang, G.; Ling, F. Exploring the protective role of Bacillus velezensis BV1704-Y in zebrafish health and disease resistance against Aeromonas hydrophila infection. Fish. Shellfish. Immunol. 2024, 152, 109789. [Google Scholar] [CrossRef]
  58. Yun, L.; Kang, M.; Shen, Y.; Feng, J.; Yang, G.; Zhang, J.; Meng, X.; Chang, X. Dietary Bacillus velezensis R-71003 and sodium gluconate improve antioxidant capacity, immune response and resistance against Aeromonas hydrophila in common carp. Fish. Shellfish. Immunol. 2023, 139, 108921. [Google Scholar] [CrossRef] [PubMed]
  59. Wang, J.; Xie, X.; Liu, Y.; Liu, J.; Liang, X.; Wang, H.; Li, G.; Xue, M. Growth, Antioxidant Capacity, and Liver Health in Largemouth Bass (Micropterus salmoides) Fed Multi-Strain Yeast-Based Paraprobiotic: A Lab-to-Pilot Scale Evaluation. Antioxidants 2024, 13, 792. [Google Scholar] [CrossRef] [PubMed]
  60. Jenik, K.; Oberhoffner, S.; DeWitte-Orr, S.J. Response to pathogens—Innate immunity. In Encyclopedia of Fish Physiology, 2nd ed.; Alderman, S.L., Gillis, T.E., Eds.; Academic Press: Oxford, UK, 2024; pp. 334–345. [Google Scholar] [CrossRef]
  61. Semple, S.L.; Barreda, D.R. Adaptive immunity in teleostean fishes. In Encyclopedia of Fish Physiology, 2nd ed.; Alderman, S.L., Gillis, T.E., Eds.; Academic Press: Oxford, UK, 2024; pp. 346–354. [Google Scholar] [CrossRef]
  62. Hoque, F.; Abraham, T.J.; Joardar, S.N.; Paria, P.; Behera, B.K.; Das, B.K. Effects of dietary supplementation of Pseudomonas aeruginosa FARP72 on the immunomodulation and resistance to Edwardsiella tarda in Pangasius pangasius. Fish. Shellfish. Immunol. Rep. 2022, 3, 100071. [Google Scholar] [CrossRef]
  63. Mostafavi Abdolmaleky, H.; Zhou, J.R. Gut Microbiota Dysbiosis, Oxidative Stress, Inflammation, and Epigenetic Alterations in Metabolic Diseases. Antioxidants 2024, 13, 985. [Google Scholar] [CrossRef]
  64. García Mansilla, M.J.; Rodríguez Sojo, M.J.; Lista, A.R.; Ayala Mosqueda, C.V.; Ruiz Malagón, A.J.; Ho Plagaro, A.; Gálvez, J.; Rodríguez Nogales, A.; Rodríguez Sánchez, M.J. Microbial-Derived Antioxidants in Intestinal Inflammation: A Systematic Review of Their Therapeutic Potential. Antioxidants 2025, 14, 321. [Google Scholar] [CrossRef] [PubMed]
  65. Tran, T.T.H.; Nguyen, H.T.; Le, B.T.N.; Tran, P.H.; Van Nguyen, S.; Kim, O.T.P. Characterization of single nucleotide polymorphism in IGF1 and IGF1R genes associated with growth traits in striped catfish (Pangasianodon hypophthalmus Sauvage, 1878). Aquaculture 2021, 538, 736542. [Google Scholar] [CrossRef]
  66. Meidong, R.; Khotchanalekha, K.; Doolgindachbaporn, S.; Nagasawa, T.; Nakao, M.; Sakai, K.; Tongpim, S. Evaluation of probiotic Bacillus aerius B81e isolated from healthy hybrid catfish on growth, disease resistance and innate immunity of Pla-mong Pangasius bocourti. Fish. Shellfish. Immunol. 2018, 73, 1–10. [Google Scholar] [CrossRef]
  67. Han, C.; Shi, H.; Cui, C.; Wang, J.; Li, L.; Bei, W.; Cai, Y.; Wang, S. Strain-Specific Benefits of Bacillus on Growth, Intestinal Health, Immune Modulation, and Ammonia-Nitrogen Stress Resilience in Hybrid Grouper. Antioxidants 2024, 13, 317. [Google Scholar] [CrossRef]
  68. Yi, Y.; Zhang, Z.; Zhao, F.; Liu, H.; Yu, L.; Zha, J.; Wang, G. Probiotic potential of Bacillus velezensis JW: Antimicrobial activity against fish pathogenic bacteria and immune enhancement effects on Carassius auratus. Fish. Shellfish. Immunol. 2018, 78, 322–330. [Google Scholar] [CrossRef]
  69. Abdel-Latif, H.M.R.; Chaklader, M.R.; Shukry, M.; Ahmed, H.A.; Khallaf, M.A. A multispecies probiotic modulates growth, digestive enzymes, immunity, hepatic antioxidant activity, and disease resistance of Pangasianodon hypophthalmus fingerlings. Aquaculture 2023, 563, 738948. [Google Scholar] [CrossRef]
Figure 1. (AW) Biochemistry of P. hypophthalmus following 30-day supplementation with probiotic, postbiotic, and their combination derived from B. subtilis AAHM-BS2360. Data are represented as mean ± SD (n = 8). Data in each graph with different letters denote statistically significant differences (p < 0.05).
Antioxidants 14 00629 g001
Figure 2. Bactericidal activity (%) response in mucus (A) and serum (B), and lysozyme activity (Unit/mL) in mucus (C) and serum (D) of P. hypophthalmus following 30-day supplementation with probiotic, postbiotic, and their combination derived from B. subtilis AAHM-BS2360. Data are represented as mean ± SD (n = 8). Asterisks indicate statistically significant differences (ns = not significant). * (p < 0.05), ** (p < 0.01).
Antioxidants 14 00629 g002
Figure 3. Levels of MDA and GSH, and activities of CAT, SOD, GPx, GR, and GST in liver (AaAg), intestine (BaBg), serum (CaCg), gills (DaDg), and skin (EaEg) of P. hypophthalmus following 30-day supplementation with probiotic, postbiotic, and their combination derived from B. subtilis AAHM-BS2360. Data are represented as mean ± SD (n = 8). Asterisks indicate statistically significant differences (ns = not significant). * (p < 0.05), ** (p < 0.01), and *** (p < 0.001).
Antioxidants 14 00629 g003
Figure 4. Relative stress oxidative and antioxidant-related gene expression (fold change) including cusr, cat, gpx3, hspa13, and nos1 in gills (AaAe), whole blood (BaBe), head kidney (CaCe), intestine (DaDe), spleen (EaEe), and liver (FaFe) of P. hypophthalmus following 30-day supplementation with probiotic, postbiotic, and their combination derived from B. subtilis AAHM-BS2360. Data are represented as mean ± SD (n = 8). Asterisks indicate statistically significant differences (ns = not significant). * (p < 0.05), ** (p < 0.01), and *** (p < 0.001).
Antioxidants 14 00629 g004
Figure 5. Relative antioxidant-related gene expression (fold change) including cusr (AC), cat (DF), gpx3 (GI), hspa13 (JL), and nos1 (MO) in whole blood, intestine, and head kidney of P. hypophthalmus following 30-day supplementation with probiotic, postbiotic, and their combination derived from B. subtilis AAHM-BS2360 after being challenged with E. tarda. Data are represented as mean ± SD (n = 8). Asterisks indicate statistically significant differences (ns = not significant). * (p < 0.05), ** (p < 0.01), and *** (p < 0.001).
Antioxidants 14 00629 g005
Figure 6. Relative immune-related gene expression (fold change) including lygl1 (AF), tgfb (GL), tnf (MR), and b2ml (SX) in gill, whole blood, head kidney, intestine, spleen, and liver of P. hypophthalmus following 30-day supplementation with probiotic, postbiotic, and their combination derived from B. subtilis AAHM-BS2360. Data are represented as mean ± SD (n = 8). Asterisks indicate statistically significant differences (ns = not significant). * (p < 0.05), ** (p < 0.01), and *** (p < 0.001).
Antioxidants 14 00629 g006
Figure 7. Relative immune-related gene expression (fold change) including lygl1 (AC), tgfb (DF), tnf (GI), and b2ml (JL) in head kidney, intestine, and whole blood of P. hypophthalmus following 30-day supplementation with probiotic, postbiotic, and their combination derived from B. subtilis AAHM-BS2360 after being challenged with E. tarda. Data are represented as mean ± SD (n = 8). Asterisks indicate statistically significant differences (ns = not significant). * (p < 0.05), ** (p < 0.01), and *** (p < 0.001).
Antioxidants 14 00629 g007
Figure 8. Relative proinflammatory-related gene expression (fold change), including litaf, ifngr1l, c3, il13, and il1b in gills (AaAe), whole blood (BaBe), head kidney (CaCe), intestine (DaDe), spleen (EaEe), and liver (FaFe) of P. hypophthalmus following 30-day supplementation with probiotic, postbiotic, and their combination derived from B. subtilis AAHM-BS2360. Data are represented as mean ± SD (n = 8). Asterisks indicate statistically significant differences (ns = not significant). * (p < 0.05), ** (p < 0.01), and *** (p < 0.001).
Antioxidants 14 00629 g008
Figure 9. Relative proinflammatory-related gene expression (fold change) including litaf (AC), ifngr1l (DF), c3 (GI), il13 (JL), and il1b (MO) in head kidney, intestine and whole blood of P. hypophthalmus following 30-day supplementation with probiotic, postbiotic, and their combination derived from B. subtilis AAHM-BS2360 after being challenged with E. tarda. Data are represented as mean ± SD (n = 8). Asterisks indicate statistically significant differences (ns = not significant). * (p < 0.05), ** (p < 0.01).
Antioxidants 14 00629 g009
Figure 10. Relative growth-related gene expression (fold change) including igf1 (A) and gh1 (B) in the liver of P. hypophthalmus following 30-day supplementation with probiotic, postbiotic, and their combination derived from B. subtilis AAHM-BS2360. Data are represented as mean ± SD (n = 8). Asterisks indicate statistically significant differences (ns = not significant). * (p < 0.05).
Antioxidants 14 00629 g010
Figure 11. Histopathology of gills (AD), liver (EH), head kidney (IL), spleen (MP), and intestine (QT) of P. hypophthalmus following 30-day supplementation with probiotic, postbiotic, and their combination derived from B. subtilis AAHM-BS2360. Pillar cells (P), mucous cells (M), chloride cells (C), erythrocytes/red blood cells (RBC), hepatocyte (Hc), sinusoid (Ss), melano-macrophage center (MMCs), hematopoietic tissue (HT), lumen (LU), lamina propria (LP).
Antioxidants 14 00629 g011
Figure 12. Survival rate (SR) (%) of P. hypophthalmus following 30-day supplementation with probiotic, postbiotic, and their combination derived from B. subtilis AAHM-BS2360 after intraperitoneal injection with E. tarda. Asterisks indicate statistically significant differences (p < 0.05).
Antioxidants 14 00629 g012
Table 1. Primers used in qRT-PCR analysis of gene expression.
Gene GroupGenesNucleotide Sequences (5′ → 3′)Tm (°C)Efficiency (%)Accession Number
Housekeeping geneActin, beta 1 (actb1)F-5′-GAGCGCAAGTACTCTGTATGGA-3′6098.5XM_026928832.3
R-5′-CTGTGGTGGTTACAGTCCTGTT-3′
18S rRNA (rna18s)F-5′-TGACTCAACACGGGAAACCTC-3′60102.4XR_004577708
R-5′-CAGACAAATCGCTCCACCAAC-3′
Stress oxidative and Antioxidant-related geneCopper-only SOD repeat protein (cusr)F-5′-GTCCATCTTACCCGGTGCCC-3′6099XM_034299545.1
R-5′- CGAGAGAAGACCCGGAACGC-3′
Catalase (cat)F-5′-AGCAGGCGGAGAAGTACCCA-3′60104.7XM_026919141.2
R-5′-GCTGCTCCACCTCAGCGAAA-3′
Glutathione peroxidase 3 (gpx3)F-5′-GTCACTGCAGGATGCAACAC-3′60106.3XM_026947312.2
R-5′-TTGGAATTCCGCTCATTGAT-3′
Heat shock protein 70 family, member 13 (hspa13)F-5′-CTCCTCCTAAACCCCGAGTC-3′60100.4XM_026934573.2
R-5′-CCACCAGCACGTTAAACACA-3′
Nitric oxide synthase 1 (neuronal) (nos1)F-5′-ACACCACGGAGTGTGTTCGT-3′6099.6XM_026931613.2
R-5′-GGATGCATGGGACGTTGCTG-3′
Immune-related geneLysozyme g-like 1 (lygl1)F-5′- TTTTTGGAGACGTCACAAAGATCG-3′60101.3XM_026940542.3
R-5′- TGGTGATGATGTTCTTGTACTGCT-3′
Transforming growth factor, beta (tgfb)F-5′-GAACACTGTCCTCCTTGTCCTC-3′6093.4XM_026909968.3
R-5′-TCGTATTTGGTGGTGAGGATGG-3′
Tumor necrosis factor (tnf)F-5′-AGTGCAAAGTCAAAAAGCGAGG-3′60100.2XM_026921878.3
R-5′-TGATACTTGGAGCCAGAGCATC-3′
Beta-2-microglobulin, like (b2ml)F-5′-AGAGAACACACTGATCTGCCAC-3′6094.6XM_026925487.3
R-5′-GCGACGCTCTTAGTCAGATGAA-3′
Proinflammatory-related geneLipopolysaccharide-induced TNF factor (litaf)F-5′-TGCATTATTGGCTGTATGTATGGC-3′6095.1XM_026930110.3
R-5′-GTGGATATGTGCTCAGTTCCTGTT-3′
Interferon gamma receptor 1-like (ifngr1l)F-5′-TACATAACAGTGGAAGCTCAACCA-3′6090.2XM_026939395.3
R-5′-AAGTTTGTGTTGTTGGACGGAAAT-3′
Complement C3 (c3)F-5′-GAATAGCTCCTGACTGTCCCAC-3′6098.3XM_034300087.2
R-5′-ATGTGTAGCCCAGTCTGTTCTG-3′
Interleukin 13 (il13)F-5′-GTTTATATCCGGCTTTCATGTGCA-3′60102.3XM_034311451.2
R-5′-AGAAAAACAACCACGACCTTCATC-3′
Interleukin 1, beta (il1b)F-5′-CTATTCTGCTGGCCATTACTCTGA-3′60100.8XM_034312378.2
R-5′-ATGAGAGAAAGAGGTTGCTCTTCA-3′
Growth-related geneGrowth hormone 1 (gh1)F-5′-CCCAGCAAGAACCTCGGCAA-3′6094.1GQ859589.1
R-5′-GCGGAGCCAGAGAGTCGTTC-3′
Insulin-like growth factor 1 (igf1)F-5′-GCAACGGCACACAGACACGC-3′6096.2XM_034313382.2
R-5′-CAGACGTTCCCTCACCATCCTCT-3′
Table 2. Growth performance of P. hypophthalmus after 30 days of dietary supplementation with probiotic, postbiotic, and their combination derived from B. subtilis AAHM-BS2360.
Growth ParameterTreatment
ControlProbioticPostbioticPro + Post
Spesific growth rate (SGR); %/day0.74 ± 0.43 a2.81 ± 0.61 b2.61 ± 0.79 ab3.29 ± 0.98 b
Average daily gain (ADG); g/day0.37 ± 0.23 a1.31 ± 0.35 ab1.24 ± 0.40 ab1.42 ± 0.52 b
Feed conversion ratio (FCR)1.06 ± 0.35 a0.79 ± 0.04 a0.77 ± 0.05 a0.81 ± 0.13 a
Data (Mean ± SD) in same row with different letters are significantly different (p < 0.05).
Disclaimer/Publisher’s Note: The statements, opinions and data contained in all publications are solely those of the individual author(s) and contributor(s) and not of MDPI and/or the editor(s). MDPI and/or the editor(s) disclaim responsibility for any injury to people or property resulting from any ideas, methods, instructions or products referred to in the content.

