
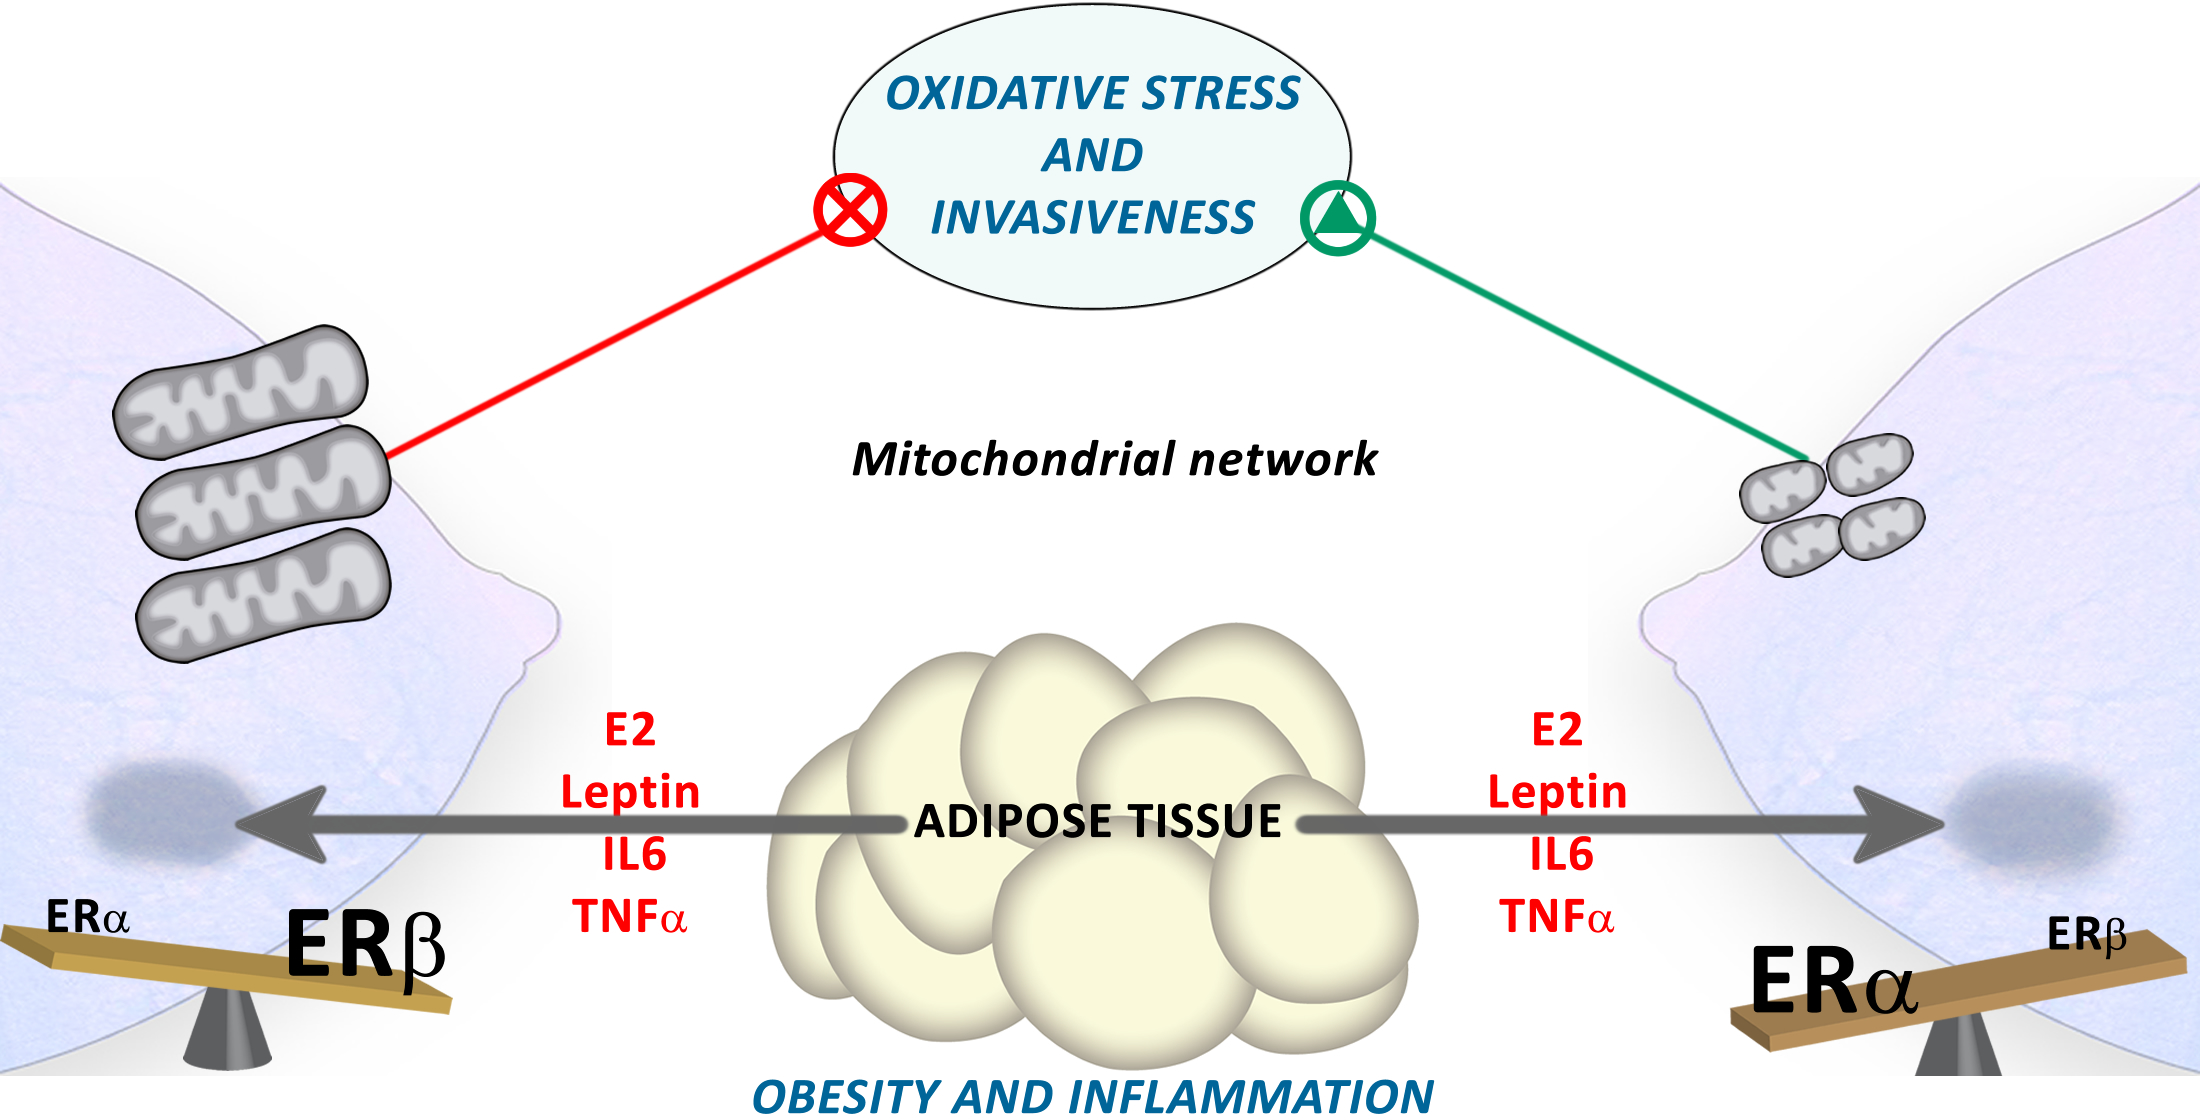
Estrogen Receptor Beta (ERβ) Maintains Mitochondrial Network Regulating Invasiveness in an Obesity-Related Inflammation Condition in Breast Cancer

 ,
,  , ,
, ,  , and
, and 
Abstract

1. Introduction
2. Materials and Methods
2.1. Reagents
2.2. Cell Culture and Treatments
2.3. Measurement of H2O2 Production and O2− Levels
2.4. Cardiolipin Content
2.5. RT-qPCR
2.6. Western Blot
2.7. Measurement of 4-HNE Adducts Levels
2.8. Wound Healing Assay
2.9. Confocal Microscopy
2.10. Seahorse Metabolic Analyzer
2.11. Human Samples
2.12. Statistical Analysis
3. Results
3.1. Obesity-Related Inflammation Treatment Increases Inflammation-Related Genes Expression in Breast Cancer Cell Lines
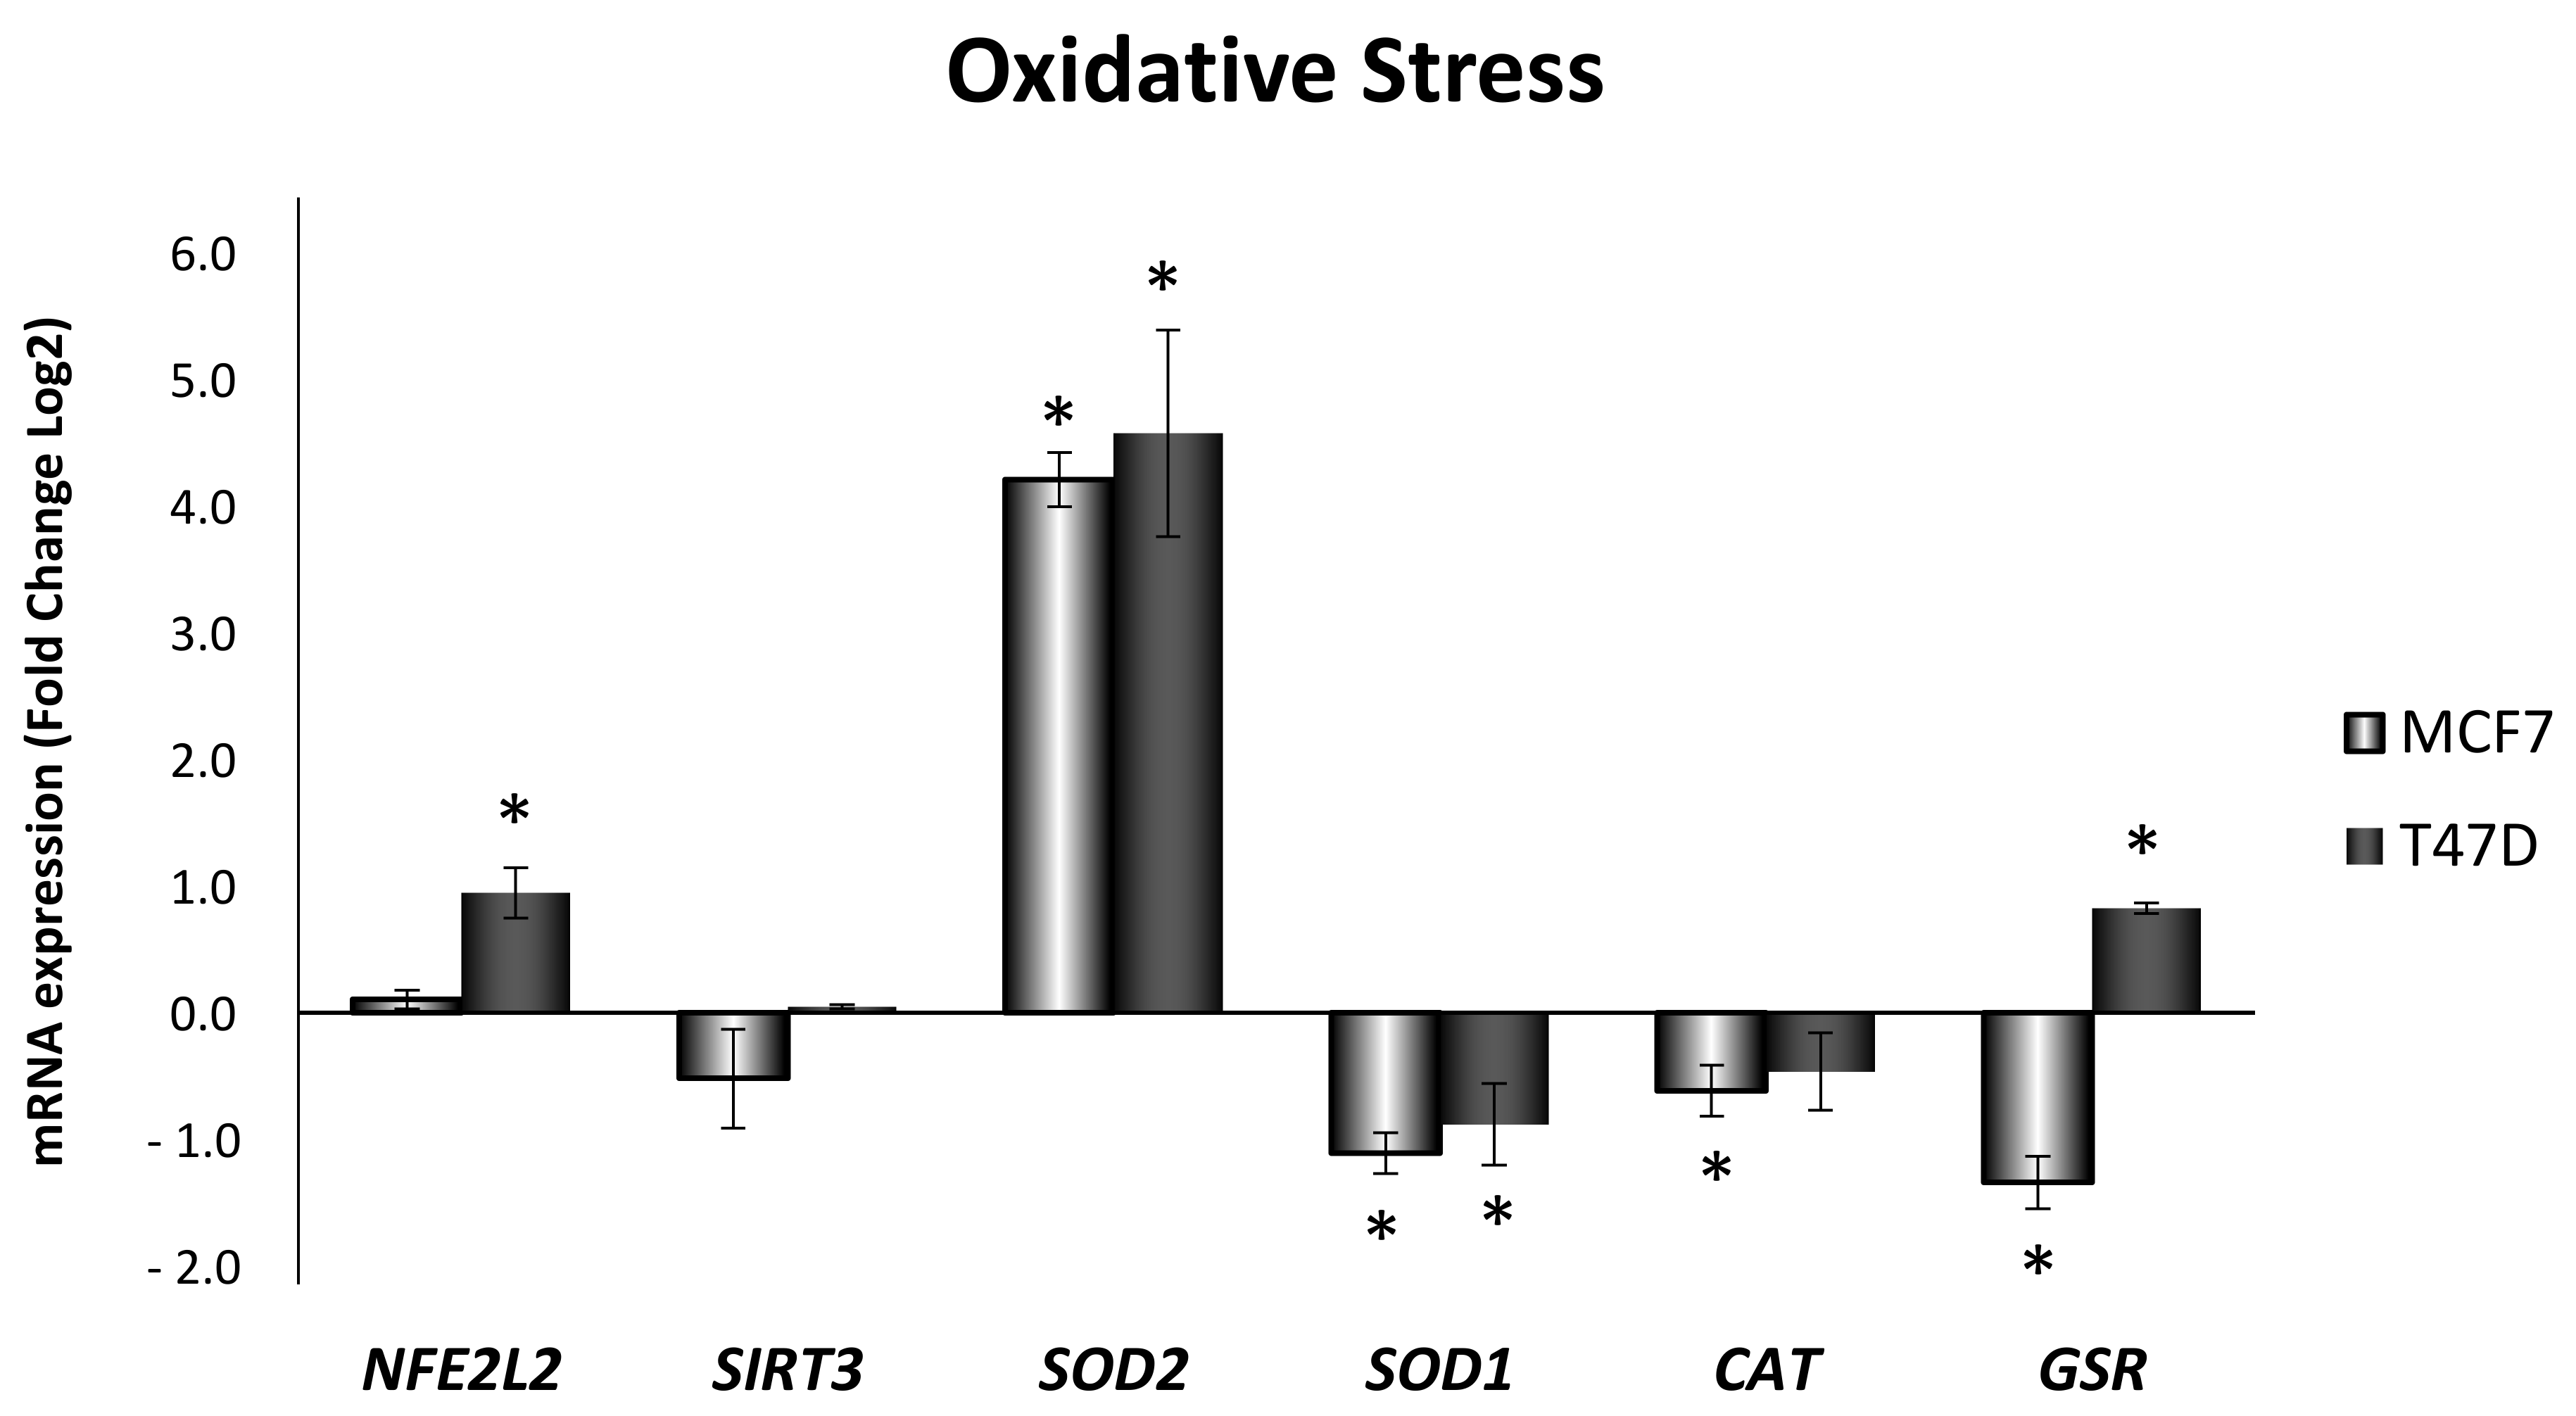
3.2. Obesity-Related Inflammation Treatment Increases Oxidative Stress in Breast Cancer Cell Lines with High ERα/ERβ Ratio
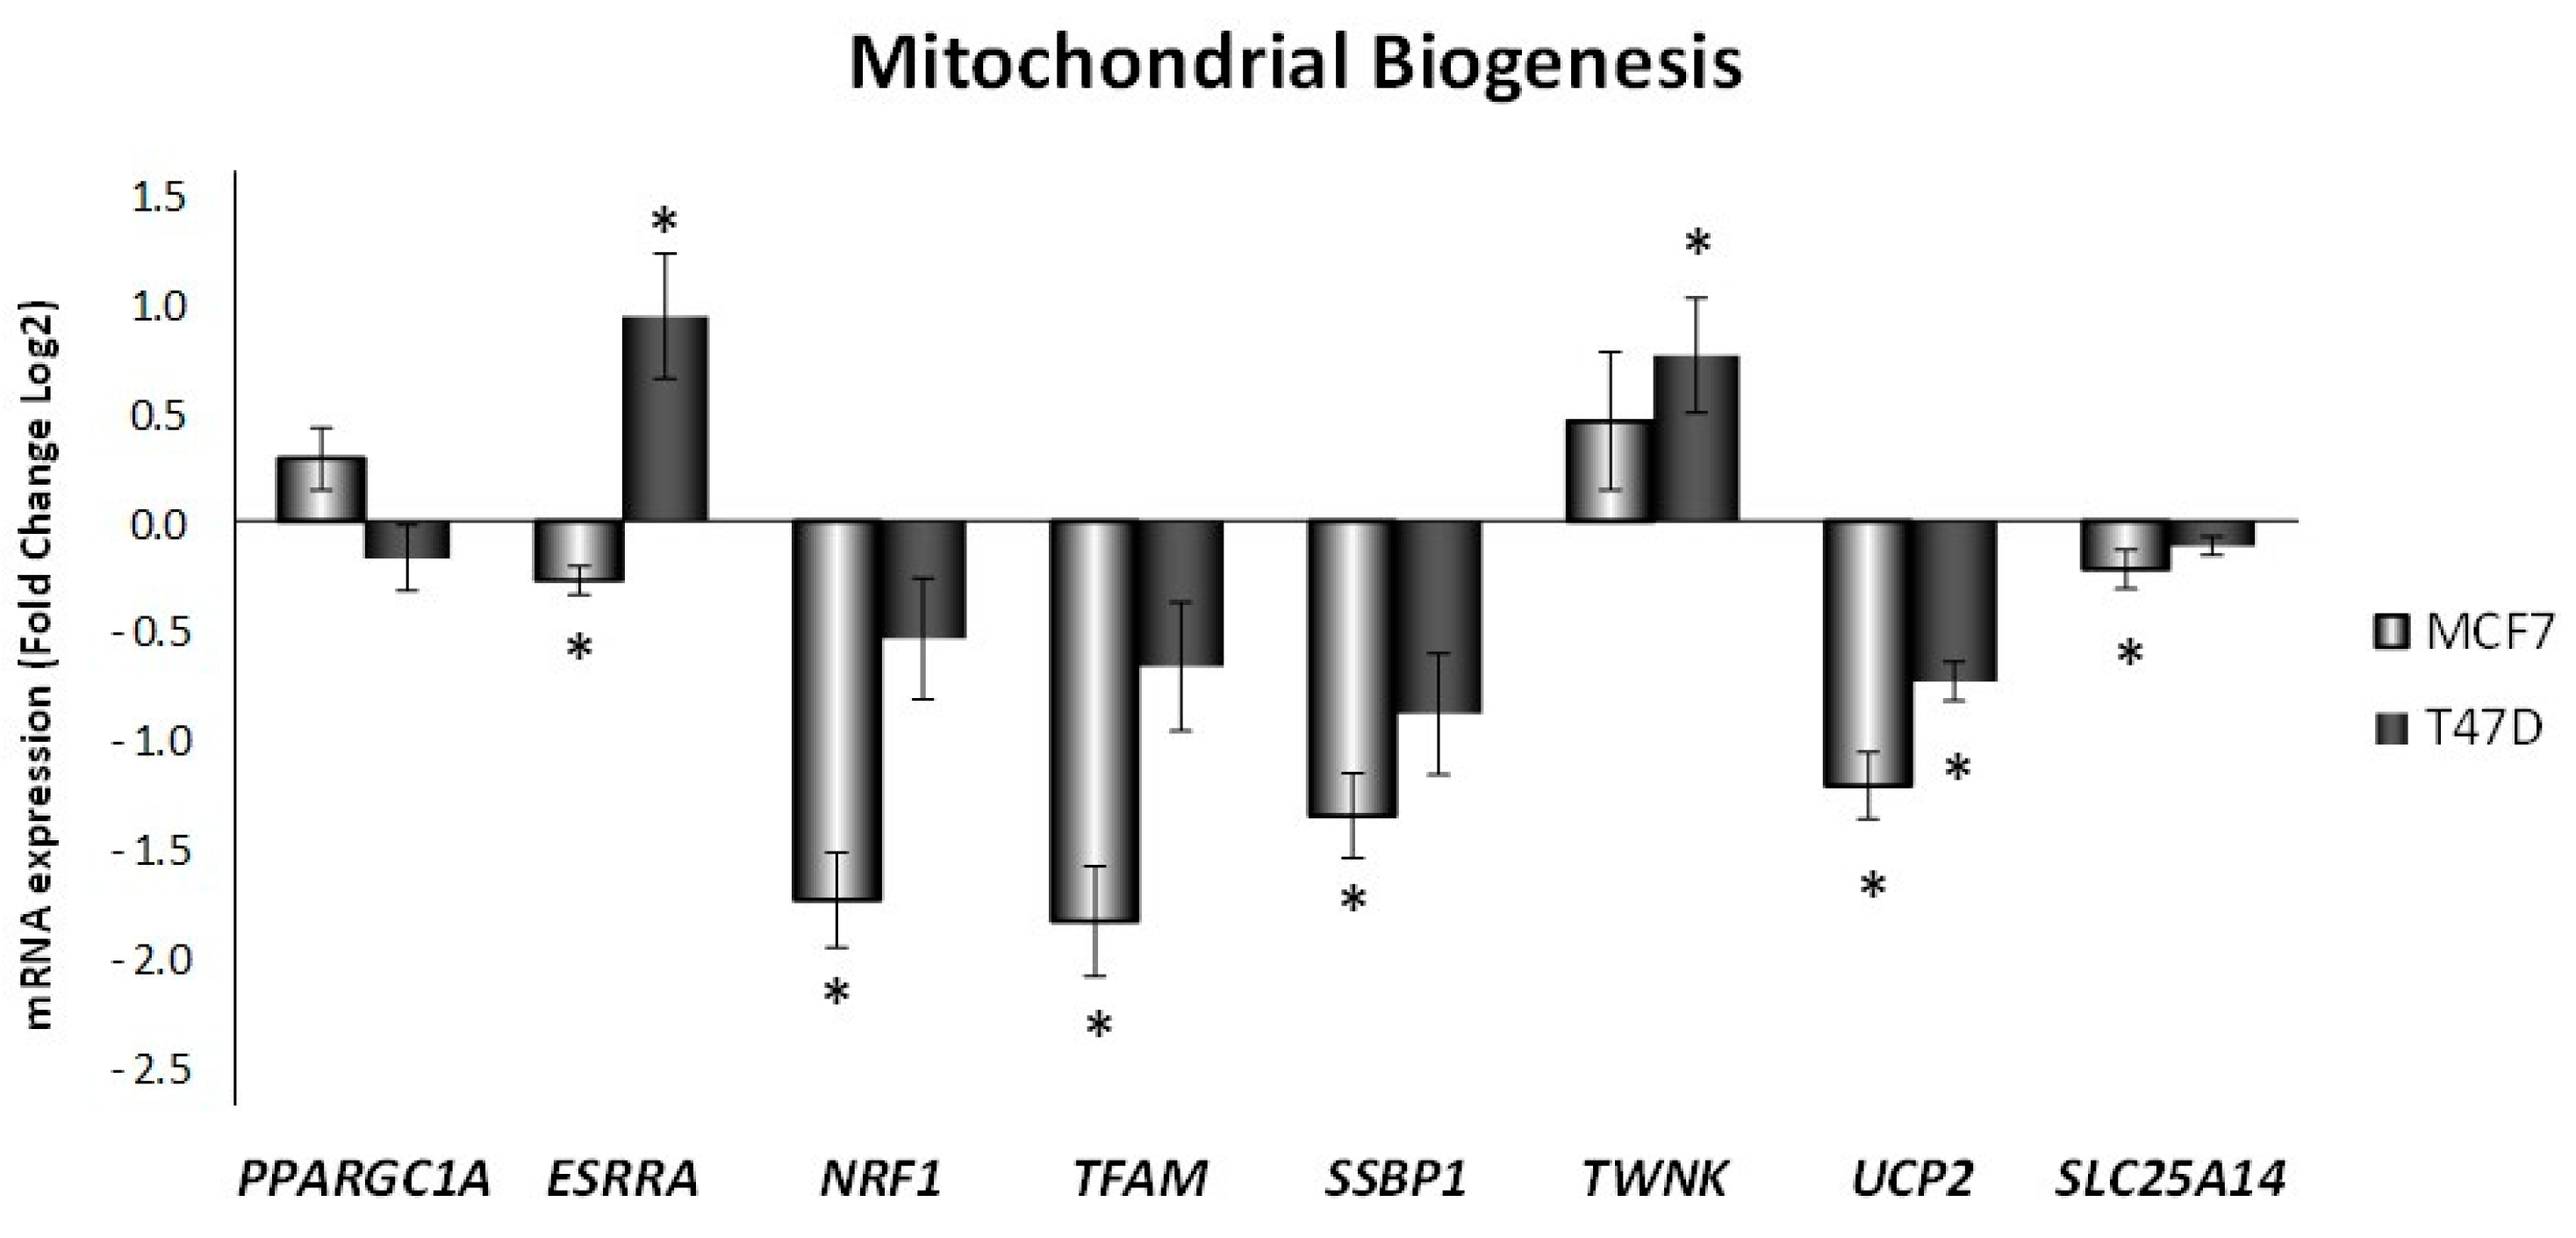
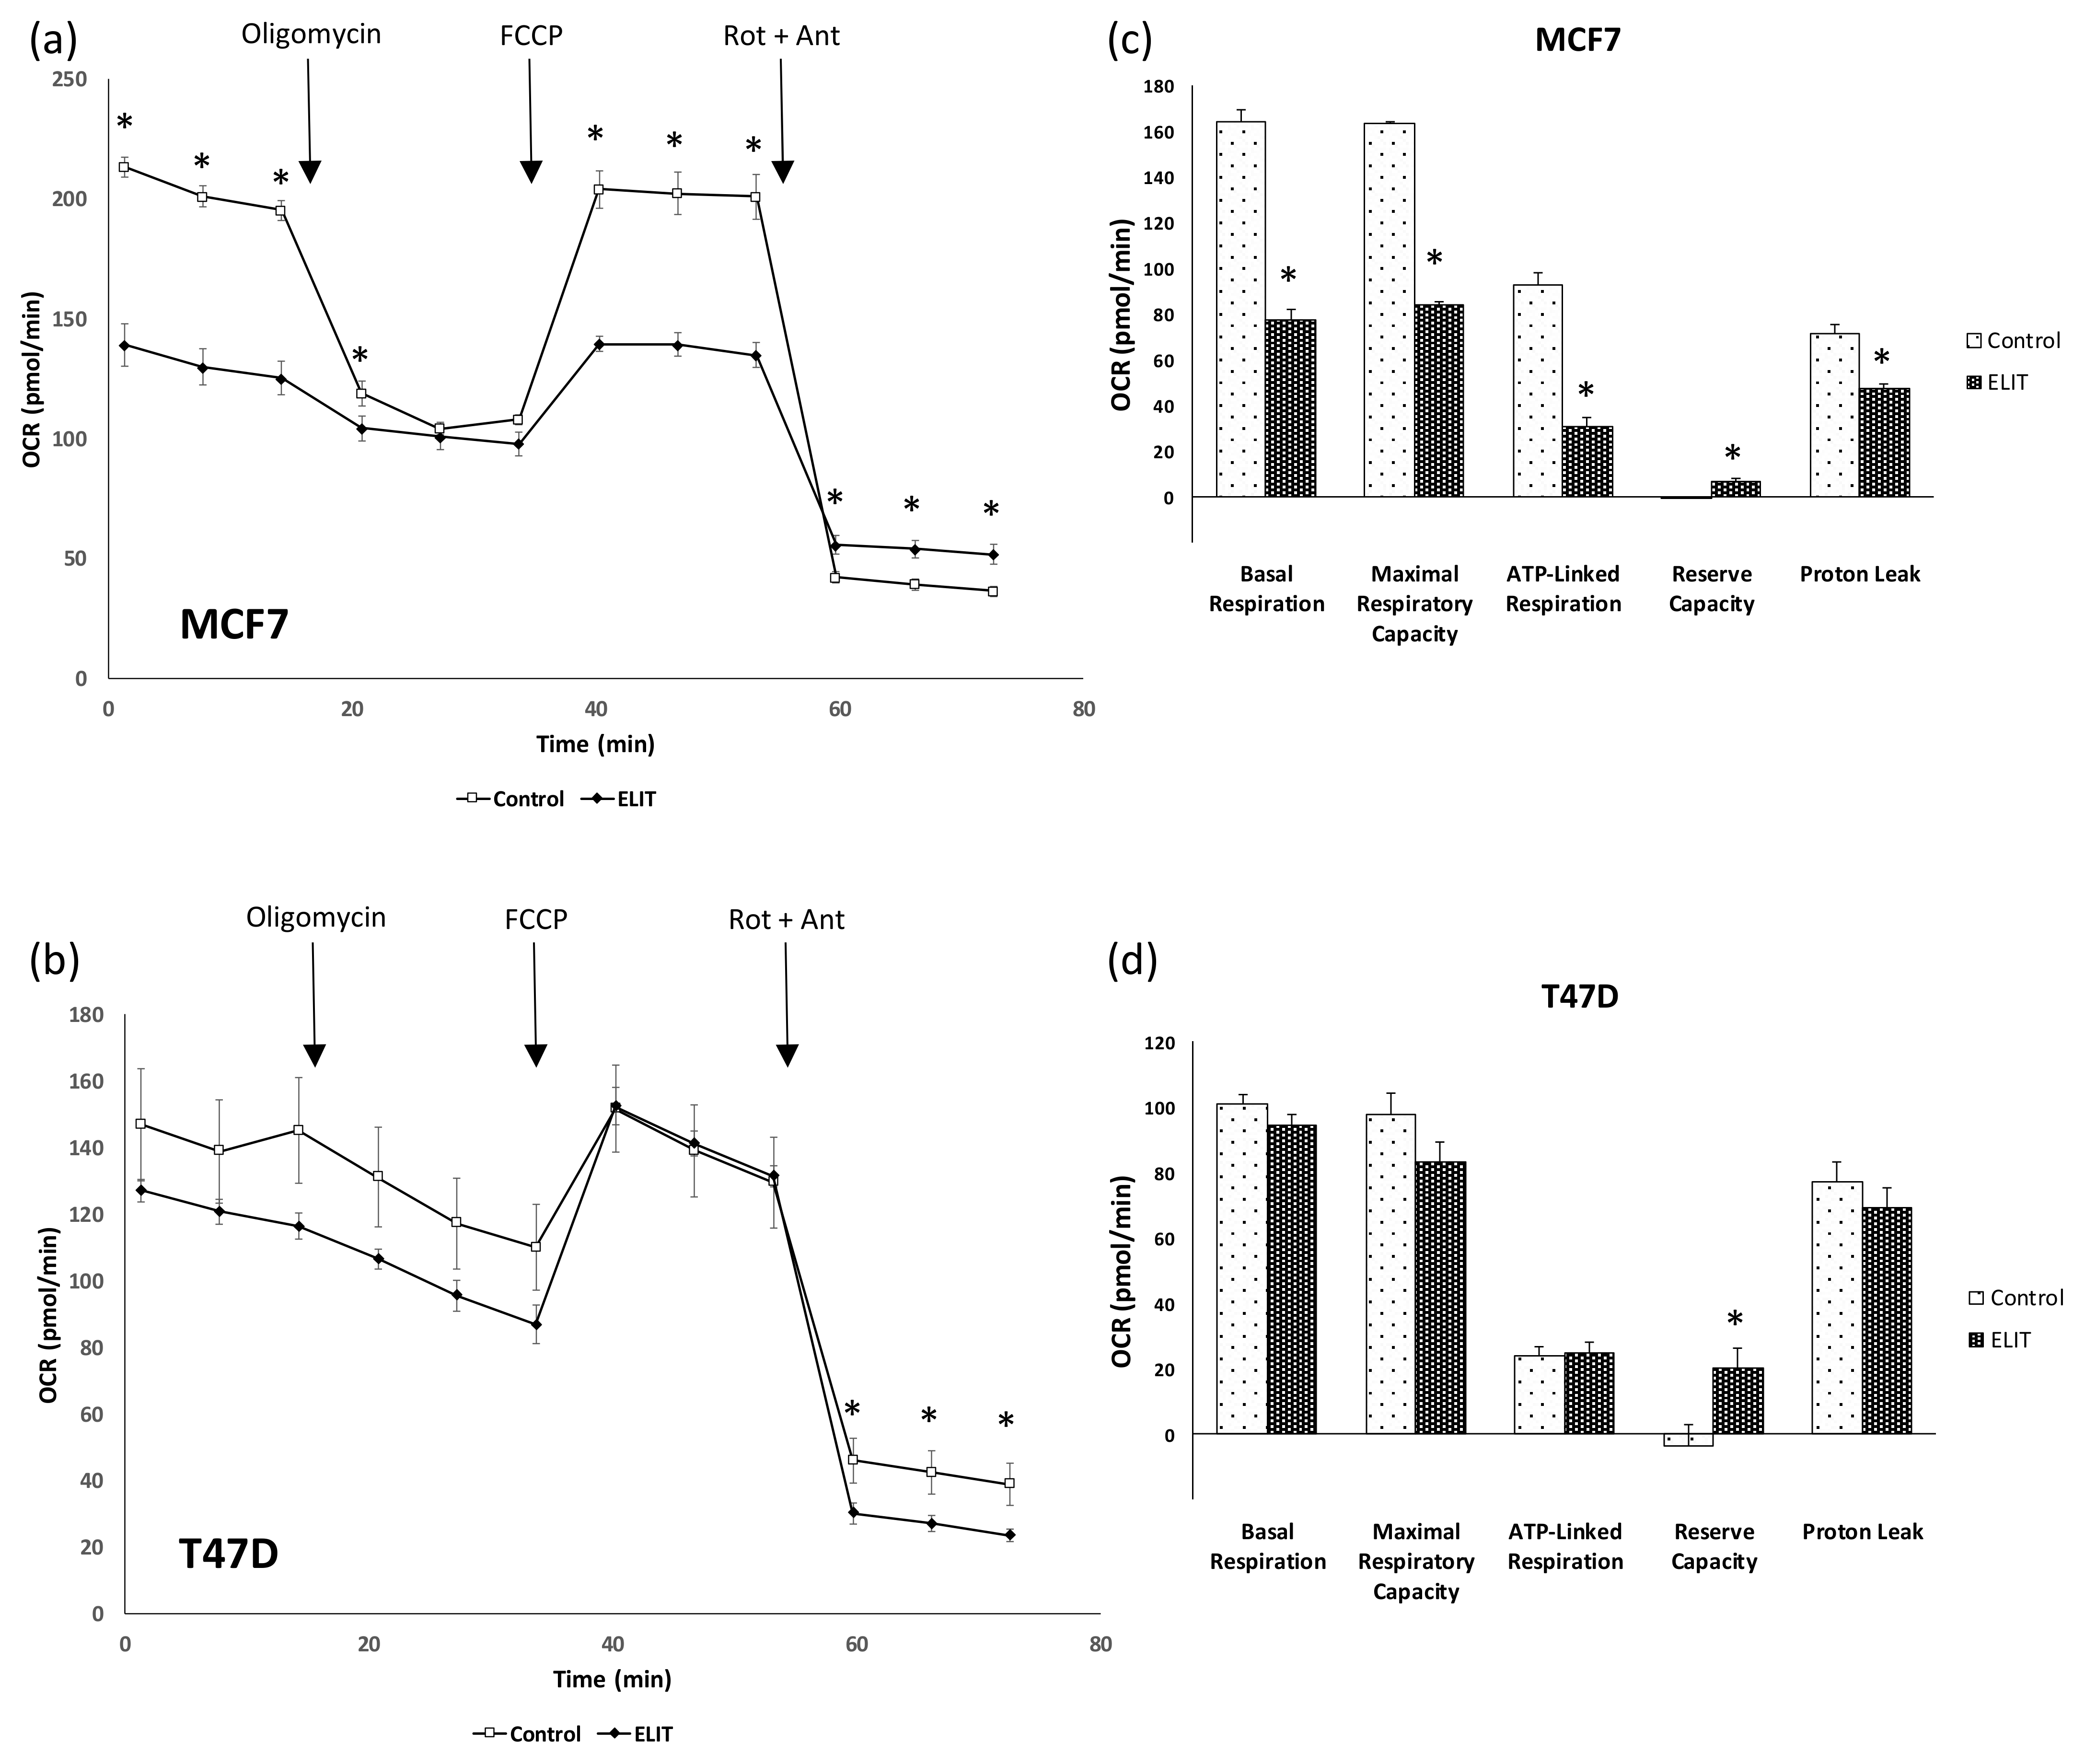
3.3. Mitochondrial Biogenesis and Functionality Are Reduced in Breast Cancer Cell Lines after ELIT Treatment with a High ERα/ERβ Ratio
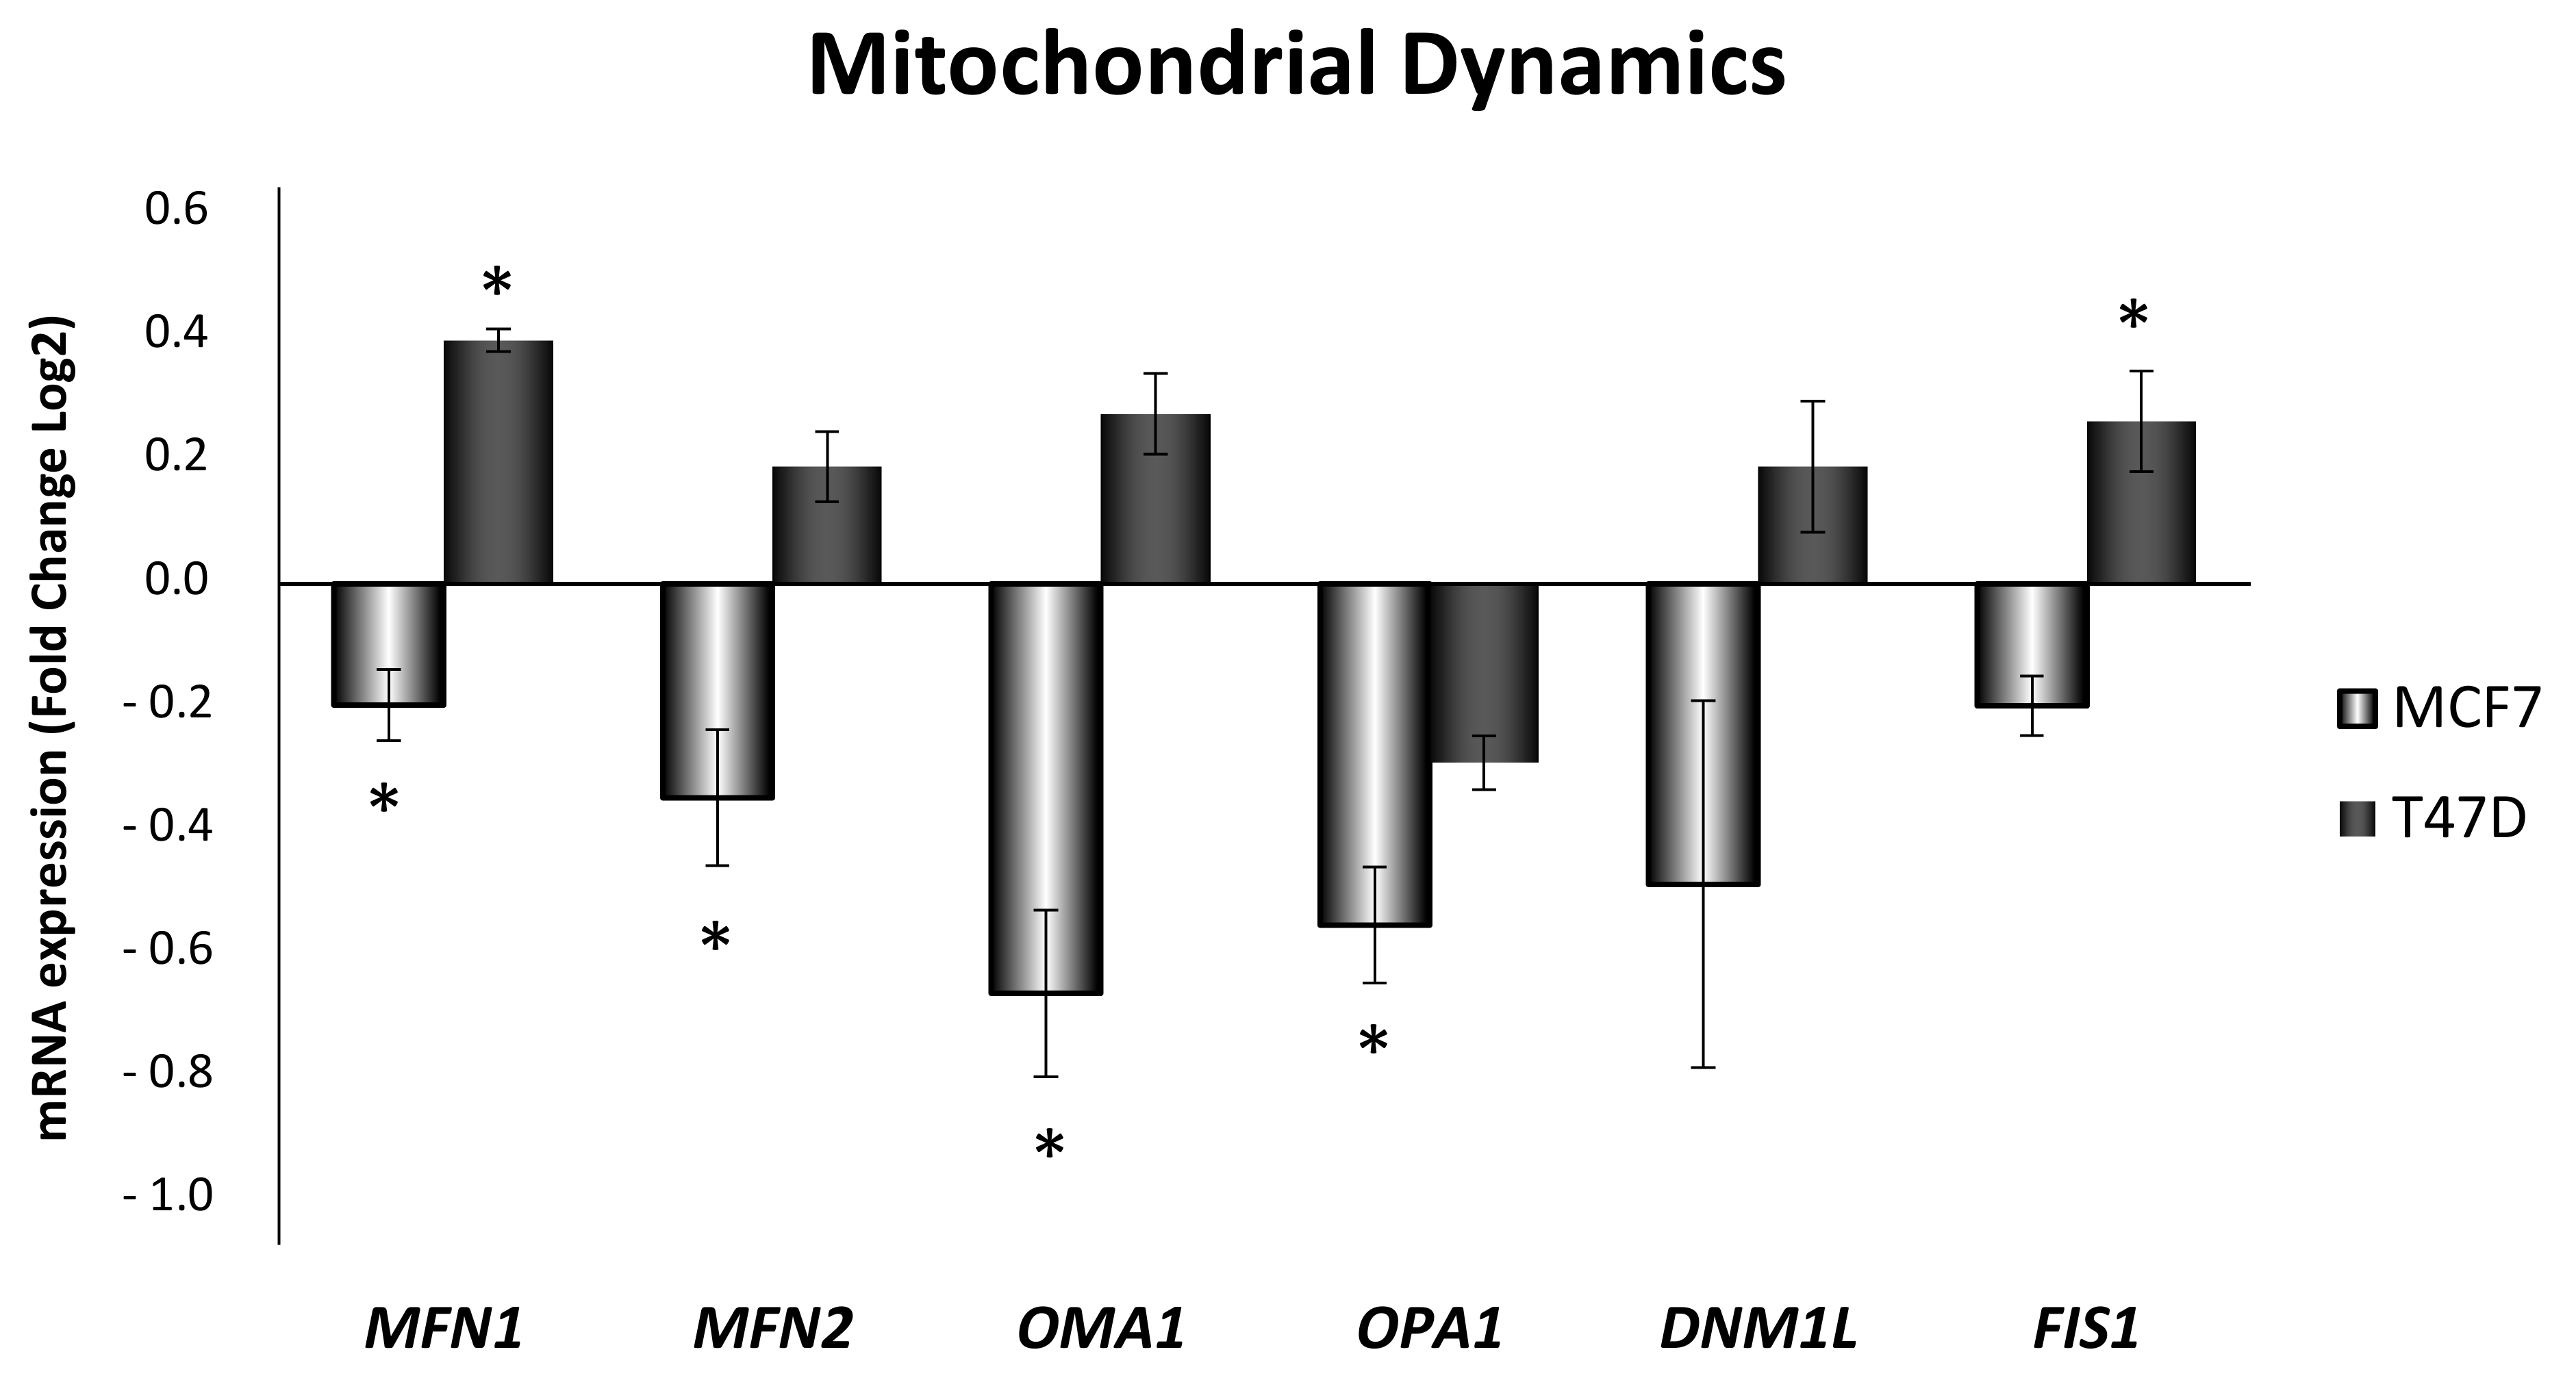
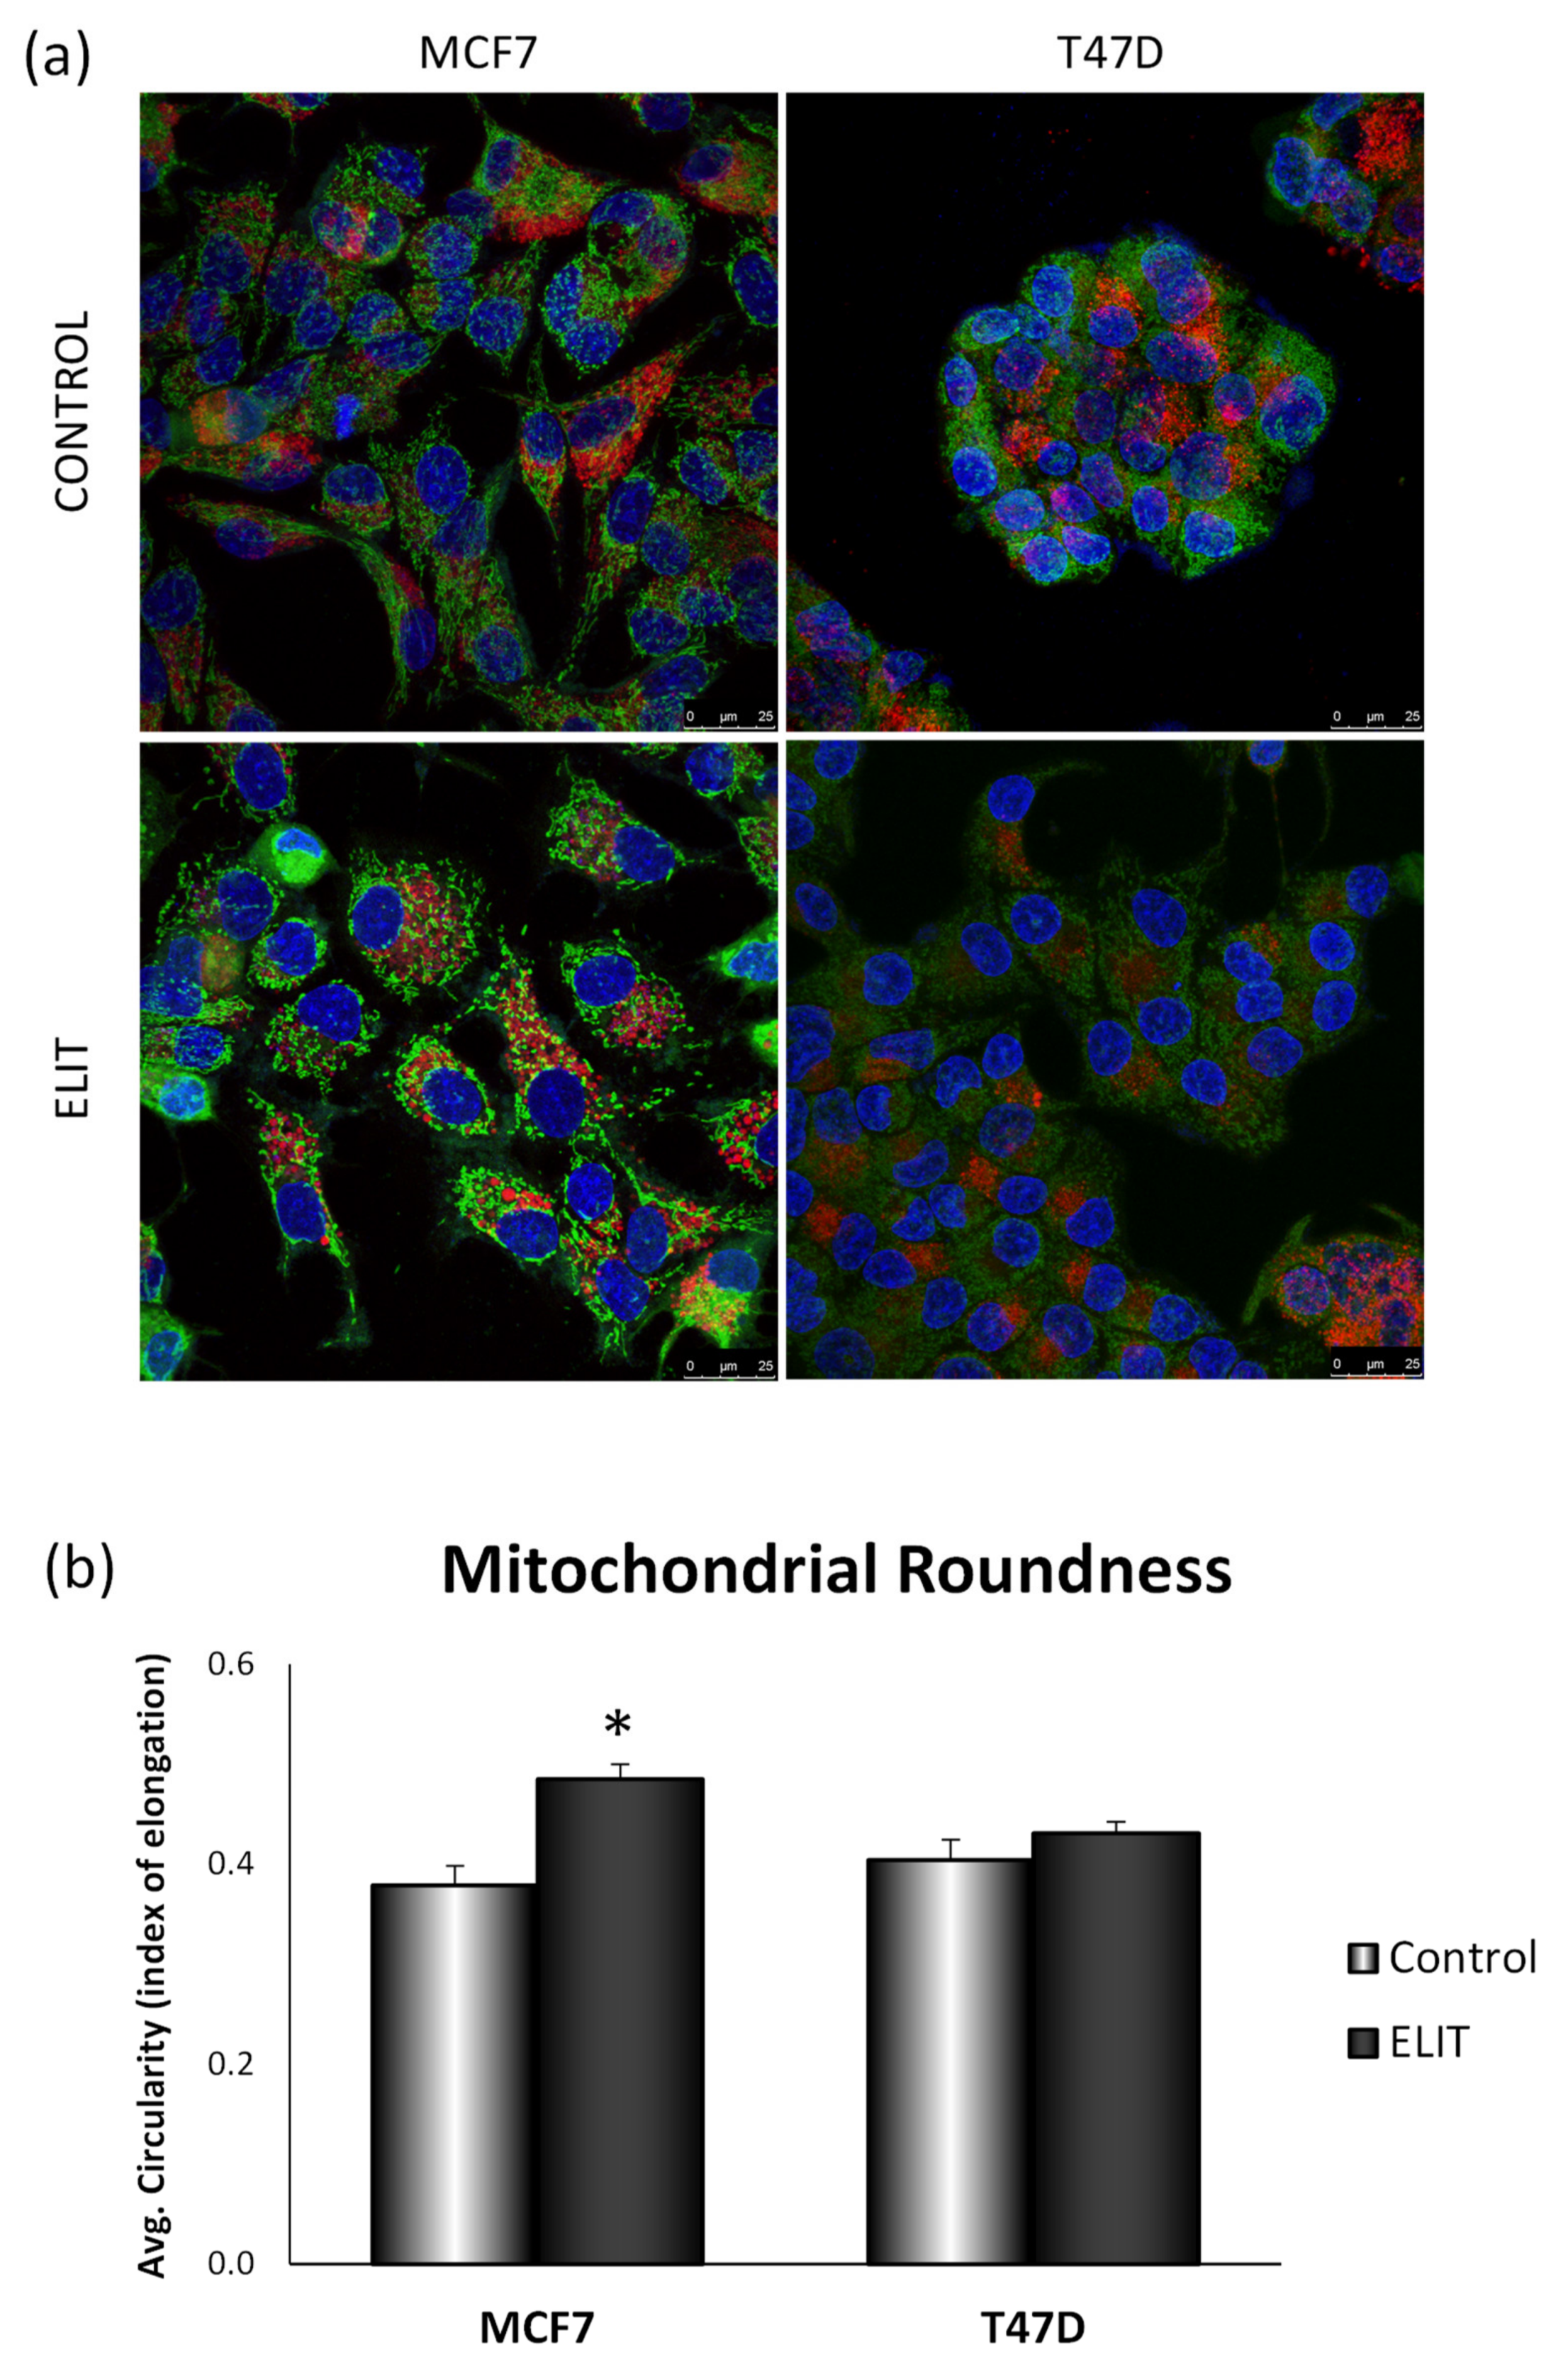
3.4. Obesity-Related Inflammation Treatment Affects Mitochondrial Dynamics and Mitochondrial Network in Breast Cancer Cell Lines
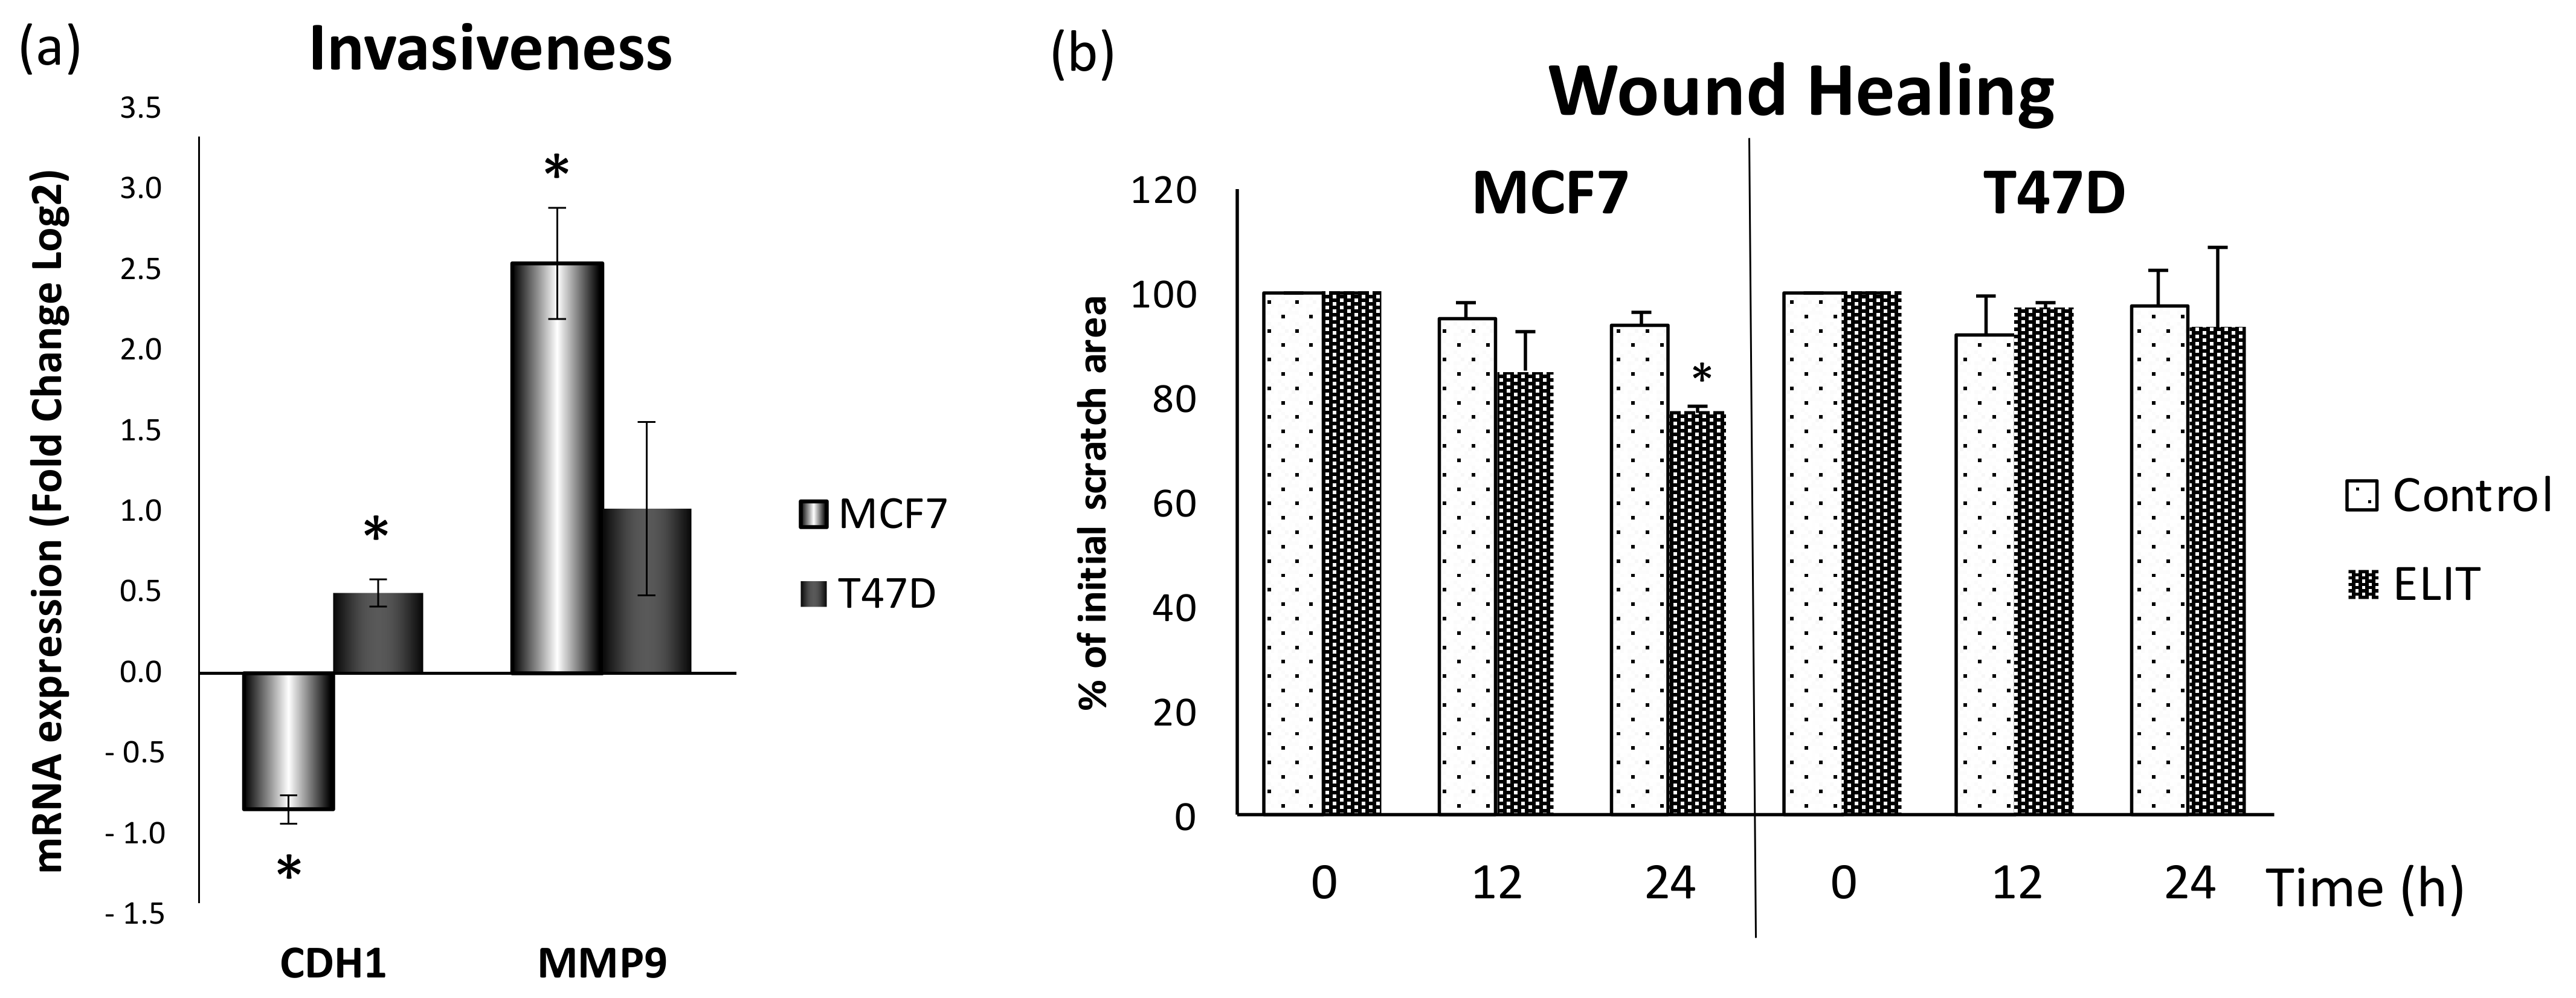
3.5. Obesity-Related Inflammation Treatment Increase Invasiveness in Breast Cancer Cell Lines with a High ERα/ERβ Ratio
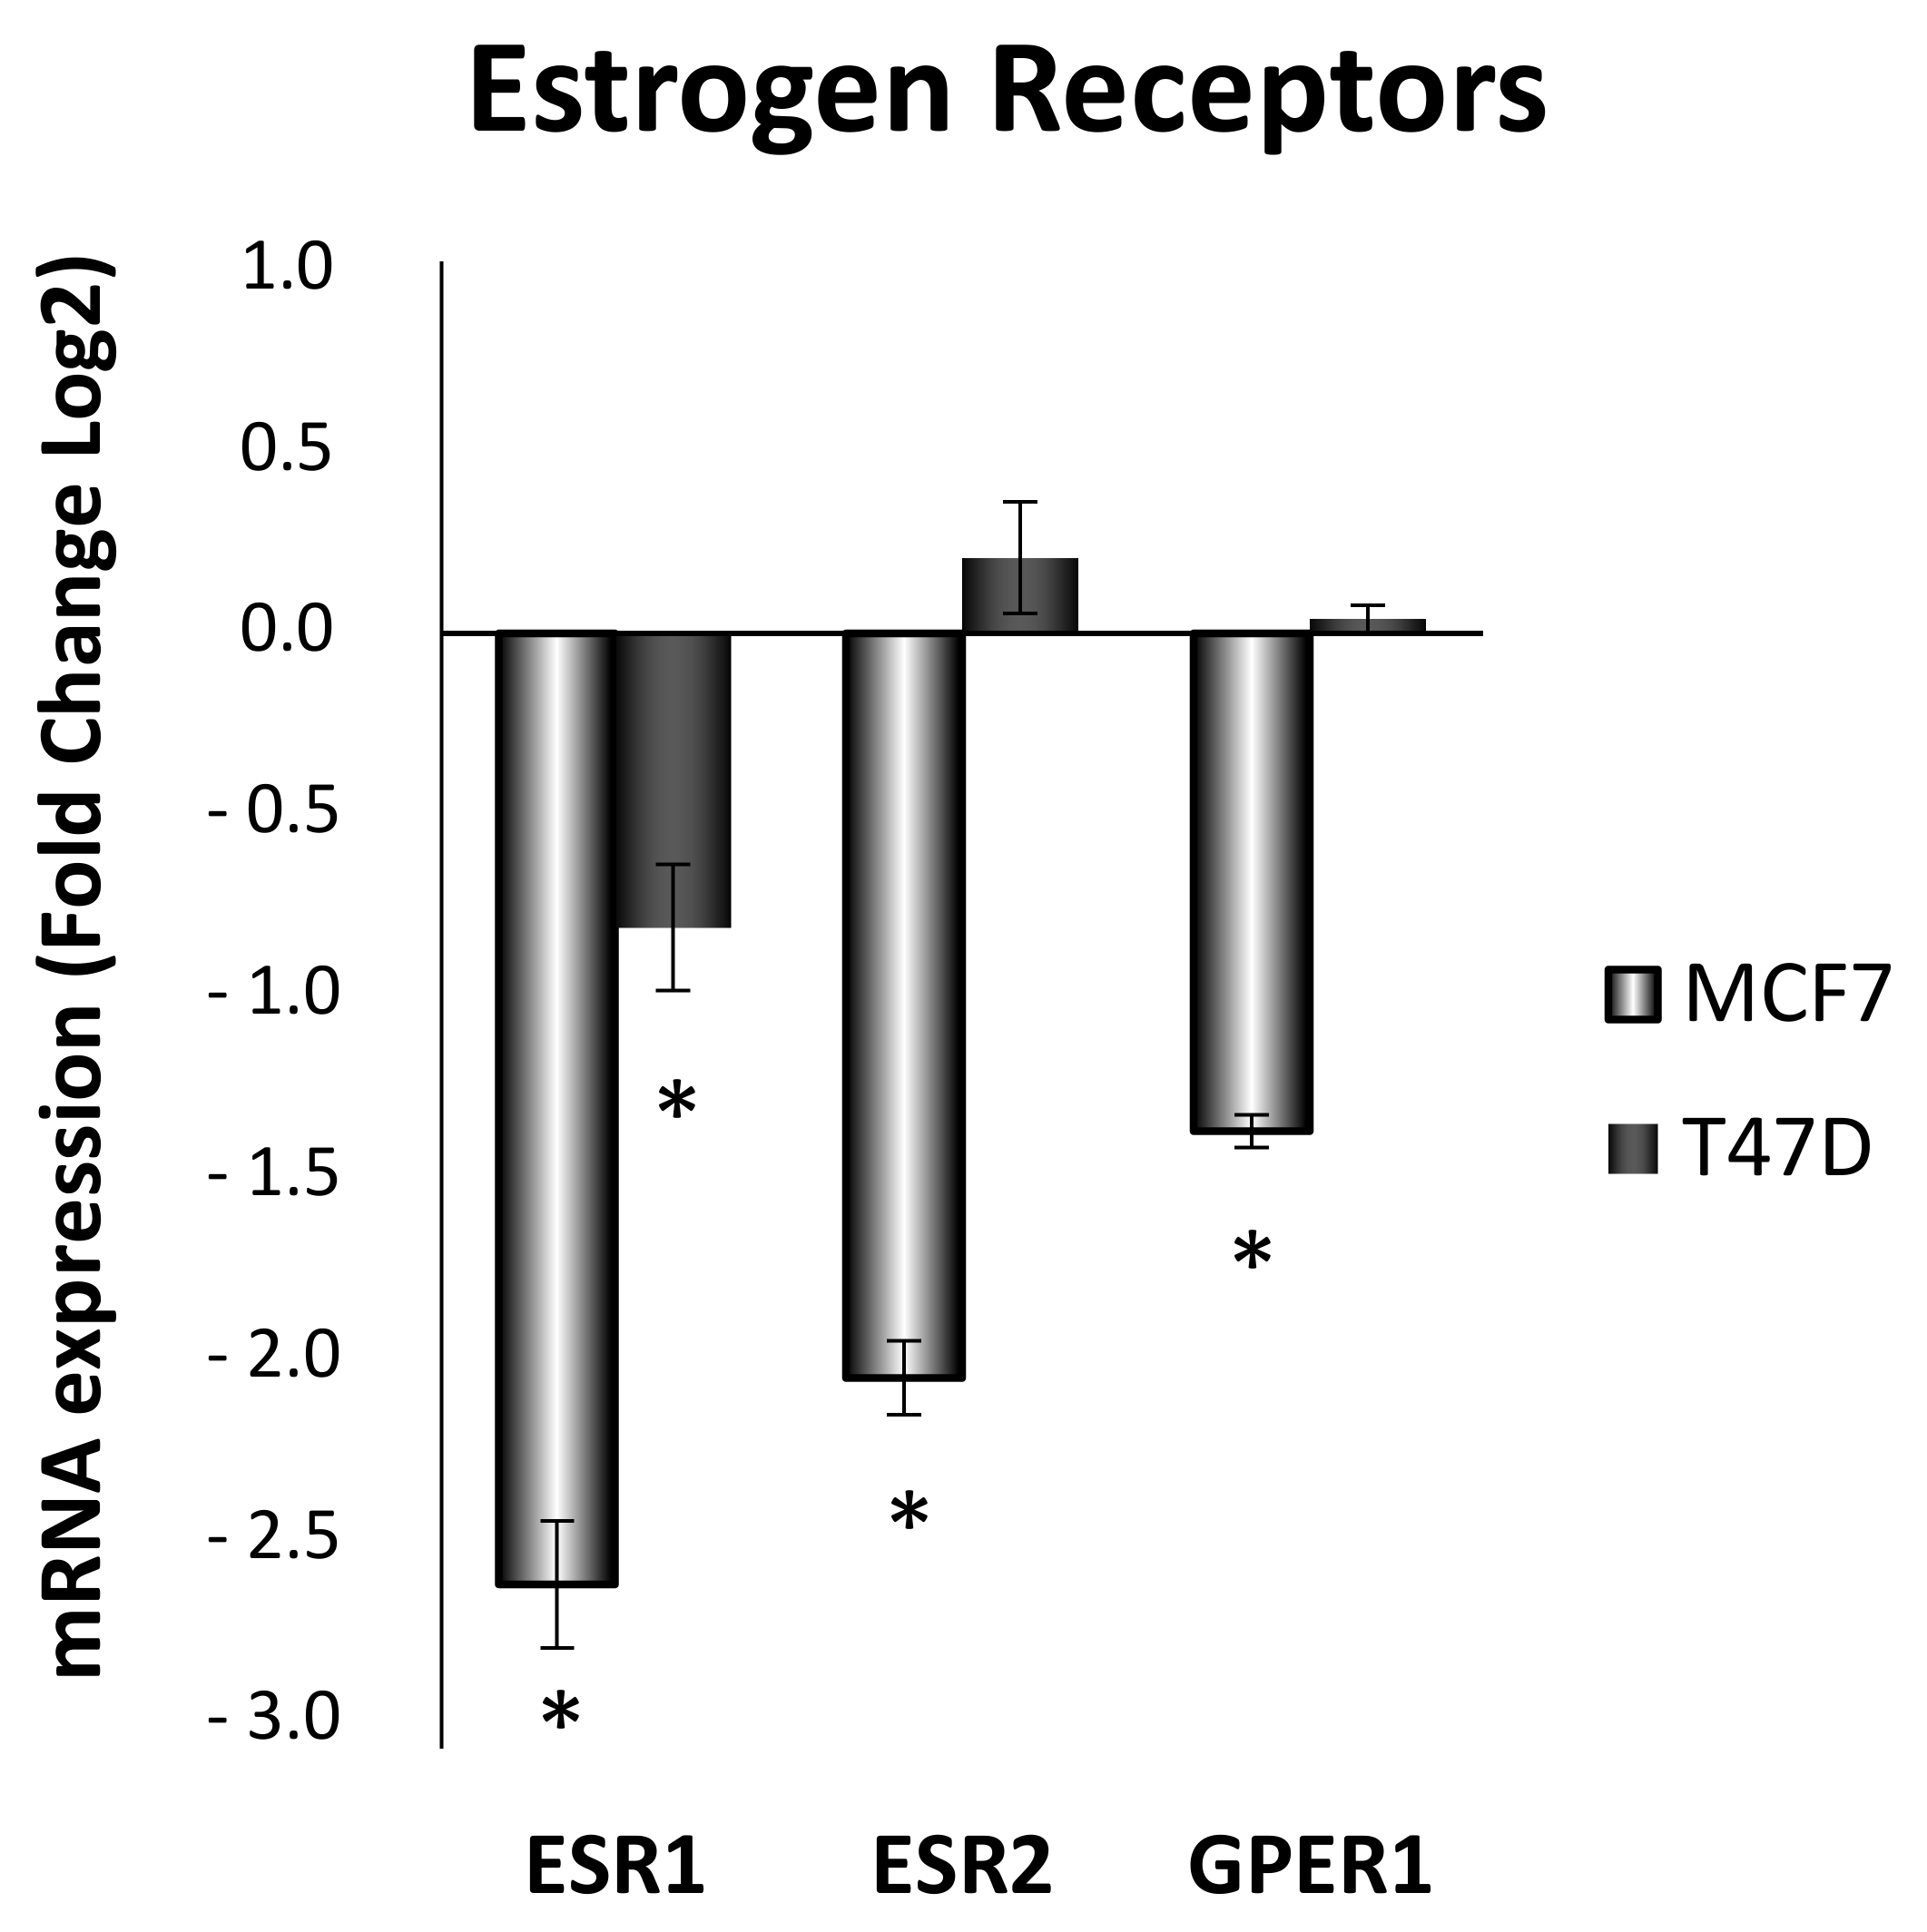
3.6. Estrogen Receptor Ratio Is Modified by ELIT Treatment in Breast Cancer Cell Lines
3.7. IL6R in Breast Tumors Correlates with Inflammation, Mitochondrial Biogenesis, and Oxidative Stress Markers in Different BMI Situations
4. Discussion
5. Conclusions
Supplementary Materials
Author Contributions
Funding
Institutional Review Board Statement
Informed Consent Statement
Data Availability Statement
Acknowledgments
Conflicts of Interest
References
- Harbeck, N.; Penault-Llorca, F.; Cortés, J.; Gnant, M.; Houssami, N.; Poortmans, P.; Ruddy, K.; Tsang, J.; Cardoso, F. Breast cancer. Nat. Rev. Dis. Primers 2019, 5, 66. [Google Scholar] [CrossRef]
- Tao, Z.Q.; Shi, A.; Lu, C.; Song, T.; Zhang, Z.; Zhao, J. Breast Cancer: Epidemiology and Etiology. Cell Biochem. Biophys. 2015, 72, 333–338. [Google Scholar] [CrossRef]
- Calle, E.E.; Kaaks, R. Overweight, obesity and cancer: Epidemiological evidence and proposed mechanisms. Nat. Rev. Cancer 2004, 4, 579–591. [Google Scholar] [CrossRef]
- KA, B. Metabolic pathways in obesity-related breast cancer. Nat. Rev. Endocrinol. 2021, 17, 350–363. [Google Scholar] [CrossRef]
- Himbert, C.; Delphan, M.; Scherer, D.; Bowers, L.W.; Hursting, S.; Ulrich, C.M. Signals from the Adipose Microenvironment and the Obesity-Cancer Link—A Systematic Review. Cancer Prev. Res. 2017, 10, 494. [Google Scholar] [CrossRef] [PubMed]
- Klinge, C.M. Estrogenic control of mitochondrial function. Redox Biol. 2020, 31, 101435. [Google Scholar] [CrossRef]
- Roberts, D.L.; Dive, C.; Renehan, A.G. Biological mechanisms linking obesity and cancer risk: New perspectives. Annu. Rev. Med. 2010, 61, 301–316. [Google Scholar] [CrossRef] [PubMed]
- Liao, T.L.; Tzeng, C.R.; Yu, C.L.; Wang, Y.P.; Kao, S.H. Estrogen receptor-β in mitochondria: Implications for mitochondrial bioenergetics and tumorigenesis. Ann. N. Y. Acad. Sci. 2015, 1350, 52–60. [Google Scholar] [CrossRef] [PubMed]
- Sastre-Serra, J.; Nadal-Serrano, M.; Pons, D.G.; Roca, P.; Oliver, J. The over-expression of ERbeta modifies estradiol effects on mitochondrial dynamics in breast cancer cell line. Int. J. Biochem. Cell Biol. 2013, 45, 1509–1515. [Google Scholar] [CrossRef] [PubMed]
- Simone, V.; D’Avenia, M.; Argentiero, A.; Felici, C.; Rizzo, F.M.; De Pergola, G.; Silvestris, F. Obesity and Breast Cancer: Molecular Interconnections and Potential Clinical Applications. Oncologist 2016, 21, 404. [Google Scholar] [CrossRef]
- Shouman, S.; Wagih, M.; Kamel, M. Leptin influences estrogen metabolism and increases DNA adduct formation in breast cancer cells. Cancer Biol. Med. 2016, 13, 505. [Google Scholar] [CrossRef][Green Version]
- Postow, M.A.; Callahan, M.K.; Wolchok, J.D. Immune checkpoint blockade in cancer therapy. J. Clin. Oncol. 2015, 33, 1974–1982. [Google Scholar] [CrossRef] [PubMed]
- Zhou, X.; Yang, S.; Wang, Z.; Feng, X.; Liu, P.; Lv, X.-B.; Li, F.; Yu, F.-X.; Sun, Y.; Yuan, H.; et al. Estrogen regulates Hippo signaling via GPER in breast cancer. J. Clin. Investig. 2015, 125, 2123–2135. [Google Scholar] [CrossRef] [PubMed]
- Macciò, A.; Madeddu, C. Obesity, inflammation, and postmenopausal breast cancer: Therapeutic implications. Sci. World J. 2011, 11, 2020–2036. [Google Scholar] [CrossRef] [PubMed]
- Bhat, H.K.; Calaf, G.; Hei, T.K.; Loya, T.; Vadgama, J.V. Critical role of oxidative stress in estrogen-induced carcinogenesis. Proc. Natl. Acad. Sci. USA 2003, 100, 3913–3918. [Google Scholar] [CrossRef]
- Goldberg, J.E.; Schwertfeger, K.L. Proinflammatory Cytokines in Breast Cancer: Mechanisms of Action and Potential Targets for Therapeutics. Curr. Drug Targets 2010, 11, 1133–1146. [Google Scholar] [CrossRef]
- Choi, J.; Cha, Y.J.; Koo, J.S. Adipocyte biology in breast cancer: From silent bystander to active facilitator. Prog. Lipid Res. 2018, 69, 11–20. [Google Scholar] [CrossRef]
- Crusz, S.M.; Balkwill, F.R. Inflammation and cancer: Advances and new agents. Nat. Rev. Clin. Oncol. 2015, 12, 584–596. [Google Scholar] [CrossRef]
- Hanahan, D.; Weinberg, R.A. Hallmarks of cancer: The next generation. Cell 2011, 144, 646–674. [Google Scholar] [CrossRef]
- Pedram, A.; Razandi, M.; Wallace, D.C.; Levin, E.R. Functional estrogen receptors in the mitochondria of breast cancer cells. Mol. Biol. Cell 2006, 17, 2125–2137. [Google Scholar] [CrossRef]
- Fariss, M.W.; Chan, C.B.; Patel, M.; Van Houten, B.; Orrenius, S. Role of mitochondria in toxic oxidative stress. Mol. Interv. 2005, 5, 94–111. [Google Scholar] [CrossRef]
- Murphy, M.P. How mitochondria produce reactive oxygen species. Biochem. J. 2009, 417, 1–13. [Google Scholar] [CrossRef]
- Moloney, J.N.; Cotter, T.G. ROS signalling in the biology of cancer. Semin. Cell Dev. Biol. 2018, 80, 50–64. [Google Scholar] [CrossRef]
- Justo, R.; Boada, J.; Frontera, M.; Oliver, J.; Bermúdez, J.; Gianotti, M. Gender dimorphism in rat liver mitochondrial oxidative metabolism and biogenesis. Am. J. Physiol. Physiol. 2005, 289, C372–C378. [Google Scholar] [CrossRef] [PubMed]
- Liesa, M.; Palacín, M.; Zorzano, A. Mitochondrial dynamics in mammalian health and disease. Physiol. Rev. 2009, 89, 799–845. [Google Scholar] [CrossRef] [PubMed]
- Sastre-Serra, J.; Nadal-Serrano, M.; Pons, D.G.; Valle, A.; Oliver, J.; Roca, P. The effects of 17β-estradiol on mitochondrial biogenesis and function in breast cancer cell lines are dependent on the ERα/ERβ Ratio. Cell. Physiol. Biochem. 2012, 29, 261–268. [Google Scholar] [CrossRef] [PubMed]
- Guha, M.; Srininvasan, S.; Ruthel, G.; Kashina, A.K.; Carstens, R.P.; Mendoza, A.; Khanna, C.; Van Winkle, T.; Avadhani, N.G. Mitochondrial retrograde signaling induces epithelial-mesenchymal transition and generates breast cancer stem cells. Oncogene 2014, 33, 5238–5250. [Google Scholar] [CrossRef] [PubMed]
- Tsai, J.H.; Yang, J. Epithelial-mesenchymal plasticity in carcinoma metastasis. Genes Dev. 2013, 27, 2192–2206. [Google Scholar] [CrossRef] [PubMed]
- Avtanski, D.; Garcia, A.; Caraballo, B.; Thangeswaran, P.; Marin, S.; Bianco, J.; Lavi, A.; Poretsky, L. Resistin induces breast cancer cells epithelial to mesenchymal transition (EMT) and stemness through both adenylyl cyclase-associated protein 1 (CAP1)-dependent and CAP1-independent mechanisms. Cytokine 2019, 120, 155–164. [Google Scholar] [CrossRef]
- Olea-Flores, M.; Juárez-Cruz, J.C.; Mendoza-Catalán, M.A.; Padilla-Benavides, T.; Navarro-Tito, N. Signaling Pathways Induced by Leptin during Epithelial–Mesenchymal Transition in Breast Cancer. Int. J. Mol. Sci. 2018, 19, 3493. [Google Scholar] [CrossRef] [PubMed]
- Valle, A.; Sastre-Serra, J.; Oliver, J.; Roca, P. Chronic leptin treatment sensitizes MCF-7 breast cancer cells to estrogen. Cell. Physiol. Biochem. 2011, 28, 823–832. [Google Scholar] [CrossRef] [PubMed]
- Madeddu, C.; Gramignano, G.; Floris, C.; Murenu, G.; Sollai, G.; Macciò, A. Role of inflammation and oxidative stress in post-menopausal oestrogen-dependent breast cancer. J. Cell. Mol. Med. 2014, 18, 2519. [Google Scholar] [CrossRef] [PubMed]
- Rose, D.P.; Vona-Davis, L. Biochemical and molecular mechanisms for the association between obesity, chronic Inflammation, and breast cancer. BioFactors 2014, 40, 1–12. [Google Scholar] [CrossRef]
- Sastre-Serra, J.; Ahmiane, Y.; Roca, P.; Oliver, J.; Pons, D.G. Xanthohumol, a hop-derived prenylflavonoid present in beer, impairs mitochondrial functionality of SW620 colon cancer cells. Int. J. Food Sci. Nutr. 2019, 70, 396–404. [Google Scholar] [CrossRef] [PubMed]
- Torrens-Mas, M.; Hernández-López, R.; Pons, D.G.; Roca, P.; Oliver, J.; Sastre-Serra, J. Sirtuin 3 silencing impairs mitochondrial biogenesis and metabolism in colon cancer cells. Am. J. Physiol. Cell Physiol. 2019, 317, C398–C404. [Google Scholar] [CrossRef]
- Pons, D.G.; Vilanova-Llompart, J.; Gaya-Bover, A.; Alorda-Clara, M.; Oliver, J.; Roca, P.; Sastre-Serra, J. The phytoestrogen genistein affects inflammatory-related genes expression depending on the ERα/ERβ ratio in breast cancer cells. Int. J. Food Sci. Nutr. 2019, 70, 941–949. [Google Scholar] [CrossRef]
- Pons, D.G.; Moran, C.; Alorda-Clara, M.; Oliver, J.; Roca, P.; Sastre-Serra, J. Micronutrients Selenomethionine and Selenocysteine Modulate the Redox Status of MCF-7 Breast Cancer Cells. Nutrients 2020, 12, 865. [Google Scholar] [CrossRef]
- Nadal-Serrano, M.; Sastre-Serra, J.; Pons, D.G.; Miró, A.M.; Oliver, J.; Roca, P. The ERalpha/ERbeta ratio determines oxidative stress in breast cancer cell lines in response to 17Beta-estradiol. J. Cell. Biochem. 2012, 113, 3178–3182. [Google Scholar] [CrossRef]
- Ellulu, M.S.; Patimah, I.; Khazaai, H.; Rahmat, A.; Abed, Y. Obesity & inflammation: The linking mechanism & the complications. Arch. Med. Sci. 2017, 13, 851–863. [Google Scholar] [CrossRef]
- Hartman, Z.C.; Poage, G.M.; Den Hollander, P.; Tsimelzon, A.; Hill, J.; Panupinthu, N.; Zhang, Y.; Mazumdar, A.; Hilsenbeck, S.G.; Mills, G.B.; et al. Growth of triple-negative breast cancer cells relies upon coordinate autocrine expression of the proinflammatory cytokines IL-6 and IL-8. Cancer Res. 2013, 73, 3470–3480. [Google Scholar] [CrossRef]
- Pons, D.G.; Torrens-Mas, M.; Nadal-Serrano, M.; Sastre-Serra, J.; Roca, P.; Oliver, J. The presence of Estrogen Receptor β modulates the response of breast cancer cells to therapeutic agents. Int. J. Biochem. Cell Biol. 2015, 66, 85–94. [Google Scholar] [CrossRef] [PubMed]
- Sastre-Serra, J.; Valle, A.; Company, M.M.; Garau, I.; Oliver, J.; Roca, P. Estrogen down-regulates uncoupling proteins and increases oxidative stress in breast cancer. Free Radic. Biol. Med. 2010, 48, 506–512. [Google Scholar] [CrossRef] [PubMed]
- Morani, A.; Warner, M.; Gustafsson, J.Å. Biological functions and clinical implications of oestrogen receptors alfa and beta in epithelial tissues. J. Intern. Med. 2008, 264, 128–142. [Google Scholar] [CrossRef] [PubMed]
- Hartman, J.; Müller, P.; Foster, J.S.; Wimalasena, J.; Gustafsson, J.Å.; Ström, A. HES-1 inhibits 17β-estradiol and heregulin-β1-mediated upregulation of E2F-1. Oncogene 2004, 23, 8826–8833. [Google Scholar] [CrossRef] [PubMed]
- Torrens-Mas, M.; Pons, D.G.; Sastre-Serra, J.; Oliver, J.; Roca, P. SIRT3 Silencing Sensitizes Breast Cancer Cells to Cytotoxic Treatments Through an Increment in ROS Production. J. Cell. Biochem. 2017, 118, 397–406. [Google Scholar] [CrossRef]
- Abboud, M.M.; Al Awaida, W.; Alkhateeb, H.H.; Abu-Ayyad, A.N. Antitumor Action of Amygdalin on Human Breast Cancer Cells by Selective Sensitization to Oxidative Stress. Nutr. Cancer 2019, 71, 483–490. [Google Scholar] [CrossRef] [PubMed]
- Hu, Y.; Rosen, D.G.; Zhou, Y.; Feng, L.; Yang, G.; Liu, J.; Huang, P. Mitochondrial manganese-superoxide dismutase expression in ovarian cancer: Role in cell proliferation and response to oxidative stress. J. Biol. Chem. 2005, 280, 39485–39492. [Google Scholar] [CrossRef]
- Perron, N.R.; Beeson, C.; Rohrer, B. Early alterations in mitochondrial reserve capacity; a means to predict subsequent photoreceptor cell death. J. Bioenerg. Biomembr. 2013, 45, 101–109. [Google Scholar] [CrossRef][Green Version]
- Rodrigues, T.; Ferraz, L.S. Therapeutic potential of targeting mitochondrial dynamics in cancer. Biochem. Pharmacol. 2020, 182, 114282. [Google Scholar] [CrossRef]
- Blanquer-Rossellõ, M.M.; Santandreu, F.M.; Oliver, J.; Roca, P.; Valle, A. Leptin Modulates Mitochondrial Function, Dynamics and Biogenesis in MCF-7 Cells. J. Cell. Biochem. 2015, 116, 2039–2048. [Google Scholar] [CrossRef]
- Genova, M.L.; Lenaz, G. Functional role of mitochondrial respiratory supercomplexes. Biochim. Biophys. Acta BBA Bioenerg. 2014, 1837, 427–443. [Google Scholar] [CrossRef] [PubMed]
- Paradies, G.; Paradies, V.; Ruggiero, F.M.; Petrosillo, G. Role of Cardiolipin in Mitochondrial Function and Dynamics in Health and Disease: Molecular and Pharmacological Aspects. Cells 2019, 8, 728. [Google Scholar] [CrossRef] [PubMed]
- Sanchis-Gomar, F.; Garcia-Gimenez, J.; Gomez-Cabrera, M.; Pallardo, F. Mitochondrial Biogenesis in Health and Disease. Molecular and Therapeutic Approaches. Curr. Pharm. Des. 2014, 20, 5619–5633. [Google Scholar] [CrossRef]
- Ikeda, M.; Ide, T.; Fujino, T.; Arai, S.; Saku, K.; Kakino, T.; Tyynismaa, H.; Yamasaki, T.; Yamada, K.I.; Kang, D.; et al. Overexpression of TFAM or twinkle increases mtDNA copy number and facilitates cardioprotection associated with limited mitochondrial oxidative stress. PLoS ONE 2015, 10, e0119687. [Google Scholar] [CrossRef] [PubMed]
- Ma, J.H.; Qi, J.; Lin, S.Q.; Zhang, C.Y.; Liu, F.Y.; Xie, W.D.; Li, X. STAT3 targets ERR-α to promote epithelial-mesenchymal transition, migration, and invasion in triple-negative breast cancer cells. Mol. Cancer Res. 2019, 17, 2184–2195. [Google Scholar] [CrossRef]
- Sastre-Serra, J.; Nadal-Serrano, M.; Pons, D.G.; Valle, A.; Garau, I.; García-Bonafé, M.; Oliver, J.; Roca, P. The oxidative stress in breast tumors of postmenopausal women is ERα/ERβ ratio dependent. Free Radic. Biol. Med. 2013, 61, 11–17. [Google Scholar] [CrossRef]
- Guevara, R.; Santandreu, F.M.; Valle, A.; Gianotti, M.; Oliver, J.; Roca, P. Sex-dependent differences in aged rat brain mitochondrial function and oxidative stress. Free Radic. Biol. Med. 2009, 46, 169–175. [Google Scholar] [CrossRef]
- Valle, A.; Guevara, R.; García-Palmer, F.J.; Roca, P.; Oliver, J. Caloric restriction retards the age-related decline in mitochondrial function of brown adipose tissue. Rejuvenation Res. 2008, 11, 597–604. [Google Scholar] [CrossRef]
- Akhmedov, A.T.; Rybin, V.; Marín-García, J. Mitochondrial oxidative metabolism and uncoupling proteins in the failing heart. Hear. Fail. Rev. 2014, 20, 227–249. [Google Scholar] [CrossRef]
- Rambold, A.S.; Kostelecky, B.; Lippincott-Schwartz, J. Together we are stronger: Fusion protects mitochondria from autophagosomal degradation. Autophagy 2011, 7, 1568. [Google Scholar] [CrossRef]
- Rambold, A.S.; Kostelecky, B.; Elia, N.; Lippincott-Schwartz, J. Tubular network formation protects mitochondria from autophagosomal degradation during nutrient starvation. Proc. Natl. Acad. Sci. USA 2011, 108, 10190. [Google Scholar] [CrossRef] [PubMed]
- Pani, G.; Galeotti, T.; Chiarugi, P. Metastasis: Cancer cell’s escape from oxidative stress. Cancer Metastasis Rev. 2010, 29, 351–378. [Google Scholar] [CrossRef] [PubMed]
- Adams, B.D.; Claffey, K.P.; White, B.A. Argonaute-2 Expression Is Regulated by Epidermal Growth Factor Receptor and Mitogen-Activated Protein Kinase Signaling and Correlates with a Transformed Phenotype in Breast Cancer Cells. Endocrinology 2009, 150, 14. [Google Scholar] [CrossRef] [PubMed]
- Wang, Y.Y.; Attané, C.; Milhas, D.; Dirat, B.; Dauvillier, S.; Guerard, A.; Gilhodes, J.; Lazar, I.; Alet, N.; Laurent, V.; et al. Mammary adipocytes stimulate breast cancer invasion through metabolic remodeling of tumor cells. JCI Insight 2017, 2. [Google Scholar] [CrossRef] [PubMed]


| Gene Accession Number | Forward Primer (5′-3′) | An. T° (°C) |
|---|---|---|
| Reverse Primer (5′-3′) | ||
| ESR2 NM_001437.3 | TAG TGG TCC ATC GCC AGT TAT | 60 |
| GGG AGC CAC ACT TCA CCA T | ||
| NFE2L2 NM_006164.5 | GCG ACG GAA AGA AGT ATG AGC | 60 |
| GTT GGC AGA TCC ACT GGT TT | ||
| CAT NM_001752.4 | CAT CGC CAC ATG AAT GGA TA | 61 |
| CCA ACT GGG ATG AGA GGG TA | ||
| GSR NM_000637.5 | TCA CGC AGT TAC CAA AAG GA | 64 |
| CAC ACC CAA GTC CCC TGC AT | ||
| SOD1 NM_000454.5 | TCA GGA GAC CAT TGC ATC ATT | 64 |
| CGC TTT CCT GTC TTT GTA CTT TCT TC | ||
| SOD2 NM_000636.4 | CGT GCT CCC ACA CAT CAA TC | 64 |
| TGA ACG TCA CCG AGG AGA AG | ||
| UCP2 NM_001381943.1 | GGT GGT CGG AGA TAC CAA | 60 |
| CTC GGG CAA TGG TCT TGT | ||
| TNF NM_000594.4 | AAG CCT GTA GCC CAT GTT GT | 58 |
| GGA CCT GGG AGT AGA TGA GGT | ||
| PTGS2 NM_000963.4 | CCC TTC TGC CTG ACA CCT TT | 60 |
| TTC TGT ACT GCG GGT GGA AC | ||
| IL6 NM_000600.5 | CAG GGG TGG TTA TTG CAT CT | 60 |
| AGG AGA CTT GCC TGG TGA AA | ||
| CXCL8 NM_000584.4 | GGC ACA AAC TTT CAG AGA CAG CAG | 66 |
| GTT TCT TCC TGG CTC TTG TCC TAG | ||
| IL6R NM_000565.4 | TGG GAG GTG GAG AAG AGA GA | 60 |
| AGG ACC TCA GGT GAG AAG CA | ||
| CXCR8 NM_000634.3 | AGT TCT TGG CAC GTC ATC GT | 58 |
| CCC CTG AAG ACA CCA GTT CC | ||
| TGFB NM_000660.7 | TCC TGG CGA TAC CTC AGC AA | 60 |
| CGG TAG TGA ACC CGT TGA TG | ||
| NRF1 NM_005011.5 | CCA CGT TAC AGG GAG GTG AG | 60 |
| TGT AGC TCC CTG CTG CAT CT | ||
| SSBP1 NM_001256510.1 | TGT GAA AAA GGG GTC TCG AA | 60 |
| TGG CCA AAG AAG AAT CAT CC | ||
| PPARGC1A NM_001330751.2 | TCA GTC CTC ACT GGT GGA CA | 60 |
| TGC TTC GTC GTC AAA AAC AG | ||
| TFAM NM_003201.3 | GTG GTT TTC ATC TGT CTT GGC | 60 |
| ACT CCG CCC TAT AAG CAT CTT | ||
| TWNK NM_021830.5 | GGG AGG AGG TGC TAG GAG AA | 61 |
| TTC CTG GCT TGC TTT GGC T | ||
| MFN1 NM_033540.3 | TTC GAT CAA GTT CCG GAT TC | 51 |
| TTG GAG CGG AGA CTT AGC AT | ||
| MFN2 NM_014874.4 | GCA GAA CTT TGT CCC AGA GC | 56 |
| AGA GGC ATC AGT GAG GTG CT | ||
| OPA1 NM_015560.3 | ACA ATG TCA GGC ACA ATC CA | 51 |
| GGC CAG CAA GAT TAG CTA CG | ||
| OMA1 NM_145243.5 | TTG GAT TGC TCT TTG TGG TG | 51 |
| GGT ATC GGG CAT CTT TCT CA | ||
| DNM1L NM_012062.5 | GTT CAC GGC ATG ACC TTT TT | 51 |
| AAG AAC CAA CCA CAG GCA AC | ||
| FIS1 NM_016068.3 | GCT GAA GGA CGA ATC TCA | 55 |
| CTT GCT GTG TCC AAG TCC AA | ||
| SIRT1 NM_012238.5 | GCA GAT TAG TAG GCG GCT TG | 60 |
| TCT GGC ATG TCC CAC TAT CA | ||
| SIRT3 NM_012239.6 | CGG CTC TAC ACG CAG AAC ATC | 56 |
| CAG AGG CTC CCC AAA GAA CAC | ||
| GAPDH NM_002046.7 | CCA CTC CTC CAC CTT TGA CG | 60 |
| CTG GTG GTC CAG GGG TCT TA | ||
| 18S NR_146119.1 | GGACACGGACAGGATTGACA | 60 |
| ACCCACGGAATCGAGAAAGA | ||
| STAT3 NM_139276.3 | CTG GCC TTT GGT GTT GAA AT | 61 |
| AAG GCA CCC ACA GAA ACA AC | ||
| SLC25A14 NM_001282195.2 | CAA GCC GTT GGT CTC CTA AG | 60 |
| CGT TTT CAA TGT CAC CCA TC | ||
| CDH1 NM_004360.5 | GTCACTGACACCAACGATAATCCT | 60 |
| TTTCAGTGTGGTGATTACGACGTTA | ||
| ESRRA NM_004451.5 | TCG CTC CTC CTC TCA TCA TT | 52 |
| TGG CCA AAC CCA AAA ATA AA | ||
| PPARG NM_138712.5 | GAG CCC AAG TTT GAG TTT GC | 61 |
| CTG TGA GGA CTC AGG GTG GT | ||
| ESR1 NM_000125.4 | AAT TCA GAT AAT CGA CGC CAG | 61 |
| GTG TTT CAA CAT TCT CCC TCC TG | ||
| MMP9 NM_004994.3 | CGC AGA CAT CGT CAT CCA GT | 60 |
| AAA CCG AGT TGG AAC CAC GA | ||
| GPER1 NM_001505.3 | CAT CAT CGG CCT GTG CTA CT GAT GAA GAC CTT CTC CGG CA | 60 |
| GPX1 NM_000581.4 | GCG GCG GCC CAG TCG GTG TA | 61 |
| GAG CTT GGG GTC GGT CAT AA |
| MCF7 | T47D | |||
|---|---|---|---|---|
| Control | ELIT | Control | ELIT | |
| Superoxide anion levels (%) | 100 ± 13 | 1177 ± 116 * | 100 ± 16 | 526 ± 35 * |
| H2O2 production (%) | 100 ± 1 | 200 ± 8 * | 100 ± 2 | 134 ± 3 * |
| Cardiolipin content (%) | 100 ± 2 | 82.7 ± 1.1 * | 100 ± 1 | 101 ± 1 |
| Oxidative damage (%) | 100 ± 5 | 145 ± 8 * | 100 ± 7 | 92.3 ± 11.7 |
| MCF7 | T47D | |||
|---|---|---|---|---|
| Control | ELIT | Control | ELIT | |
| SOD1 (%) | 100 ± 12 | 89 ± 14 | 100 ± 25 | 156 ± 28 * |
| SOD2 (%) | 100 ± 11 | 1631 ± 552 * | 100 ± 15 | 3691 ± 350 * |
| CAT (%) | 100 ± 6 | 70 ± 8 * | 100 ± 14 | 88 ± 10 |
| GSR (%) | 100 ± 14 | 49 ± 6 * | 100 ± 9 | 117 ± 8 |
| MCF7 | T47D | |||
|---|---|---|---|---|
| Control | ELIT | Control | ELIT | |
| PPARGC1A (%) | 100 ± 11 | 142 ± 2 * | 100 ± 13 | 91 ± 16 |
| Complex I (NDUFB8) (%) | 100 ± 7 | 36 ± 2 * | 100 ± 16 | 80 ± 21 |
| Complex II (SDHB) (%) | 100 ± 17 | 39 ± 4 * | 100 ± 18 | 84 ± 10 |
| Complex III (UQCRC2) (%) | 100 ± 40 | 136 ± 24 | 100 ± 5 | 101 ± 8 |
| Complex IV (COX II) (%) | 100 ± 10 | 26 ± 4 * | 100 ± 18 | 65 ± 13 |
| (COX IV) (%) | 100 ± 5 | 54 ± 6 * | 100 ± 3 | 86 ± 13 |
| Complex V (ATP5A) (%) | 100 ± 9 | 56 ± 10 * | 100 ± 14 | 117 ± 4 |
| nw | ow | o | nw | ow | o | nw | ow | o | ||||||
|---|---|---|---|---|---|---|---|---|---|---|---|---|---|---|
| IL6R | Pearson Correlation | 1 | 1 | 1 | CAT | Pearson Correlation | −0.205 | 0.421 | 0.164 | SSBP1 | Pearson Correlation | 0.306 | −0.218 | 0.229 |
| Sig. | Sig. | 0.285 | 0.173 | 0.272 | Sig. | 0.195 | 0.319 | 0.197 | ||||||
| ESR1 | Pearson Correlation | −0.006 | 0.105 | −0.337 | GPX1 | Pearson Correlation | 0.358 | 0.406 | 0.704 ** | NRF1 | Pearson Correlation | 0.870 ** | 0.878 ** | 0.936 ** |
| Sig. | 0.494 | 0.412 | 0.101 | Sig. | 0.155 | 0.183 | 0.001 | Sig. | 0.001 | 0.005 | 0 | |||
| ESR2 | Pearson Correlation | 0.396 | 0.703 | 0.605 * | GSR | Pearson Correlation | 0.454 | 0.286 | −0.009 | PPARGC1A | Pearson Correlation | 0.656 * | 0.807 * | 0.830 ** |
| Sig. | 0.19 | 0.059 | 0.024 | Sig. | 0.094 | 0.267 | 0.486 | Sig. | 0.02 | 0.014 | 0 | |||
| CXCR8 | Pearson Correlation | 0.791 ** | 0.840 ** | 0.957 ** | SOD1 | Pearson Correlation | 0.438 | 0.062 | 0.434 * | SIRT1 | Pearson Correlation | 0.228 | 0.261 | 0.604 ** |
| Sig. | 0.003 | 0.009 | 0 | Sig. | 0.103 | 0.448 | 0.046 | Sig. | 0.263 | 0.286 | 0.007 | |||
| IL6R | Pearson Correlation | 0.421 | 0.113 | 0.304 | SOD2 | Pearson Correlation | 0.289 | −0.459 | −0.106 | TFAM | Pearson Correlation | 0.279 | −0.037 | 0.387 |
| Sig. | 0.113 | 0.405 | 0.126 | Sig. | 0.209 | 0.15 | 0.348 | Sig. | 0.234 | 0.468 | 0.069 | |||
| CXCL8 | Pearson Correlation | 0.732 ** | 0.662 | 0.911 ** | SIRT3 | Pearson Correlation | 0.428 | −0.11 | 0.3 | FIS1 | Pearson Correlation | 0.609 * | 0.326 | 0.883 ** |
| Sig. | 0.008 | 0.053 | 0 | Sig. | 0.125 | 0.407 | 0.129 | Sig. | 0.041 | 0.237 | 0 | |||
| TGFB | Pearson Correlation | 0.296 | −0.552 | 0.272 | NFE2L2 | Pearson Correlation | 0.680 * | 0.753 * | 0.812 ** | OMA1 | Pearson Correlation | 0.379 | 0.472 | 0.541 * |
| Sig. | 0.203 | 0.1 | 0.154 | Sig. | 0.015 | 0.025 | 0 | Sig. | 0.157 | 0.172 | 0.015 | |||
| TNF | Pearson Correlation | 0.604 * | 0.684 * | 0.806** | UCP2 | Pearson Correlation | 0.256 | −0.266 | 0.332 | OPA1 | Pearson Correlation | −0.39 | −0.45 | −0.032 |
| Sig. | 0.032 | 0.045 | 0 | Sig. | 0.238 | 0.282 | 0.104 | Sig. | 0.17 | 0.224 | 0.456 | |||
| PTGS2 | Pearson Correlation | 0.07 | −0.134 | 0.639 ** | SLC25A14 | Pearson Correlation | 0.874 ** | 0.901 ** | 0.940 ** | * The correlation is significant at p < 0.05 | ||||
| Sig. | 0.435 | 0.415 | 0.007 | Sig. | 0 | 0.003 | 0 | ** The correlation is significant at p < 0.01 | ||||||
| (a) | ||||||||
|---|---|---|---|---|---|---|---|---|
| ESR1 | Pearson Correlation | 1.000 | CAT | Pearson Correlation | 0.089 | SSBP1 | Pearson Correlation | −0.461 ** |
| Sig. | Sig. | 0.624 | Sig. | 0.007 | ||||
| IL6R | Pearson Correlation | −0.219 | GPX1 | Pearson Correlation | 0.218 | NRF1 | Pearson Correlation | −0.154 |
| Sig. | 0.221 | Sig. | 0.223 | Sig. | 0.393 | |||
| ESR2 | Pearson Correlation | 0.010 | GSR | Pearson Correlation | 0.139 | PPARGC1A | Pearson Correlation | −0.314 |
| Sig. | 0.962 | Sig. | 0.440 | Sig. | 0.075 | |||
| CXCR8 | Pearson Correlation | −0.230 | SOD1 | Pearson Correlation | −0.391 * | SIRT1 | Pearson Correlation | −0.012 |
| Sig. | 0.205 | Sig. | 0.024 | Sig. | 0.945 | |||
| IL6 | Pearson Correlation | −0.364 * | SOD2 | Pearson Correlation | 0.177 | TFAM | Pearson Correlation | −0.003 |
| Sig. | 0.037 | Sig. | 0.323 | Sig. | 0.989 | |||
| CXCL8 | Pearson Correlation | −0.422 * | SIRT3 | Pearson Correlation | 0.571 ** | FIS1 | Pearson Correlation | −0.192 |
| Sig. | 0.014 | Sig. | 0.001 | Sig. | 0.292 | |||
| TGFB | Pearson Correlation | 0.221 | NFE2L2 | Pearson Correlation | −0.122 | OMA1 | Pearson Correlation | 0.110 |
| Sig. | 0.216 | Sig. | 0.500 | Sig. | 0.555 | |||
| TNF | Pearson Correlation | 0.041 | UCP2 | Pearson Correlation | 0.153 | OPA1 | Pearson Correlation | 0.125 |
| Sig. | 0.820 | Sig. | 0.396 | Sig. | 0.525 | |||
| PTGS2 | Pearson Correlation | −0.200 | SLC25A14 | Pearson Correlation | −0.163 | * The correlation is significant at p < 0.05 | ||
| Sig. | 0.317 | Sig. | 0.364 | ** The correlation is significant at p < 0.01 | ||||
| (b) | ||||||||
| ESR2 | Pearson Correlation | 1.000 | CAT | Pearson Correlation | SSBP1 | Pearson Correlation | 0.260 | |
| Sig. | Sig. | Sig. | 0.220 | |||||
| IL6R | Pearson Correlation | 0.639 ** | GPX1 | Pearson Correlation | NRF1 | Pearson Correlation | 0.483 * | |
| Sig. | 0.001 | Sig. | Sig. | 0.017 | ||||
| ESR1 | Pearson Correlation | 0.010 | GSR | Pearson Correlation | PPARGC1A | Pearson Correlation | 0.409 * | |
| Sig. | 0.962 | Sig. | Sig. | 0.047 | ||||
| CXCR8 | Pearson Correlation | 0.473 * | SOD1 | Pearson Correlation | SIRT1 | Pearson Correlation | 0.560 ** | |
| Sig. | 0.023 | Sig. | Sig. | 0.004 | ||||
| IL6 | Pearson Correlation | −0.060 | SOD2 | Pearson Correlation | TFAM | Pearson Correlation | 0.326 | |
| Sig. | 0.781 | Sig. | Sig. | 0.120 | ||||
| CXCL8 | Pearson Correlation | 0.374 | SIRT3 | Pearson Correlation | FIS1 | Pearson Correlation | 0.294 | |
| Sig. | 0.071 | Sig. | Sig. | 0.163 | ||||
| TGFB | Pearson Correlation | 0.169 | NFE2L2 | Pearson Correlation | OMA1 | Pearson Correlation | 0.446 * | |
| Sig. | 0.430 | Sig. | Sig. | 0.029 | ||||
| TNF | Pearson Correlation | 0.326 | UCP2 | Pearson Correlation | OPA1 | Pearson Correlation | 0.256 | |
| Sig. | 0.120 | Sig. | Sig. | 0.262 | ||||
| PTGS2 | Pearson Correlation | −0.155 | SLC25A14 | Pearson Correlation | * The correlation is significant at p < 0.05 | |||
| Sig. | 0.502 | Sig. | ** The correlation is significant at p < 0.01 | |||||
Publisher’s Note: MDPI stays neutral with regard to jurisdictional claims in published maps and institutional affiliations. |
© 2021 by the authors. Licensee MDPI, Basel, Switzerland. This article is an open access article distributed under the terms and conditions of the Creative Commons Attribution (CC BY) license (https://creativecommons.org/licenses/by/4.0/).
Share and Cite
Martinez-Bernabe, T.; Sastre-Serra, J.; Ciobu, N.; Oliver, J.; Pons, D.G.; Roca, P. Estrogen Receptor Beta (ERβ) Maintains Mitochondrial Network Regulating Invasiveness in an Obesity-Related Inflammation Condition in Breast Cancer. Antioxidants 2021, 10, 1371. https://doi.org/10.3390/antiox10091371
Martinez-Bernabe T, Sastre-Serra J, Ciobu N, Oliver J, Pons DG, Roca P. Estrogen Receptor Beta (ERβ) Maintains Mitochondrial Network Regulating Invasiveness in an Obesity-Related Inflammation Condition in Breast Cancer. Antioxidants. 2021; 10(9):1371. https://doi.org/10.3390/antiox10091371
Chicago/Turabian StyleMartinez-Bernabe, Toni, Jorge Sastre-Serra, Nicolae Ciobu, Jordi Oliver, Daniel Gabriel Pons, and Pilar Roca. 2021. "Estrogen Receptor Beta (ERβ) Maintains Mitochondrial Network Regulating Invasiveness in an Obesity-Related Inflammation Condition in Breast Cancer" Antioxidants 10, no. 9: 1371. https://doi.org/10.3390/antiox10091371
APA StyleMartinez-Bernabe, T., Sastre-Serra, J., Ciobu, N., Oliver, J., Pons, D. G., & Roca, P. (2021). Estrogen Receptor Beta (ERβ) Maintains Mitochondrial Network Regulating Invasiveness in an Obesity-Related Inflammation Condition in Breast Cancer. Antioxidants, 10(9), 1371. https://doi.org/10.3390/antiox10091371