
Induction of the Nrf2 Pathway by Sulforaphane Is Neuroprotective in a Rat Temporal Lobe Epilepsy Model


Abstract
:1. Introduction
2. Materials and Methods
2.1. In Vitro Cortical Cell Cultures
2.2. In Vitro Recording Solutions
2.3. Measurements Rates of ROS Generation
2.4. Imaging of Glutathione (GSH) Levels
2.5. Assessment of Neuronal Cell Death in Co-Culture
2.6. Live Cell Imaging
2.7. Real-Time RT-PCR Expression Analysis of Nrf2 and Related Genes In Vivo
2.8. Western Blot Analysis of Nrf2 and NQO1
2.9. Measurements of Reduced (GSH), Oxidized (GSSG) Glutathione Levels, and the (GSSG/GSH) Ratio
2.10. Total Antioxidant Capacity (TAC)
2.11. Assessment of Neuronal Cell Death In Vivo
2.12. Microscopy
2.13. Experimental Epilepsy Model
2.13.1. Animals
2.13.2. KA-Induced SE Epilepsy Model
2.13.3. Drug Administration
2.13.4. Statistical Analysis
3. Results
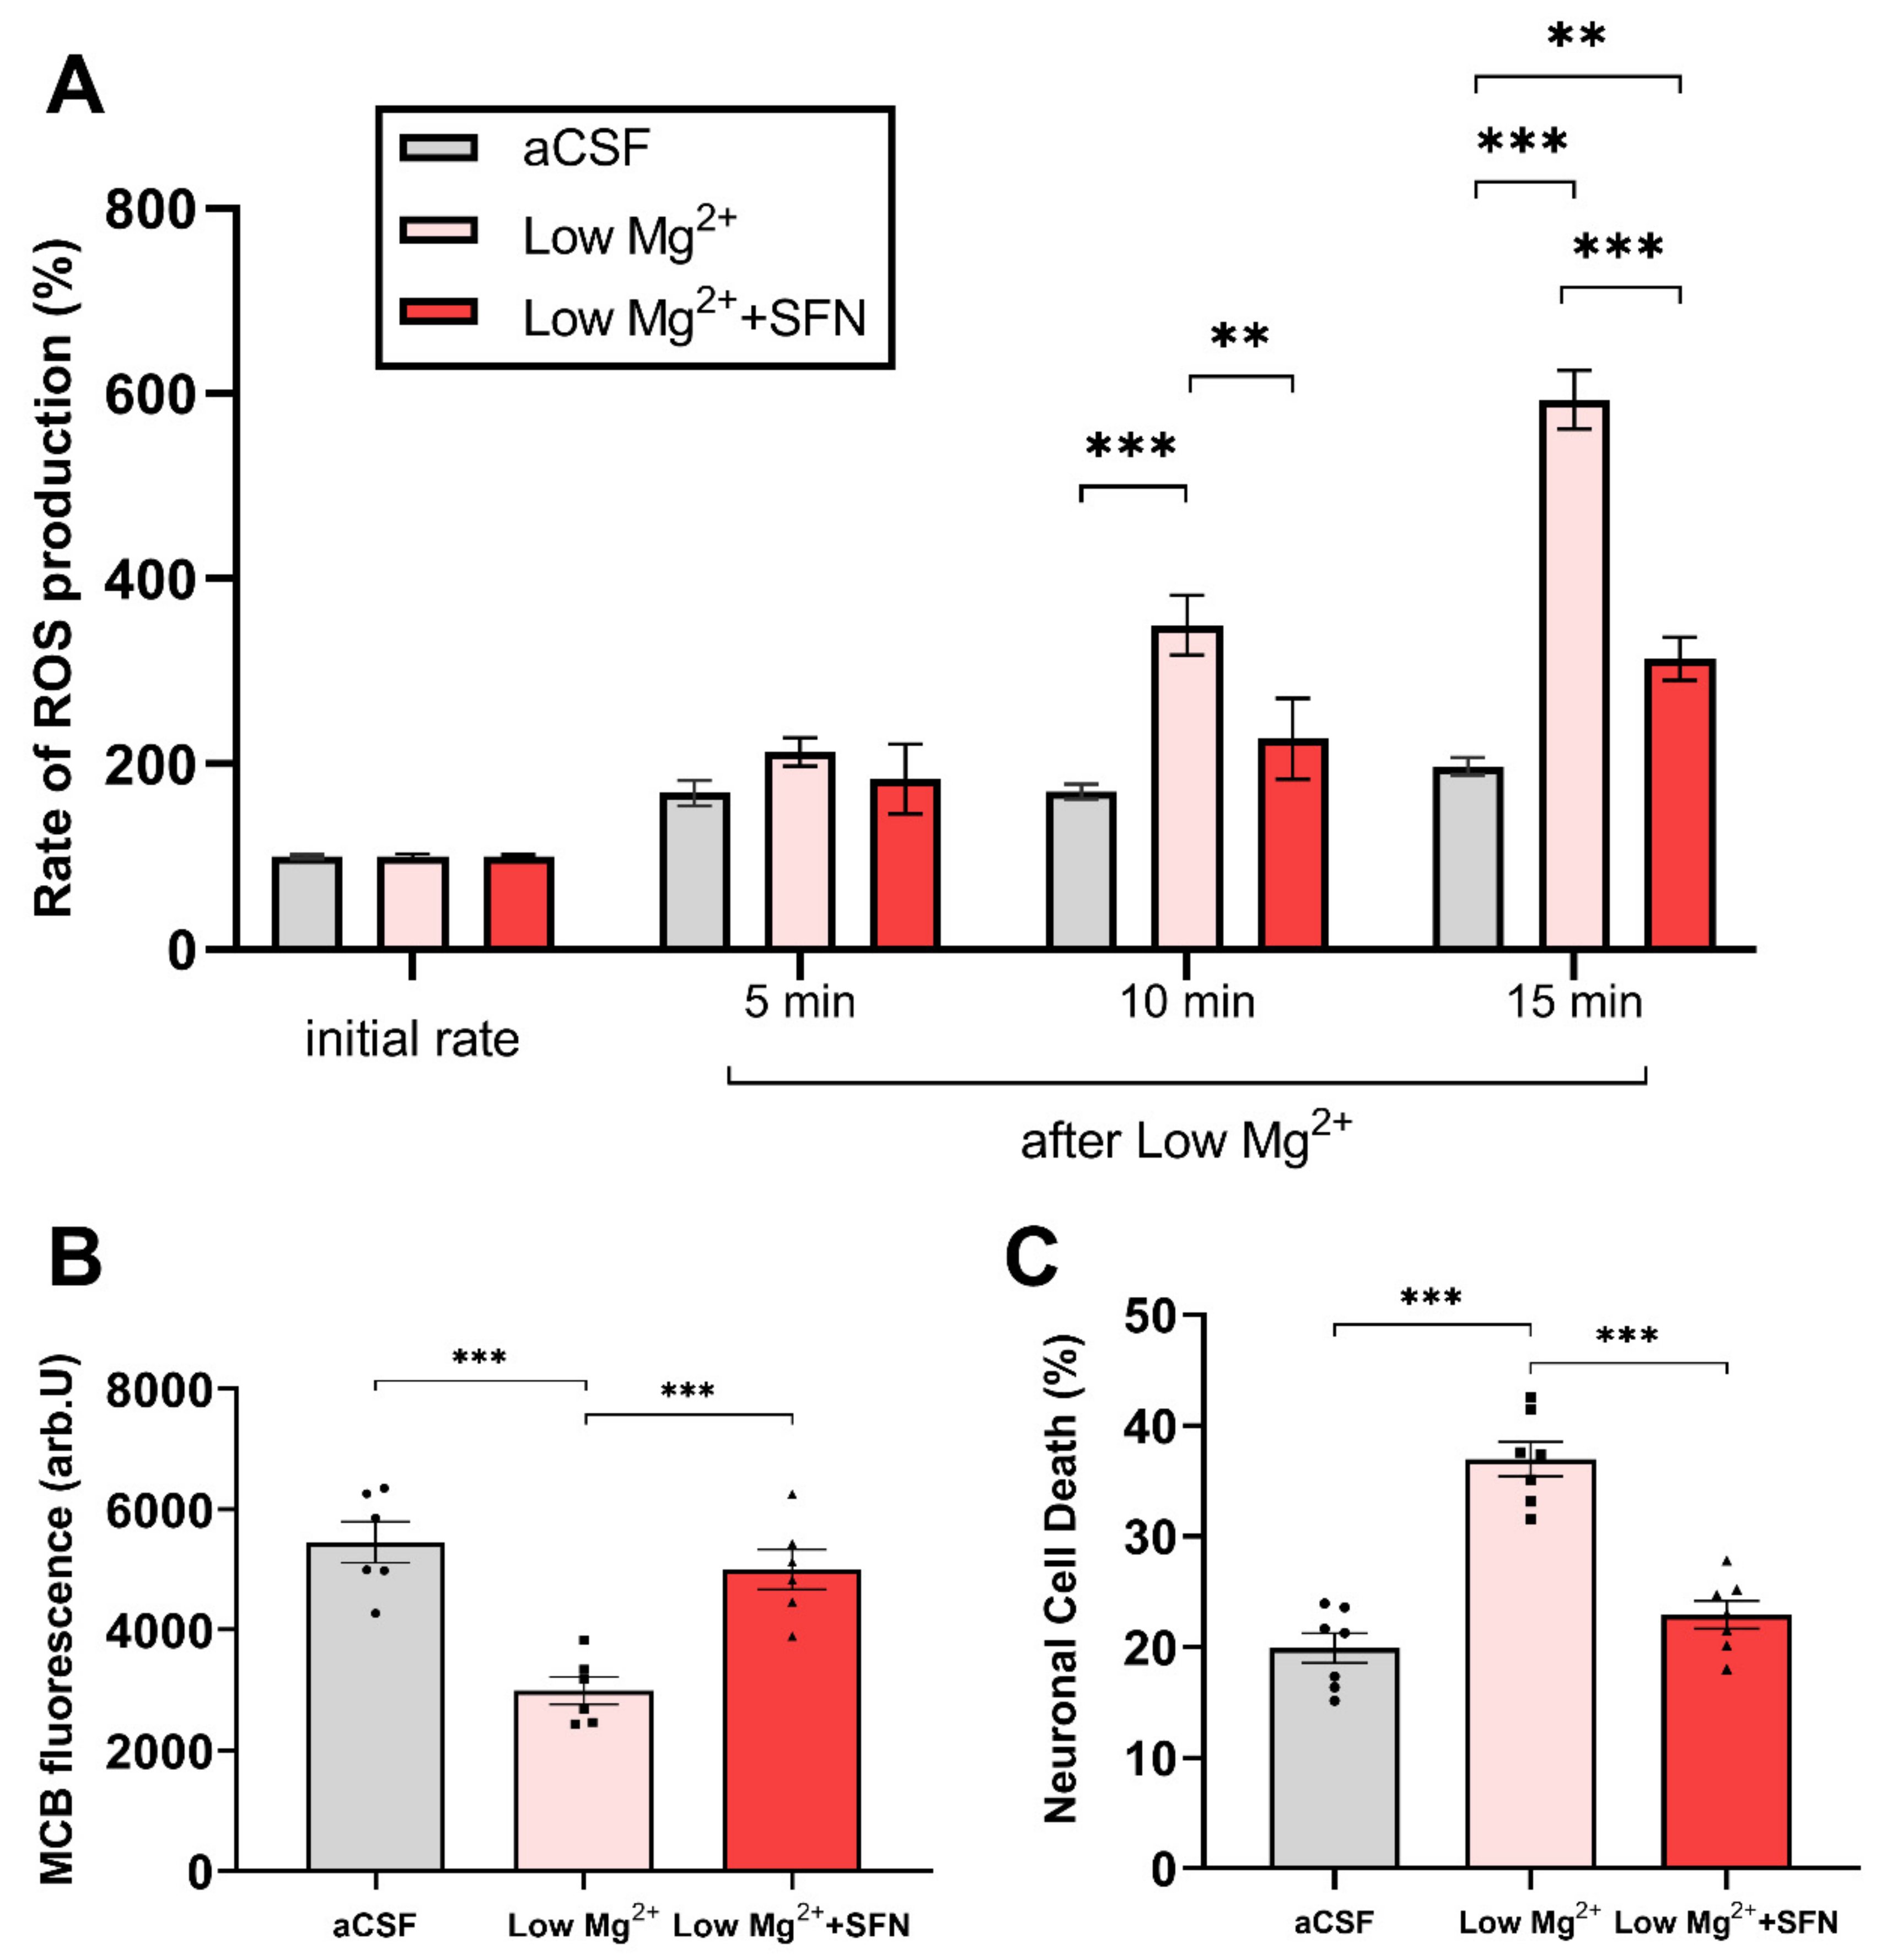
3.1. SFN Decreases Rate of ROS Production, Increases Levels of Glutathione, and Decreases Epileptiform Activity-Induced Neuronal Death
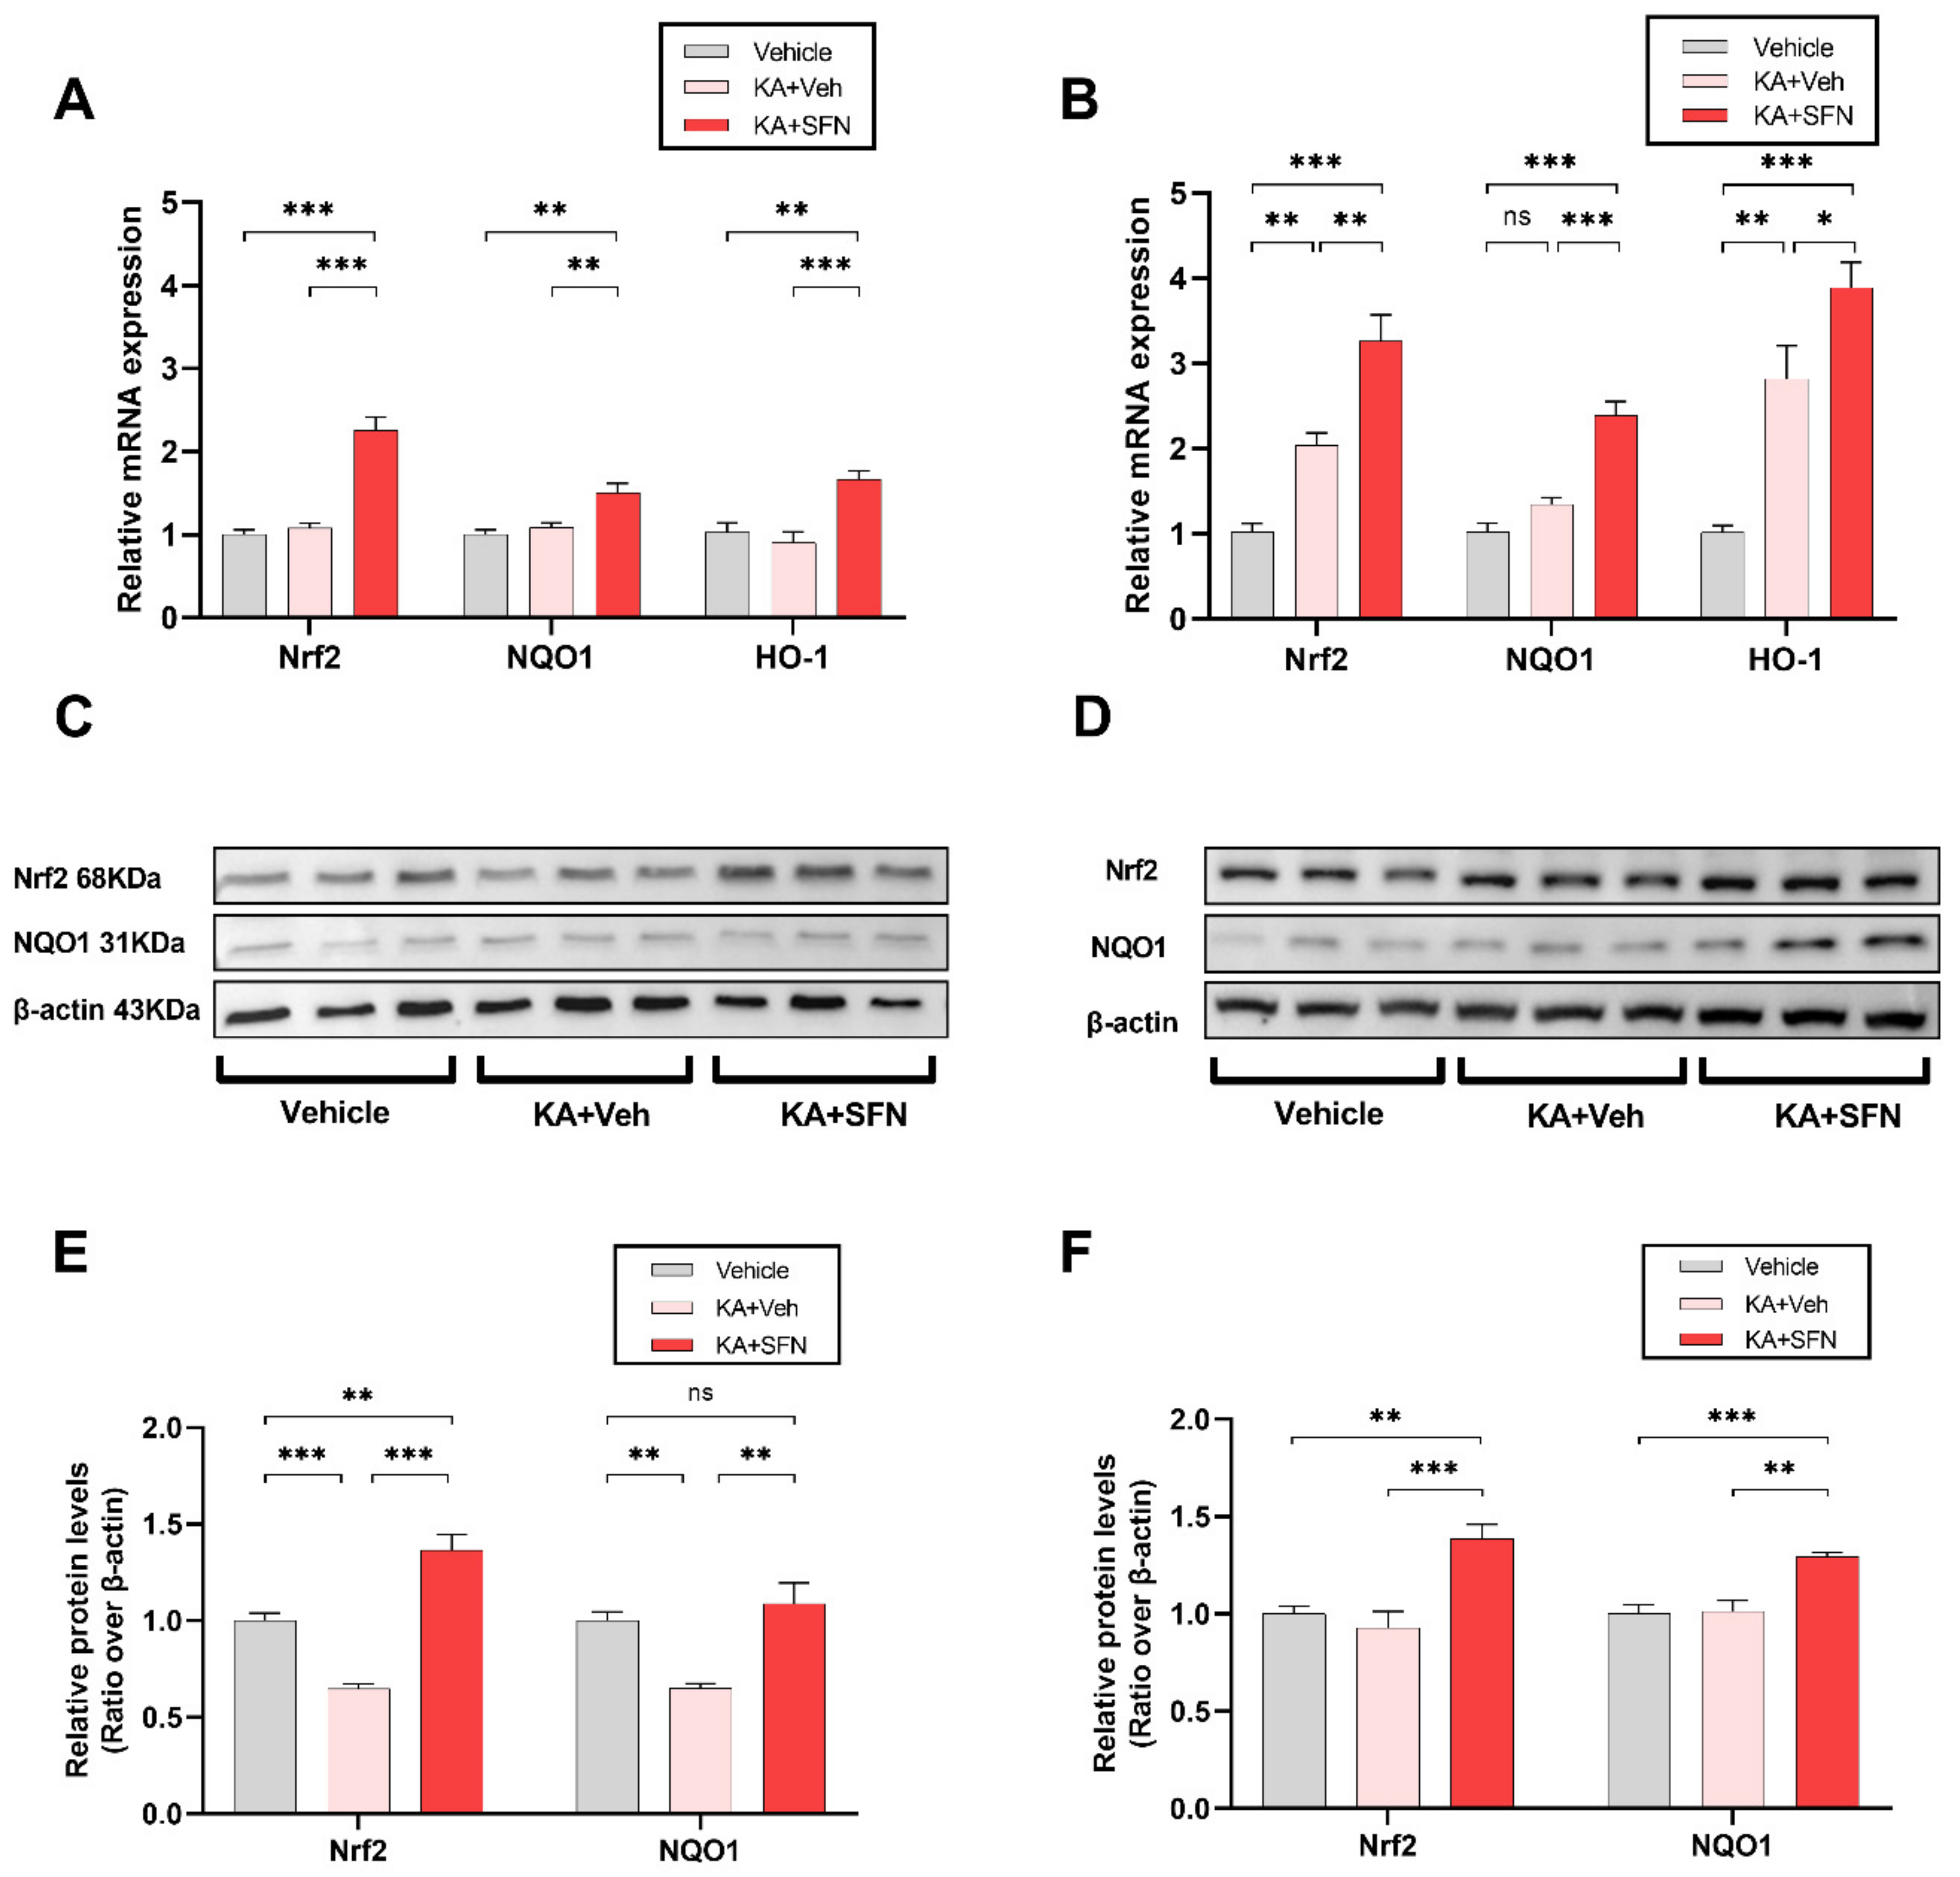
3.2. SFN Increases the Expression of Nrf2 and its Related Genes NQO1 and HO-1 Following Status Epilepticus In Vivo
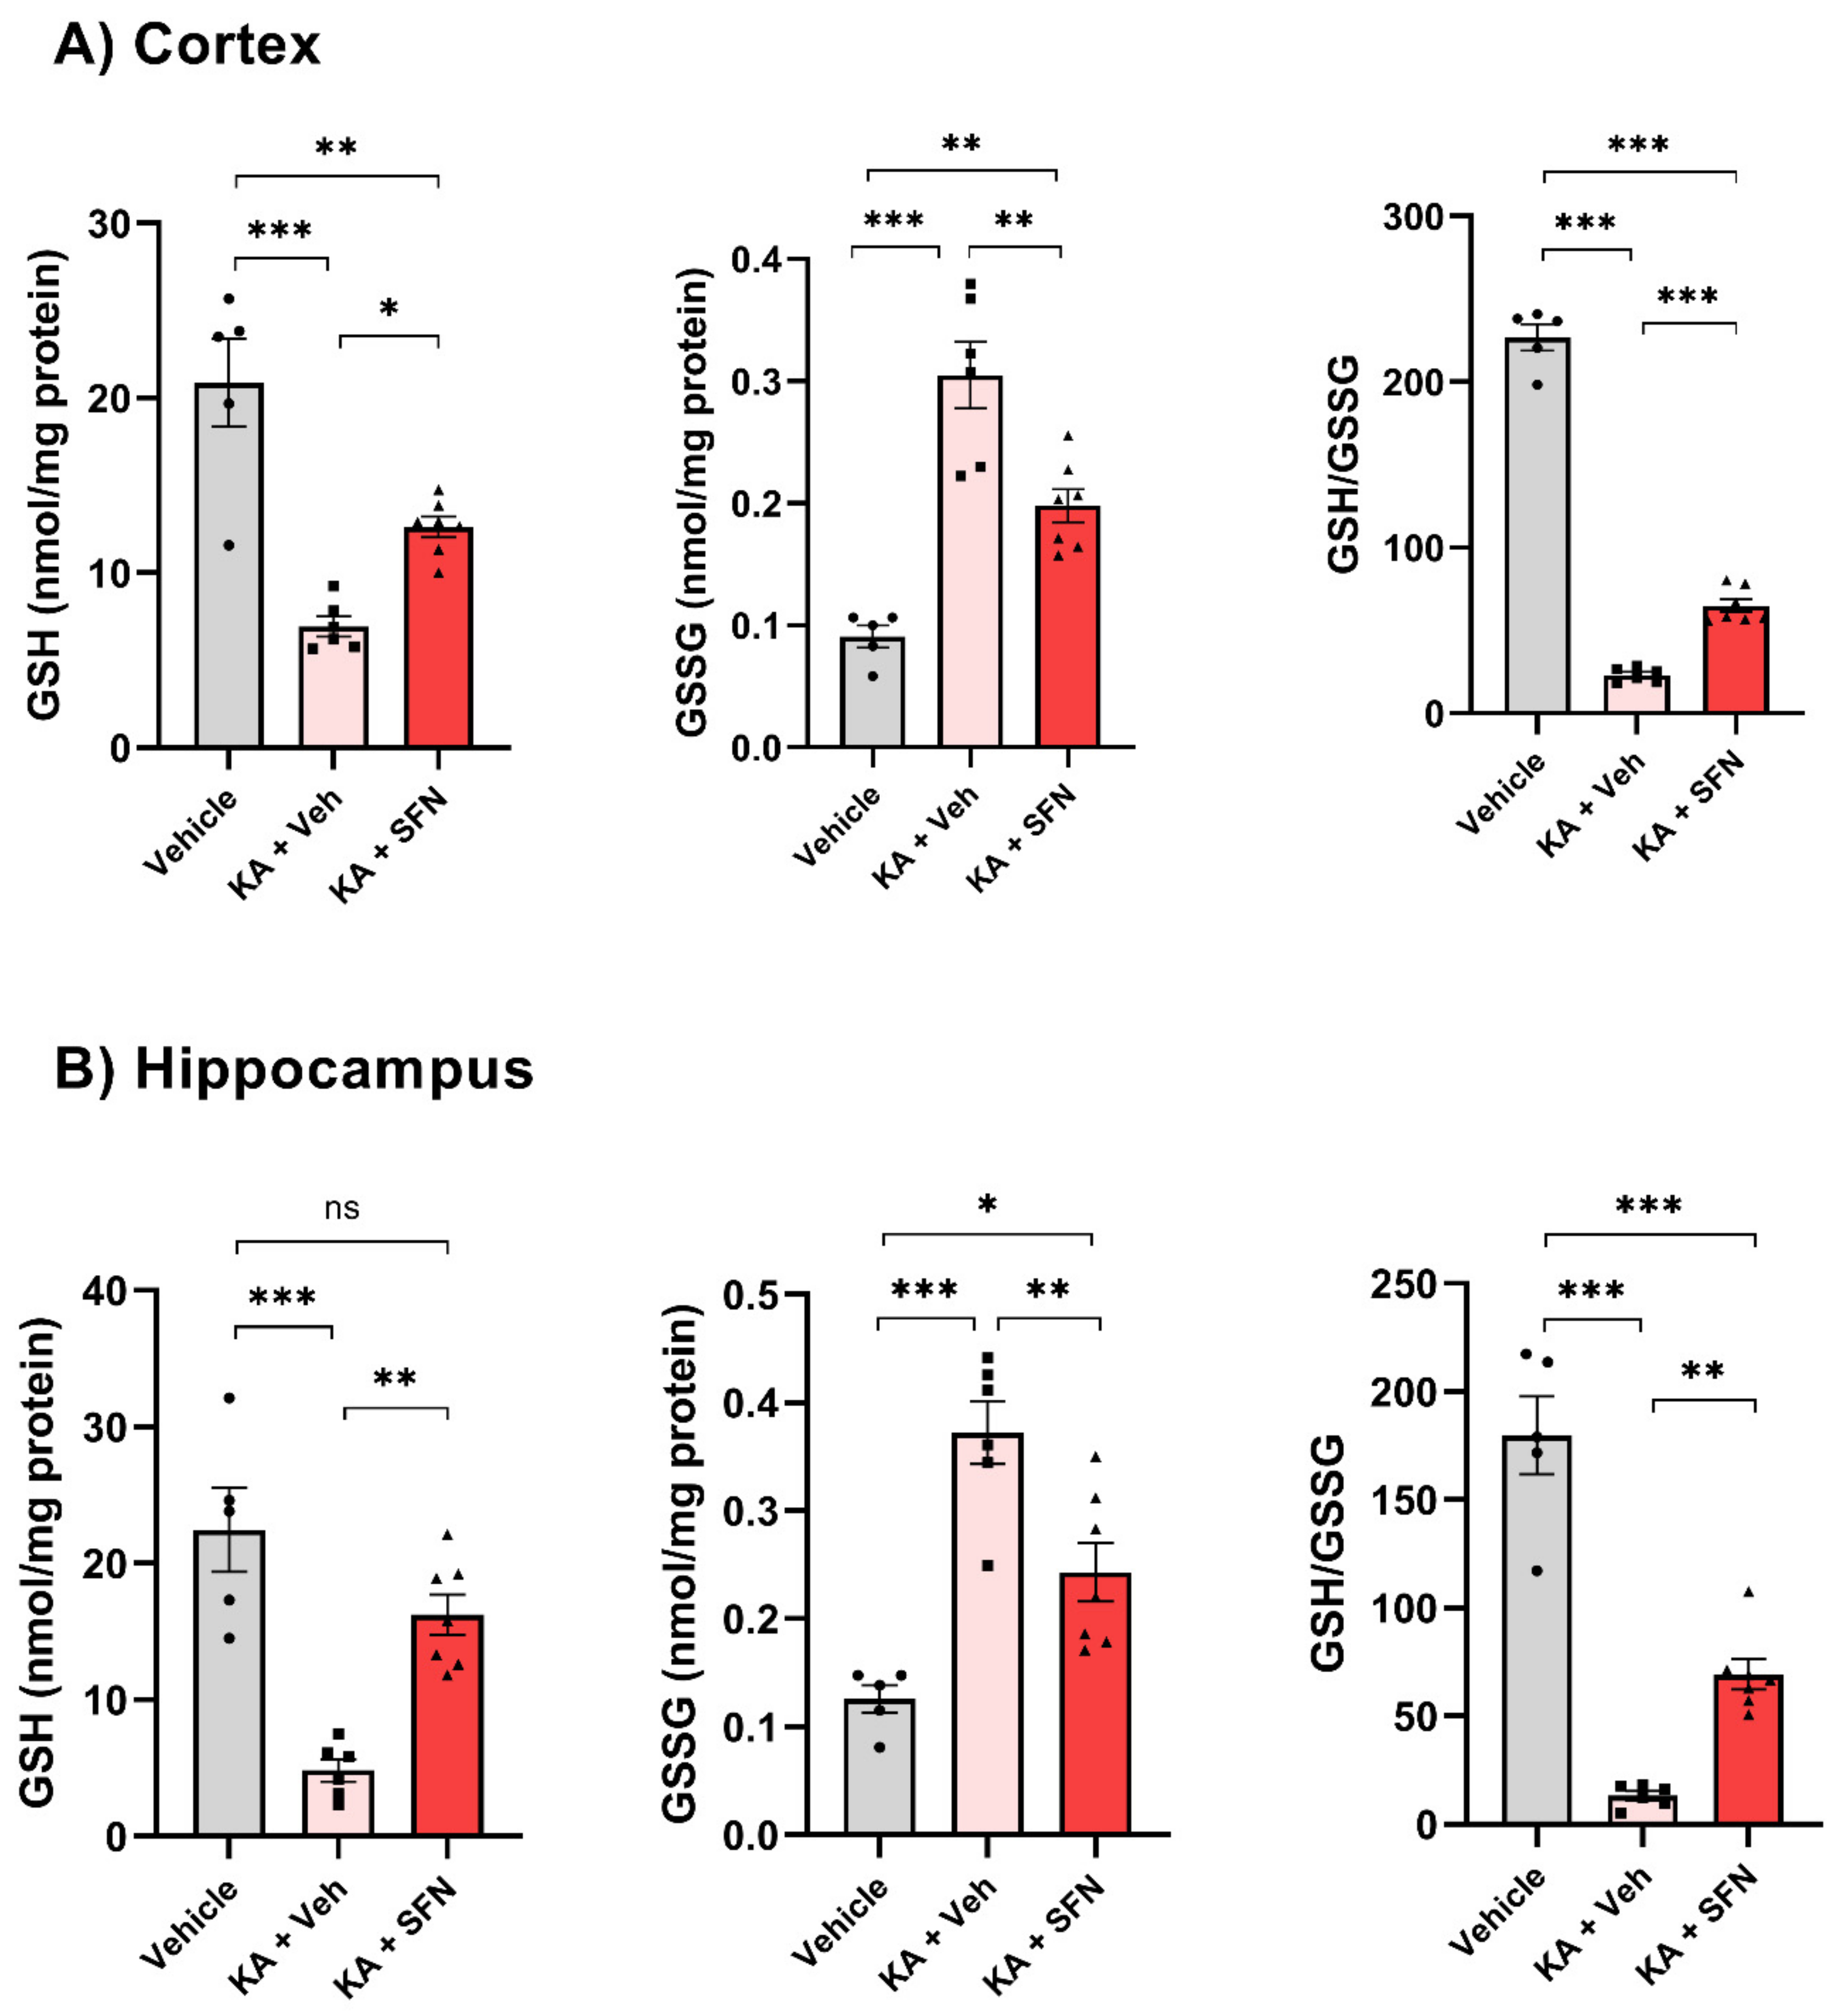
3.3. Effect of SFN on Oxidative Stress Markers
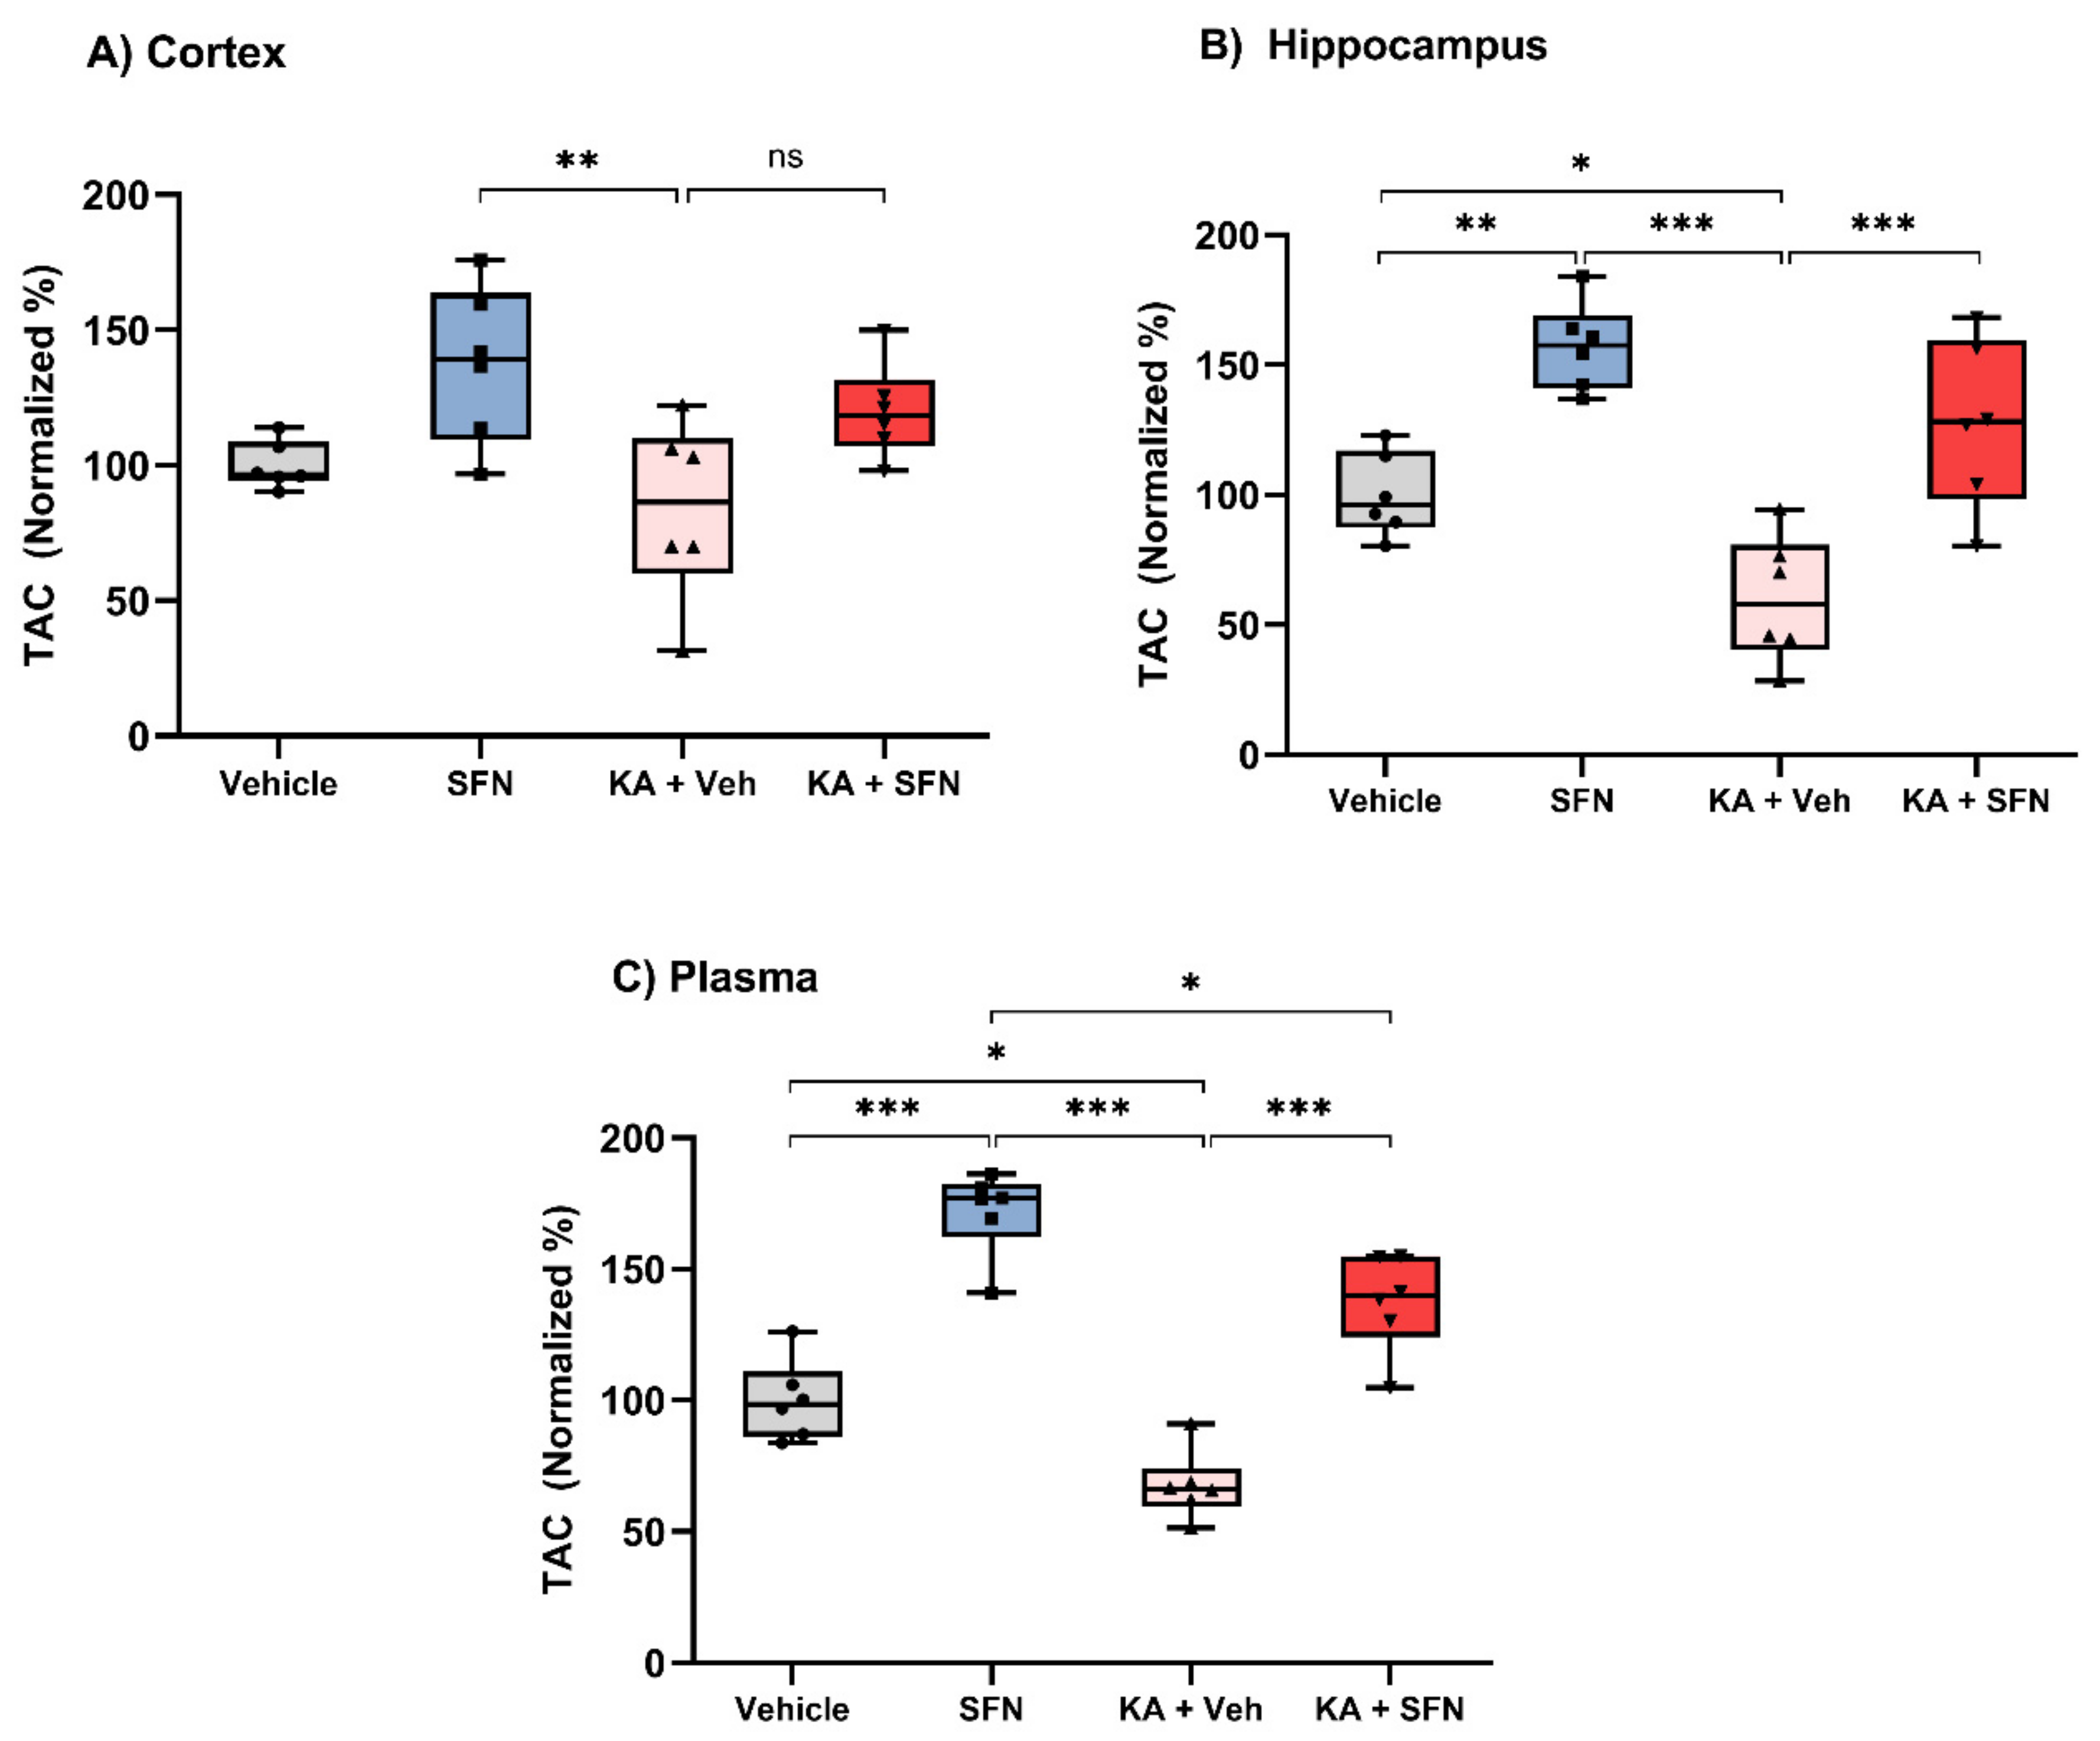
3.4. SFN Increases Levels of Total Antioxidant Capacity Following SE
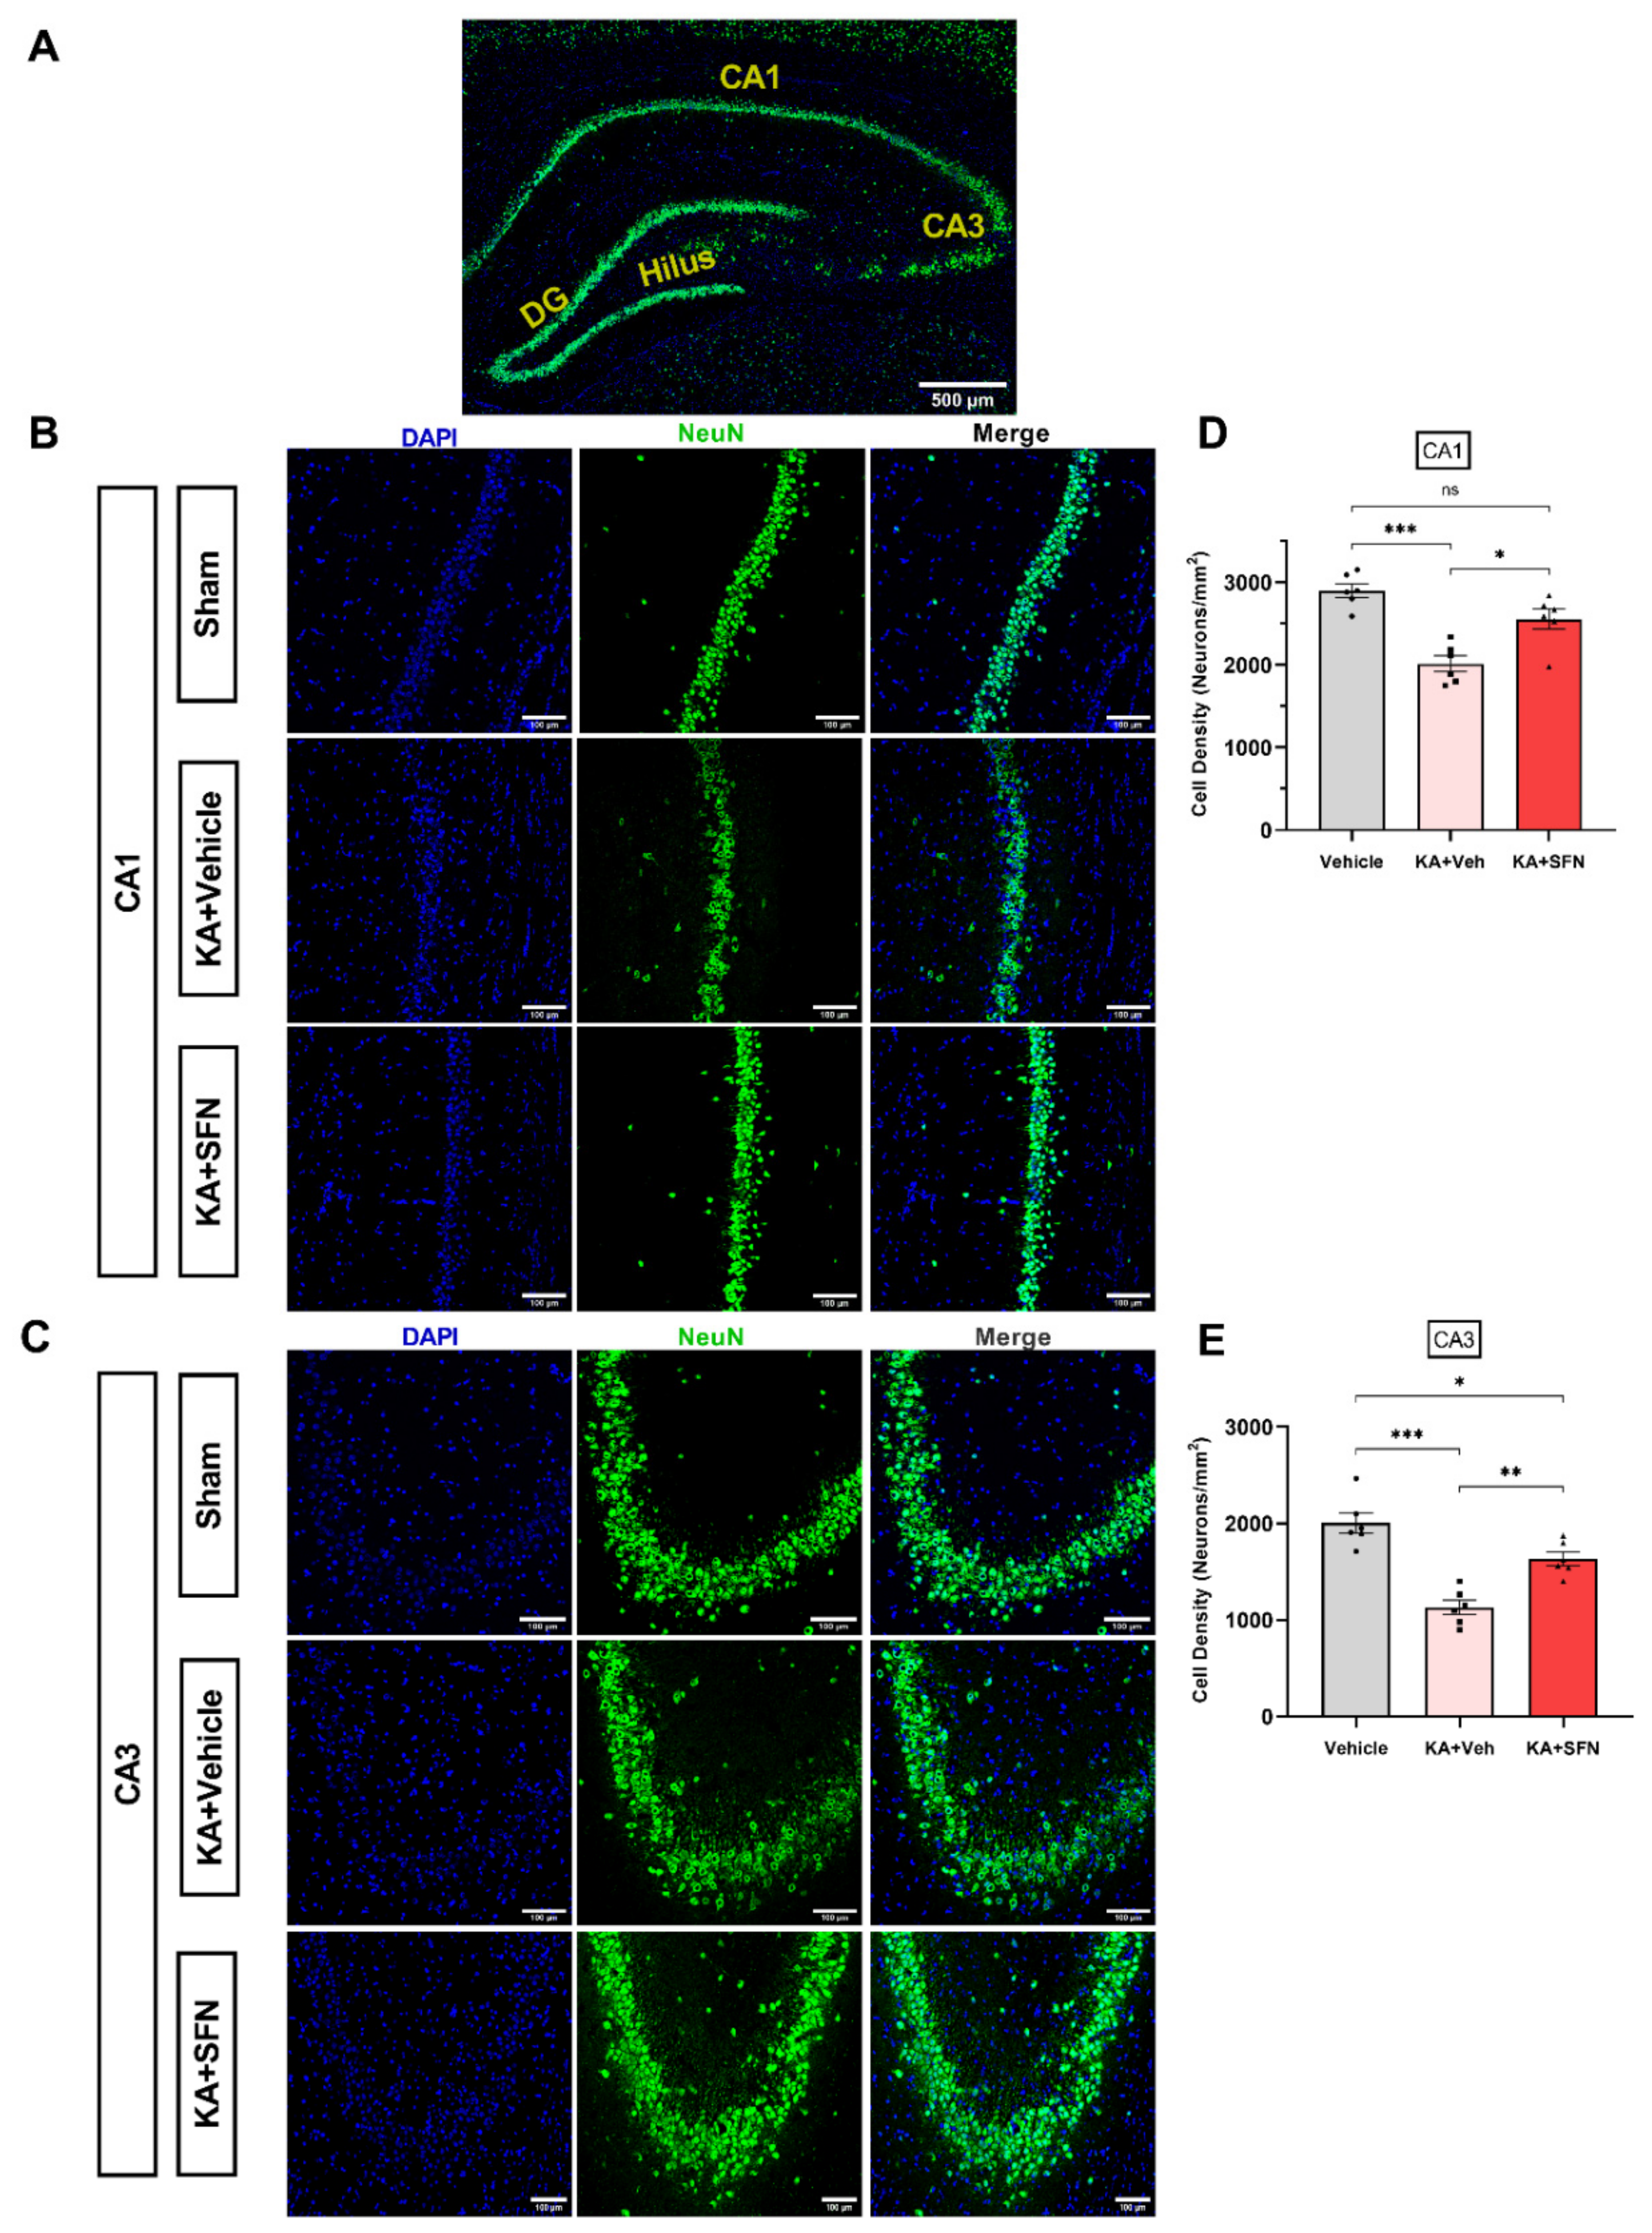
3.5. SFN Is Neuroprotective against KA-SE Induced Neuronal Cell Death
4. Discussion
5. Conclusions
Supplementary Materials
Author Contributions
Funding
Institutional Review Board Statement
Informed Consent Statement
Data Availability Statement
Acknowledgments
Conflicts of Interest
Abbreviations
| aCSF | artificial cerebrospinal fluid |
| AEDs | anti-epileptic drugs |
| DHE | dihydroethidium |
| 2HE | 2-hydroxyethidium |
| GSH | reduced glutathione |
| GSSG | oxidized glutathione |
| HO-1 | heme oxygenase 1 |
| KA | Kainic Acid |
| KEAP1 | Kelch ECH associating protein 1 |
| MCB | Monochlorobimane |
| NQO1 | NAD(P)H: quinone oxidoreductase 1 |
| Nrf2 | Nuclear factor erythroid 2-like 2 |
| OS | oxidative stress |
| ROS | Reactive oxygen species |
| SE | Status epilepticus |
| SFN | Sulforaphane |
| TAC | Total antioxidant capacity |
| TLE | Temporal lobe epilepsy |
References
- Beghi, E. The Epidemiology of Epilepsy. Neuroepidemiology 2020, 54, 185–191. [Google Scholar] [CrossRef]
- Kobylarek, D.; Iwanowski, P.; Lewandowska, Z.; Limphaibool, N.; Szafranek, S.; Labrzycka, A.; Kozubski, W. Advances in the Potential Biomarkers of Epilepsy. Front. Neurol. 2019, 10, 685. [Google Scholar] [CrossRef]
- Galanopoulou, A.S.; Buckmaster, P.S.; Staley, K.J.; Moshe, S.L.; Perucca, E.; Engel, J., Jr.; Loscher, W.; Noebels, J.L.; Pitkanen, A.; Stables, J.; et al. Identification of new epilepsy treatments: Issues in preclinical methodology. Epilepsia 2012, 53, 571–582. [Google Scholar] [CrossRef]
- Nizinska, K.; Szydlowska, K.; Vouros, A.; Kiryk, A.; Stepniak, A.; Vasilaki, E.; Lukasiuk, K. Behavioral characteristics as potential biomarkers of the development and phenotype of epilepsy in a rat model of temporal lobe epilepsy. Sci. Rep. 2021, 11, 8665. [Google Scholar] [CrossRef] [PubMed]
- Goldberg, E.M.; Coulter, D.A. Mechanisms of epileptogenesis: A convergence on neural circuit dysfunction. Nat. Rev. Neurosci. 2013, 14, 337–349. [Google Scholar] [CrossRef] [Green Version]
- Miszczuk, D.; Debski, K.J.; Tanila, H.; Lukasiuk, K.; Pitkanen, A. Traumatic Brain Injury Increases the Expression of Nos1, Abeta Clearance, and Epileptogenesis in APP/PS1 Mouse Model of Alzheimer’s Disease. Mol. Neurobiol. 2016, 53, 7010–7027. [Google Scholar] [CrossRef]
- Shekh-Ahmad, T.; Lieb, A.; Kovac, S.; Gola, L.; Christian Wigley, W.; Abramov, A.Y.; Walker, M.C. Combination antioxidant therapy prevents epileptogenesis and modifies chronic epilepsy. Redox Biol. 2019, 26, 101278. [Google Scholar] [CrossRef]
- Munguia-Martinez, M.F.; Nava-Ruiz, C.; Ruiz-Diaz, A.; Diaz-Ruiz, A.; Yescas-Gomez, P.; Mendez-Armenta, M. Immunohistochemical Study of Antioxidant Enzymes Regulated by Nrf2 in the Models of Epileptic Seizures (KA and PTZ). Oxid. Med. Cell Longev. 2019, 2019, 1327986. [Google Scholar] [CrossRef] [Green Version]
- Loscher, W.; Brandt, C. Prevention or modification of epileptogenesis after brain insults: Experimental approaches and translational research. Pharmacol. Rev. 2010, 62, 668–700. [Google Scholar] [CrossRef] [PubMed] [Green Version]
- Kim, H.; Byun, S.H.; Kim, J.S.; Lim, B.C.; Chae, J.H.; Choi, J.; Kim, K.J.; Hwang, Y.S.; Hwang, H. Clinical and EEG risk factors for subsequent epilepsy in patients with complex febrile seizures. Epilepsy Res. 2013, 105, 158–163. [Google Scholar] [CrossRef] [PubMed]
- Kovac, S.; Domijan, A.M.; Walker, M.C.; Abramov, A.Y. Seizure activity results in calcium- and mitochondria-independent ROS production via NADPH and xanthine oxidase activation. Cell Death Dis. 2014, 5, e1442. [Google Scholar] [CrossRef]
- Williams, S.; Hamil, N.; Abramov, A.Y.; Walker, M.C.; Kovac, S. Status epilepticus results in persistent overproduction of reactive oxygen species, inhibition of which is neuroprotective. Neuroscience 2015, 303, 160–165. [Google Scholar] [CrossRef] [PubMed]
- Li, L.; Dong, H.; Song, E.; Xu, X.; Liu, L.; Song, Y. Nrf2/ARE pathway activation, HO-1 and NQO1 induction by polychlorinated biphenyl quinone is associated with reactive oxygen species and PI3K/AKT signaling. Chem. Biol. Interact. 2014, 209, 56–67. [Google Scholar] [CrossRef] [PubMed]
- Kubo, E.; Chhunchha, B.; Singh, P.; Sasaki, H.; Singh, D.P. Sulforaphane reactivates cellular antioxidant defense by inducing Nrf2/ARE/Prdx6 activity during aging and oxidative stress. Sci. Rep. 2017, 7, 14130. [Google Scholar] [CrossRef] [PubMed] [Green Version]
- Esteras, N.; Dinkova-Kostova, A.T.; Abramov, A.Y. Nrf2 activation in the treatment of neurodegenerative diseases: A focus on its role in mitochondrial bioenergetics and function. Biol. Chem. 2016, 397, 383–400. [Google Scholar] [CrossRef]
- Wang, W.; Wang, W.P.; Zhang, G.L.; Wu, Y.F.; Xie, T.; Kan, M.C.; Fang, H.B.; Wang, H.C. Activation of Nrf2-ARE signal pathway in hippocampus of amygdala kindling rats. Neurosci. Lett. 2013, 543, 58–63. [Google Scholar] [CrossRef] [PubMed]
- Mazzuferi, M.; Kumar, G.; van Eyll, J.; Danis, B.; Foerch, P.; Kaminski, R.M. Nrf2 defense pathway: Experimental evidence for its protective role in epilepsy. Ann. Neurol. 2013, 74, 560–568. [Google Scholar] [CrossRef]
- Shekh-Ahmad, T.; Eckel, R.; Dayalan Naidu, S.; Higgins, M.; Yamamoto, M.; Dinkova-Kostova, A.T.; Kovac, S.; Abramov, A.Y.; Walker, M.C. KEAP1 inhibition is neuroprotective and suppresses the development of epilepsy. Brain 2018, 141, 1390–1403. [Google Scholar] [CrossRef]
- Pauletti, A.; Terrone, G.; Shekh-Ahmad, T.; Salamone, A.; Ravizza, T.; Rizzi, M.; Pastore, A.; Pascente, R.; Liang, L.P.; Villa, B.R.; et al. Targeting oxidative stress improves disease outcomes in a rat model of acquired epilepsy. Brain 2019, 142, e39. [Google Scholar] [CrossRef]
- Clulow, J.A.; Storck, E.M.; Lanyon-Hogg, T.; Kalesh, K.A.; Jones, L.H.; Tate, E.W. Competition-based, quantitative chemical proteomics in breast cancer cells identifies new target profiles for sulforaphane. Chem. Commun. 2017, 53, 5182–5185. [Google Scholar] [CrossRef] [Green Version]
- Socala, K.; Nieoczym, D.; Kowalczuk-Vasilev, E.; Wyska, E.; Wlaz, P. Increased seizure susceptibility and other toxicity symptoms following acute sulforaphane treatment in mice. Toxicol. Appl. Pharmacol. 2017, 326, 43–53. [Google Scholar] [CrossRef] [PubMed]
- Carrasco-Pozo, C.; Tan, K.N.; Borges, K. Sulforaphane is anticonvulsant and improves mitochondrial function. J. Neurochem. 2015, 135, 932–942. [Google Scholar] [CrossRef] [PubMed]
- Wang, W.; Wu, Y.; Zhang, G.; Fang, H.; Wang, H.; Zang, H.; Xie, T.; Wang, W. Activation of Nrf2-ARE signal pathway protects the brain from damage induced by epileptic seizure. Brain Res. 2014, 1544, 54–61. [Google Scholar] [CrossRef] [PubMed]
- Rojo, A.I.; Rada, P.; Egea, J.; Rosa, A.O.; Lopez, M.G.; Cuadrado, A. Functional interference between glycogen synthase kinase-3 beta and the transcription factor Nrf2 in protection against kainate-induced hippocampal cell death. Mol. Cell. Neurosci. 2008, 39, 125–132. [Google Scholar] [CrossRef]
- Kaech, S.; Banker, G. Culturing hippocampal neurons. Nat. Protoc. 2006, 1, 2406–2415. [Google Scholar] [CrossRef] [PubMed]
- Pfaffl, M.W. A new mathematical model for relative quantification in real-time RT-PCR. Nucleic. Acids Res. 2001, 29, e45. [Google Scholar] [CrossRef]
- Ben-Ari, Y. Limbic seizure and brain damage produced by kainic acid: Mechanisms and relevance to human temporal lobe epilepsy. Neuroscience 1985, 14, 375–403. [Google Scholar] [CrossRef]
- Racine, R.J. Modification of seizure activity by electrical stimulation. II. Motor seizure. Electroencephalogr. Clin. Neurophysiol. 1972, 32, 281–294. [Google Scholar] [CrossRef]
- Du, Z.X.; Zhang, H.Y.; Meng, X.; Guan, Y.; Wang, H.Q. Role of oxidative stress and intracellular glutathione in the sensitivity to apoptosis induced by proteasome inhibitor in thyroid cancer cells. BMC Cancer 2009, 9, 56. [Google Scholar] [CrossRef] [Green Version]
- Lee, S.; Hu, L. Nrf2 activation through the inhibition of Keap1-Nrf2 protein-protein interaction. Med. Chem. Res. 2020, 29, 846–867. [Google Scholar] [CrossRef]
- Waldbaum, S.; Patel, M. Mitochondrial dysfunction and oxidative stress: A contributing link to acquired epilepsy? J. Bioenerg. Biomembr. 2010, 42, 449–455. [Google Scholar] [CrossRef] [PubMed] [Green Version]
- Clarke, J.D.; Hsu, A.; Williams, D.E.; Dashwood, R.H.; Stevens, J.F.; Yamamoto, M.; Ho, E. Metabolism and Tissue Distribution of Sulforaphane in Nrf2 Knockout and Wild-Type Mice. Pharm. Res.-Dordr. 2011, 28, 3171–3179. [Google Scholar] [CrossRef] [Green Version]
- Berkovic, S.F.; Andermann, F.; Olivier, A.; Ethier, R.; Melanson, D.; Robitaille, Y.; Kuzniecky, R.; Peters, T.; Feindel, W. Hippocampal sclerosis in temporal lobe epilepsy demonstrated by magnetic resonance imaging. Ann. Neurol. 1991, 29, 175–182. [Google Scholar] [CrossRef] [PubMed]
- Sperk, G.; Lassmann, H.; Baran, H.; Kish, S.J.; Seitelberger, F.; Hornykiewicz, O. Kainic acid induced seizures: Neurochemical and histopathological changes. Neuroscience 1983, 10, 1301–1315. [Google Scholar] [CrossRef]
- Haas, K.Z.; Sperber, E.F.; Opanashuk, L.A.; Stanton, P.K.; Moshe, S.L. Resistance of immature hippocampus to morphologic and physiologic alterations following status epilepticus or kindling. Hippocampus 2001, 11, 615–625. [Google Scholar] [CrossRef] [PubMed]
- Sommer, C.; Roth, S.U.; Kiessling, M. Kainate-induced epilepsy alters protein expression of AMPA receptor subunits GluR1, GluR2 and AMPA receptor binding protein in the rat hippocampus. Acta Neuropathol. 2001, 101, 460–468. [Google Scholar] [CrossRef] [PubMed]
- Drexel, M.; Preidt, A.P.; Sperk, G. Sequel of spontaneous seizures after kainic acid-induced status epilepticus and associated neuropathological changes in the subiculum and entorhinal cortex. Neuropharmacology 2012, 63, 806–817. [Google Scholar] [CrossRef] [Green Version]

| Name | Forward | Reverse | Ampli. Size |
|---|---|---|---|
| Nrf2 | GCAACTCCAGAAGGAACAGG | GGAATGGCTCTCTGCCAAAAGC | 203 |
| GAPDH | GACATGCCGCCTGGAGAAAC | AGCCCAGGATGCCCTTTAGT | 92 |
| NQO1 | GTTTGCCTGGCTTGCTTTCA | ACAGCCGTGGCAGAACTATC | 99 |
| HO-1 | ACAGGGTGACAGAAGAGGCTAA | CTGTGAGGGACTCTGGTCTTTG | 107 |
Publisher’s Note: MDPI stays neutral with regard to jurisdictional claims in published maps and institutional affiliations. |
© 2021 by the authors. Licensee MDPI, Basel, Switzerland. This article is an open access article distributed under the terms and conditions of the Creative Commons Attribution (CC BY) license (https://creativecommons.org/licenses/by/4.0/).
Share and Cite
Sandouka, S.; Shekh-Ahmad, T. Induction of the Nrf2 Pathway by Sulforaphane Is Neuroprotective in a Rat Temporal Lobe Epilepsy Model. Antioxidants 2021, 10, 1702. https://doi.org/10.3390/antiox10111702
Sandouka S, Shekh-Ahmad T. Induction of the Nrf2 Pathway by Sulforaphane Is Neuroprotective in a Rat Temporal Lobe Epilepsy Model. Antioxidants. 2021; 10(11):1702. https://doi.org/10.3390/antiox10111702
Chicago/Turabian StyleSandouka, Sereen, and Tawfeeq Shekh-Ahmad. 2021. "Induction of the Nrf2 Pathway by Sulforaphane Is Neuroprotective in a Rat Temporal Lobe Epilepsy Model" Antioxidants 10, no. 11: 1702. https://doi.org/10.3390/antiox10111702
APA StyleSandouka, S., & Shekh-Ahmad, T. (2021). Induction of the Nrf2 Pathway by Sulforaphane Is Neuroprotective in a Rat Temporal Lobe Epilepsy Model. Antioxidants, 10(11), 1702. https://doi.org/10.3390/antiox10111702