
Differential Roles of Neural Integrity, Physical Activity and Depression in Frailty: Sex-Related Differences

 , and
, and
Abstract
1. Introduction
2. Materials and Methods
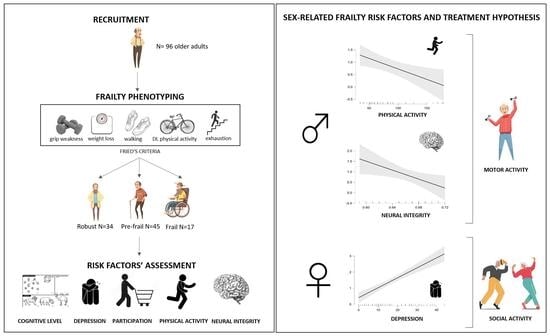
2.1. Participants
- -
- Fried’s frailty phenotype: based on five frailty indicators: unintentional weight loss in the prior year (≥4.5 kg), grip weakness measured by a manual dynamometer (20% below the norm, based on gender and BMI), perceived exhaustion in their daily routine, slowness in walking (20% below the norm, based on gender and height) measured by the 10 Meter Walking Test [15], and low physical activity (20% below the norm) in terms of kcal/week measured by Minnesota Leisure Time Activity Questionnaire [16]. Based on Fried’s instructions [17], people presenting three or more frailty indicators were classified as frail, those who reported one or two indicators as prefrail, and people without any indicators classed as robust.
- -
- Demographic characteristics: age, sex, and years of education and anamnestic information collected during the clinical interview, such as current and remote comorbidities, surgical interventions, and pharmacological treatments.
- -
- Motor activities: the Physical Activity Scale for the elderly (PASE, [18]) questionnaire. The PASE score ranges from 0 to 793, with a higher score indicating a greater physical activity routine.
- -
- Cognitive level: the Montreal Cognitive Assessment (MoCA, [19]). The MoCA total score ranges from 0 to 30, with a higher score suggesting a greater global cognitive level.
- -
- Psycho-Behavioral level: the Center for Epidemiologic Studies Depression Scale (CES-D, [20]), for a measure of the frequency of depression-related symptomatology. The scale score ranges from 0 to 60, with a higher score indicating greater depressive symptoms.
- -
- Participation in daily life: the Alzheimer’s Disease Cooperative Study—Activities of Daily Living Scale (ADCS-ADL, [21]). The ADCS-ADL score ranges from 0 to 78, with a higher score suggesting a greater autonomy level.
- -
- Neural integrity: a 3T MRI brain examination including a T1-3D magnetization-prepared rapid acquisition gradient echo (MPRAGE, 0.80 mm3, TR/TE: 2300/3.1 ms, FOV: 256 × 240 mm) sequence for brain morphology evaluation, fluid-attenuated inversion recovery (FLAIR) (0.4 × 0.4 × 1 mm3, TR/TE: 5000/394 ms, FOV: 256 × 230 mm) for white matter hyper-intensities, and T2-weighted sequence to exclude gross brain abnormalities.
2.2. Materials
2.3. Statistical Analysis
3. Results
3.1. Participants Characteristics
3.2. Sex Differences in Fried’s Frailty Indicators
3.3. Effects of Sex and Frailty on Clinical, Psychobehavioral and Neural Profile
4. Discussion
5. Conclusions
Author Contributions
Funding
Institutional Review Board Statement
Informed Consent Statement
Data Availability Statement
Acknowledgments
Conflicts of Interest
References
- Dent, E.; Martin, F.C.; Bergman, H.; Woo, J.; Romero-Ortuno, R.; Walston, J.D. Management of frailty: Opportunities, challenges, and future directions. Lancet 2019, 394, 1376–1386. [Google Scholar] [CrossRef]
- Park, C.; Ko, F.C. The Science of Frailty: Sex Differences. Clin. Geriatr. Med. 2021, 37, 625–638. [Google Scholar] [CrossRef] [PubMed]
- Gordon, E.H.; Peel, N.M.; Samanta, M.; Theou, O.; Howlett, S.E.; Hubbard, R.E. Sex differences in frailty: A systematic review and meta-analysis. Exp. Gerontol. 2017, 89, 30–40. [Google Scholar] [CrossRef] [PubMed]
- Gordon, E.H.; Hubbard, R.E. Do sex differences in chronic disease underpin the sex-frailty paradox? Mech. Ageing Dev. 2019, 179, 44–50. [Google Scholar] [CrossRef]
- Gordon, E.H.; Hubbard, R.E. Differences in frailty in older men and women. Med. J. Aust. 2020, 212, 183–188. [Google Scholar] [CrossRef] [PubMed]
- Kane, A.E.; Howlett, S.E. Sex differences in frailty: Comparisons between humans and preclinical models. Mech. Ageing Dev. 2021, 198, 111546. [Google Scholar] [CrossRef]
- Crimmins, E.M.; Kim, J.K.; Solé-Auró, A. Gender differences in health: Results from SHARE, ELSA and HRS. Eur. J. Public Health 2011, 21, 81–91. [Google Scholar] [CrossRef]
- Whitson, H.E.; Landerman, L.R.; Newman, A.B.; Fried, L.P.; Pieper, C.F.; Cohen, H.J. Chronic medical conditions and the sex-based disparity in disability: The Cardiovascular Health Study. J. Gerontol. A Biol. Sci. Med. Sci. 2010, 65, 1325–1331. [Google Scholar] [CrossRef]
- Kingston, A.; Davies, K.; Collerton, J.; Robinson, L.; Duncan, R.; Bond, J.; Kirkwood, T.B.; Jagger, C. The contribution of diseases to the male-female disability-survival paradox in the very old: Results from the Newcastle 85+ study. PLoS ONE 2014, 9, e88016. [Google Scholar] [CrossRef]
- Avedano, M.; Mackenbach, J. Changes in Physical Health among Older Europeans. In First Results from the Survey of Health, Ageing and Retirement in Europe (2004–2007); Borsch-Supan, A., Brugiavini, A., Jurges, H., Eds.; Mannheim Research Institute for the Economics of Aging: Mannheim, Germany, 2008; pp. 118–124. [Google Scholar]
- Hubbard, R.E.; Rockwood, K. Frailty in older women. Maturitas 2011, 69, 203–207. [Google Scholar] [CrossRef]
- Ruan, Q.; Yu, Z.; Chen, M.; Bao, Z.; Li, J.; He, W. Cognitive frailty, a novel target for the prevention of elderly dependency. Ageing Res. Rev. 2015, 20, 1–10. [Google Scholar] [CrossRef]
- Avila-Funes, J.A.; Carcaillon, L.; Helmer, C.; Carrière, I.; Ritchie, K.; Rouaud, O.; Tzourio, C.; Dartigues, J.F.; Amieva, H. Is frailty a prodromal stage of vascular dementia? Results from the Three-City Study. J. Am. Geriatr. Soc. 2012, 60, 1708–1712. [Google Scholar] [CrossRef]
- Kelaiditi, E.; Cesari, M.; Canevelli, M.; van Kan, G.A.; Ousset, P.J.; Gillette-Guyonnet, S.; Ritz, P.; Duveau, F.; Soto, M.E.; Provencher, V.; et al. Cognitive frailty: Rational and definition from an (I.A.N.A./I.A.G.G.) international consensus group. J. Nutr. Health Aging 2013, 17, 726–734. [Google Scholar] [CrossRef]
- Bohannon, R.W. Comfortable and maximum walking speed of adults aged 20–79 years: Reference values and determinants. Age Ageing 1997, 26, 15–19. [Google Scholar] [CrossRef]
- Richardson, M.T.; Leon, A.S.; Jacobs, D.R., Jr.; Ainsworth, B.E.; Serfass, R. Comprehensive evaluation of the Minnesota Leisure Time Physical Activity Questionnaire. J. Clin. Epidemiol. 1994, 47, 271–281. [Google Scholar] [CrossRef]
- Fried, L.P.; Tangen, C.M.; Walston, J.; Newman, A.B.; Hirsch, C.; Gottdiener, J.; Seeman, T.; Tracy, R.; Kop, W.J.; Burke, G.; et al. Frailty in older adults: Evidence for a phenotype. J. Gerontol. A Biol. Sci. Med. Sci. 2001, 56, M146–M156. [Google Scholar] [CrossRef]
- Washburn, R.A.; Smith, K.W.; Jette, A.M.; Janney, C.A. The Physical Activity Scale for the Elderly (PASE): Development and evaluation. J. Clin. Epidemiol. 1993, 46, 153–162. [Google Scholar] [CrossRef]
- Conti, S.; Bonazzi, S.; Laiacona, M.; Masina, M.; Coralli, M.V. Montreal Cognitive Assessmen (MoCA)-Italian version: Regression based norms and equivalent scores. Neurol. Sci. 2015, 36, 209–214. [Google Scholar] [CrossRef]
- Radloff, L.S. The CES-D scale: A self-report depression scale for research in the general population. Appl. Psychol. Meas. 1977, 1, 385–401. [Google Scholar] [CrossRef]
- Galasko, D.; Bennett, D.; Sano, M.; Ernesto, C.; Thomas, R.; Grundman, M.; Ferris, S. An inventory to assess activities of daily living for clinical trials in Alzheimer’s disease. The Alzheimer’s Disease Cooperative Study. Alzheimer Dis. Assoc. Disord. 1997, 11 (Suppl. S2), S33–S39. [Google Scholar] [CrossRef]
- Charlson, M.E.; Pompei, P.; Ales, K.L.; MacKenzie, C.R. A new method of classifying prognostic comorbidity in longitudinal studies: Development and validation. J. Chronic Dis. 1987, 40, 373–383. [Google Scholar] [CrossRef] [PubMed]
- Radovanovic, D.; Seifert, B.; Urban, P.; Eberli, F.R.; Rickli, H.; Bertel, O.; Puhan, M.A.; Erne, P. Validity of Charlson Comorbidity Index in patients hospitalised with acute coronary syndrome. Insights from the nationwide AMIS Plus registry 2002–2012. Heart 2014, 100, 288–294. [Google Scholar] [CrossRef] [PubMed]
- Klapwijk, E.T.; van de Kamp, F.; van der Meulen, M.; Peters, S.; Wierenga, L.M. Qoala-T: A supervised-learning tool for quality control of FreeSurfer segmented MRI data. Neuroimage 2019, 189, 116–129. [Google Scholar] [CrossRef] [PubMed]
- Fischl, B.; Salat, D.H.; Busa, E.; Albert, M.; Dieterich, M.; Haselgrove, C.; van der Kouwe, A.; Killiany, R.; Kennedy, D.; Klaveness, S.; et al. Whole brain segmentation: Automated labeling of neuroanatomical structures in the human brain. Neuron 2002, 33, 341–355. [Google Scholar] [CrossRef] [PubMed]
- Buigues, C.; Padilla-Sánchez, C.; Garrido, J.F.; Navarro-Martínez, R.; Ruiz-Ros, V.; Cauli, O. The relationship between depression and frailty syndrome: A systematic review. Aging Ment. Health 2015, 19, 762–772. [Google Scholar] [CrossRef]
- Mezuk, B.; Edwards, L.; Lohman, M.; Choi, M.; Lapane, K. Depression and frailty in later life: A synthetic review. Int. J. Geriatr. Psychiatry 2012, 27, 879–892. [Google Scholar] [CrossRef]
- Verbrugge, L.M. Gender and health: An update on hypotheses and evidence. J. Health Soc. Behav. 1985, 26, 156–182. [Google Scholar] [CrossRef]
- Newman, A.B.; Brach, J.S. Gender gap in longevity and disability in older persons. Epidemiol. Rev. 2001, 23, 343–350. [Google Scholar] [CrossRef]
- Asztalos, M.; De Bourdeaudhuij, I.; Cardon, G. The relationship between physical activity and mental health varies across activity intensity levels and dimensions of mental health among women and men. Public Health Nutr. 2010, 13, 1207–1214. [Google Scholar] [CrossRef]
- Cabeza, R.; Albert, M.; Belleville, S.; Craik, F.I.M.; Duarte, A.; Grady, C.L.; Lindenberger, U.; Nyberg, L.; Park, D.C.; Reuter-Lorenz, P.A.; et al. Maintenance, reserve and compensation: The cognitive neuroscience of healthy ageing. Nat. Rev. Neurosci. 2018, 19, 701–710. [Google Scholar] [CrossRef]
- Neufer, P.D.; Bamman, M.M.; Muoio, D.M.; Bouchard, C.; Cooper, D.M.; Goodpaster, B.H.; Booth, F.W.; Kohrt, W.M.; Gerszten, R.E.; Mattson, M.P.; et al. Understanding the Cellular and Molecular Mechanisms of Physical Activity-Induced Health Benefits. Cell Metab. 2015, 22, 4–11. [Google Scholar] [CrossRef]
- Llamas-Velasco, S.; Contador, I.; Villarejo-Galende, A.; Lora-Pablos, D.; Bermejo-Pareja, F. Physical Activity as Protective Factor against Dementia: A Prospective Population-Based Study (NEDICES). J. Int. Neuropsychol. Soc. 2015, 21, 861–867. [Google Scholar] [CrossRef]
- Hamer, M.; Chida, Y. Physical activity and risk of neurodegenerative disease: A systematic review of prospective evidence. Psychol. Med. 2009, 39, 3–11. [Google Scholar] [CrossRef]
- Cheng, S.T. Cognitive Reserve and the Prevention of Dementia: The Role of Physical and Cognitive Activities. Curr. Psychiatry Rep. 2016, 18, 85. [Google Scholar] [CrossRef]
- Lin, X.; Zhang, X.; Guo, J.; Roberts, C.K.; McKenzie, S.; Wu, W.C.; Liu, S.; Song, Y. Effects of Exercise Training on Cardiorespiratory Fitness and Biomarkers of Cardiometabolic Health: A Systematic Review and Meta-Analysis of Randomized Controlled Trials. J. Am. Heart Assoc. 2015, 4, e002014. [Google Scholar] [CrossRef]
- Herzig, K.H.; Ahola, R.; Leppäluoto, J.; Jokelainen, J.; Jämsä, T.; Keinänen-Kiukaanniemi, S. Light physical activity determined by a motion sensor decreases insulin resistance, improves lipid homeostasis and reduces visceral fat in high-risk subjects: PreDiabEx study RCT. Int. J. Obes. 2014, 38, 1089–1096. [Google Scholar] [CrossRef]
- Mobasseri, M.; Yavari, A.; Najafipoor, F.; Aliasgarzadeh, A.; Niafar, M. Effect of a long-term regular physical activity on hypertension and body mass index in type 2 diabetes patients. J. Sports Med. Phys. Fit. 2015, 55, 84–90. [Google Scholar]
- Vinetti, G.; Mozzini, C.; Desenzani, P.; Boni, E.; Bulla, L.; Lorenzetti, I.; Romano, C.; Pasini, A.; Cominacini, L.; Assanelli, D. Supervised exercise training reduces oxidative stress and cardiometabolic risk in adults with type 2 diabetes: A randomized controlled trial. Sci. Rep. 2015, 5, 9238. [Google Scholar] [CrossRef]
- Boraxbekk, C.J.; Salami, A.; Wåhlin, A.; Nyberg, L. Physical activity over a decade modifies age-related decline in perfusion, gray matter volume, and functional connectivity of the posterior default-mode network-A multimodal approach. Neuroimage 2016, 131, 133–141. [Google Scholar] [CrossRef]
- Sihvonen, A.J.; Särkämö, T.; Leo, V.; Tervaniemi, M.; Altenmüller, E.; Soinila, S. Music-based interventions in neurological rehabilitation. Lancet Neurol. 2017, 16, 648–660. [Google Scholar] [CrossRef]
- Pearce, M.; Garcia, L.; Abbas, A.; Strain, T.; Schuch, F.B.; Golubic, R.; Kelly, P.; Khan, S.; Utukuri, M.; Laird, Y.; et al. Association Between Physical Activity and Risk of Depression: A Systematic Review and Meta-analysis. JAMA Psychiatry 2022, 79, 550–559. [Google Scholar] [CrossRef] [PubMed]
- Erickson, K.I.; Miller, D.L.; Roecklein, K.A. The aging hippocampus: Interactions between exercise, depression, and BDNF. Neuroscientist 2012, 18, 82–97. [Google Scholar] [CrossRef] [PubMed]
- Nishida, Y.; Tanaka, K.; Hara, M.; Hirao, N.; Tanaka, H.; Tobina, T.; Ikeda, M.; Yamato, H.; Ohta, M. Effects of home-based bench step exercise on inflammatory cytokines and lipid profiles in elderly Japanese females: A randomized controlled trial. Arch. Gerontol. Geriatr. 2015, 61, 443–451. [Google Scholar] [CrossRef] [PubMed]
- Liang, K.Y.; Mintun, M.A.; Fagan, A.M.; Goate, A.M.; Bugg, J.M.; Holtzman, D.M.; Morris, J.C.; Head, D. Exercise and Alzheimer’s disease biomarkers in cognitively normal older adults. Ann. Neurol. 2010, 68, 311–318. [Google Scholar] [CrossRef]


| All | Males | Females | Males-Females Comparison (p) | |
|---|---|---|---|---|
| N | 96 | 38 | 58 | |
| Age, M (sd) | 75.49 (6.62) | 75.05 (6.08) | 75.78 (7.00) | t = −0.52 (0.603) |
| Education, M (sd) | 11.29 (3.85) | 12.13 (3.73) | 10.74 (3.86) | t = 1.75 (0.084) |
| Frailty score, M (sd) | 1.22 (1.17) | 0.84 (0.97) | 1.47 (1.23) | t = −2.76 (0.007) |
| Comorbidities | ||||
| Myocardial infarction, % | 10.42 | 13.16 | 8.62 | χ2 = 0.38 (0.535) |
| heart failure, % | 7.29 | 7.89 | 6.90 | χ2 = 0.03 (0.855) |
| * lung disease, % | 21.87 | 39.47 | 10.34 | χ2 = 11.33 (0.008) |
| Diabetes, % | 5.20 | 10.53 | 1.72 | χ2 = 2.96 (0.085) |
| moderate-severe renal disease, % | 1.04 | 2.63 | 0.00 | χ2 = 1.74 (0.187) |
| chronic liver disease, % | 2.08 | 2.63 | 1.72 | χ2 = 0.10 (0.755) |
| gastric peptic ulcer, % | 1.04 | 0.00 | 1.72 | χ2 = 0.76 (0.383) |
| Cancer, % | 6.25 | 10.53 | 3.45 | χ2 = 2.05 (0.152) |
| rheumatic/connective tissue disease, % | 1.04 | 0.00 | 1.72 | χ2 = 0.76 (0.383) |
| Hypertension, % | 60.00 | 47.37 | 72.41 | χ2 = 6.03 (0.014) |
| Charlson Comorbidity Index §, M (sd) | 0.60 (0.91) | 0.45 (0.72) | 0.71 (1.01) | t = −1.37 (0.087) |
| All | Robust | Pre-Frail | Frail | |
|---|---|---|---|---|
| Total [N] | 96 | 34 | 45 | 17 |
| M/F | 38/58 | 17/17 | 18/27 | 3/14 |
| Body-weight loss | ||||
| Total [N;(%)] | 13; (13%) | 5; (11%) | 8; (47%) | |
| M/F [N; (%)] | 3/10; (7%/17%) | - | 2/3; (11%/11%) | 1/7; (33%/50%) |
| χ2 (p) | 3.77 (0.052) | 0.20 (0.655) | 4.50 (0.034) * | |
| Exhaustion | ||||
| Total [N;(%)] | 24; (25%) | 11; (24%) | 13; (76%) | |
| M/F [N;(%)] | 7/17; (18%/29%) | - | 4/7; (22%/26%) | 3/10; (100%/71%) |
| χ2 (p) | 4.17 (0.041) * | 0.82 (0.366) | 3.77 (0.052) | |
| Low physical activity | ||||
| Total [N;(%)] | 20; (2) | 10; (22) | 10; (59) | |
| M/F [N;(%)] | 7/14; (18%/24%) | - | 4/6; (22%/22%) | 2/8; (67%/57%) |
| χ2 (p) | 2.33(0.127) | 0.40 (0.527) | 3.60 (0.058) | |
| Slowness | ||||
| Total [N;(%)] | 14; (15) | 6; (13) | 8; (47) | |
| M/F [N; (%)] | 1/13; (3%/22%) | - | 1/5; (5%/18%) | 0/8; (0%/57%) |
| χ2 (p) | 10.29 (0.001) ** | 2.67 (0.102) | - *** | |
| Hand-grip strength | ||||
| Total [N;(%)] | 43; (45) | 29; (64) | 14; (82) | |
| M/F [N;(%)] | 12/31; (32%/53%) | - | 9/20; (50%/74%) | 3/11; (100%/79%) |
| χ2 (p) | 8.39 (0.004) ** | 4.17 (0.041) * | 4.57 (0.033) * |
| Robust | Prefrail | Frail | ANCOVA | |||||||
|---|---|---|---|---|---|---|---|---|---|---|
| Males (n = 17) | Females (n = 17) | Males (n = 18) | Females (n = 27) | Males (n = 3) | Females (n = 14) | Sex F | Frailty F | Sex × Frailty F | Bonferroni’s Post Hoc | |
| Demographics | ||||||||||
| Education, M (sd) | 11.71 (3.84) | 12.41 (2.78) | 12.00 (3.69) | 10.26 (4.17) | 15.33 (2.52) | 9.64 (3.95) | 4.63 * | 0.76 | 2.27 | Males > Females |
| CCI, M (sd) | 0.53 (0.72) | 0.47 (0.72) | 0.33 (0.68) | 0.85 (1.10) | 0.67 (1.15) | 0.71 (0.85) | 0.41 | 0.11 | 0.36 | - |
| Motor Activities | ||||||||||
| PASE, M (sd) | 114.29 (46.39) | 101.18 (48.69) | 61.72 (31.19) | 93.33 (42.45) | 78.00 (20.07) | 58.43 (32.95) | 0.00 | 5.08 ** | 3.30 * | Robust > Frail, Prefrail |
| Cognitive Level | ||||||||||
| MoCA, M (sd) | 22.37 (2.01) | 23.44 (2.53) | 21.82 (3.14) | 21.15 (2.80) | 19.91 (3.11) | 20.38 (4.62) | 0.15 | 3.33 * | 0.80 | Frail < Robust |
| Psycho-Behavioral Level | ||||||||||
| CES-D, M (sd) | 7.00 (5.97) | 8.82 (7.10) | 11.39 (8.94) | 17.15 (10.04) | 10.33 (4.51) | 26.86 (9.78) | 15.45 *** | 11.05 *** | 4.44 * | Females > Males; Frail > Pre-Frail, Robust; PreFrail > Robust |
| Participation in daily life | ||||||||||
| ADCS, M (sd) | 77.18 (1.51) | 77.00 (1.37) | 73.00 (8.32) | 72.44 (9.93) | 78.00 (0.00) | 66.21 (17.35) | 1.97 | 0.72 | 0.39 | - |
| Neural integrity | ||||||||||
| Neural Index, M (sd) | 0.66 (0.03) | 0.68 (0.06) | 0.66 (0.03) | 0.68 (0.088) | 0.63 (0.03) | 0.66 (0.04) | 4.80 * | 0.77 | 0.87 | Males > Females |
| Predictors | Standardized β | SE | t | Targeted p | F | Omnibus p | R2 | |
|---|---|---|---|---|---|---|---|---|
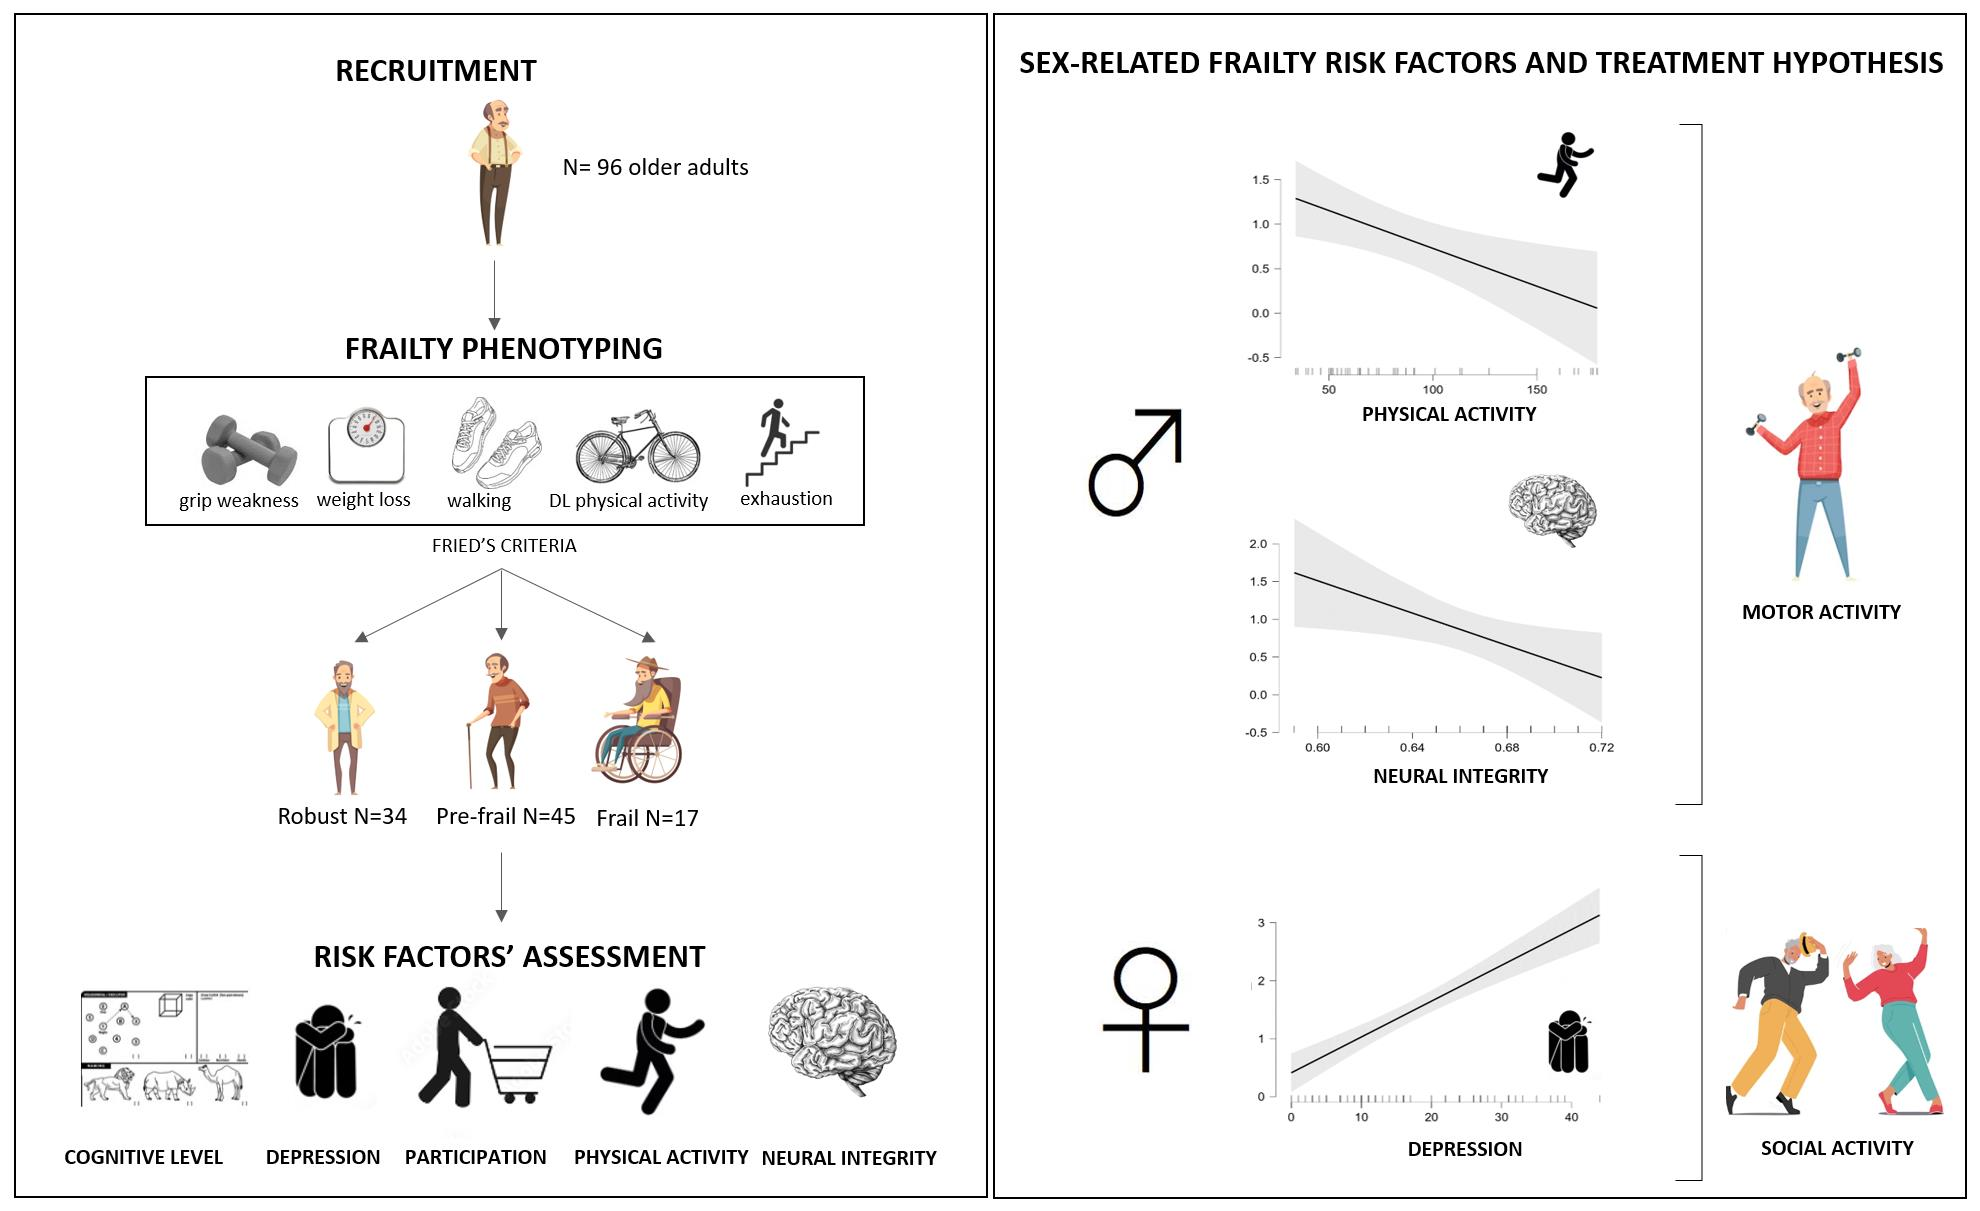
| Males | age | 0.00 | 0.02 | 0.13 | 0.897 | 4.56 | 0.005 | 0.356 |
| education | 0.07 | 0.04 | 2.00 | 0.054 | ||||
| PASE | −0.01 | 0.00 | −2.79 | 0.009 | ||||
| neural index | −11.06 | 4.56 | −2.43 | 0.021 | ||||
| Intercept | 7.75 | 4.37 | 1.77 | 0.085 | ||||
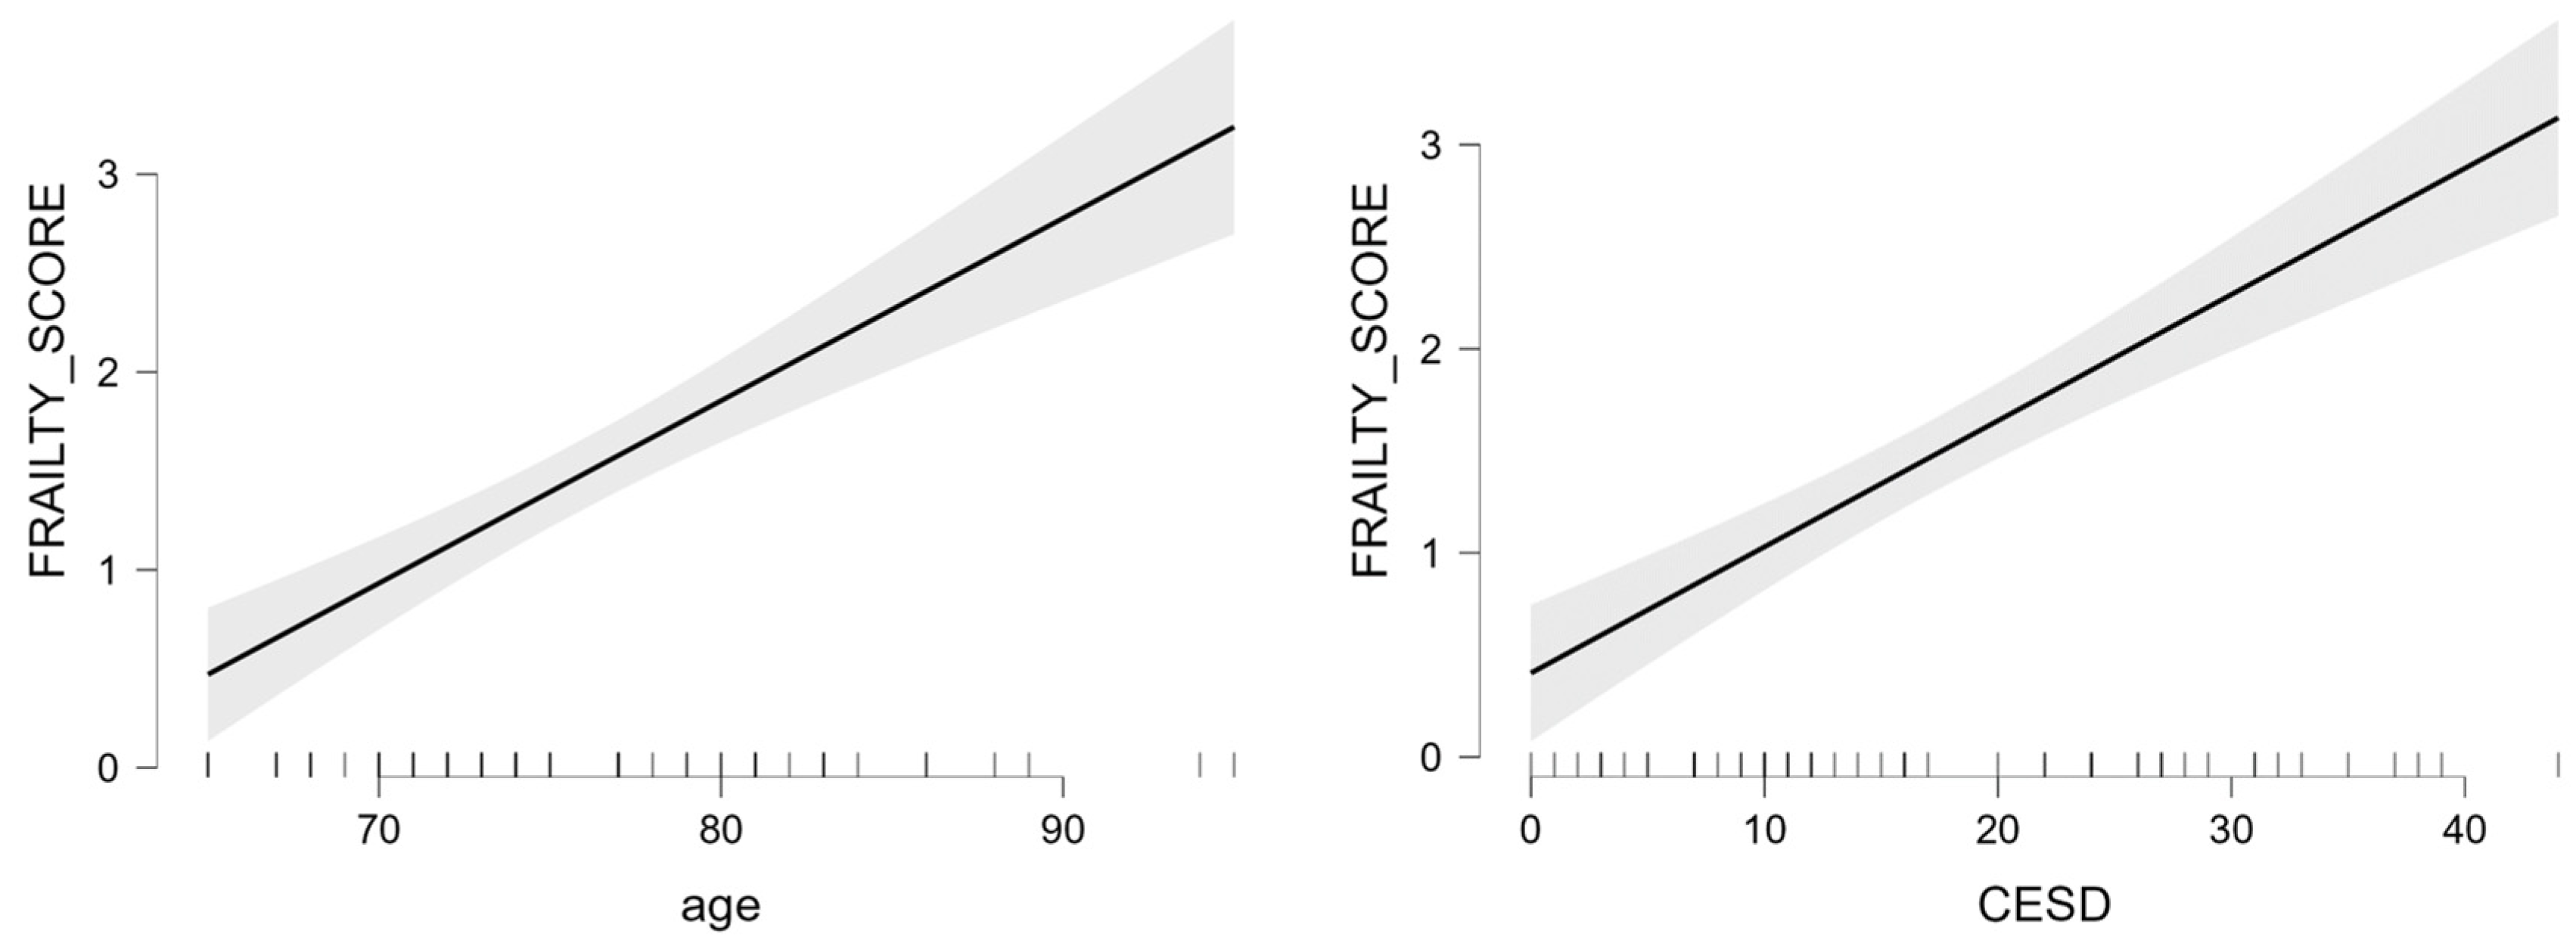
| Females | age | 0.09 | 0.01 | 6.94 | <0.001 | 34.60 | <0.001 | 0.723 |
| education | 0.01 | 0.03 | 0.56 | 0.579 | ||||
| CES-D | 0.62 | 0.01 | 7.48 | <0.001 | ||||
| MoCA | −0.05 | 0.03 | −1.86 | 0.068 | ||||
| Intercept | −5.55 | 1.25 | −4.44 | <0.001 |
Disclaimer/Publisher’s Note: The statements, opinions and data contained in all publications are solely those of the individual author(s) and contributor(s) and not of MDPI and/or the editor(s). MDPI and/or the editor(s) disclaim responsibility for any injury to people or property resulting from any ideas, methods, instructions or products referred to in the content. |
© 2023 by the authors. Licensee MDPI, Basel, Switzerland. This article is an open access article distributed under the terms and conditions of the Creative Commons Attribution (CC BY) license (https://creativecommons.org/licenses/by/4.0/).
Share and Cite
Isernia, S.; Cazzoli, M.; Baglio, G.; Cabinio, M.; Rossetto, F.; Giunco, F.; Baglio, F.; Blasi, V. Differential Roles of Neural Integrity, Physical Activity and Depression in Frailty: Sex-Related Differences. Brain Sci. 2023, 13, 950. https://doi.org/10.3390/brainsci13060950
Isernia S, Cazzoli M, Baglio G, Cabinio M, Rossetto F, Giunco F, Baglio F, Blasi V. Differential Roles of Neural Integrity, Physical Activity and Depression in Frailty: Sex-Related Differences. Brain Sciences. 2023; 13(6):950. https://doi.org/10.3390/brainsci13060950
Chicago/Turabian StyleIsernia, Sara, Marta Cazzoli, Gisella Baglio, Monia Cabinio, Federica Rossetto, Fabrizio Giunco, Francesca Baglio, and Valeria Blasi. 2023. "Differential Roles of Neural Integrity, Physical Activity and Depression in Frailty: Sex-Related Differences" Brain Sciences 13, no. 6: 950. https://doi.org/10.3390/brainsci13060950
APA StyleIsernia, S., Cazzoli, M., Baglio, G., Cabinio, M., Rossetto, F., Giunco, F., Baglio, F., & Blasi, V. (2023). Differential Roles of Neural Integrity, Physical Activity and Depression in Frailty: Sex-Related Differences. Brain Sciences, 13(6), 950. https://doi.org/10.3390/brainsci13060950