
Sonic Influence on Initially Neutral Brands: Using EEG to Unveil the Secrets of Audio Evaluative Conditioning


Abstract
:1. Introduction
2. Materials and Methods
2.1. Participants
2.2. Stimuli
Conditioning Stimuli
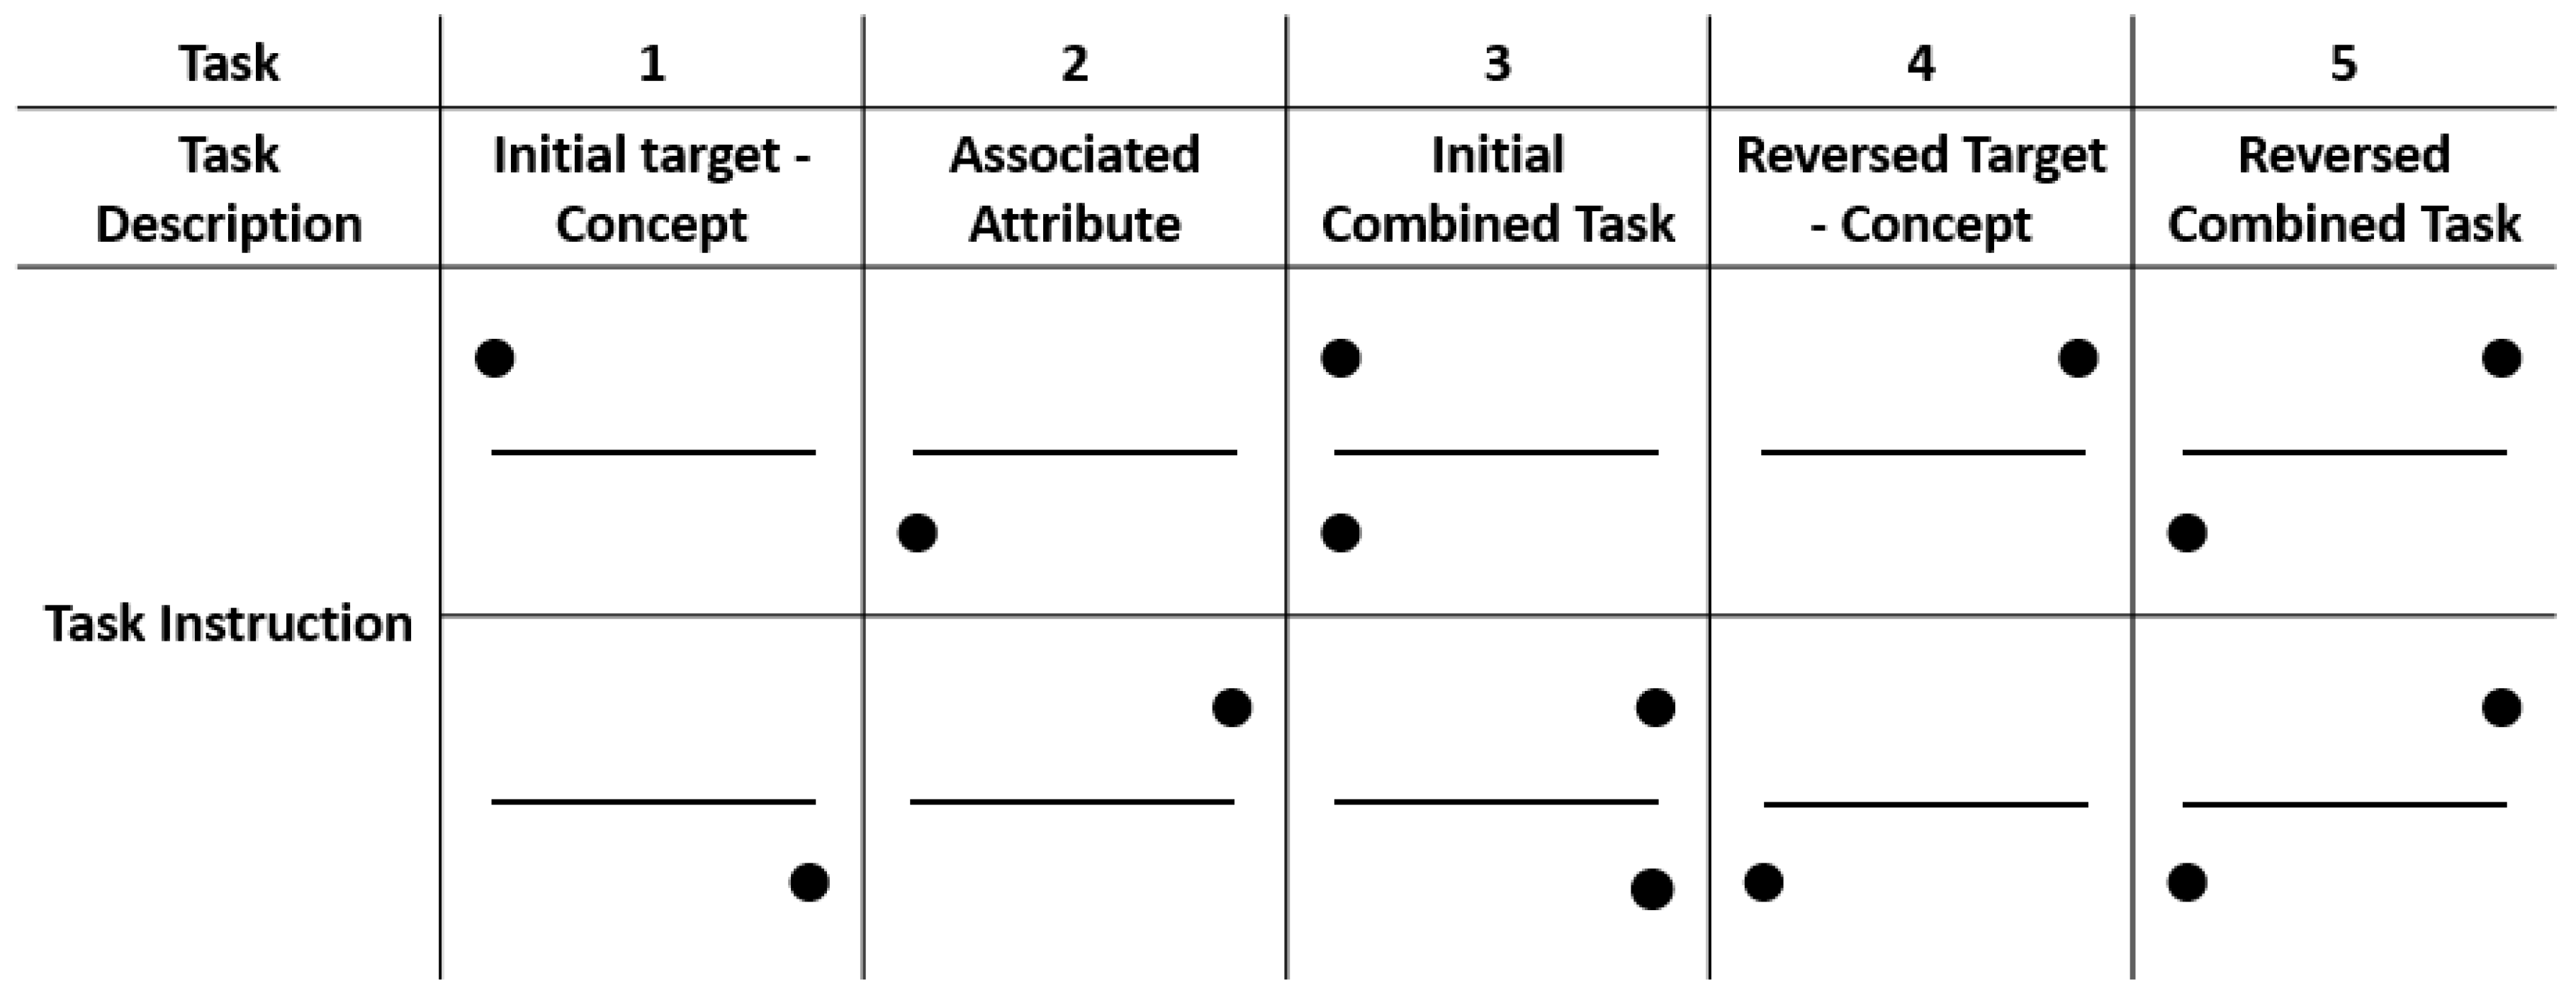
2.3. Procedure
2.3.1. Individual Pre-Assessment of Brand Attitudes
2.3.2. Lab Experiment
2.4. Data Recording and Processing
2.4.1. Explicit Data
2.4.2. Implicit Association Test (IAT)
2.4.3. Event-Related Potentials
3. Results
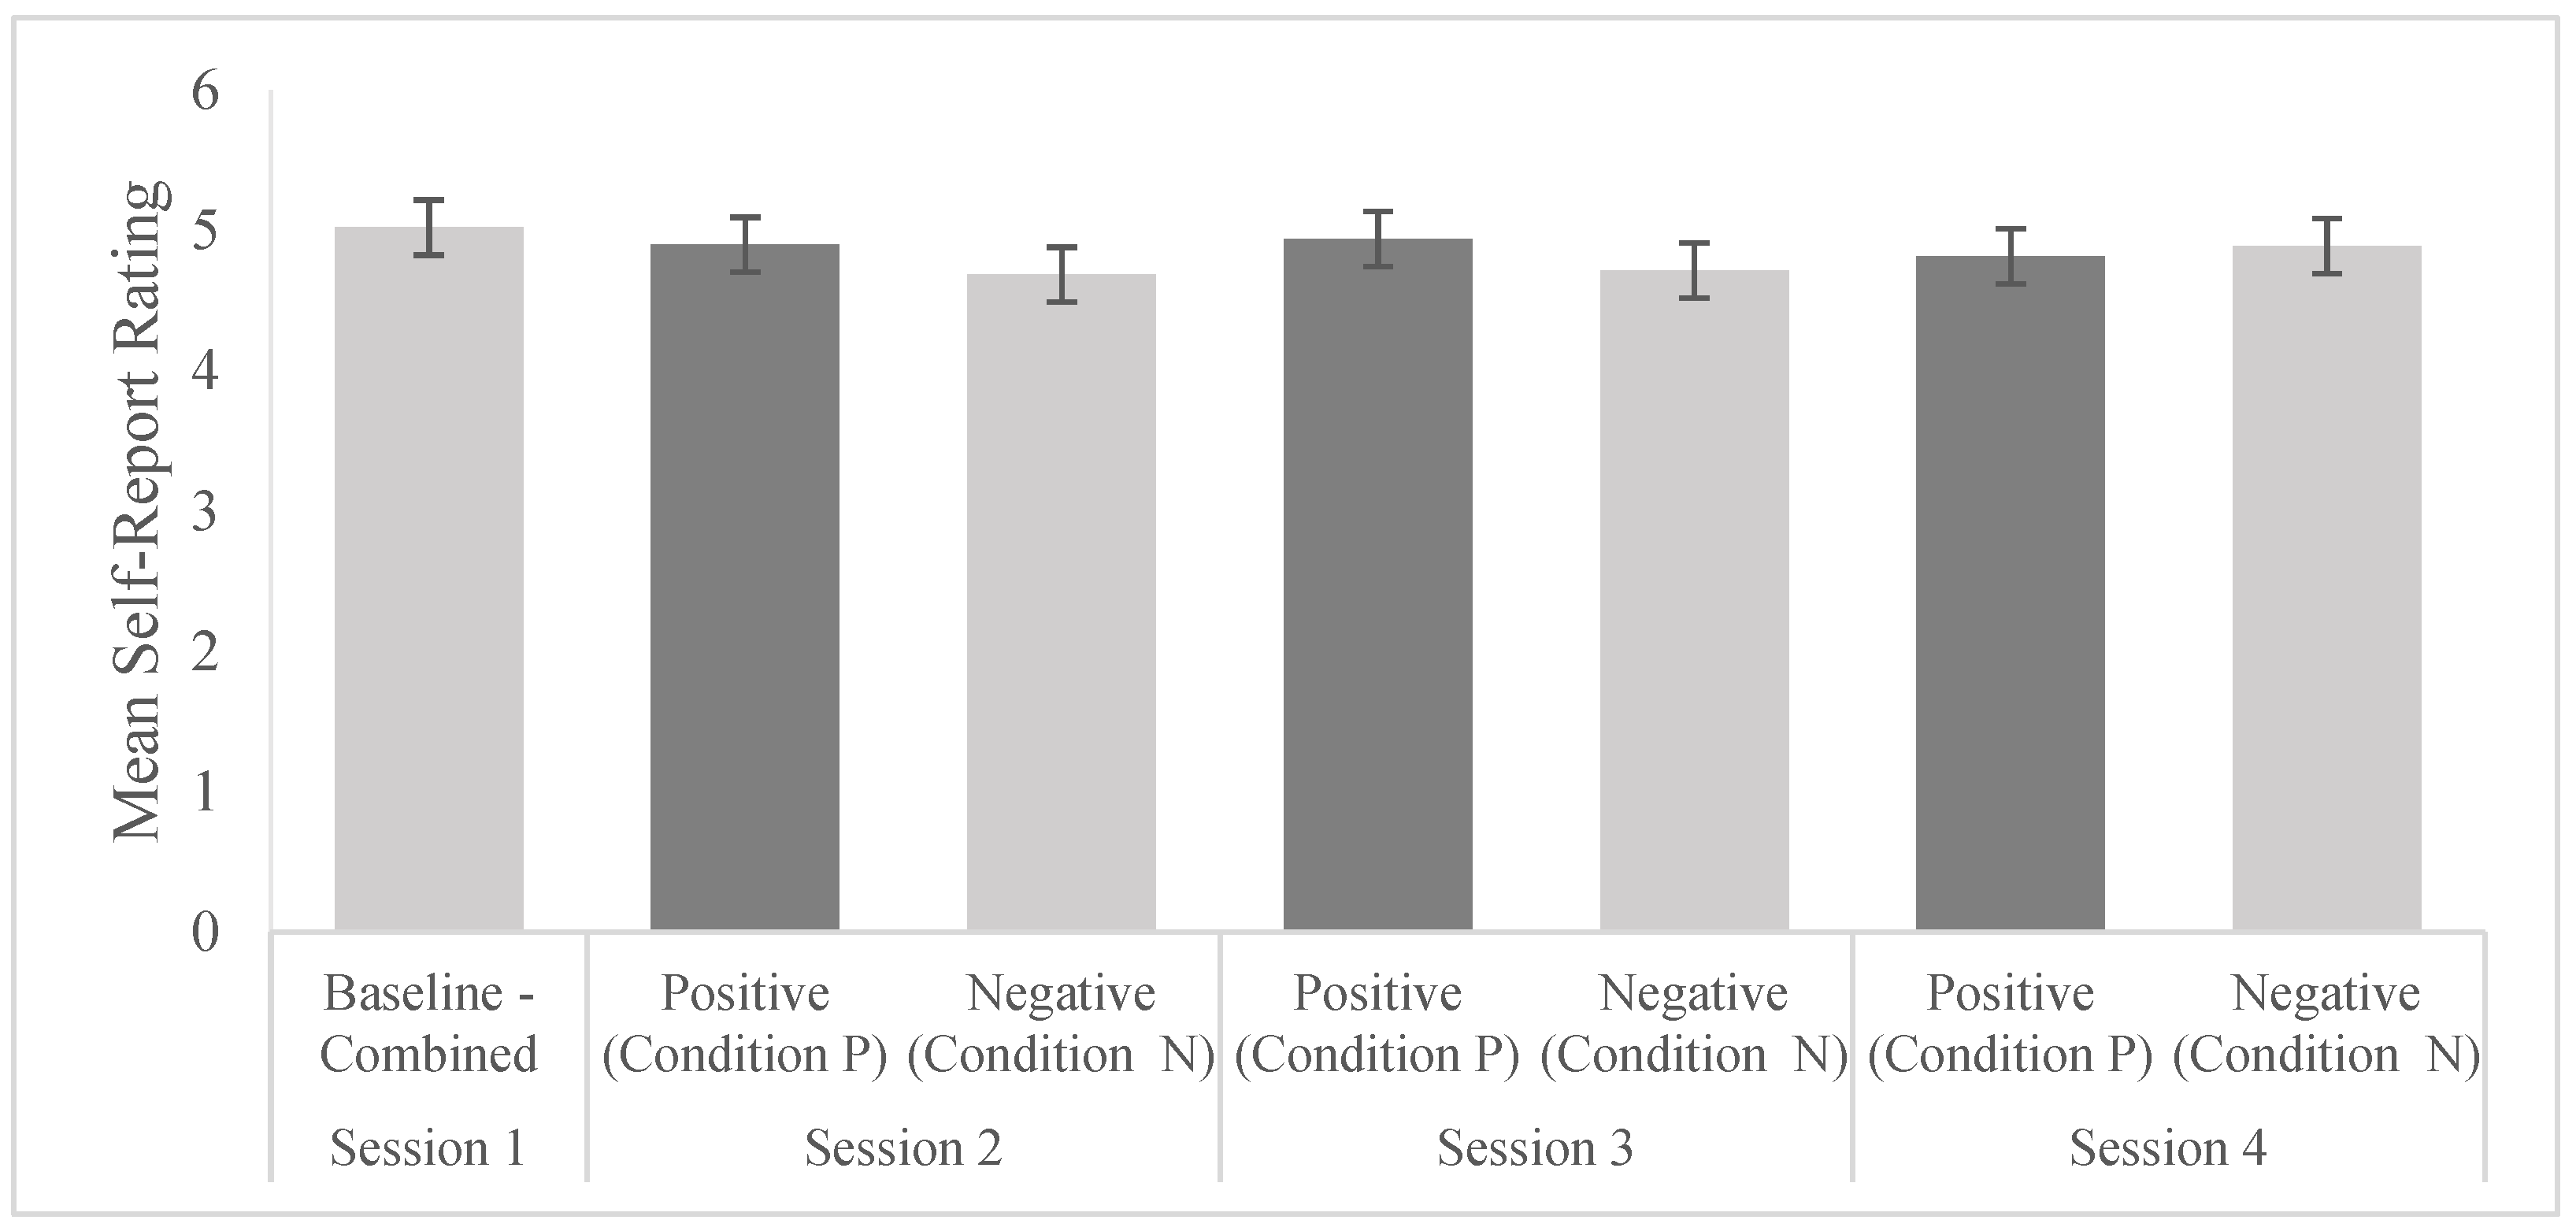
3.1. Self Report
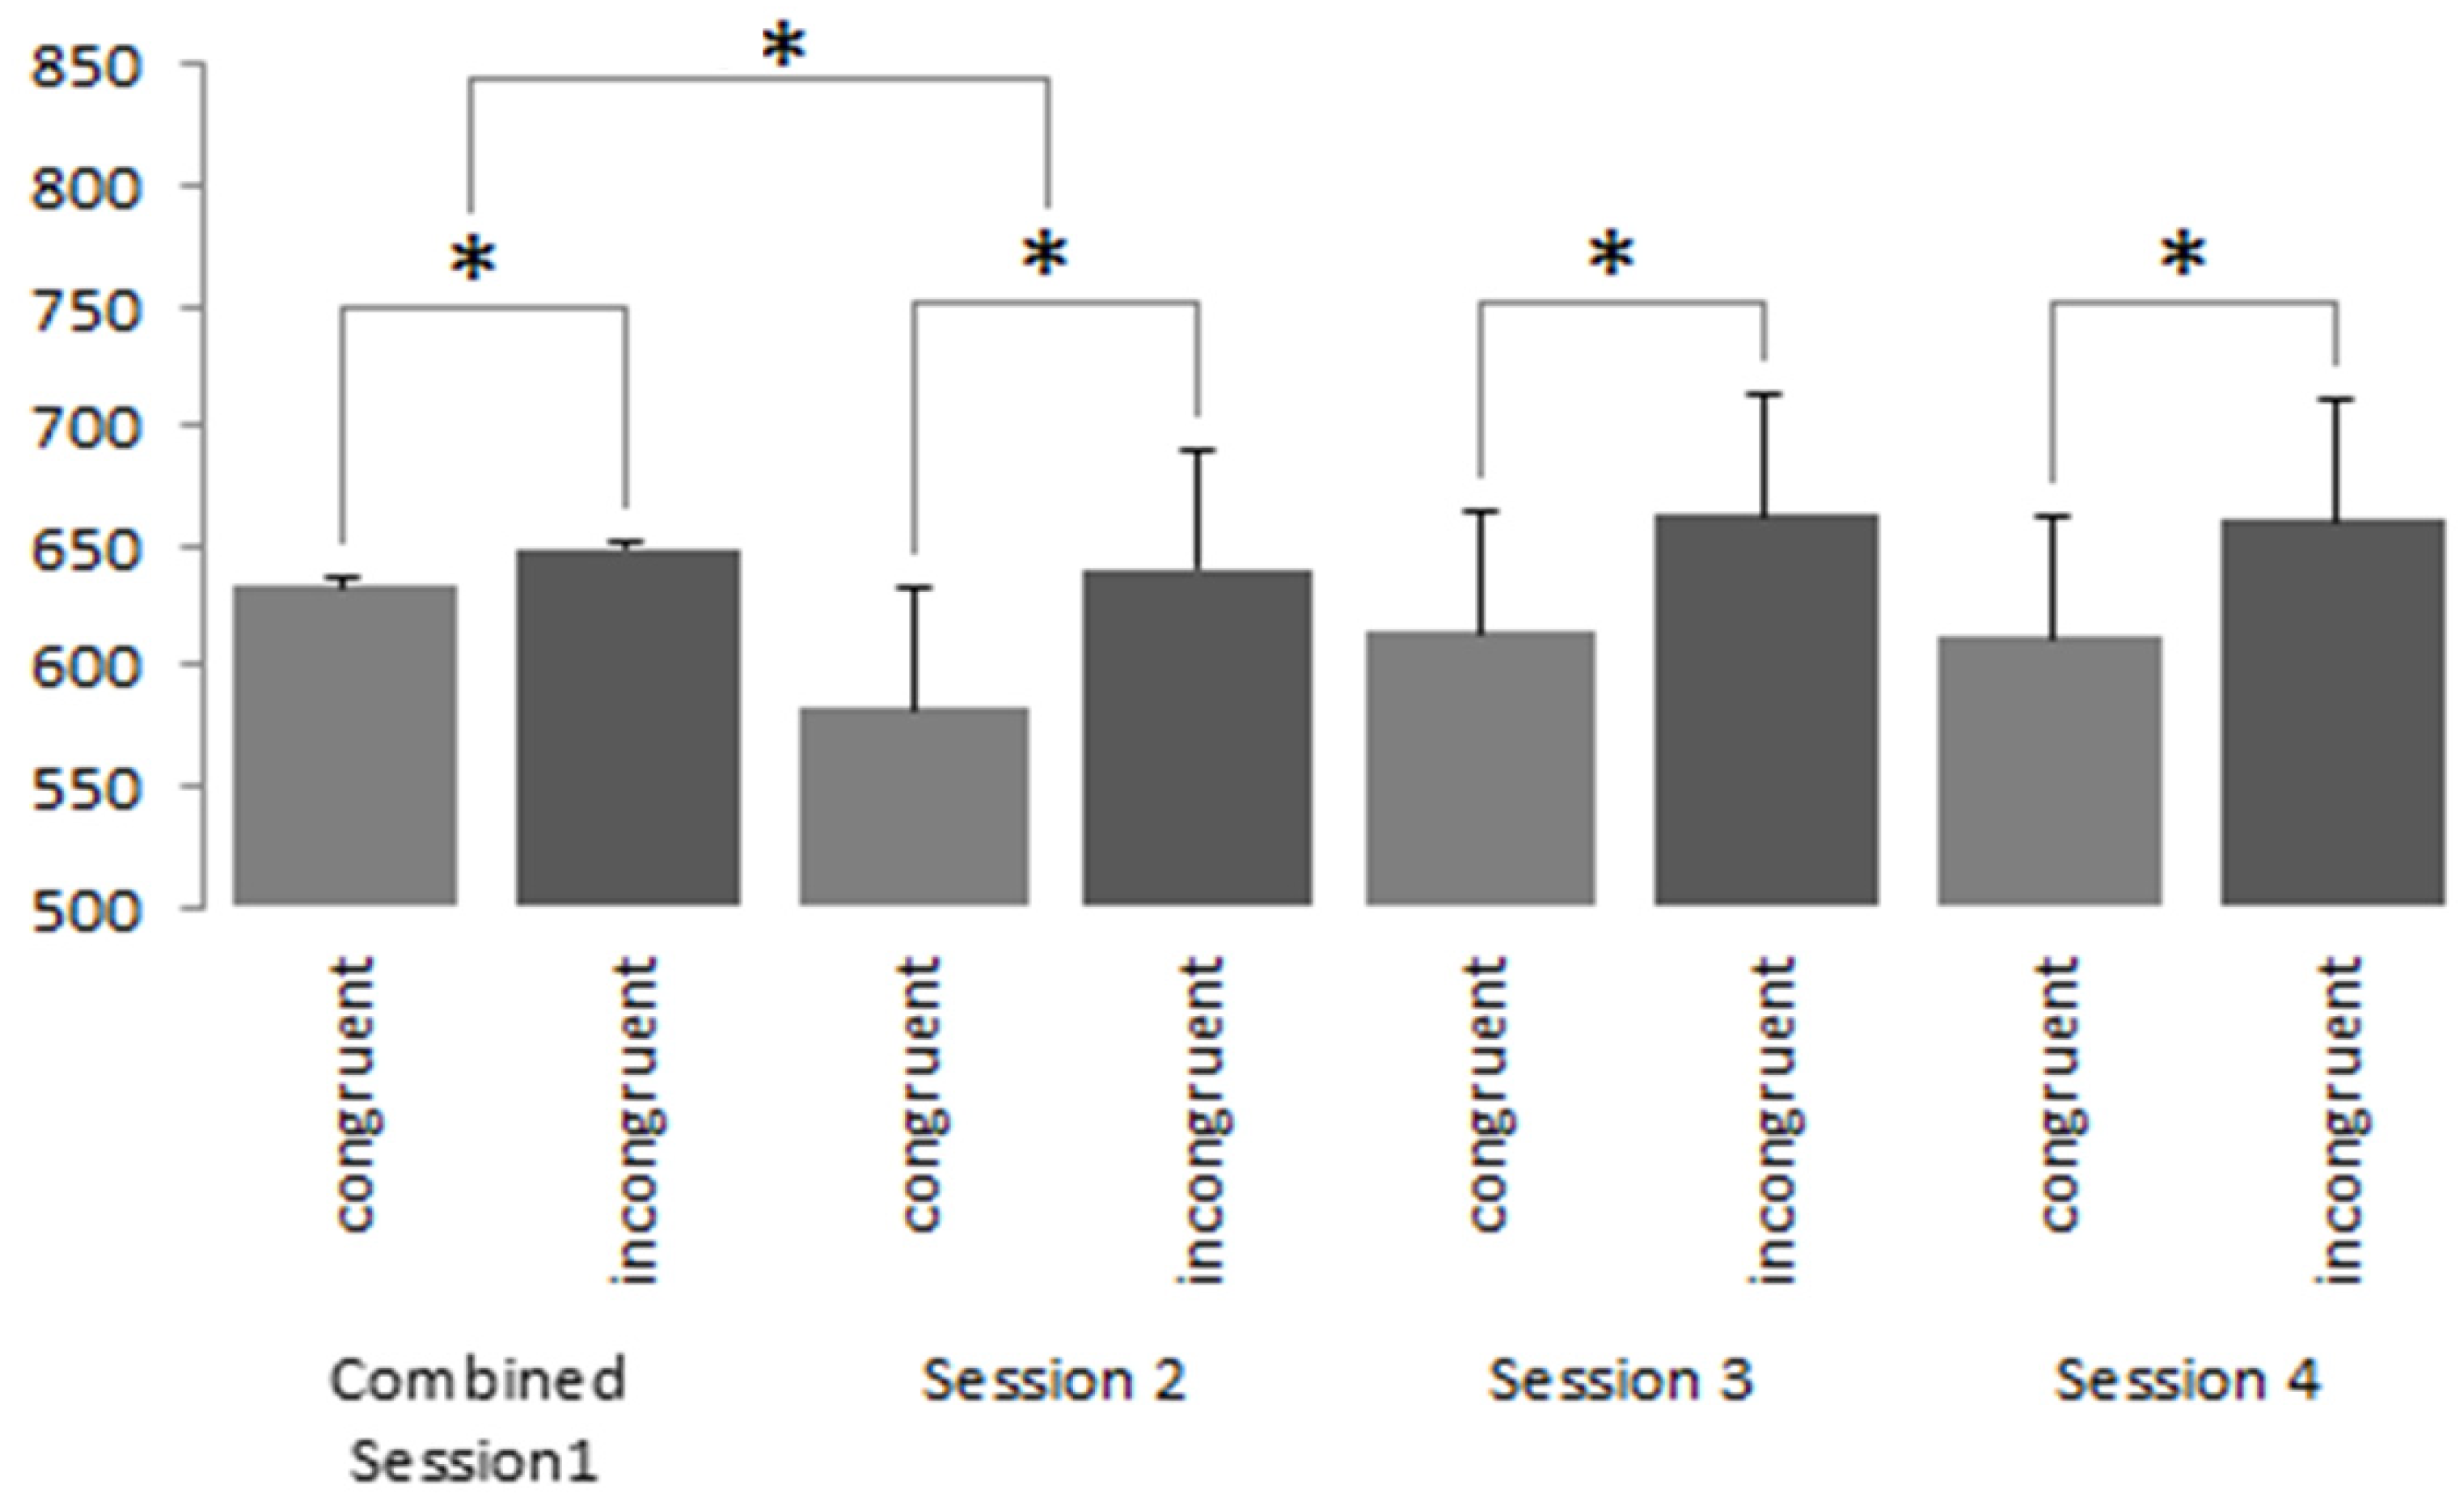
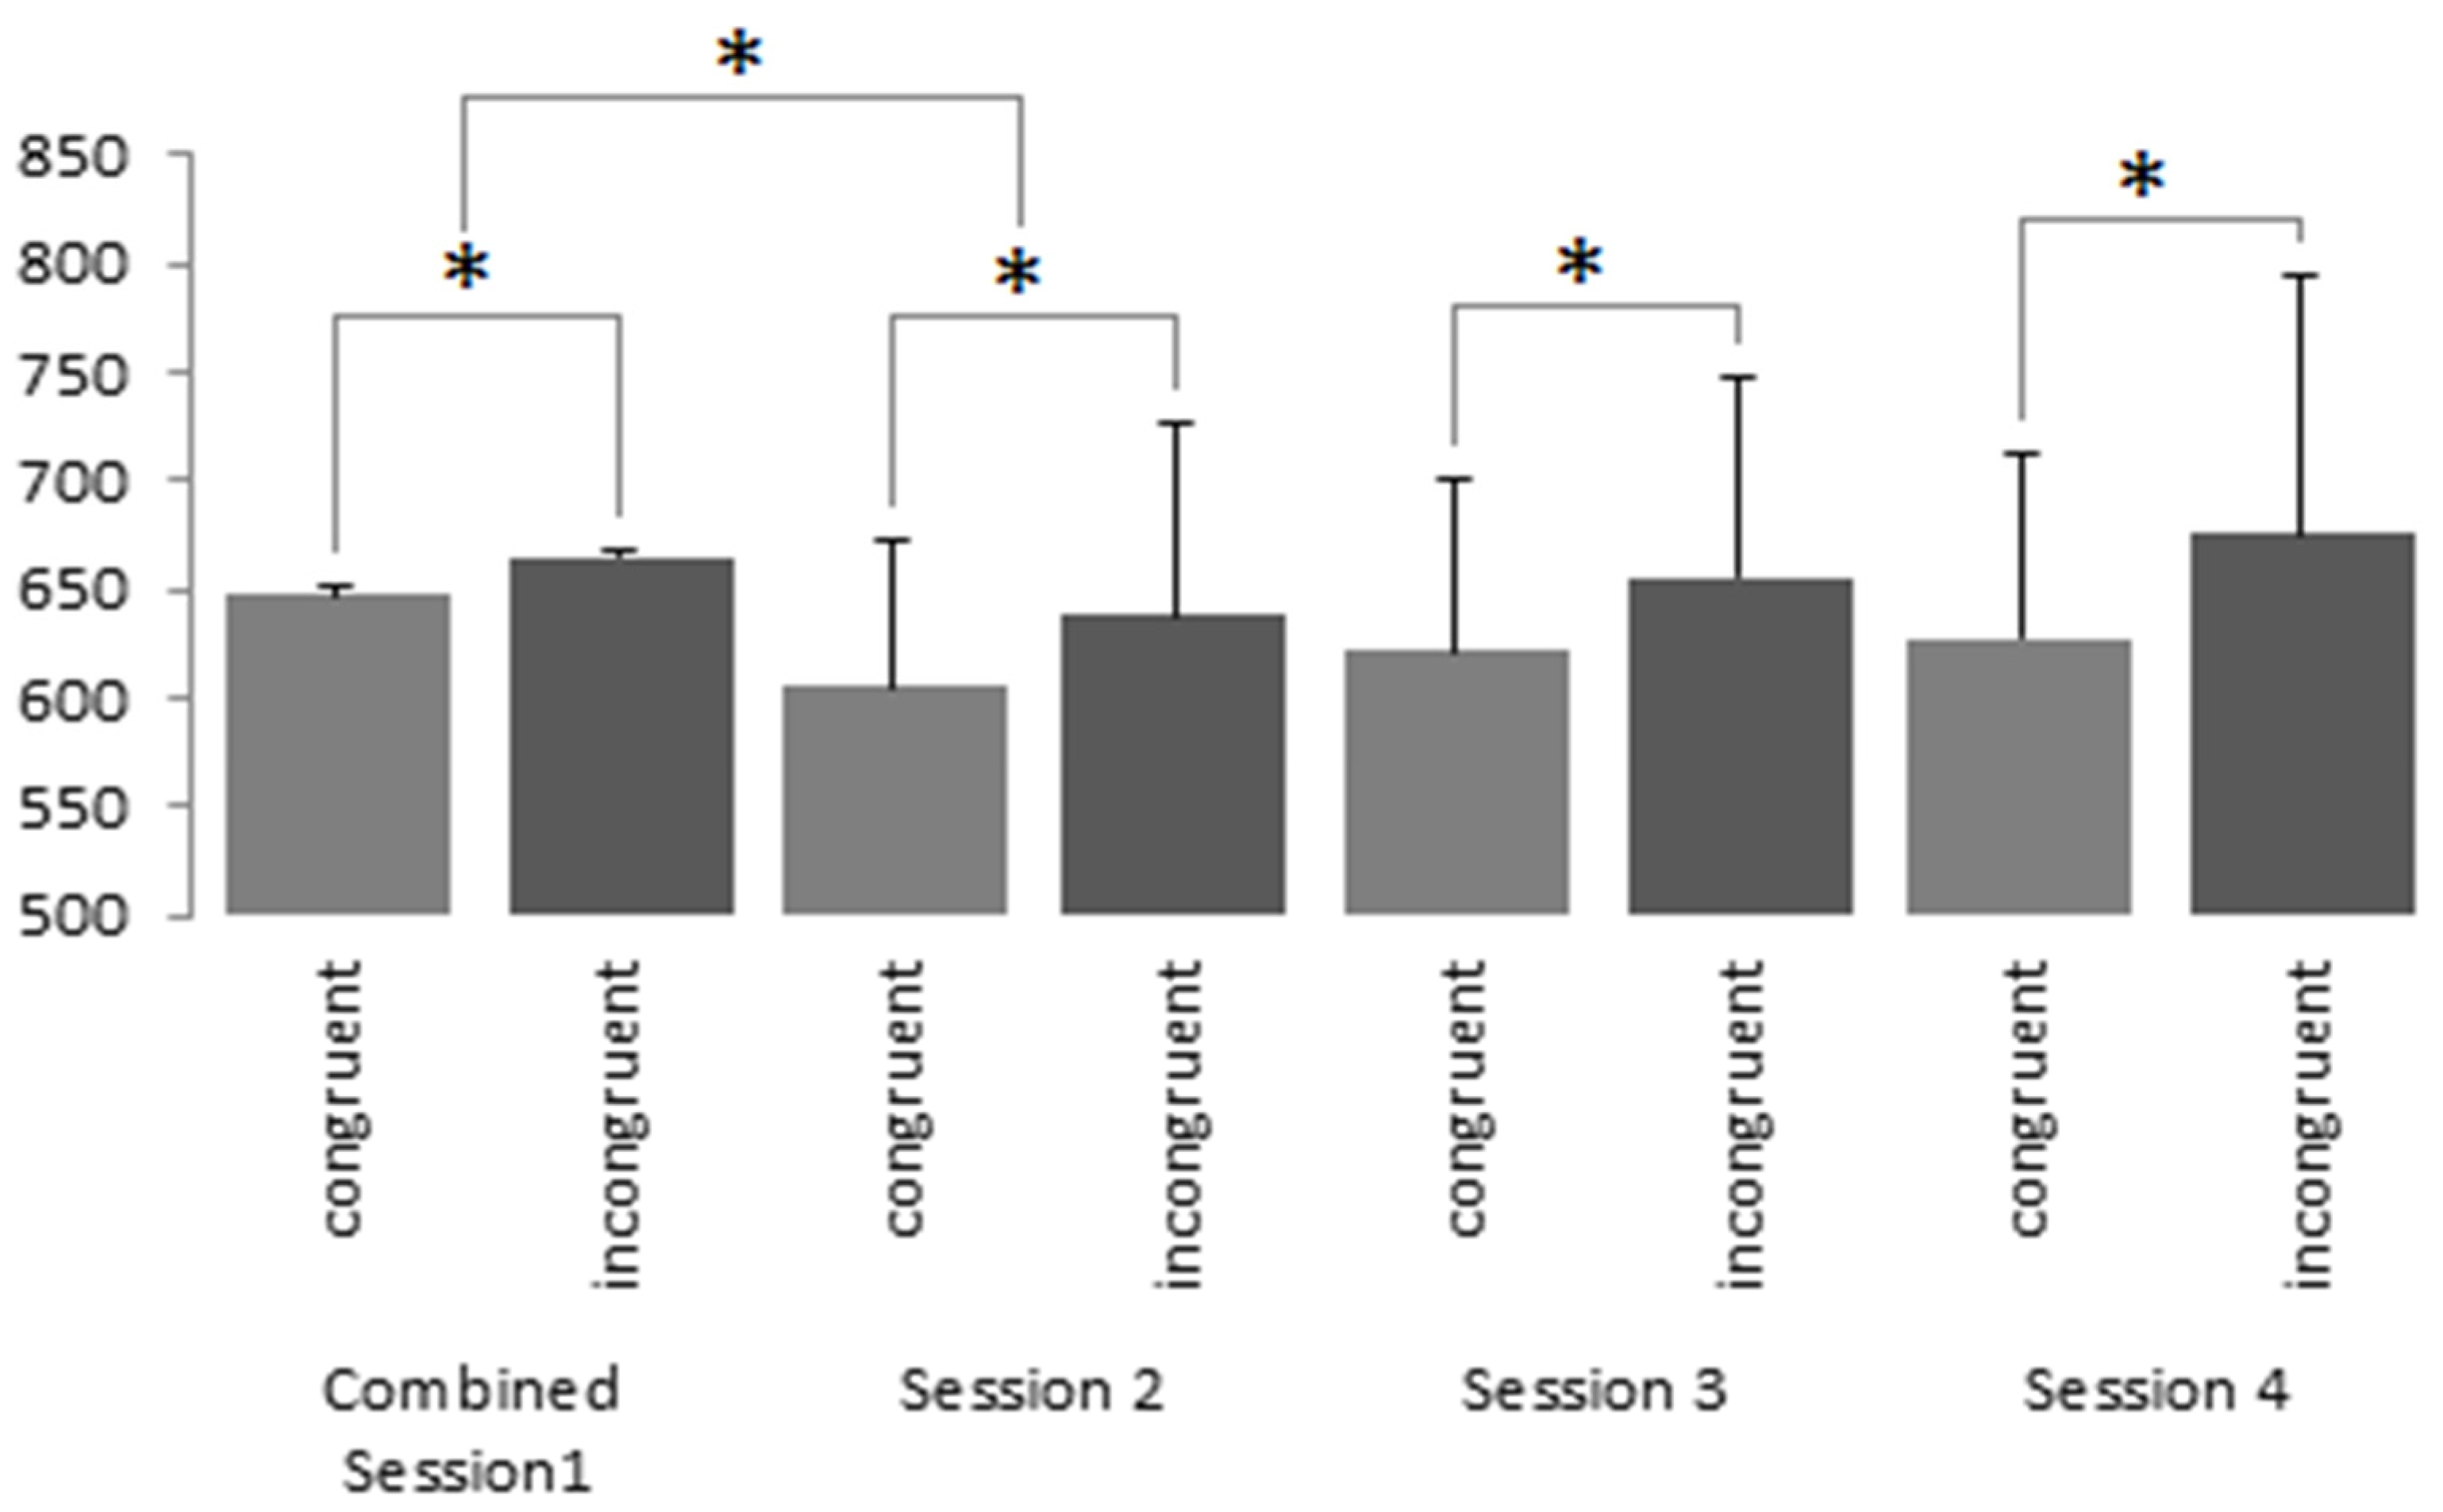
3.2. IAT
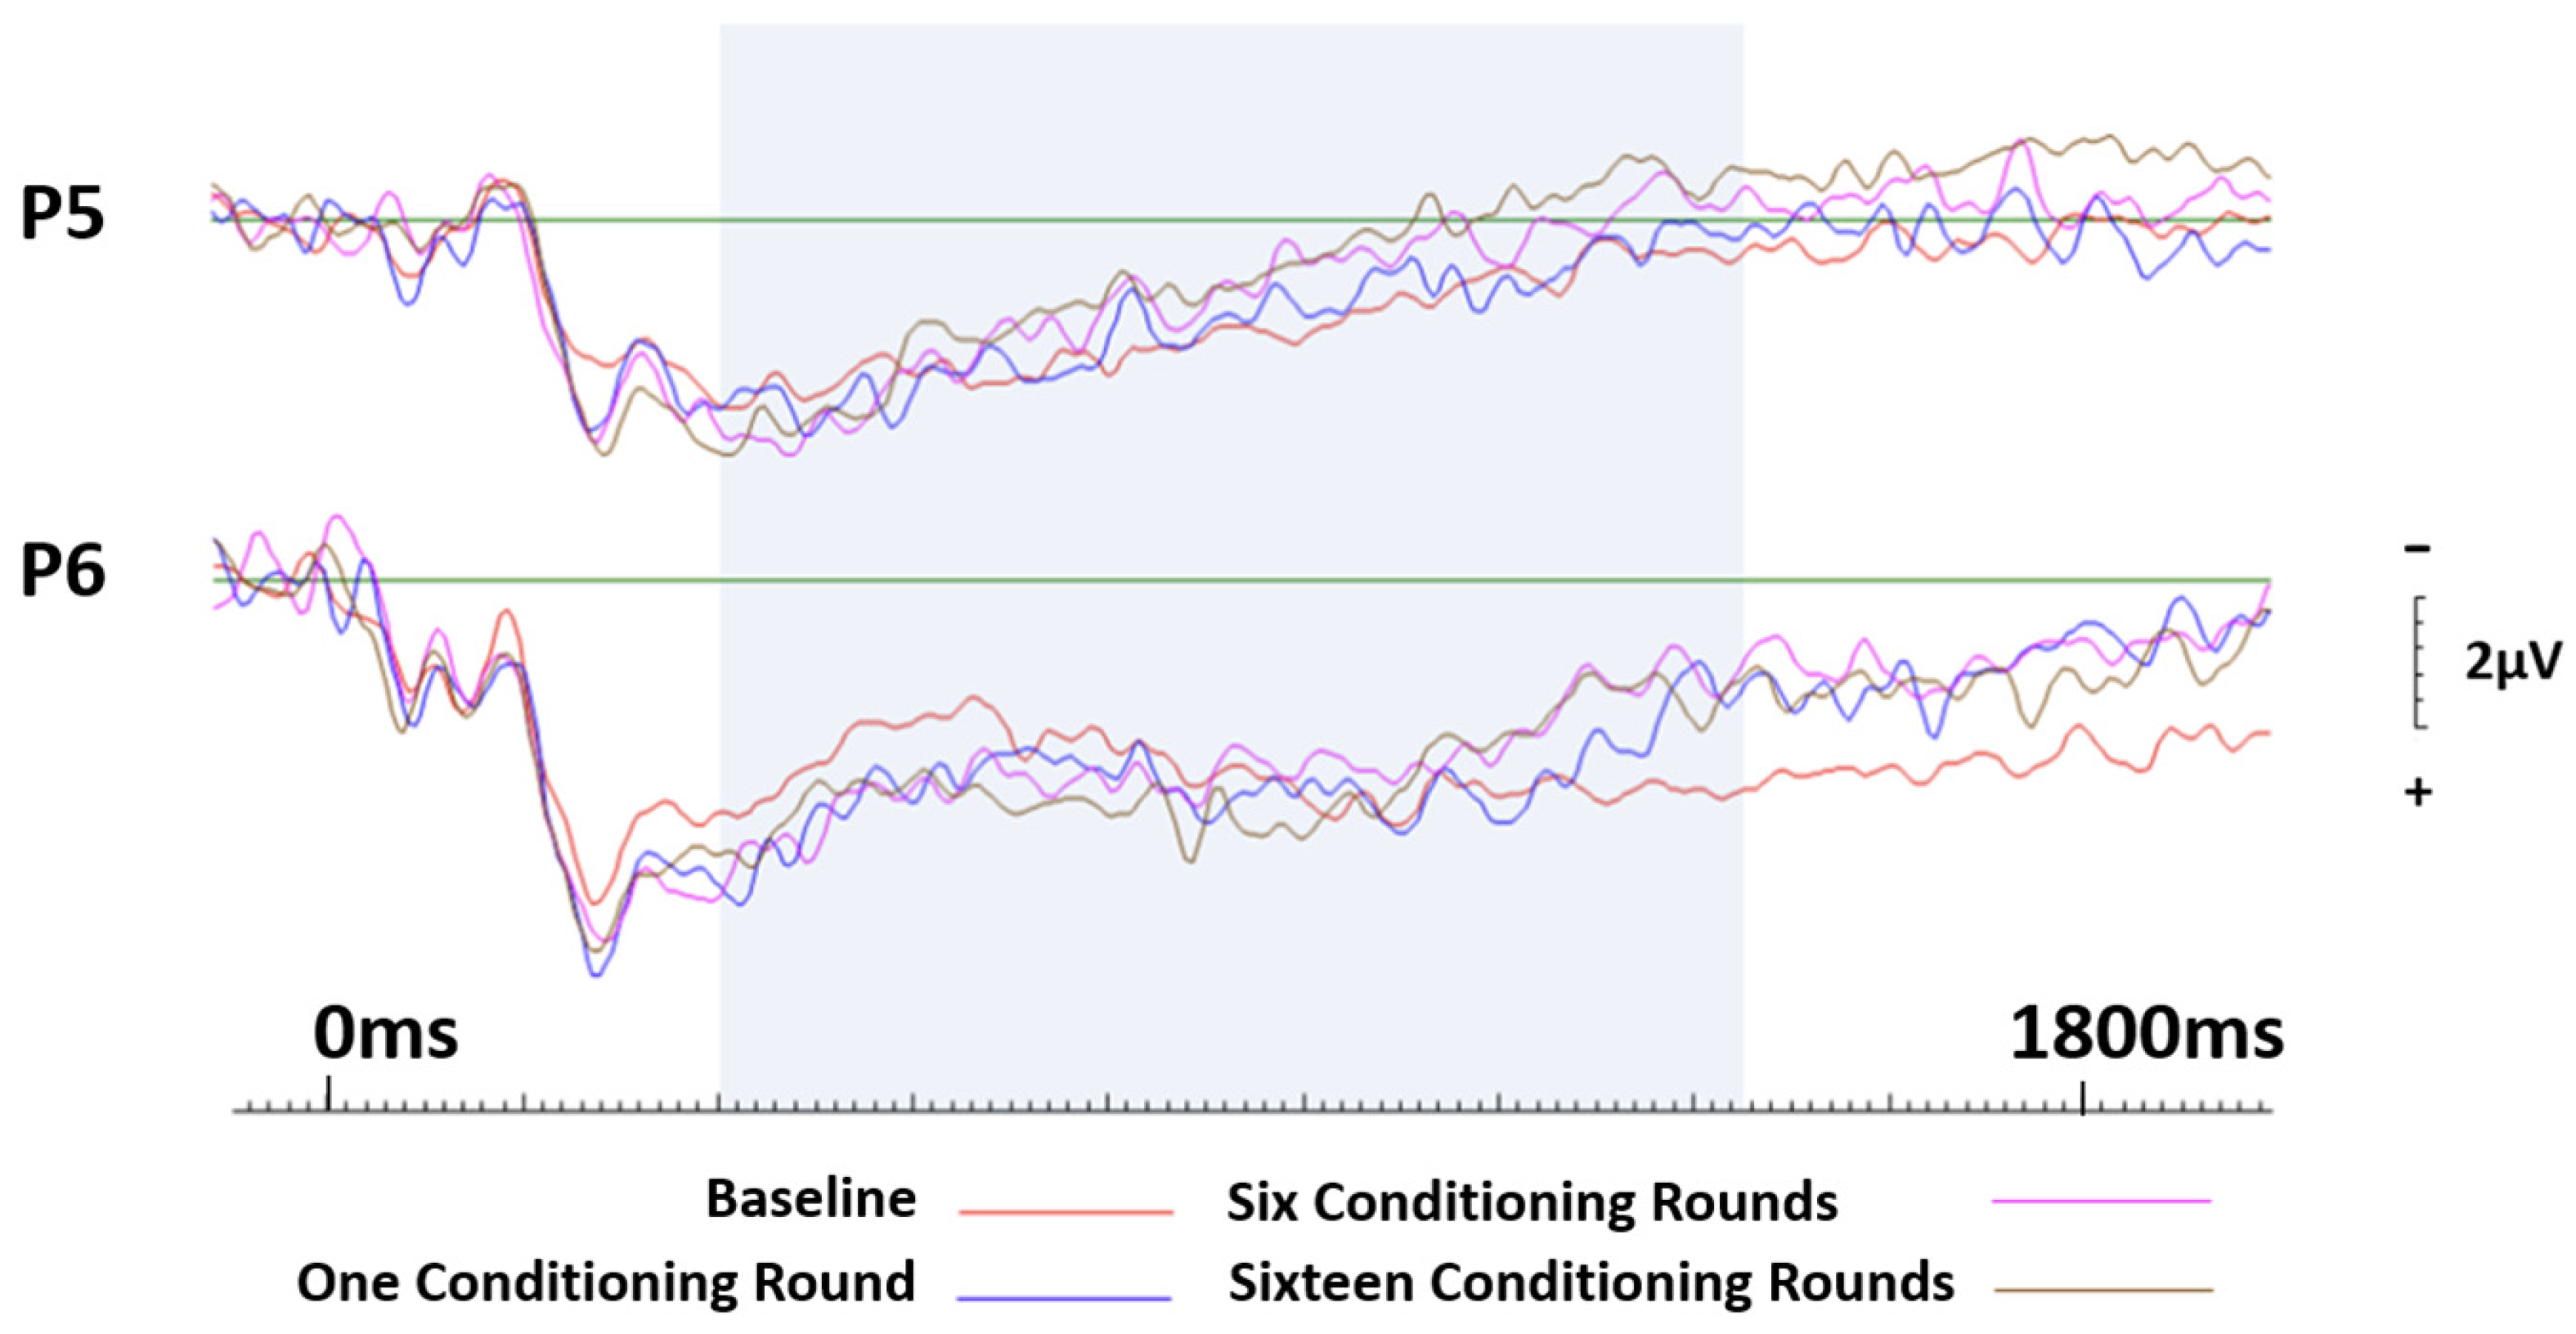
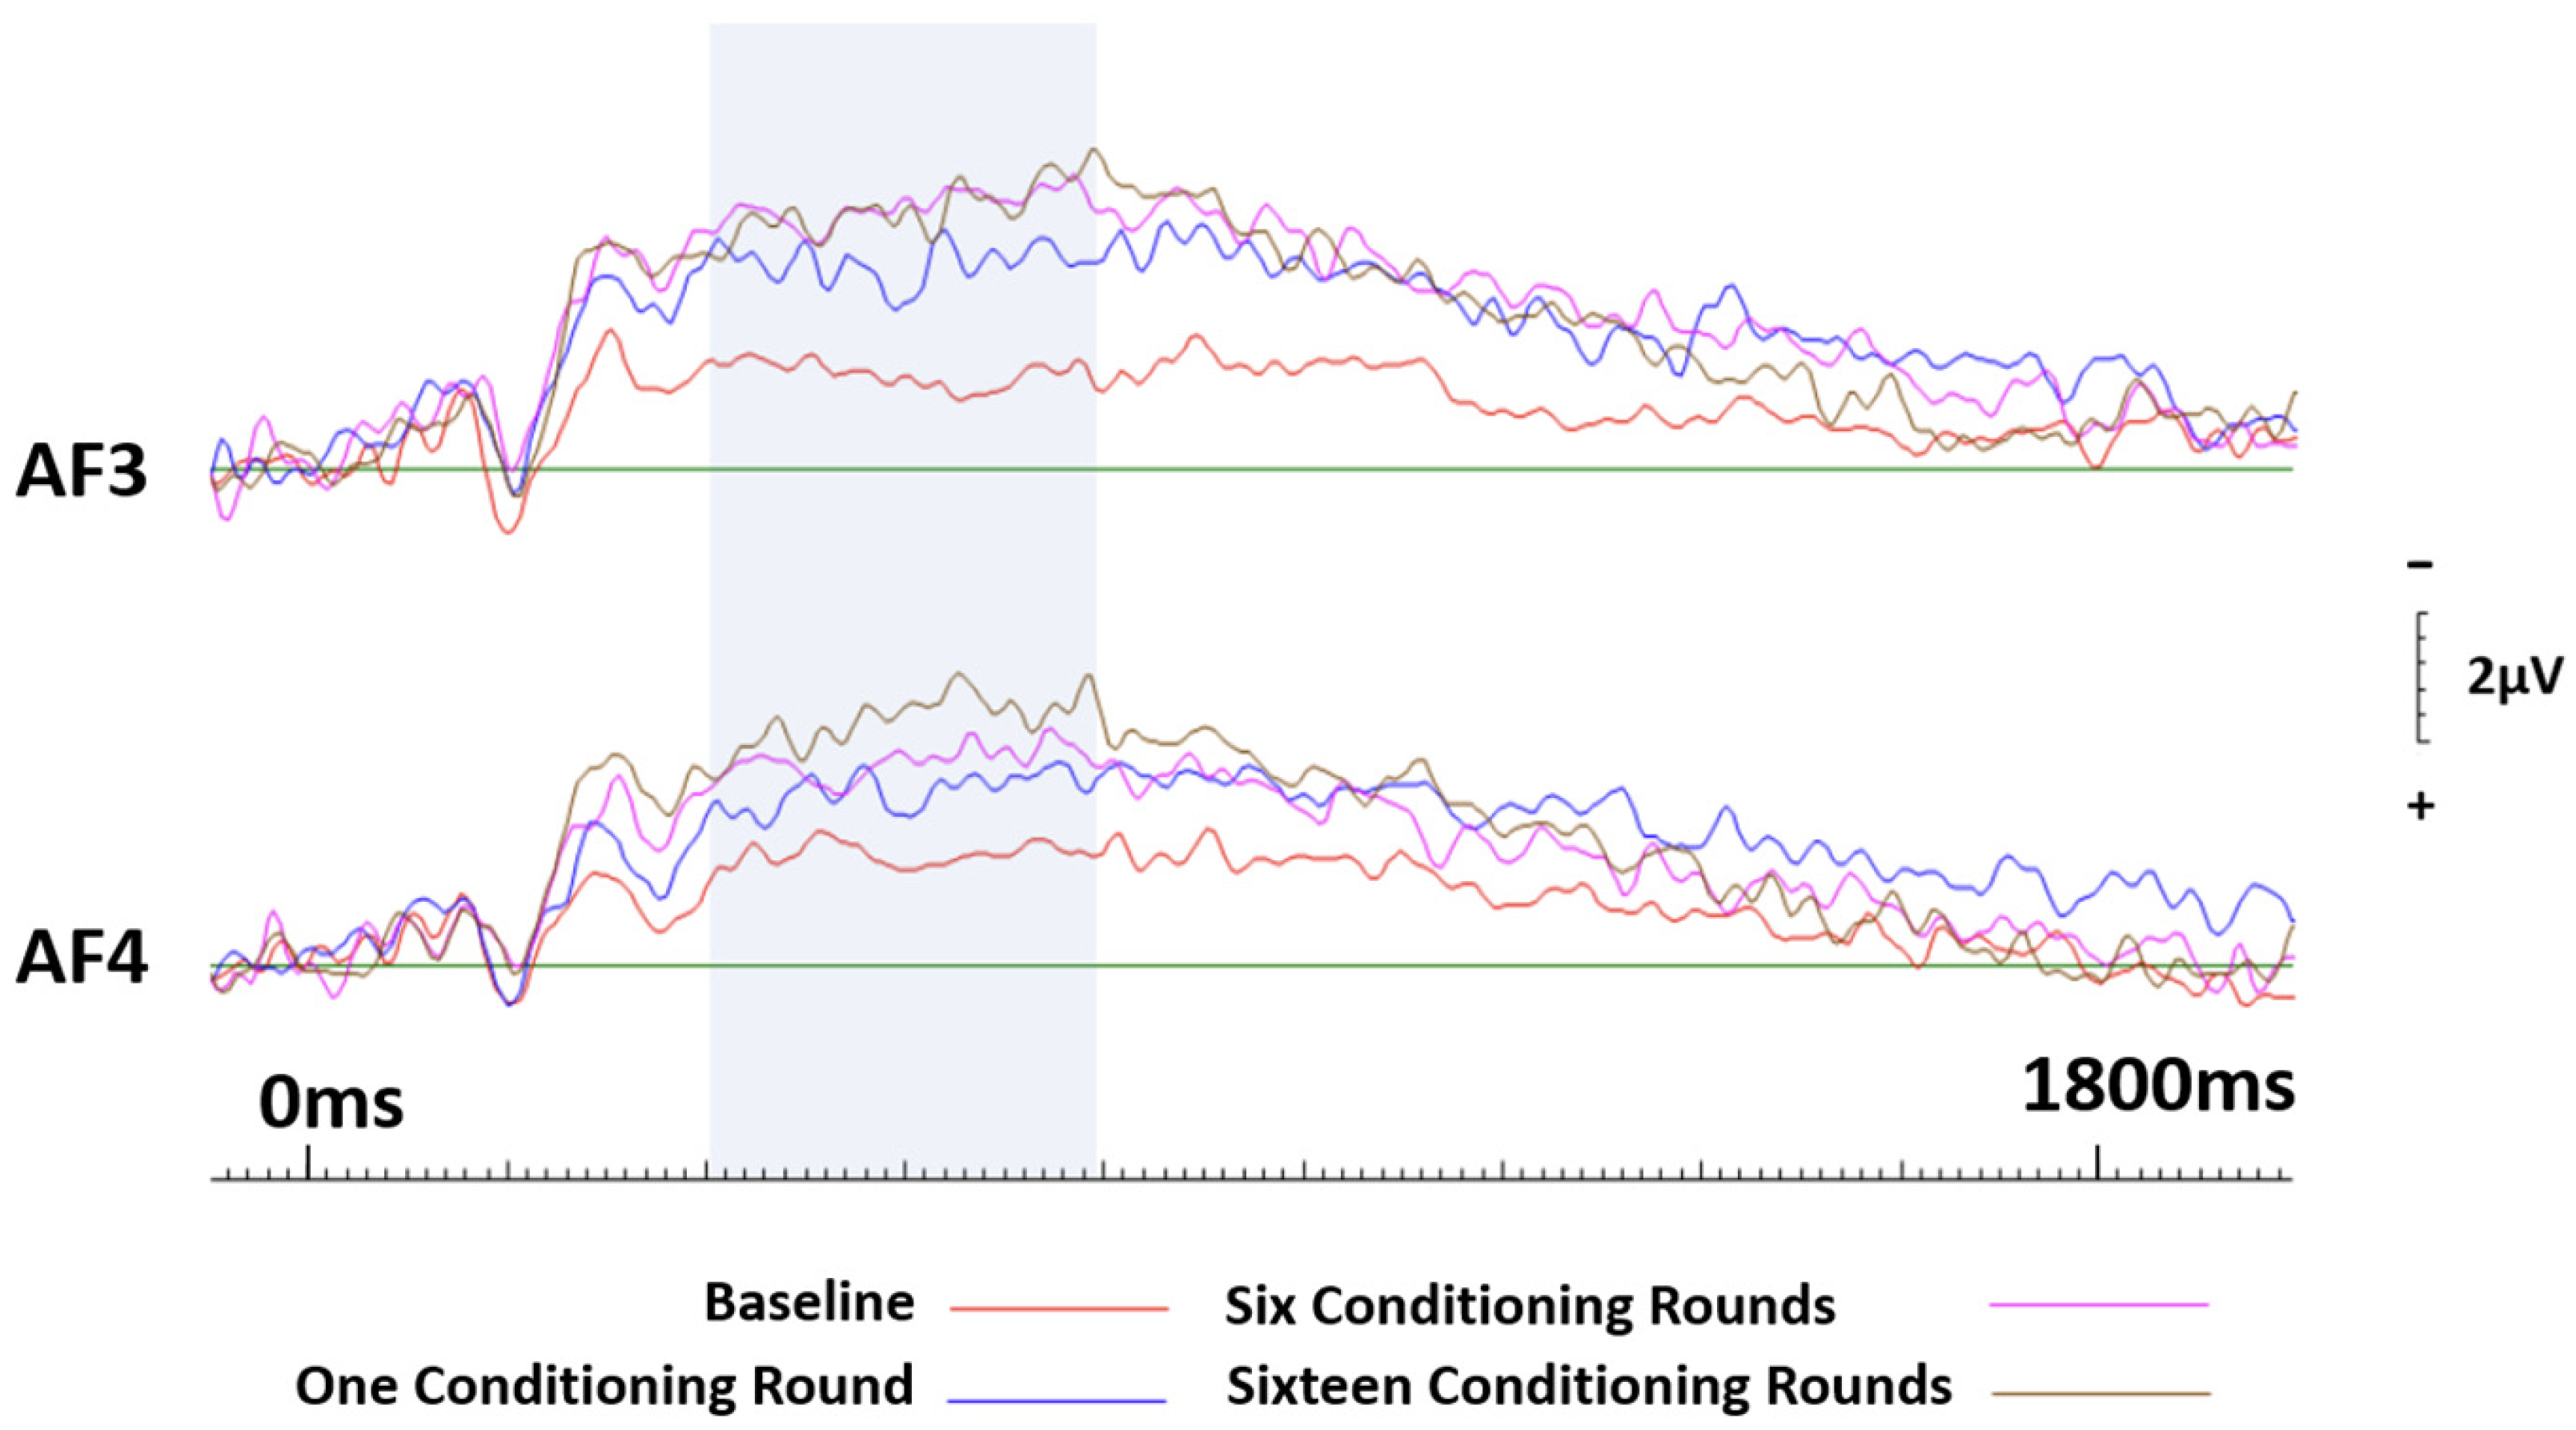
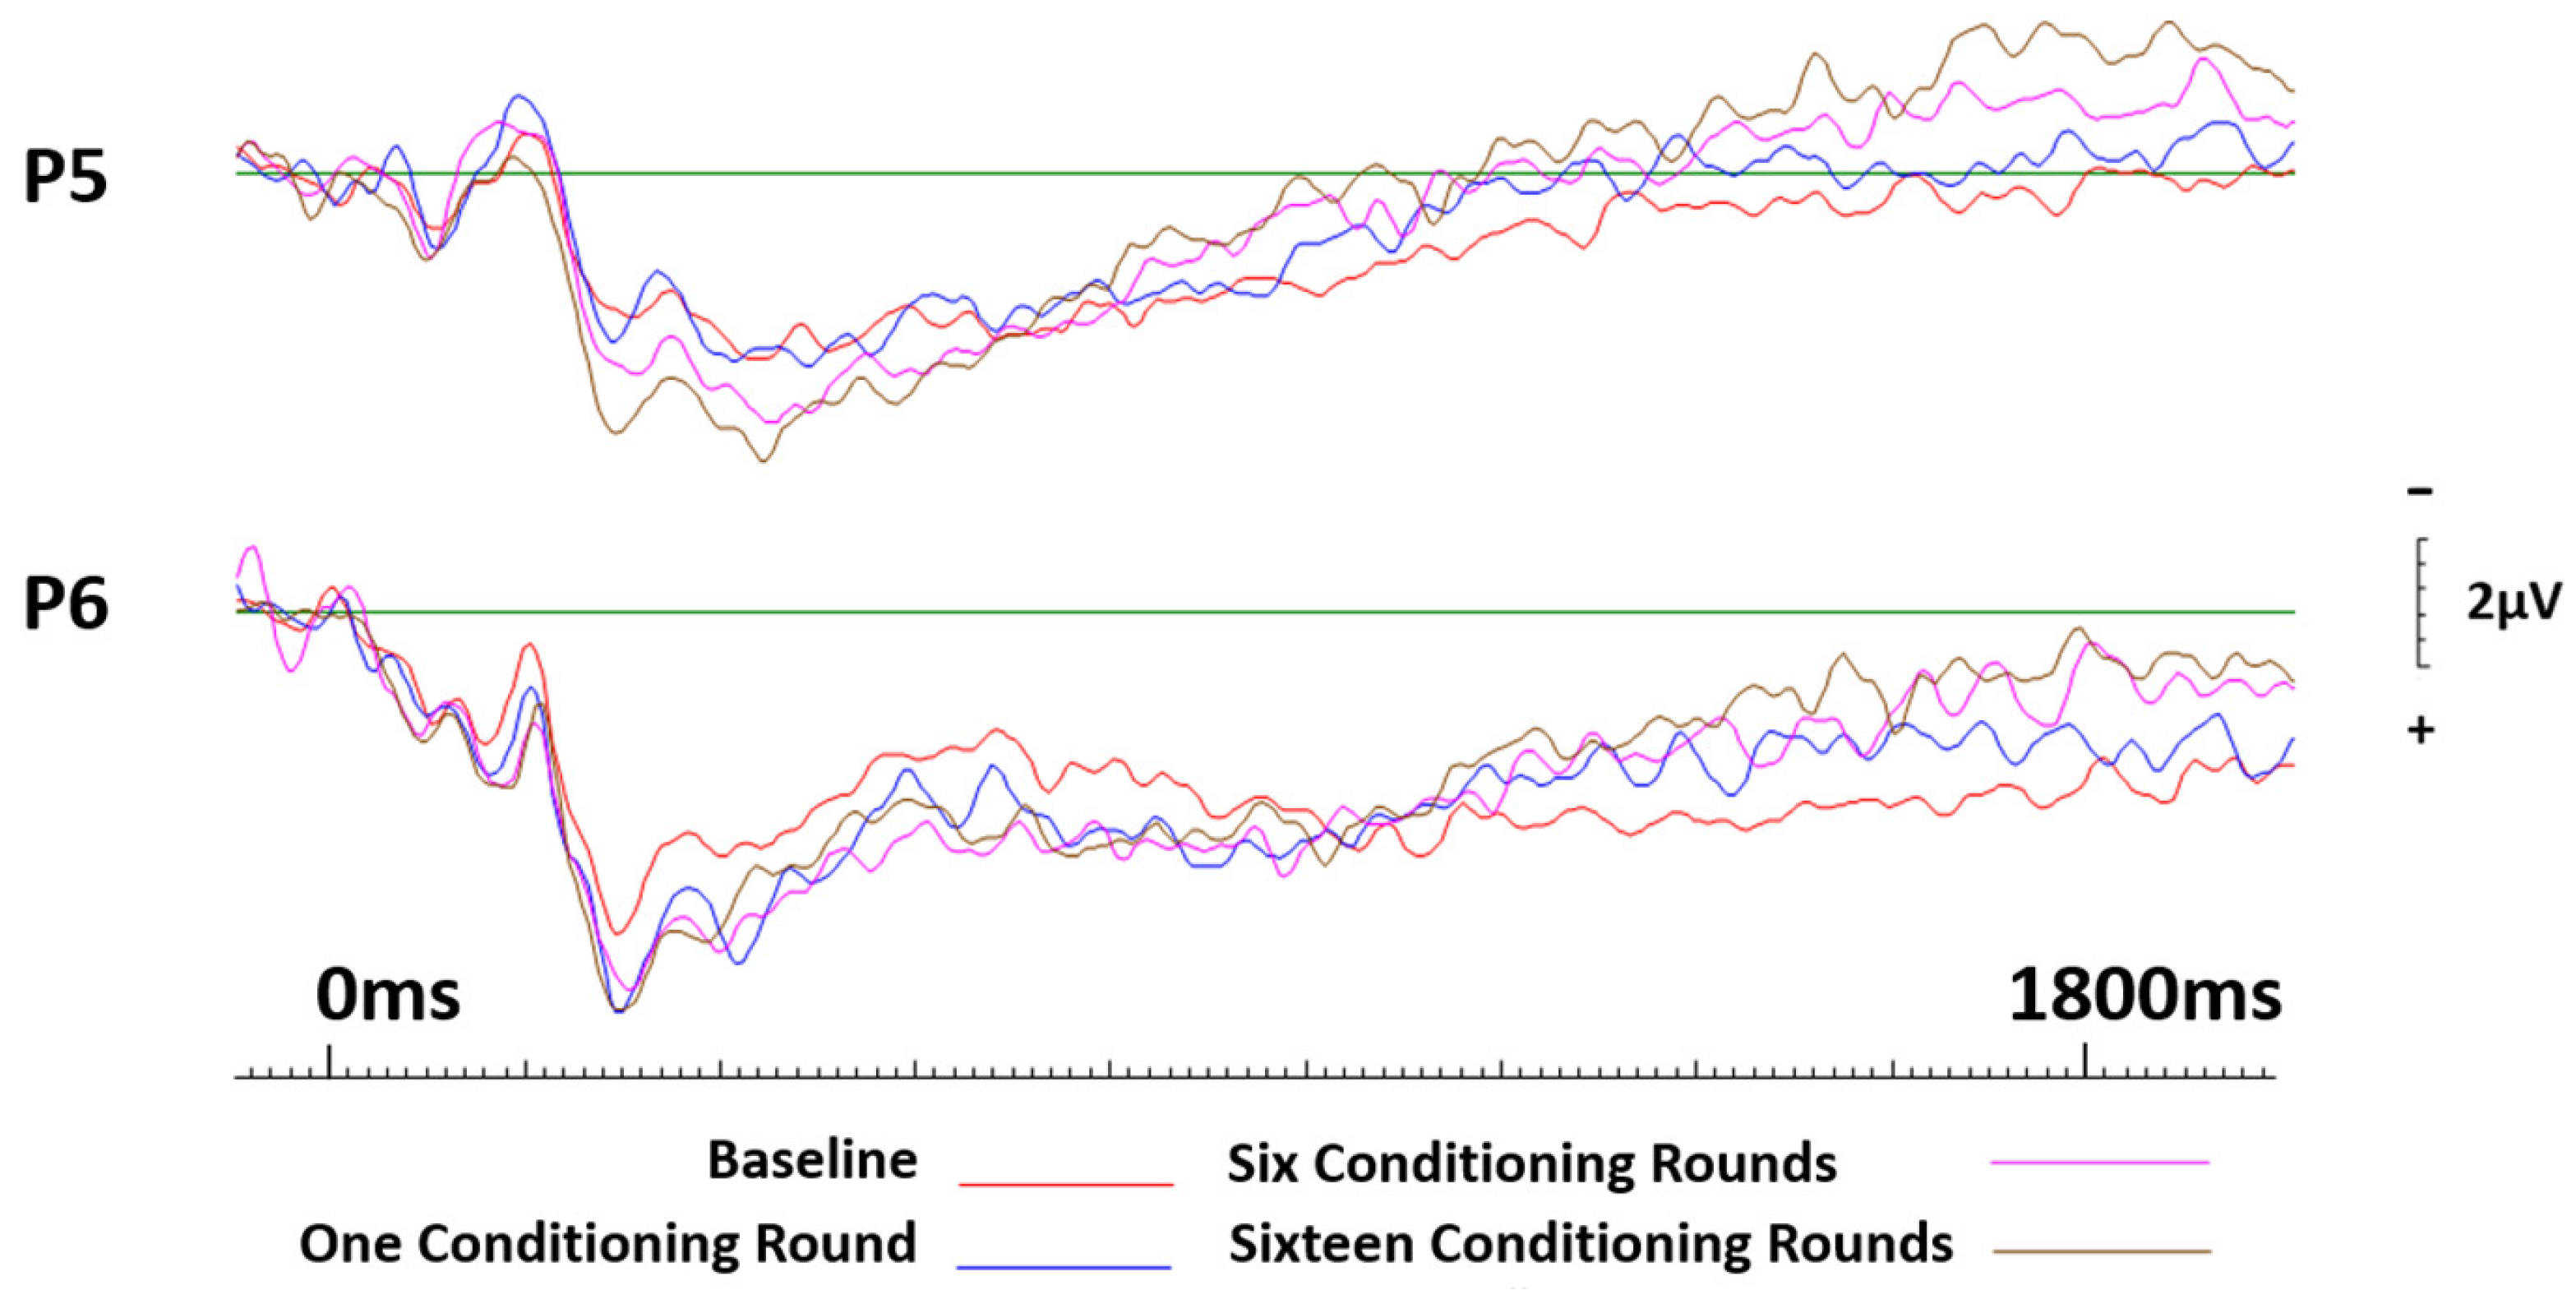
3.3. Event-Related Potentials
3.3.1. Brands Conditioned Negatively
3.3.2. Brands Conditioned Positively
3.3.3. Filler Brands
4. Discussion
4.1. Self Report and the IAT
4.2. Event-Related Potentials
4.3. Conclusions
Author Contributions
Funding
Institutional Review Board Statement
Informed Consent Statement
Data Availability Statement
Acknowledgments
Conflicts of Interest
References
- Gawronski, B.; Bodenhausen, G.V. Associative and propositional processes in evaluation: An integrative review of implicit and explicit attitude change. Psychol. Bull. 2006, 132, 692–731. [Google Scholar] [CrossRef] [PubMed]
- Ravaja, N.; Somervuori, O.; Salminen, M. Predicting purchase decision: The role of hemispheric asymmetry over the frontal cortex. J. Neurosci. Psychol. Econ. 2013, 6, 1–13. [Google Scholar] [CrossRef]
- Stammerjohan, C.; Wood, C.M.; Chang, Y.; Thorson, E. An empirical investigation of the interaction between publicity, advertising, and previous brand attitudes and knowledge. J. Advert. 2005, 34, 55–67. [Google Scholar] [CrossRef]
- Shimp, T.A.; Stuart, E.W.; Engle, R.W. A Program of Classical Conditioning Experiments Testing Variations in the Conditioned Stimulus and Context. J. Consum. Res. 1991, 18, 1–12. [Google Scholar] [CrossRef]
- Cacioppo, J.T.; Marshall-Goodell, B.S.; Tassinary, L.G.; Petty, R.E. Rudimentary determinants of attitudes: Classical conditioning is more effective when prior knowledge about the attitude stimulus is low than high. J. Exp. Soc. Psychol. 1992, 28, 207–233. [Google Scholar] [CrossRef]
- Kellaris, J.J.; Cox, A.D. The Effects of Background Music in Advertising: A Reassessment. J. Consum. Res. 1989, 16, 113–118. [Google Scholar] [CrossRef]
- Babiloni, F. Consumer Nueroscience: A New Area of Study for Biomedical Engineers. IEEE Pulse 2012, 3, 21–23. [Google Scholar] [CrossRef]
- Greenwald, A.G.; Banaji, M.R. Implicit social cognition: Attitudes, self-esteem, and stereotypes. Psychol. Rev. 1995, 102, 4–27. [Google Scholar] [CrossRef]
- Walla, P.; Brenner, G.; Koller, M. Objective Measures of Emotion Related to Brand Attitude: A New Way to Quantify Emotion-Related Aspects Relevant to Marketing. PLoS ONE 2011, 6, e26782. [Google Scholar] [CrossRef]
- Cunningham, W.A.; Raye, C.L.; Johnson, M.K. Implicit and Explicit Evaluation: fMRI Correlates of Valence, Emotional Intensity, and Control in the Processing of Attitudes. J. Cogn. Neurosci. 2004, 16, 1717–1729. [Google Scholar] [CrossRef]
- Devine, P.G. Stereotypes and prejudice: Their automatic and controlled components. J. Pers. Soc. Psychol. 1989, 56, 5–18. [Google Scholar] [CrossRef]
- Petty, R.E.; Tormala, Z.L.; Briñol, P.; Jarvis, W.B.G. Implicit ambivalence from attitude change: An exploration of the PAST model. J. Pers. Soc. Psychol. 2006, 90, 21–41. [Google Scholar] [CrossRef] [PubMed]
- Gawronski, B.; Bodenhausen, G.V. Self-insight from a dual-process perspective. In Handbook of Self-Knowledge; Vazire, S., Wilson, T.D., Eds.; Guilford Press: New York, NY, USA, 2012; pp. 22–38. [Google Scholar]
- Greenwald, A.G.; McGhee, D.E.; Schwartz, J.L.K. Measuring individual differences in implicit cognition: The implicit association test. J. Pers. Soc. Psychol. 1998, 74, 1464–1480. [Google Scholar] [CrossRef]
- Banaji, M.R.; Greenwald, A.G. Implicit gender stereotyping in judgments of fame. J. Pers. Soc. Psychol. 1995, 68, 181–198. [Google Scholar] [CrossRef] [PubMed]
- Banaji, M.R.; Hardin, C.D. Automatic Stereotyping. Psychol. Sci. 1996, 7, 136–141. [Google Scholar] [CrossRef]
- De Houwer, J. Using the Implicit Association Test does not rule out an impact of conscious propositional knowledge on evaluative conditioning. Learn. Motiv. 2006, 37, 176–187. [Google Scholar] [CrossRef]
- De Houwer, J.; Beckers, T.; Moors, A. Novel attitudes can be faked on the Implicit Association Test. J. Exp. Soc. Psychol. 2007, 43, 972–978. [Google Scholar] [CrossRef]
- Fiedler, K.; Messner, C.; Bluemke, M. Unresolved problems with the “I”, the “A”, and the “T”: A logical and psychometric critique of the Implicit Association Test (IAT). Eur. Rev. Soc. Psychol. 2006, 17, 74–147. [Google Scholar] [CrossRef]
- Hofmann, W.; Gawronski, B.; Gschwendner, T.; Le, H.; Schmitt, M. A Meta-Analysis on the Correlation between the Implicit Association Test and Explicit Self-Report Measures. Pers. Soc. Psychol. Bull. 2005, 31, 1369–1385. [Google Scholar] [CrossRef]
- Wang, Y.J.; Minor, M.S. Validity, reliability, and applicability of psychophysiological techniques in marketing research. Psychol. Mark. 2008, 25, 197–232. [Google Scholar] [CrossRef]
- Davidson, R.J.; Schwartz, G.E.; Saron, C.; Bennett, J.; Goleman, D.J. Frontal versus parietal EEG asymmetry during positive and negative affect. Psychophysiology 1979, 16, 202–203. [Google Scholar]
- Bosshard, S.; Koller, M.; Walla, P. Can Evaluative Conditioning Change Well-Established Attitudes towards Popular Brands? Your Brain Says Yes Even though Your Mouth Says No. Brain Sci. 2019, 9, 106. [Google Scholar] [CrossRef] [PubMed]
- Walla, P.; Endl, W.; Lindinger, G.; Deecke, L.; Lang, W. Implicit memory within a word recognition task: An event-related potential study in human subjects. Neurosci. Lett. 1999, 269, 129–132. [Google Scholar] [CrossRef] [PubMed]
- Rugg, M.D.; Mark, R.E.; Walla, P.; Schloerscheidt, A.M.; Birch, C.S.; Allan, K. Dissociation of the neural correlates of implicit and explicit memory. Nature 1998, 392, 595–598. [Google Scholar] [CrossRef]
- Ohme, R.; Matukin, M.; Pacula-Lesniak, B. Biometric Measures for Interactive Advertising Research. J. Interact. Advert. 2011, 11, 60–72. [Google Scholar] [CrossRef]
- Handy, T.C.; Smilek, D.; Geiger, L.; Liu, C.; Schooler, J.W. ERP Evidence for Rapid Hedonic Evaluation of Logos. J. Cogn. Neurosci. 2010, 22, 124–138. [Google Scholar] [CrossRef] [PubMed]
- Moran, T.P.; Jendrusina, A.A.; Moser, J.S. The psychometric properties of the late positive potential during emotion processing and regulation. Brain Res. 2013, 1516, 66–75. [Google Scholar] [CrossRef] [PubMed]
- Crites, S.L.; Cacioppo, J.T.; Crites, J.S.L. Electrocortical Differentiation of Evaluative and Nonevaluative Categorizations. Psychol. Sci. 1996, 7, 318–321. [Google Scholar] [CrossRef]
- Croft, R.; Barry, R. Removal of ocular artifact from the EEG: A review. Neurophysiol. Clin. 2000, 30, 5–19. [Google Scholar] [CrossRef]
- Hayes, A.F. SPSS procedures for approximate randomization tests. Behav. Res. Methods Instrum. Comput. 1998, 30, 536–543. [Google Scholar] [CrossRef]
- Maris, E.; Oostenveld, R. Nonparametric statistical testing of EEG- and MEG-data. J. Neurosci. Methods 2007, 164, 177–190. [Google Scholar] [CrossRef]
- Brown, C.; Randolph, A.; Burkhalter, J.N. The Story of Taste: Using EEGs and Self-Reports to Understand Consumer Choice. Kennesaw J. Undergrad. Res. 2012, 2, 5. [Google Scholar] [CrossRef]
- Davidson, R.J. Anterior cerebral asymmetry and the nature of emotion. Brain Cogn. 1992, 20, 125–151. [Google Scholar] [CrossRef] [PubMed]
- Gable, P.A.; Harmon-Jones, E. Does arousal per se account for the influence of appetitive stimuli on attentional scope and the late positive potential? Psychophysiology 2013, 50, 344–350. [Google Scholar] [CrossRef] [PubMed]
- Peterson, C.K.; Shackman, A.J.; Harmon-Jones, E. The role of asymmetrical frontal cortical activity in aggression. Psychophysiology 2007, 45, 86–92. [Google Scholar] [CrossRef]
- Gorn, G.J. The Effects of Music in Advertising on Choice Behavior: A Classical Conditioning Approach. J. Mark. 1982, 46, 94. [Google Scholar] [CrossRef]
- Gresham, L.G.; Shimp, T.A. Attitude toward the Advertisement and Brand Attitudes: A Classical Conditioning Perspective. J. Advert. 1985, 14, 10–49. [Google Scholar] [CrossRef]
- Stuart, E.W.; Shimp, T.A.; Engle, R.W. Classical Conditioning of Consumer Attitudes: Four Experiments in an Advertising Context. J. Consum. Res. 1987, 14, 334–349. [Google Scholar] [CrossRef]
- Walla, P.; Panksepp, J. Neuroimaging Helps to Clarify Brain Affective Processing without Necessarily Clarifying Emotions. In Novel Frontiers of Advanced Neuroimaging; Fountas, K.N., Ed.; InTech: Vienna, Austria, 2013; ISBN 978-953-51-0923-5. [Google Scholar] [CrossRef]
- Zaltman, G. How Customers Think: Essential Insights into the Mind of the Market; Harvard Business School Press: Boston, MA, USA, 2003. [Google Scholar]
- Kahneman, D. Thinking, Fast and Slow; Farrar, Straus and Giroux: New York, NY, USA, 2011. [Google Scholar]
- Gregg, A.P.; Seibt, B.; Banaji, M.R. Easier done than undone: Asymmetry in the malleability of implicit preferences. J. Pers. Soc. Psychol. 2006, 90, 1–20. [Google Scholar] [CrossRef]
- MacInnis, D.J.; Moorman, C.; Jaworski, B.J. Enhancing and Measuring Consumers’ Motivation, Opportunity, and Ability to Process Brand Information from Ads. J. Mark. 1991, 55, 32. [Google Scholar] [CrossRef]
- Youn, S.; Sun, T.; Wells, W.D.; Zhao, X. Commercial Liking and Memory: Moderating Effects of Product Categories. J. Advert. Res. 2001, 41, 7–13. [Google Scholar] [CrossRef]
- Percy, L.; Hansen, F.; Randrup, R. How to Measure Brand Emotion. Admap 2004, 39, 32–34. [Google Scholar]
- Cacioppo, J.T.; Crites, S.L.; Berntson, G.G.; Coles, M.G.H.; Crites, J.S.L. If Attitudes Affect How Stimuli Are Processed, Should They Not Affect the Event-Related Brain Potential? Psychol. Sci. 1993, 4, 108–112. [Google Scholar] [CrossRef]
- Brewer, M.B. The Psychology of Prejudice: Ingroup Love and Outgroup Hate? J. Soc. Issues 1999, 55, 429–444. [Google Scholar] [CrossRef]
- Heller, W. Neuropsychological mechanisms of individual differences in emotion, personality, and arousal. Neuropsychology 1993, 7, 476–489. [Google Scholar] [CrossRef]
- Domjam, M.; Burkhard, B. The Principles of Learning and Behavior; Brooks/Cole: Monterery, CA, USA, 1985. [Google Scholar]
- Smith, P.W.; Feinberg, R.A.; Burns, D.J. An Examination of Classical Conditioning Principles in an Ecologically Valid Advertising Context. J. Mark. Theory Pract. 1998, 6, 63–72. [Google Scholar] [CrossRef]
- Nguyen, V.H.; Claus, E. Good news, bad news, consumer sentiment and consumption behavior. J. Econ. Psychol. 2013, 39, 426–438. [Google Scholar] [CrossRef]
- Baumeister, R.F.; Bratslavsky, E.; Finkenauer, C.; Vohs, K.D. Bad is stronger than good. Rev. Gen. Psychol. 2001, 5, 323–370. [Google Scholar] [CrossRef]
- Rozin, P.; Royzman, E.B. Negativity Bias, Negativity Dominance, and Contagion. Pers. Soc. Psychol. Rev. 2001, 5, 296–320. [Google Scholar] [CrossRef]
- Skowronski, J.J.; Carlston, D.E. Negativity and extremity biases in impression formation: A review of explanations. Psychol. Bull. 1989, 105, 131–142. [Google Scholar] [CrossRef]
- Akhtar, S.; Faff, R.; Oliver, B.; Subrahmanyam, A. The power of bad: The negativity bias in Australian consumer sentiment announcements on stock returns. J. Bank. Financ. 2011, 35, 1239–1249. [Google Scholar] [CrossRef]
- Moosmayer, D.C. Negativity bias in consumer price response to ethical information. Bus. Ethic-Eur. Rev. 2012, 21, 198–208. [Google Scholar] [CrossRef]
- Chen, Z.; Lurie, N.H. Temporal Contiguity and Negativity Bias in the Impact of Online Word of Mouth. J. Mark. Res. 2013, 50, 463–476. [Google Scholar] [CrossRef]
- Zhang, J.Q.; Craciun, G.; Shin, D. When does electronic word-of-mouth matter? A study of consumer product reviews. J. Bus. Res. 2010, 63, 1336–1341. [Google Scholar] [CrossRef]
- Bosch, I.v.D.; van Delft, J.; de Wijk, R.; de Graaf, C.; Boesveldt, S. Learning to (dis)like: The effect of evaluative conditioning with tastes and faces on odor valence assessed by implicit and explicit measurements. Physiol. Behav. 2015, 151, 478–484. [Google Scholar] [CrossRef] [PubMed]
- Moran, T.; Nudler, Y.; Bar-Anan, Y. Evaluative Conditioning: Past, Present, and Future. Annu. Rev. Psychol. 2023, 74, 245–269. [Google Scholar] [CrossRef] [PubMed]


| Demographics | n | Age | Education | Handedness | Vision |
|---|---|---|---|---|---|
| 20 | 22.81 | University | Right- | Corrected | |
| (10 female) | (SD = 2.37) | students | handed | or normal |
Disclaimer/Publisher’s Note: The statements, opinions and data contained in all publications are solely those of the individual author(s) and contributor(s) and not of MDPI and/or the editor(s). MDPI and/or the editor(s) disclaim responsibility for any injury to people or property resulting from any ideas, methods, instructions or products referred to in the content. |
© 2023 by the authors. Licensee MDPI, Basel, Switzerland. This article is an open access article distributed under the terms and conditions of the Creative Commons Attribution (CC BY) license (https://creativecommons.org/licenses/by/4.0/).
Share and Cite
Bosshard, S.; Walla, P. Sonic Influence on Initially Neutral Brands: Using EEG to Unveil the Secrets of Audio Evaluative Conditioning. Brain Sci. 2023, 13, 1393. https://doi.org/10.3390/brainsci13101393
Bosshard S, Walla P. Sonic Influence on Initially Neutral Brands: Using EEG to Unveil the Secrets of Audio Evaluative Conditioning. Brain Sciences. 2023; 13(10):1393. https://doi.org/10.3390/brainsci13101393
Chicago/Turabian StyleBosshard, Shannon, and Peter Walla. 2023. "Sonic Influence on Initially Neutral Brands: Using EEG to Unveil the Secrets of Audio Evaluative Conditioning" Brain Sciences 13, no. 10: 1393. https://doi.org/10.3390/brainsci13101393
APA StyleBosshard, S., & Walla, P. (2023). Sonic Influence on Initially Neutral Brands: Using EEG to Unveil the Secrets of Audio Evaluative Conditioning. Brain Sciences, 13(10), 1393. https://doi.org/10.3390/brainsci13101393