Article

Olive- and Coconut-Oil-Enriched Diets Decreased Secondary Bile Acids and Regulated Metabolic and Transcriptomic Markers of Brain Injury in the Frontal Cortexes of NAFLD Pigs

1
Department of Biological Sciences, California Polytechnic State University, 1 Grand Ave., San Luis Obispo, CA 93407, USA
2
Center for Applications in Biotechnology, California Polytechnic State University, 1 Grand Ave., San Luis Obispo, CA 93407, USA
3
Department of Biomedical Engineering, California Polytechnic State University, 1 Grand Ave., San Luis Obispo, CA 93407, USA
4
Department of Chemistry and Biochemistry, California Polytechnic State University, 1 Grand Ave., San Luis Obispo, CA 93407, USA
5
College of Agriculture, Food and Environmental Sciences, California Polytechnic State University, 1 Grand Ave., San Luis Obispo, CA 93407, USA
6
Cal Poly Metabolomics Service Center, California Polytechnic State University, 1 Grand Ave., San Luis Obispo, CA 93407, USA
7
Department of Statistics, California Polytechnic State University, 1 Grand Ave., San Luis Obispo, CA 93407, USA
8
USDA-ARS Arkansas Children’s Nutrition Center, 1120 Marshall St. SLOT 512-20B, Little Rock, AR 72202, USA
9
Department of Pediatrics, University of Arkansas for Medical Sciences, 4301 W Markham St., Little Rock, AR 72205, USA
10
Department of Animal Science, California Polytechnic State University, 1 Grand Ave., San Luis Obispo, CA 93407, USA
11
Department of Food Science and Nutrition, California Polytechnic State University, 1 Grand Ave., San Luis Obispo, CA 93407, USA
*
Author to whom correspondence should be addressed.
Brain Sci. 2022, 12(9), 1193; https://doi.org/10.3390/brainsci12091193
Submission received: 10 August 2022 / Revised: 29 August 2022 / Accepted: 2 September 2022 / Published: 4 September 2022

Abstract

:
The objective of this study was to investigate the effect of dietary fatty acid (FA) saturation and carbon chain length on brain bile acid (BA) metabolism and neuronal number in a pig model of pediatric NAFLD. Thirty 20-day-old Iberian pigs, pair-housed in pens, were randomly assigned to receive one of three hypercaloric diets for 10 weeks: (1) lard-enriched (LAR; n = 5 pens), (2) olive-oil-enriched (OLI, n = 5), and (3) coconut-oil-enriched (COC; n = 5). Pig behavior and activity were analyzed throughout the study. All animals were euthanized on week 10 and frontal cortex (FC) samples were collected for immunohistochemistry, metabolomic, and transcriptomic analyses. Data were analyzed by multivariate and univariate statistics. No differences were observed in relative brain weight, neuronal number, or cognitive functioning between diets. Pig activity and FC levels of neuroprotective secondary BAs and betaine decreased in the COC and OLI groups compared with LAR, and paralleled the severity of NAFLD. In addition, OLI-fed pigs showed downregulation of genes involved in neurotransmission, synaptic transmission, and nervous tissue development. Similarly, COC-fed pigs showed upregulation of neurogenesis and myelin repair genes, which caused the accumulation of medium-chain acylcarnitines in brain tissue. In conclusion, our results indicate that secondary BA levels in the FCs of NAFLD pigs are affected by dietary FA composition and are associated with metabolic and transcriptomic markers of brain injury. Dietary interventions that aim to replace saturated FAs by medium-chain or monounsaturated FAs in high-fat hypercaloric diets may have a negative effect on brain health in NAFLD patients.

1. Introduction

Non-alcoholic fatty liver disease (NAFLD) is the most common chronic liver disease globally, affecting approximately 25% of the general population [1]. NAFLD is defined as a spectrum of diseases related to hepatic fat deposition, ranging from steatosis to non-alcoholic steatohepatitis (NASH), which can progress to fibrosis, cirrhosis, and hepatocellular carcinoma [2]. In addition to liver injury, NAFLD has been associated with neurological pathologies, including decreased cognitive function [1,3,4,5], and smaller brain volume [4,6]. Further evidence of a link between liver and brain disorders is shown by the development of neuropathological hallmarks of Alzheimer’s disease (AD) in rodent and pig models of NASH [7,8,9] and the presence of altered hepatic markers in patients with AD [10,11]. A liver–brain axis of neurodegeneration has been established through common risk factors, such as obesity, type 2 diabetes, and high-fat diets [7,12,13,14]. In this regard, recent clinical and translational studies have shown an effect of dietary interventions on brain function, such as changes in cognitive processes, memory and learning, motor function, neuroinflammation, synaptic transmission, and neurotransmitter pathways [15,16,17,18]. In addition, emerging evidence suggests that bile acids (BAs) and BA signaling may also play a role in liver-induced brain injury, due to their potential neurotoxic effects [19,20,21] and their ability to regulate neuroinflammation and brain cholesterol metabolism [22,23,24]. Increased levels of circulating BAs have been correlated with the progression of NAFLD in adults, children, and pigs [25,26,27], and have been found to promote hepatic stellate cell proliferation, inflammation, and apoptosis in vitro [28,29]. Similarly, elevated BAs in the brain or serum have been associated with neurodegeneration in mouse models of liver failure [19,22,24,30] and in patients with AD [10,31,32] and hepatic encephalopathy [33]. A connection between BAs and neurodegeneration is further supported by clinical interventions targeting BA signaling, in which BA receptor agonists have been shown to alleviate various aspects of AD and Parkinson’s disease (PD) [34,35,36].
Bile acids are of key importance in the absorption of dietary fats by solubilizing cholesterol and lipids in the small intestine. Reciprocally, BA metabolism can be regulated by fat intake, with fat-free diets decreasing and fat feeding increasing BA synthesis in mice [37,38]. Consumption of a diet high in milk fats also promoted hepatic taurine conjugation of BAs in mice, which in turn caused gut dysbiosis and inflammation [39]. A role of dietary fats in BA kinetics has also been observed in humans, with unsaturated fats increasing total BA output [40,41], and both low- and high-fat diets decreasing primary BA synthesis [42]. Surprisingly, there are no studies assessing the impact of dietary fats on brain BA metabolism in NAFLD patients. We have previously established a pig model of pediatric NAFLD, where Iberian pigs fed a “Western diet” for 10 weeks showed accumulation of primary BAs in the frontal cortex (FC), astrogliosis and neuronal loss, and decreased cognitive function compared with healthy controls [9,25]. In addition, high-fat diets enriched with lard (high in saturated fatty acids (SFAs) and long-chain fatty acids (LCFAs)), olive oil (high in monounsaturated fatty acids (MUFAs) and LCFAs), and coconut oil (high in SFAs and medium-chain fatty acids (MCFAs)) differentially regulated hepatic BA metabolism and NAFLD progression in juvenile pigs [43]. The objective of the present study was to investigate the effects of variations in the degree of saturation and carbon chain length of dietary fats on brain BA metabolism and neuronal number in a pig model of pediatric NAFLD. Our results show that secondary BA levels in the FC of NAFLD pigs are affected by dietary fatty acid (FA) composition and associated with metabolic and transcriptomic markers of brain injury.

2. Material and Methods

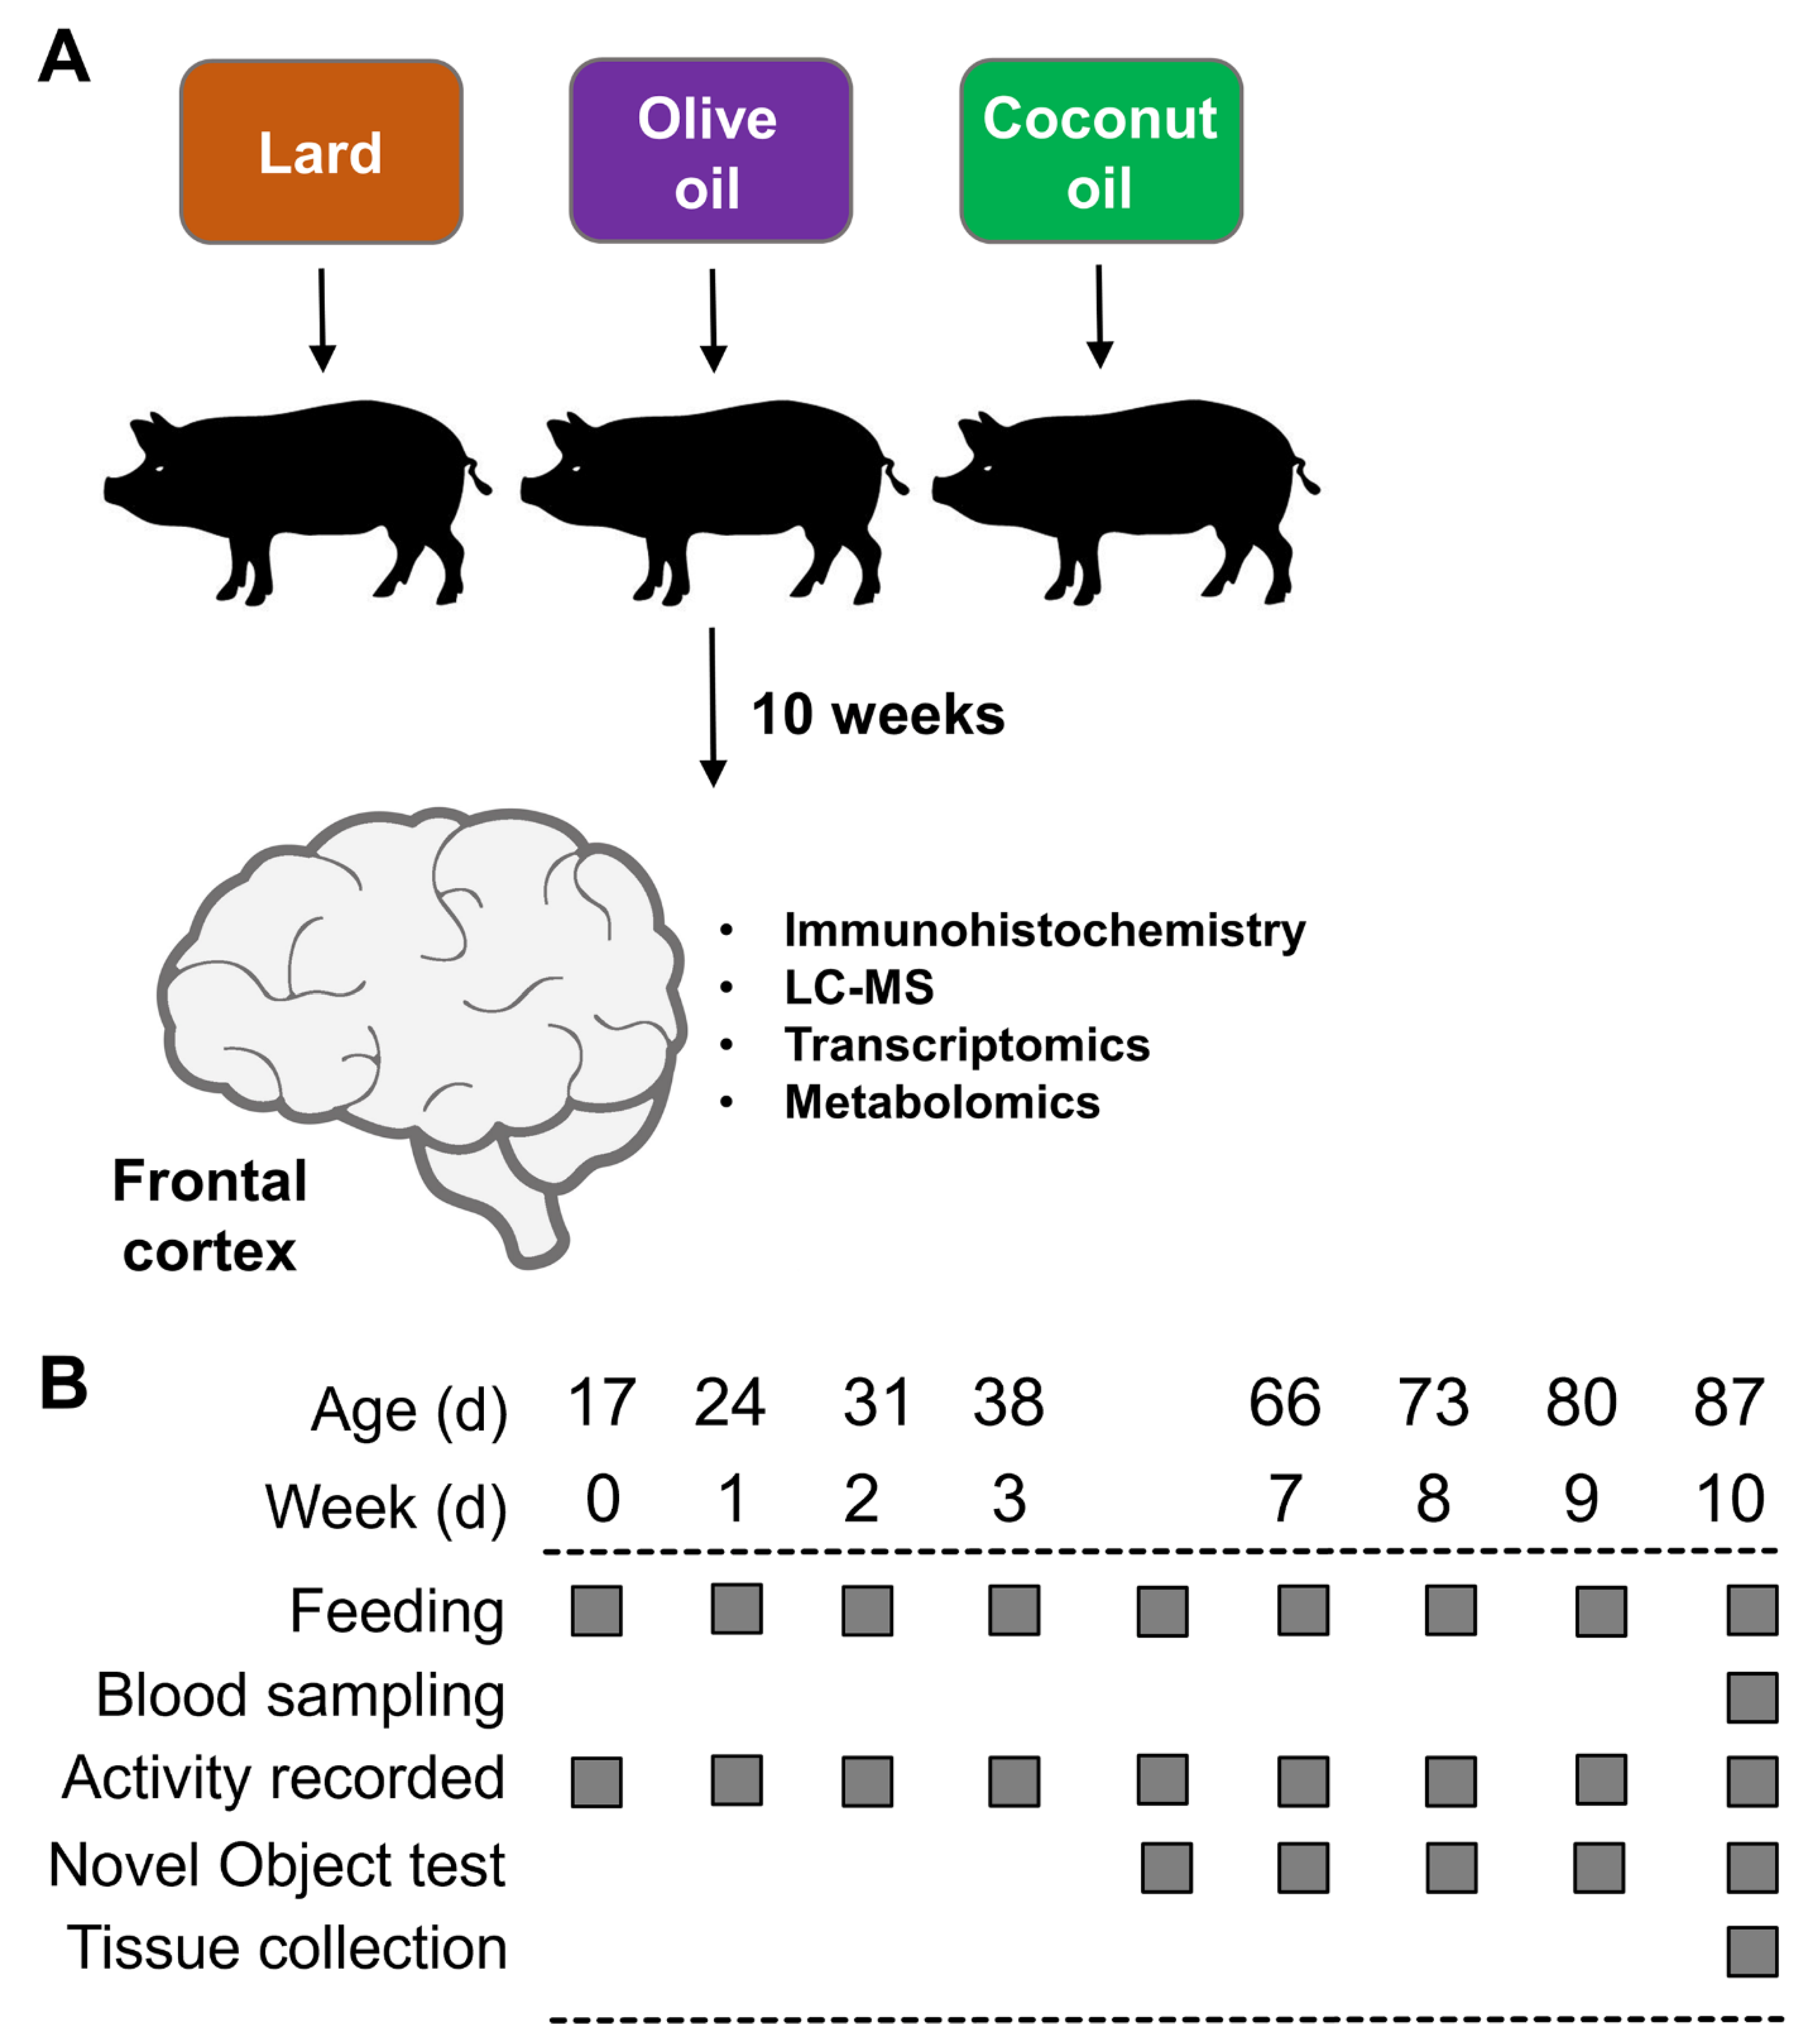
2.1. Animals and Experimental Design

All experiments were carried out with the approval of the Institutional Animal Care and Use Committee of California State University (#1611), following guidelines issued by the National Research Council Guide for the Care and Use of Laboratory Animals. The diets, as well as the characterization of the NAFLD phenotype in the Iberian pigs used in this study, have been described in detail in a recent report [43]. An outline of the study is presented in Figure 1A,B.
Briefly, 19 male (M) and 11 female (F) Iberian pigs from the Iberian Pig Research Colony at California Polytechnic State University were weaned at 17 ± 3 d of age and 4.21 ± 1.21 kg body weight and immediately moved into a temperature-controlled room with a 12 h light–dark cycle. After 3 d of acclimatization, pigs were housed in pairs in 1.5 × 1.5 m pens balanced for sex and BW, and randomly allocated to receive 1 of 3 high-fructose, high-fat liquid diets for 10 consecutive weeks: (1) lard (LAR; n = 5 pens, 6M/4F): 21.6 g fructose, 17.2 g fat (8.8% lard, 0.5% soybean oil; w/v), and 303.0 kcal metabolizable energy (ME) kg·BW−1·d−1; (2) olive oil (OLI; n = 5 pens, 7M/3F): 21.6 g fructose, 16.7 g fat (3.7% lard, 4.8% olive oil, 0.5% soybean oil), and 302.6 kcal·kg·BW−1·d−1; and (3) coconut oil (COC; n = pens, 6M/4F): 21.6 g fructose, 17.0 g fat (3.7% lard, 5% coconut oil, 0.5% soybean oil), and 302.6 kcal·kg·BW−1·d−1. Complete information about ingredient composition and daily nutrient intake can be found in Manjarin et al., 2022 [43]. The study was conducted in 2 consecutive replicates: replicate 1 consisted of 18 pigs allocated to 9 pens (2 pigs per pen, 3 pens per diet), whereas replicate 2 consisted of 12 pigs allocated to 6 pens (2 pigs per pen, 2 pens per diet).
Animals were fed 45 mL per kg·BW−1 at 6 h intervals to match the physiological volume of milk consumed by pigs during lactation. Diets were formulated to meet all the nutrient requirements of growing Iberian pigs according to the NRC [44] and FEDNA [45], and exceeded the NRC recommended daily energy intake by approximately 60%. Protein, carbohydrate, cholesterol, vitamin, and mineral intake were the same across diets. Fat content in LAR was provided by hydrogenated lard, whereas in the OLI diet 58% of lard was replaced isocalorically by extra virgin olive oil to increase MUFA content. Similarly, 58% of lard was substituted isocalorically by hydrogenated coconut oil in the COC diet to increase MCFAs.
The first day on which the experimental diets were fed was considered as d 0 of the study. Animals were euthanized on d 70 using an intramuscular injection of tiletamine and zolazepam (4 mg·kg−1; Zoetis, Parsippany, NJ, USA), followed by an intracardiac injection of pentobarbital sodium (0.4 mL·kg−1; Schering-Plough, Union, NJ, USA). Brains were removed immediately after euthanasia and weighed. Tissue from the frontal cortex (FC) was washed for 5 s in ice-cold saline solution and frozen in liquid nitrogen or placed in plastic cassettes (Tissue-Tek Cryomold Standard; Sakura, Torrance, CA, USA), covered with optimum cutting temperature compound (cat. no. 4583, Tissue-Tek O.C.T; Sakura, Torrance, CA, USA), and slowly frozen in liquid-nitrogen-cooled 2-methylbutane (cat. no. M0167, TCI, Portland, OR, USA). Tissues were kept at −80 °C until processing. We analyzed the FC tissues based on our previous work, in which juvenile Iberian pigs fed a high-fat, high-fructose diet for 10 weeks developed neuronal loss and astrogliosis in the FC when compared with healthy control animals [9]. In addition, neurons in the FC are among the first to deteriorate in AD patients [46].

2.2. Pen Activity and Novel Object Recognition Test

Physical activity in the pen was observed and quantified in the same manner as previously described [9]. In brief, videos were recorded every 2 days between d 16 and 70 of the study from 8:30 AM to 12:30 PM using cameras mounted from the ceiling. Two independent experimenters blinded to the treatment retrospectively scored animals’ activity using Behavioral Observation Research Interactive Software (BORIS; version 7.9) [47] based on the ethogram shown in Table 1. Duration of behavior performance for and the number of pigs performing each behavior were annotated individually for each pen.
Recognition memory was assessed by the novel object recognition test conducted between d 35 and 70 of the study once a week, as previously described [48], because 5-week-old domestic pigs have been shown to remember objects for up to 6 days [49]. In brief, the test was performed 1 h after morning feeding by affixing two identical sample objects to the pen gates with zip-ties to prevent them from being removed and giving the pigs 10 min to explore the objects (sample phase). After 1 h, one sample object and a new object (of the same color but a different shape to that of the sample object) were affixed to the pen gates. Animals were given an additional 10 min to explore the objects (test phase). Two independent experimenters blinded to the treatment retrospectively scored the recorded videos using BORIS, based on the ethogram presented in Table 1. Data are presented as recognition indexes (RIs; time spent investigating novel object/time investigating both objects).

2.3. Fatty Acid Composition

Fatty acid composition was quantified by gas chromatography of the FA methyl esters using an Agilent 7890B (Agilent Technologies, Palo Alto, CA, USA) equipped with a flame ionization detector, a 7683B automatic liquid sampler (Agilent Technologies), a split/splitless injection port, and a J&W DB-23 column (Agilent Technologies), with helium used as the carrier gas, as described in our previous work [25]. Values for individual FAs were expressed as peak areas under the curve. Based on FA composition, the following indexes were calculated: saturated FAs (SFAs) = Σ [(%) 8:0 + 10:0 + 11:0 + 12:0 + 13:0 + 14:0 + 15:0 + 16:0 + 17:0 + 18:0 + 20:0 + 21:0 +22:0 +23:0 + 24:0]; unsaturated FAs (UFAs) = Σ [(%) n-3 + n-5 + n-6 + n-7 + n-9]; monounsaturated FAs (MUFAs) = Σ [(%) n-5 + n-7 + n-9]; polyunsaturated FAs (PUFAs) = Σ [(%) n-3 + n-6] [50].

2.4. Immunofluorescence Analysis

Frontal cortex samples embedded in optimum cutting temperature compound (Sakura) were processed for immunofluorescence staining against a marker for mature neurons, NeuN, as previously described [9]. Briefly, samples were cut, mounted on slides, fixed in cold acetone, washed 3× with phosphate-buffered saline (PBS), and blocked in 2% bovine serum albumin (cat. no. 0332-500G, VWR Life Science, Radnor, PA, USA) and 10% animal-free blocker (cat. no. SP-5030-250, Vector Laboratories, Burlingame, CA, USA) in PBS. Tissue sections were then incubated with a primary antibody against neuronal nuclei (cat. no. MAB377, NeuN, MilliporeSigma, Burlington, MA, USA) in blocking solution. Subsequently, tissues were washed 3× with PBS and incubated with DyLight 594 Horse Anti-Mouse IgG (H+L) (cat. No. DI-2594, Vector Laboratories, Burlingame, CA, USA) in 0.5% bovine serum albumin and 10% animal-free blocker in PBS. Following washing, coverslips were mounted with fluorescence protective medium (cat. no. H-1900, VECTASHIELD Antifade Mounting Medium; Vector Laboratories) and left to dry. Images were taken with a FluoView 500 Confocal Laser Scanning Microscope (Olympus; Center Valley, PA, USA) using a 40× objective by an operator blinded to the treatments. Images were then converted into a z-projection using ImageJ software [51], and the average staining intensity was quantified and reported as a percentage of total area.

2.5. Analysis of Metabolites

Primary metabolomic, biogenic amine, lipidomic, and BA assays on frontal cortex samples were performed by protein precipitation extraction with ultra-performance liquid chromatography–tandem quadrupole mass spectrometry, as previously described [25]. Fifty-sixty milligrams of the FC tissue was spiked with 20 µL of isotopically labeled surrogates (Avanti Polar Lipids, Alabaster, AL, USA; CDN Isotopes, Pointe-Claire, Quebec, QC, Canada), followed by 750 µL chilled methanol. Samples were then vortexed for 1 min and centrifuged at 12,000 rpm for 10 min at 4 °C. The supernatant was transferred to 1.5 mL high-performance liquid chromatography amber glass vials, dried by centrifugal vacuum evaporation, and reconstituted in 3:1 methanol:acetonitrile containing 100 nM of 1-cyclohexyl-ureido, 3-dodecanoic acid (MilliporeSigma). The reconstituted solution was vortexed for 1 min and filtered through a polyvinylidene fluoride membrane (Durapore PVDF, 0.1 µm; MilliporeSigma) by centrifugation at 9500 rpm for 3 min at room temperature. Analyses were conducted on a Waters UPLC Acquity I-Class (Waters, Milford, MA, USA) coupled with a 4000 QTRAP LC-MS/MS System (SCIEX, Concord, ON, Canada), using multiple reaction monitoring [52] quantified with MultiQuant Software version 3.0 (SCIEX). General metabolites were separated using a 150 × 2.0 mm Luna NH2 column (Phenomenex, Torrance, CA, USA) and detected by negative ion mode electrospray ionization [52,53]. For the aminomic assay, metabolites were separated using a 150 × 2.1 mm Atlantis HILIC column (Waters) and detected by positive ion mode electrospray ionization [52]. For the lipidomic assay, metabolites were separated using a 150 × 3.0 mm Prosphere HP C4 column (Grace Discovery Sciences, Columbia, MD, USA) and detected by positive ion mode electrospray ionization [52,54]. For BA analysis, analytical targets were separated using a 2.1 × 100 mm, 1.7 µm BEH C18 column (Waters) operated in negative mode electrospray ionization.
Metabolite intensities were normalized to those of internal standards (Cayman Chemical Company, Ann Arbor, MI, and Avanti Polar Lipids) and to sample weights to account for small variations in the starting tissues, and were expressed as peak areas under the curve. Metabolites were quantified using internal standards (Cayman Chemical Company, Ann Arbor, MI, USA; and Avanti Polar Lipids, Alabaster, AL, USA) with 6- to 8-point calibration curves. In addition, BAs were standardized to relative composition (so that sample totals were 100%).

2.6. Transcriptomic Analysis

Frontal cortex tissue from 1 pig per pen (5 LAR, 5 OLI, and 5 COC) were sent to GENEWIZ, LLC. (South Plainfield, NJ, USA) for RNA isolation, library preparation, and sequencing. Total RNA was extracted using the RNeasy Plus Mini Kit (cat. no. 74134, Qiagen, Hilden, Germany), quantified using a Qubit 2.0 Fluorometer (Life Technologies, Carlsbad, CA, USA), and assessed for integrity (RIN) using the TapeStation 4200 automated electrophoresis tool (Agilent Technologies, Palo Alto, CA, USA). The preparation of RNA libraries was performed using the NEBNext Ultra RNA Library Prep Kit for Illumina, following the manufacturer’s instructions (cat. no. E7770, NEB, Ipswich, MA, USA). Briefly, mRNA samples were poly(A)-enriched with oligo(dT) beads and heat fragmented, and first- and second-strand cDNAs were synthesized. cDNA fragments were subjected to end repair, 3′-end adenylation, ligation of universal adapters, and the addition of index barcodes. The sequencing libraries were enriched with limited-cycle PCR and validated and quantified with an Agilent TapeStation and a Qubit 2.0 Fluorometer, with additional quantification by quantitative PCR (KAPA Biosystems, Wilmington, MA, USA). RNA libraries were sequenced using a 2 × 150 bp Paired-End configuration of the Illumina HiSeq 4000 system on 2 flow cell lanes. De-multiplexing and conversion of raw sequence data into fastq files were performed using bcl2fastq 2.17 software (Illumina), with one mismatch allowed during index sequence identification.
The swine (Sus scrofa) reference genome, SSC11.1, and annotation file (GTF) were downloaded from the Ensembl FTP site (ftp://ftp.ensembl.org/pub/release-100/fasta/sus_scrofa/dna/, accessed on 17 March 2022). The sequence quality of raw paired-end reads was evaluated using FastQC software version 0.11.9 with default parameters (https://www.bioinformatics.babraham. Ac.uk/projects/fastqc/, accessed on 17 March 2022). All the samples passed the quality control by FastQC. Then, reads were aligned to the swine genome Sscrofa11.1 using STAR aligner software (-2.7.5a), with default parameters which are optimized for mammalian genomes [55]. A read-count table showing how many reads mapped to annotated genes was generated by the feature Counts package in Subread software version 2.0.1 [56] using a reference genome sequence, a gene annotation file, and sorted bam files. Reads that were uniquely aligned to each gene annotated in the GTF were counted and used for further analyses, whereas the reads with multi-mapping, no features, or ambiguity were excluded.

2.7. Statistical Methods

The pen was considered as the experimental unit for all analyses, except for the transcriptomic analyses, in which each pig was analyzed individually. Univariate data were analyzed by one-way ANOVA using a mixed model in SAS 9.2 (PROC MIXED; SAS Institute Inc., Cary, NC, USA) that included diet as the fixed effect, and both replicate and pen nested in diet as random effects. The normality of the residuals and the presence of outliers were assessed with PROC UNIVARIATE (SAS). Non-normally distributed parameters were power-transformed by a parameter, φ, whose optimal value was estimated using the maximum likelihood method [57]. Data are presented as means ± SDs. Multiple comparisons were corrected with Tukey’s post hoc test, and significant effects were considered at p ≤ 0.05. Identification of metabolites differentially expressed between diets was performed using the %polynova_2way SAS macro, as previously described [58]. Metabolomics data were further assessed by principal component analysis (PCA) to visualize group discrimination in a two-dimensional scores plot. PCA analyses were conducted in R Statistical Language version 4.1.0. Missing data were imputed using the K-Nearest-Neighbor imputation algorithm [59]. Metabolite peak areas were log-transformed and scaled to unit variances prior to PCA.
The statistical analyses of differentially expressed genes (DEGs) were performed using the edgeR-Bioconductor packageBio package [60] in R software. First, the non-expressed and very lowly expressed genes were filtered out, keeping genes that were expressed at a reasonable level (counts per million (CPM) > 0.5). To account for the variation due to library sequencing depths between samples, the read counts were normalized using the trimmed means of M values (TMM) method implemented in edgeR. The read counts were then analyzed with a generalized linear model, with an assumption of a negative binomial distribution of gene counts to identify differentially expressed genes between treatments. The statistical model used for analyses was as follows: log (CPM)ijk = μ + treatmenti + eijk), where the log (CPM)ijk is the log-transformed read CPM of mapped reads for the gene k in sample j from the ith treatment group, μ is the effect of the intercept or the expected (average) gene expression, and eijk is the random residual error effect. A likelihood ratio test for each gene expression level between the treatment groups was used to identify the DEGs. To adjust p-values for multiple testing, the false discovery rate (FDR) method was used, where the significant differentially expressed genes were determined using a 5% FDR threshold. The functional enrichment analyses were performed on DEGs (at p ≤ 0.05) to identify GO terms using the Database for Annotation, Visualization and Integrated Discovery (DAVID) software version 6.8 [61]. The expression of DEGs associated with relevant GO terms was represented in heatmaps constructed with ClustVis software (BETA) [62].
Associations between metabolites and DEGs were identified using a multivariate application of sparse partial least squares (sPLS) [63]. The adequate number of features to retain were calculated by optimizing the average correlation coefficients between latent variables using 10-fold cross-validation with 10 repeats. The final sPLS model was fitted using least absolute shrinkage and selection operator (LASSO) penalty to fit the required features. A bipartite pair-wise similarity matrix was then calculated from the sPLS using a threshold criterion of 0.7. The similarity matrix represented robust approximations of Pearson’s correlations [64] and was visualized using network analysis (Cytoscape software version 3.9.0) [65].

3. Results

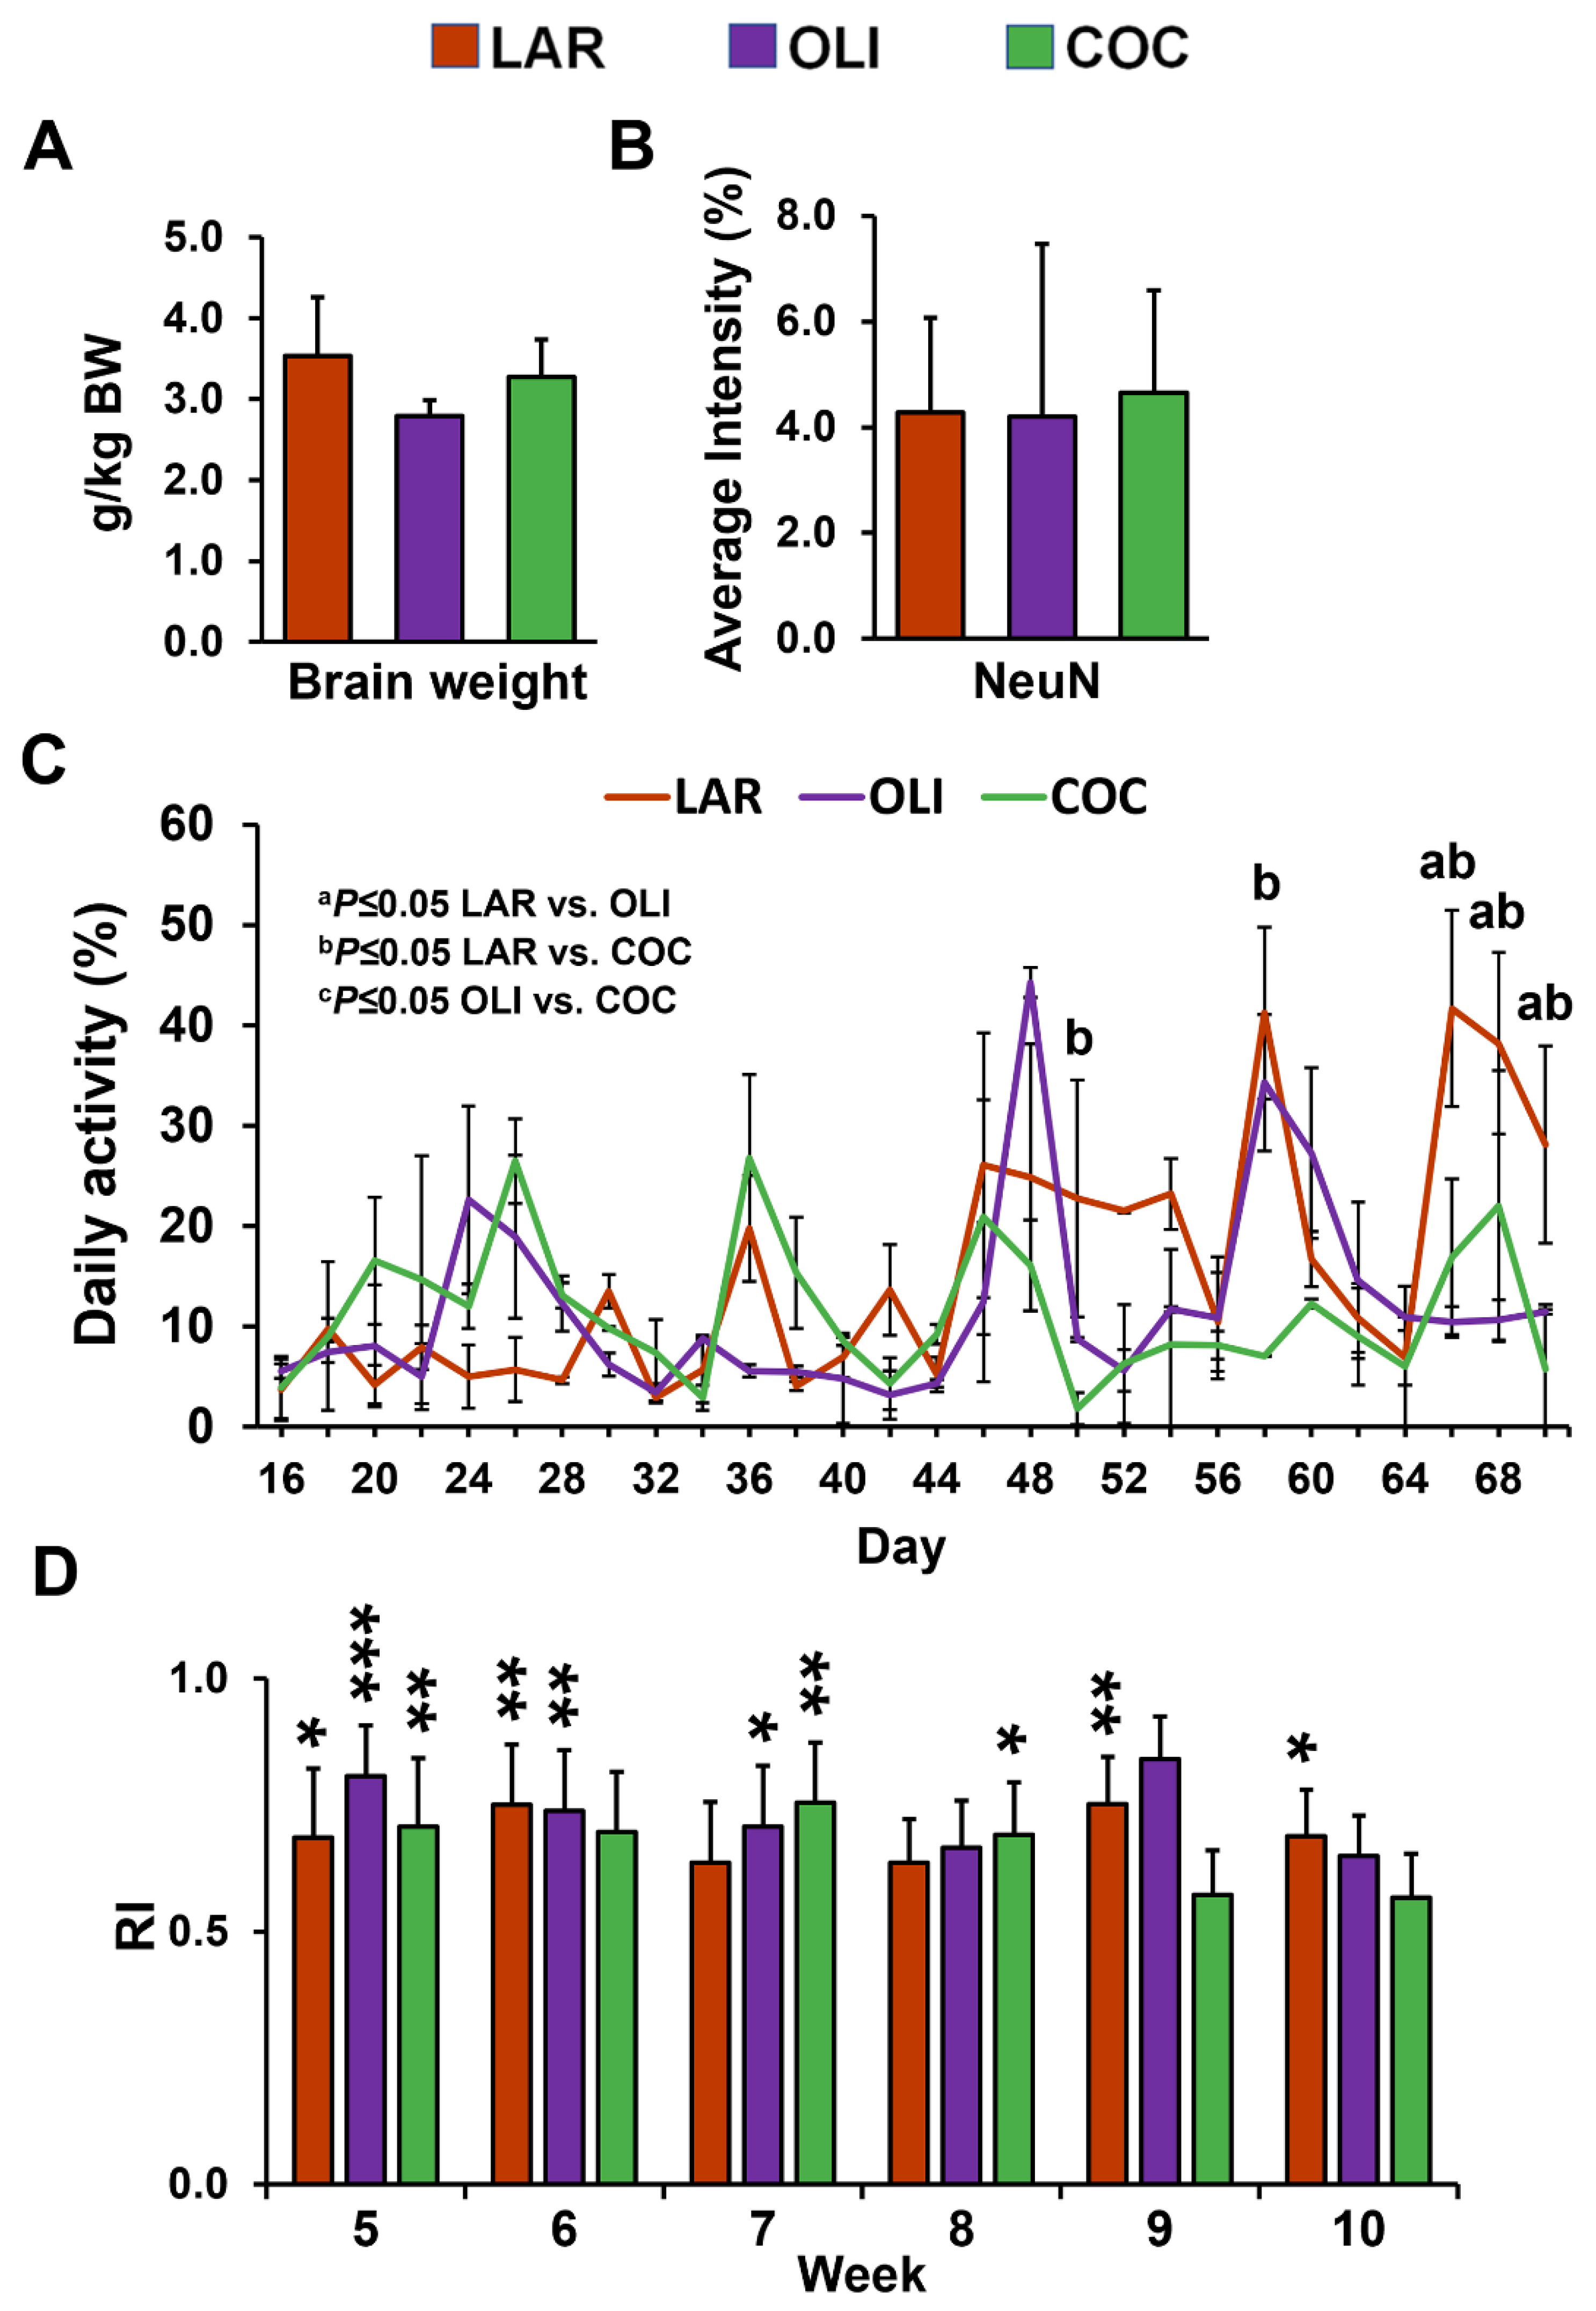
3.1. COC and OLI Pigs Had Decreased Physical Activity without Changes in Cognitive Function or Neuronal Loss

The objective of this study was to investigate the effect of fat sources with different FA profiles on neurodegeneration in a pig model of NAFLD using immunofluorescence and behavioral tests combined with multiomic analyses of FC tissue. The characterization of the NAFLD phenotype in the Iberian pigs used in this study, including biochemistry, histology, metabolomics, and transcriptomics in the liver, blood, and gut, has been described in detail in Manjarin et al. 2022 [43]. Briefly, steatotic grade (p ≤ 0.05), necrosis (p ≤ 0.01), hepatocellular proliferation (p ≤ 0.05), and composite lesion score (p ≤ 0.01) in liver tissues were higher in COC and OLI compared with LAR (Table 2). Similarly, serum biochemistry showed an increase in alanine transaminase (p ≤ 0.05), aspartate transaminase (p ≤ 0.05), and lactate dehydrogenase (p ≤ 0.05) in COC and OLI, while gamma-glutamyl transferase was elevated in COC-fed pigs compared with LAR (p ≤ 0.05; Table 2).
No differences were observed in relative brain weight and neuronal marker NeuN immunofluorescence among the diet groups (Figure 2A,B). Next, we assessed changes in physical activity and cognitive functioning. The mixed-model ANOVA indicated a significant increase in daily activity levels in LAR compared with COC on d 50 and 58 (p ≤ 0.05), and in COC and OLI on d 66, 68, and 70 (p ≤ 0.05; Figure 2C). There were no differences in the novel object recognition test between weeks 5 and 10 across treatment groups (Figure 2D). In addition, RI was significantly greater than 0.5 for all diets at week 5 (p ≤ 0.05), for LAR and OLI at week 6 (p ≤ 0.01), OLI and COC at week 7 (p ≤ 0.05), COC at week 8 (p ≤ 0.05), and LAR at weeks 9 and 10 (p ≤ 0.05; Figure 2D).

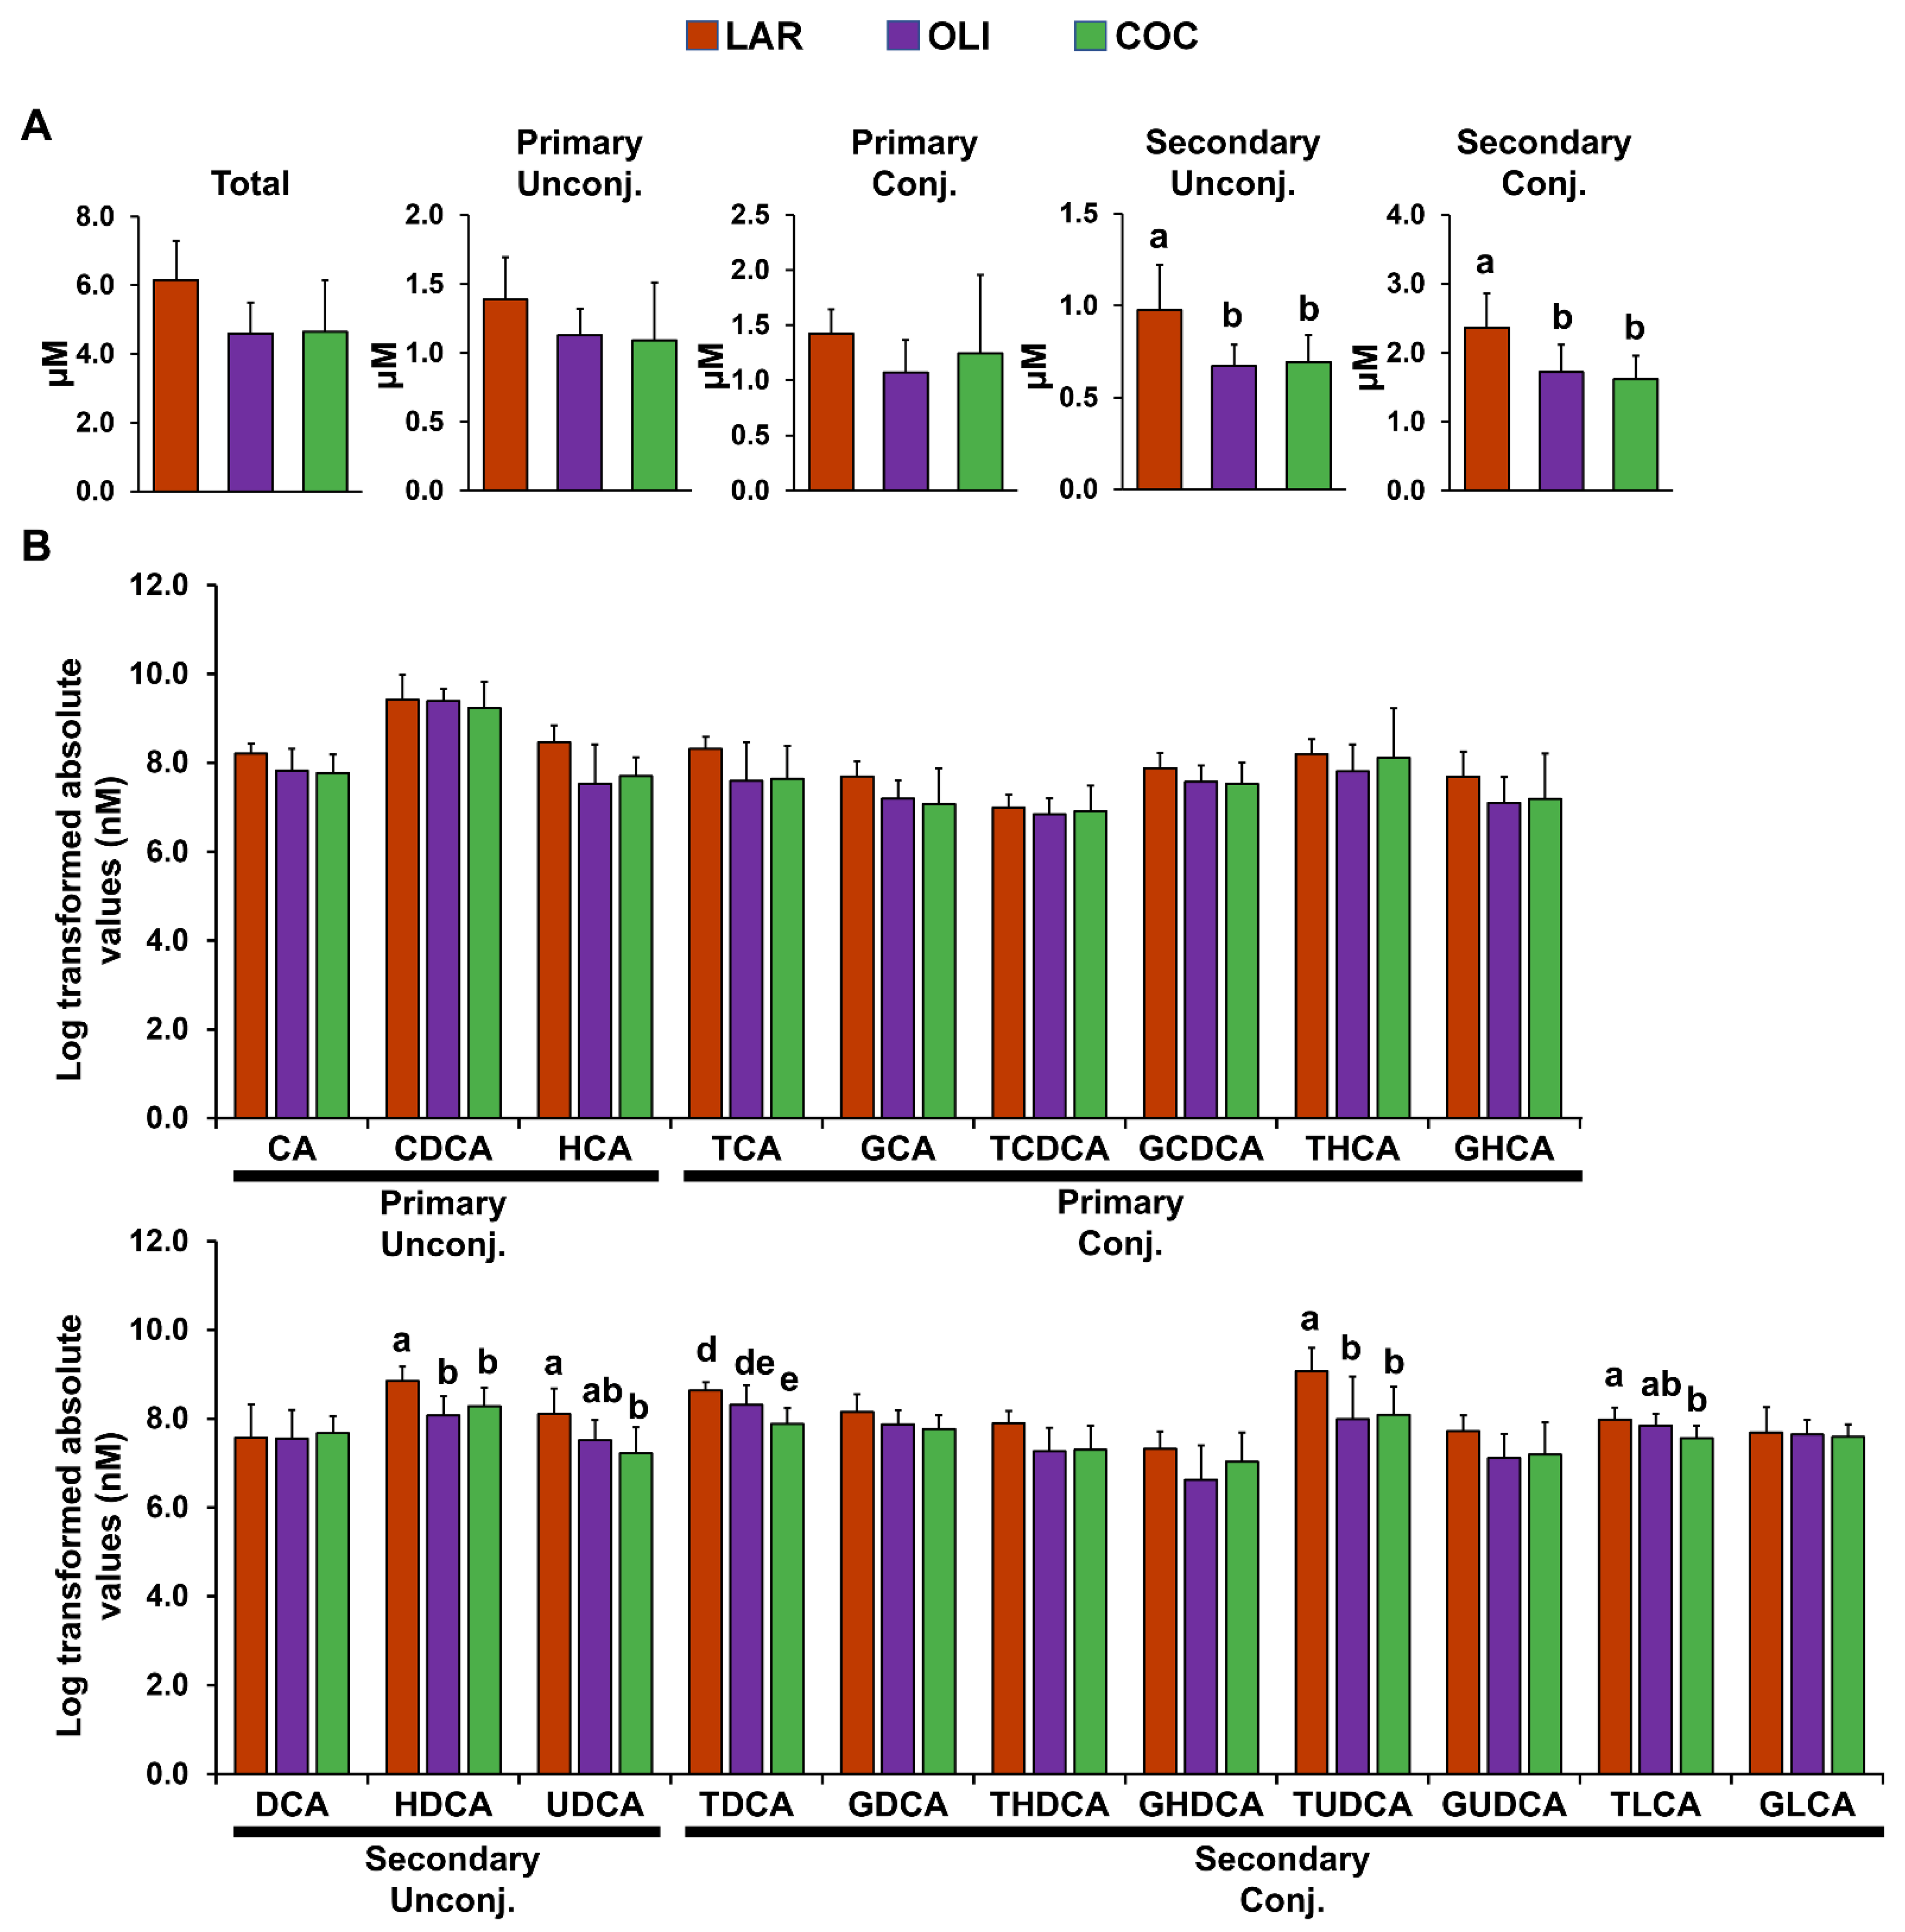
3.2. COC and OLI Diets Decreased Secondary BA Species Compared with LAR

Twenty BA species were detected in the FCs of juvenile Iberian pigs. Principal component analysis separated LAR from OLI and COC, but could not separate OLI and COC samples (p ≤ 0.05; Figure 3A).
Compared with LAR, secondary conjugated and unconjugated BAs in the FC decreased in COC and OLI (p ≤ 0.05; Figure 4A). Analysis of individual secondary unconjugated BA species showed a decrease in hyodeoxycholic (HDCA) and ursodeoxycholic (UDCA) acids in OLI and COC compared with LAR (p ≤ 0.05; Figure 4B). Among secondary conjugated BAs, taurine-conjugated deoxycholic (TDCA) and lithocholic (TLCA) acids decreased in COC (p ≤ 0.01 and 0.05, respectively; Figure 4B), and TUDCA decreased both in COC and OLI compared with LAR (p ≤ 0.05; Figure 4B).

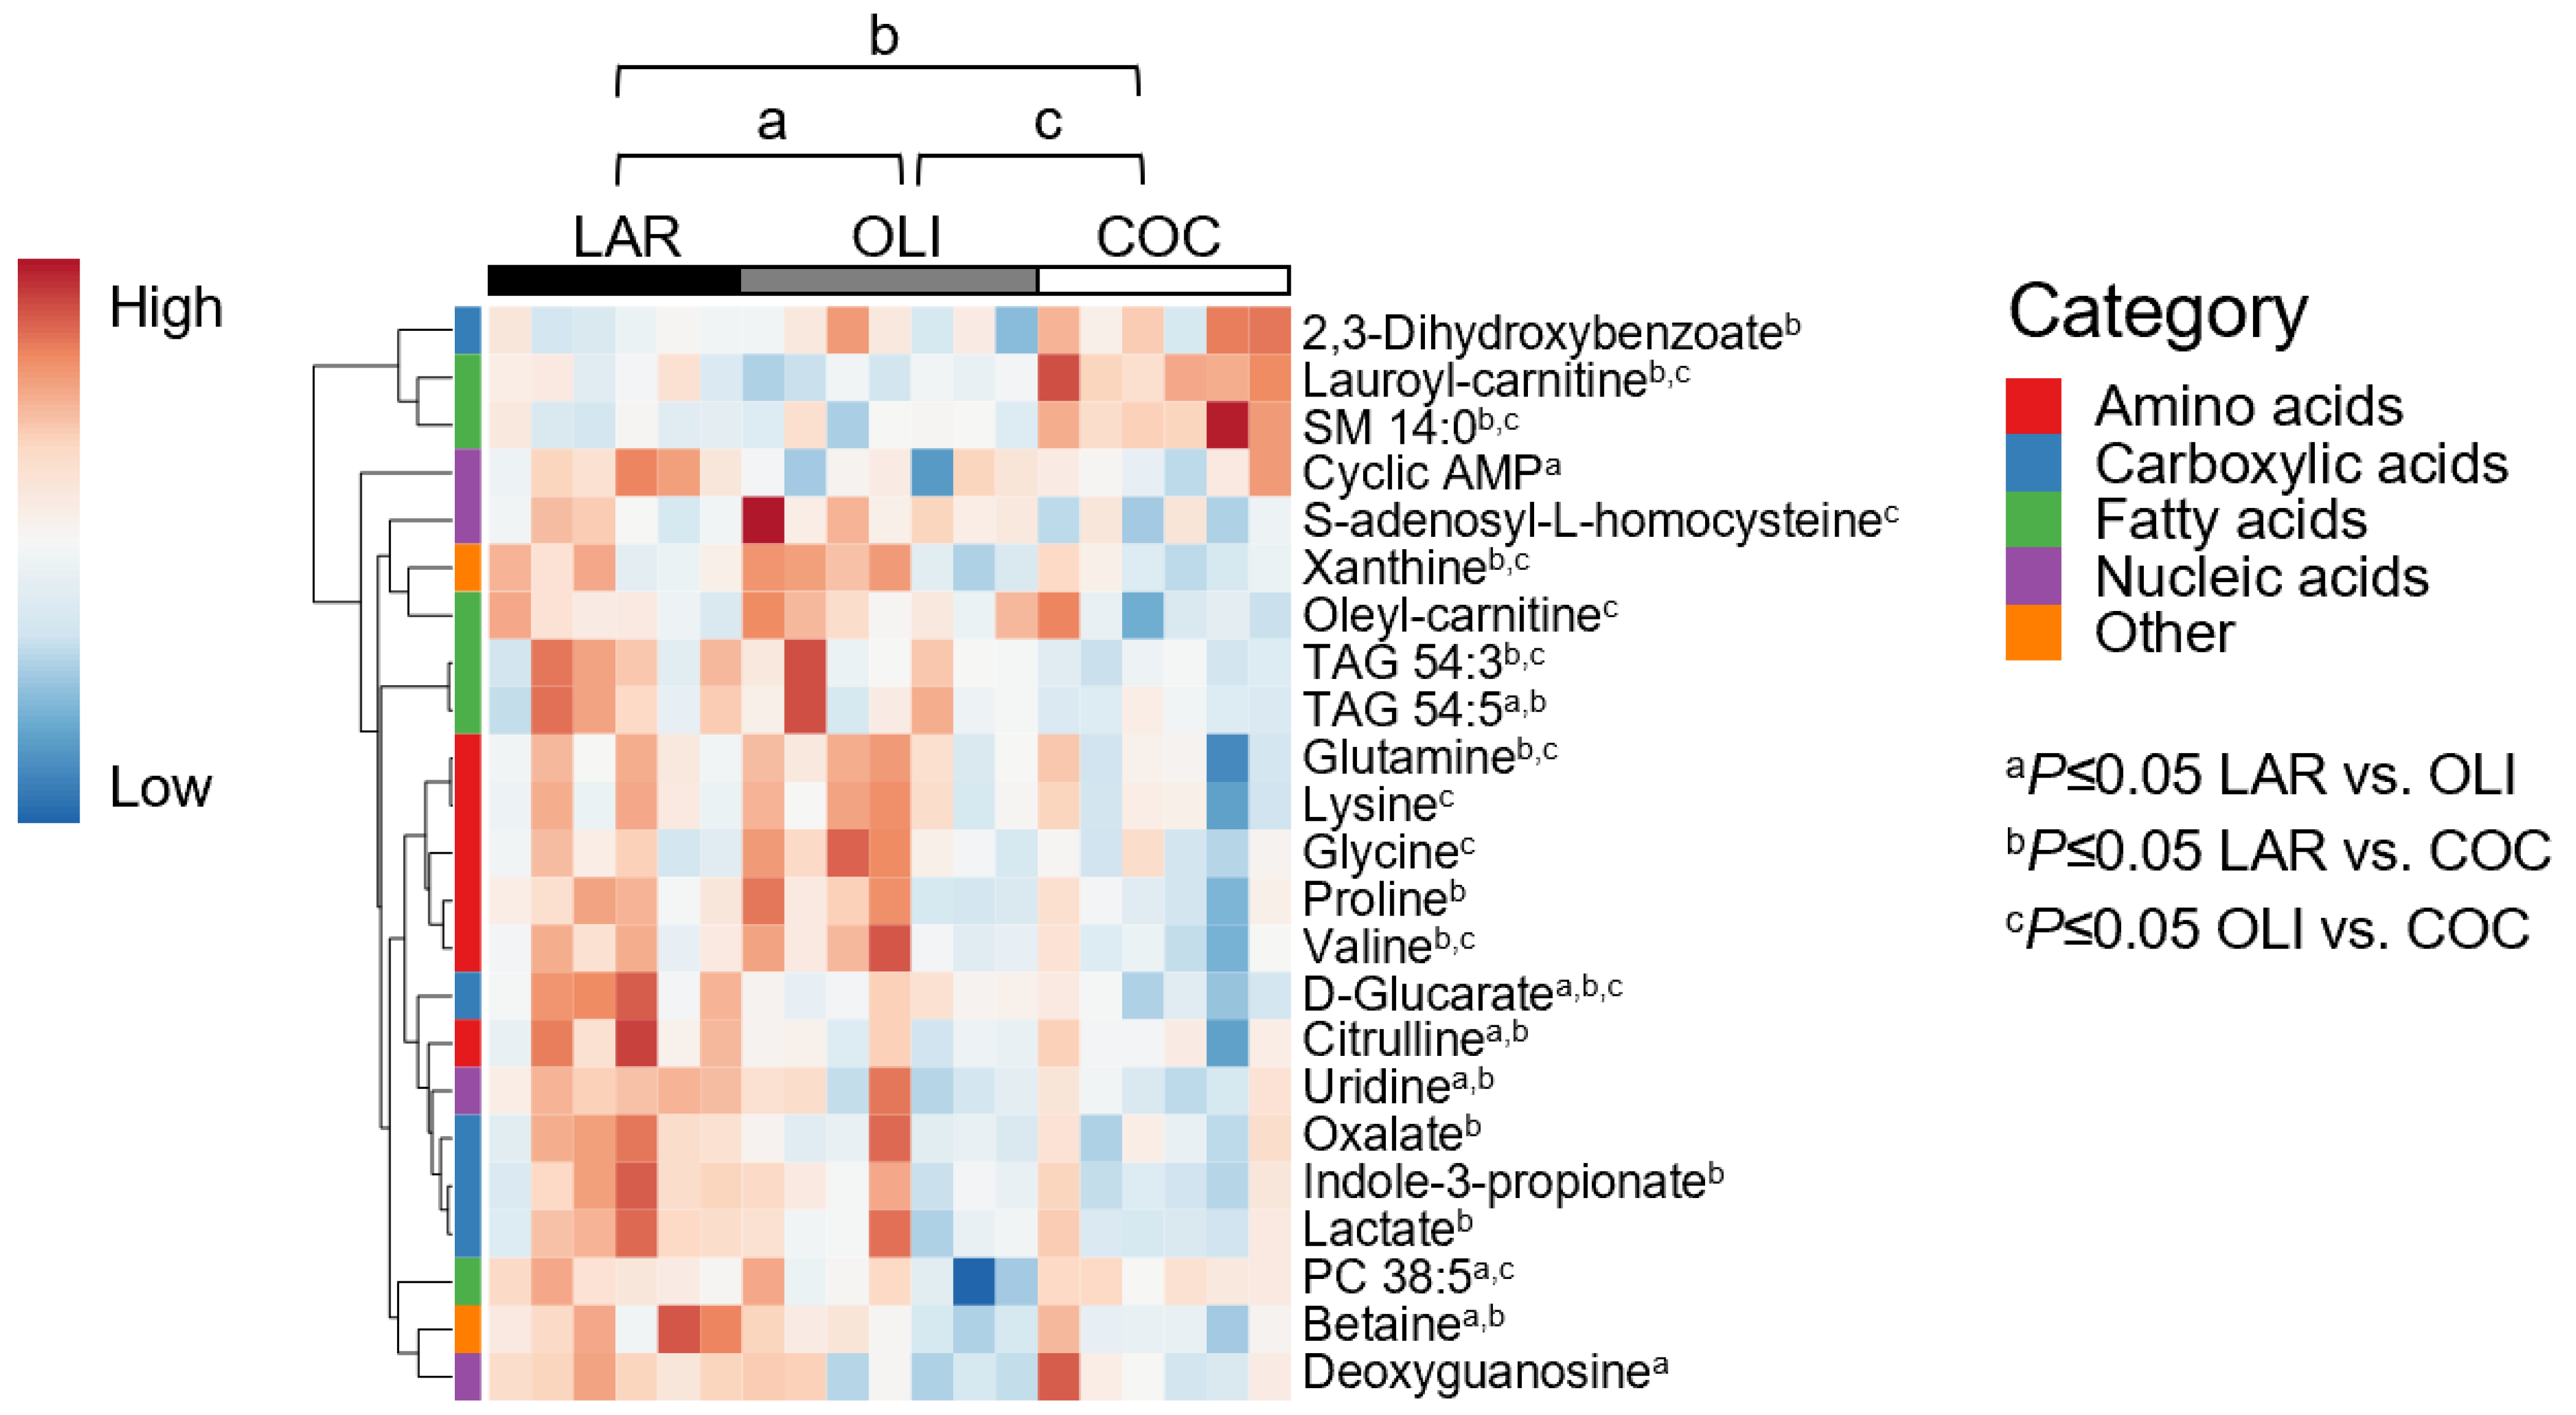
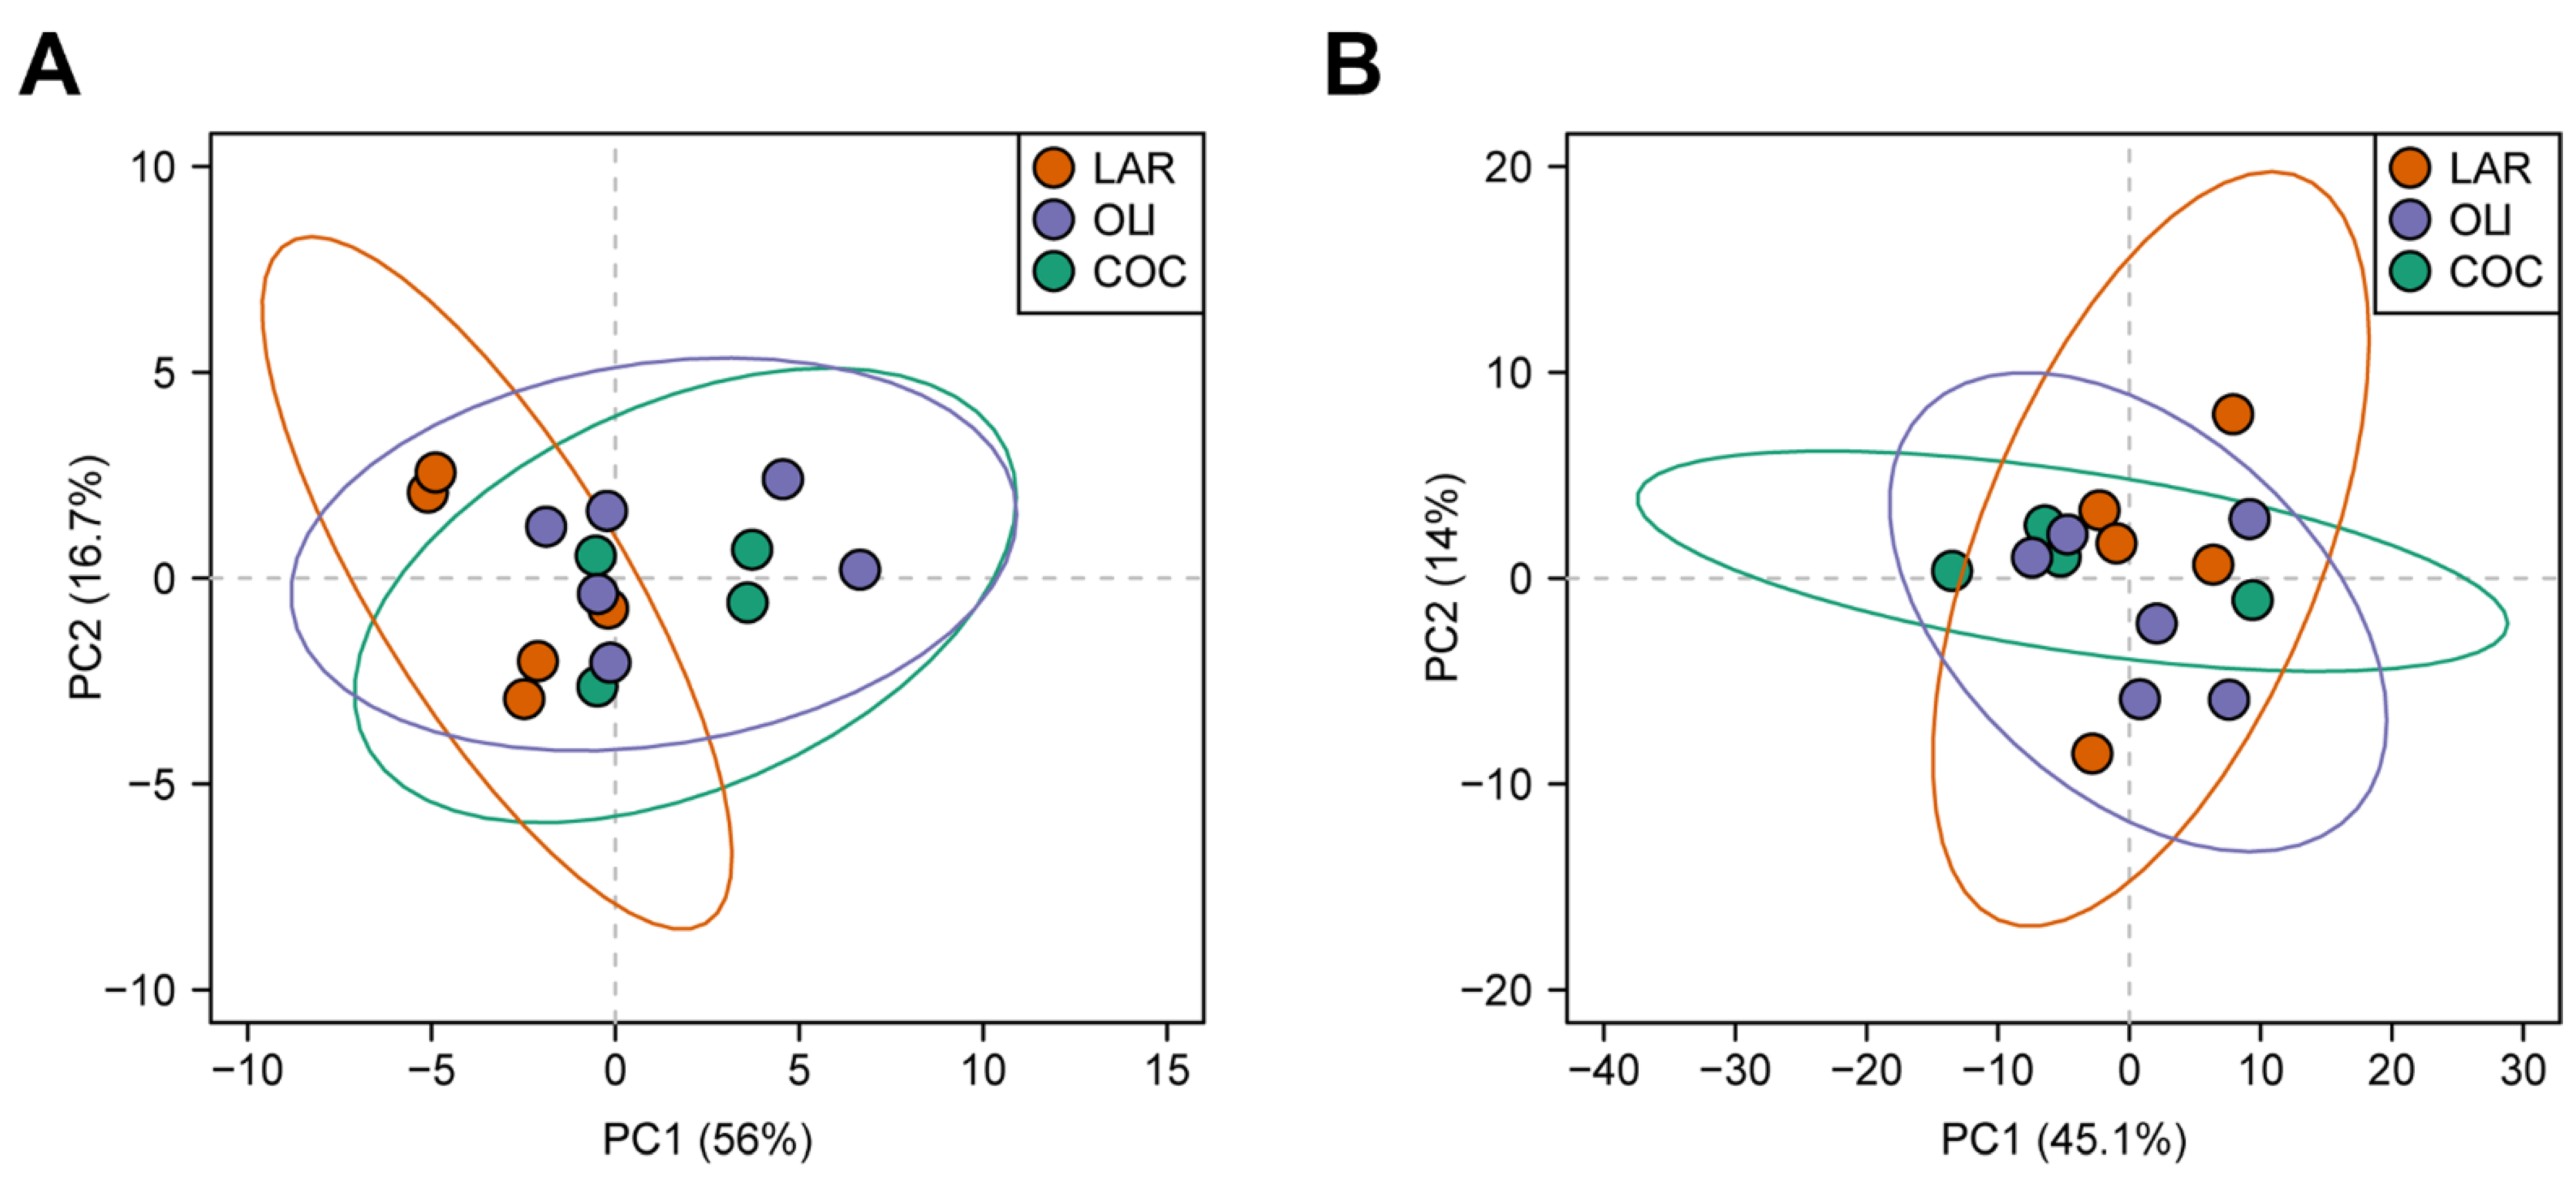
3.3. COC and OLI Decreased One-Carbon Metabolites, Amino Acids, Complex Lipids, and Carboxylic Acids in the Frontal Cortex

A total of 127 metabolites were detected in the FC, of which 23 changed between diets. PCA plots did not separate LAR, OLI, and COC samples (Figure 3B). The amino acids (proline, valine, glutamine, lysine, and glycine), carboxylic acids (oxalate, D-glucarate, indole-3-propionate, and lactate), complex lipids (oleyl-carnitine and TAG 54:3), S-adenosyl-L-homocysteine, and xanthine decreased (p ≤ 0.05) in COC compared with OLI and/or LAR (Figure 5). In addition, citrulline, TAG 54:5, betaine, and uridine decreased (p ≤ 0.05) in COC and OLI compared with LAR, and PC38:5, cyclic AMP, and deoxyguanosine decreased (p ≤ 0.05) in OLI compared with COC and LAR (Figure 5). Conversely, 2-3-dihydroxybenzoate, lauroyl-carnitine, and SM 14:0 increased (p ≤ 0.05) in COC compared with OLI and/or LAR (Figure 5).
The major FAs in the FC homogenates were palmitic (16:0), stearic (18:0), oleic (18:1), and arachidonic (20:4) acids (Table 3). No significant differences were observed in FA composition in the FC among LAR, OLI, and COC pigs (Table 3).

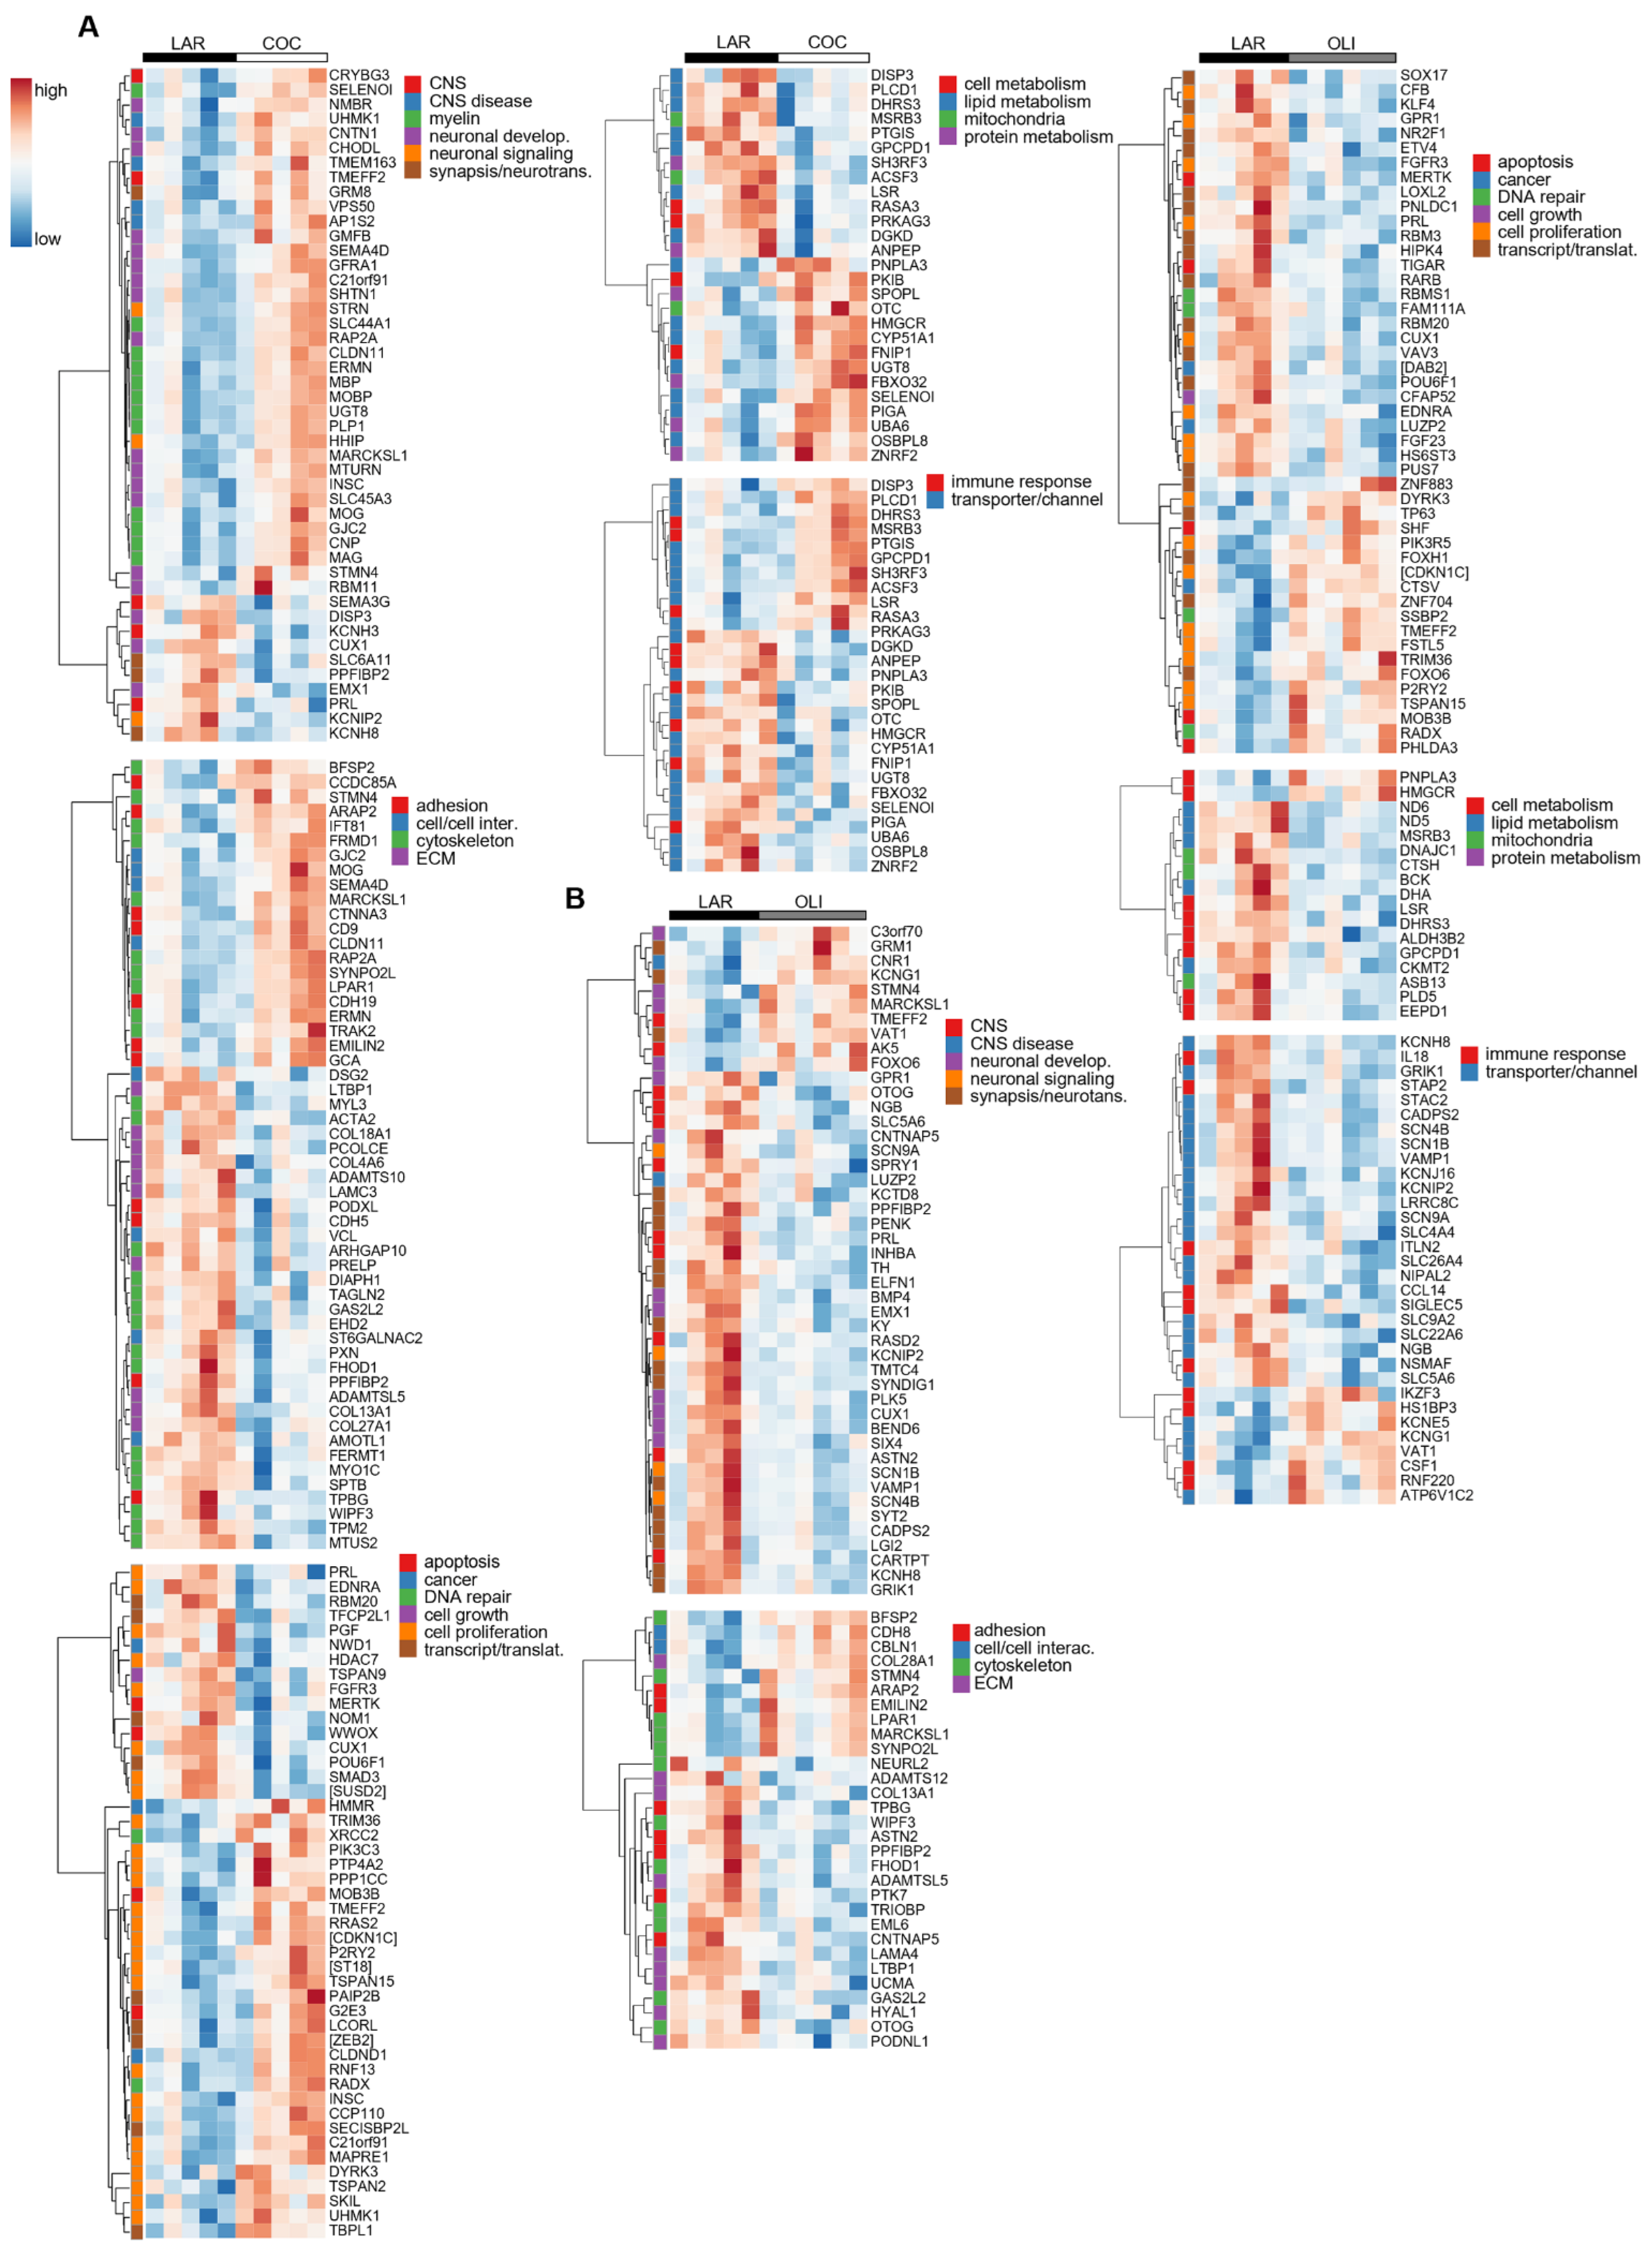
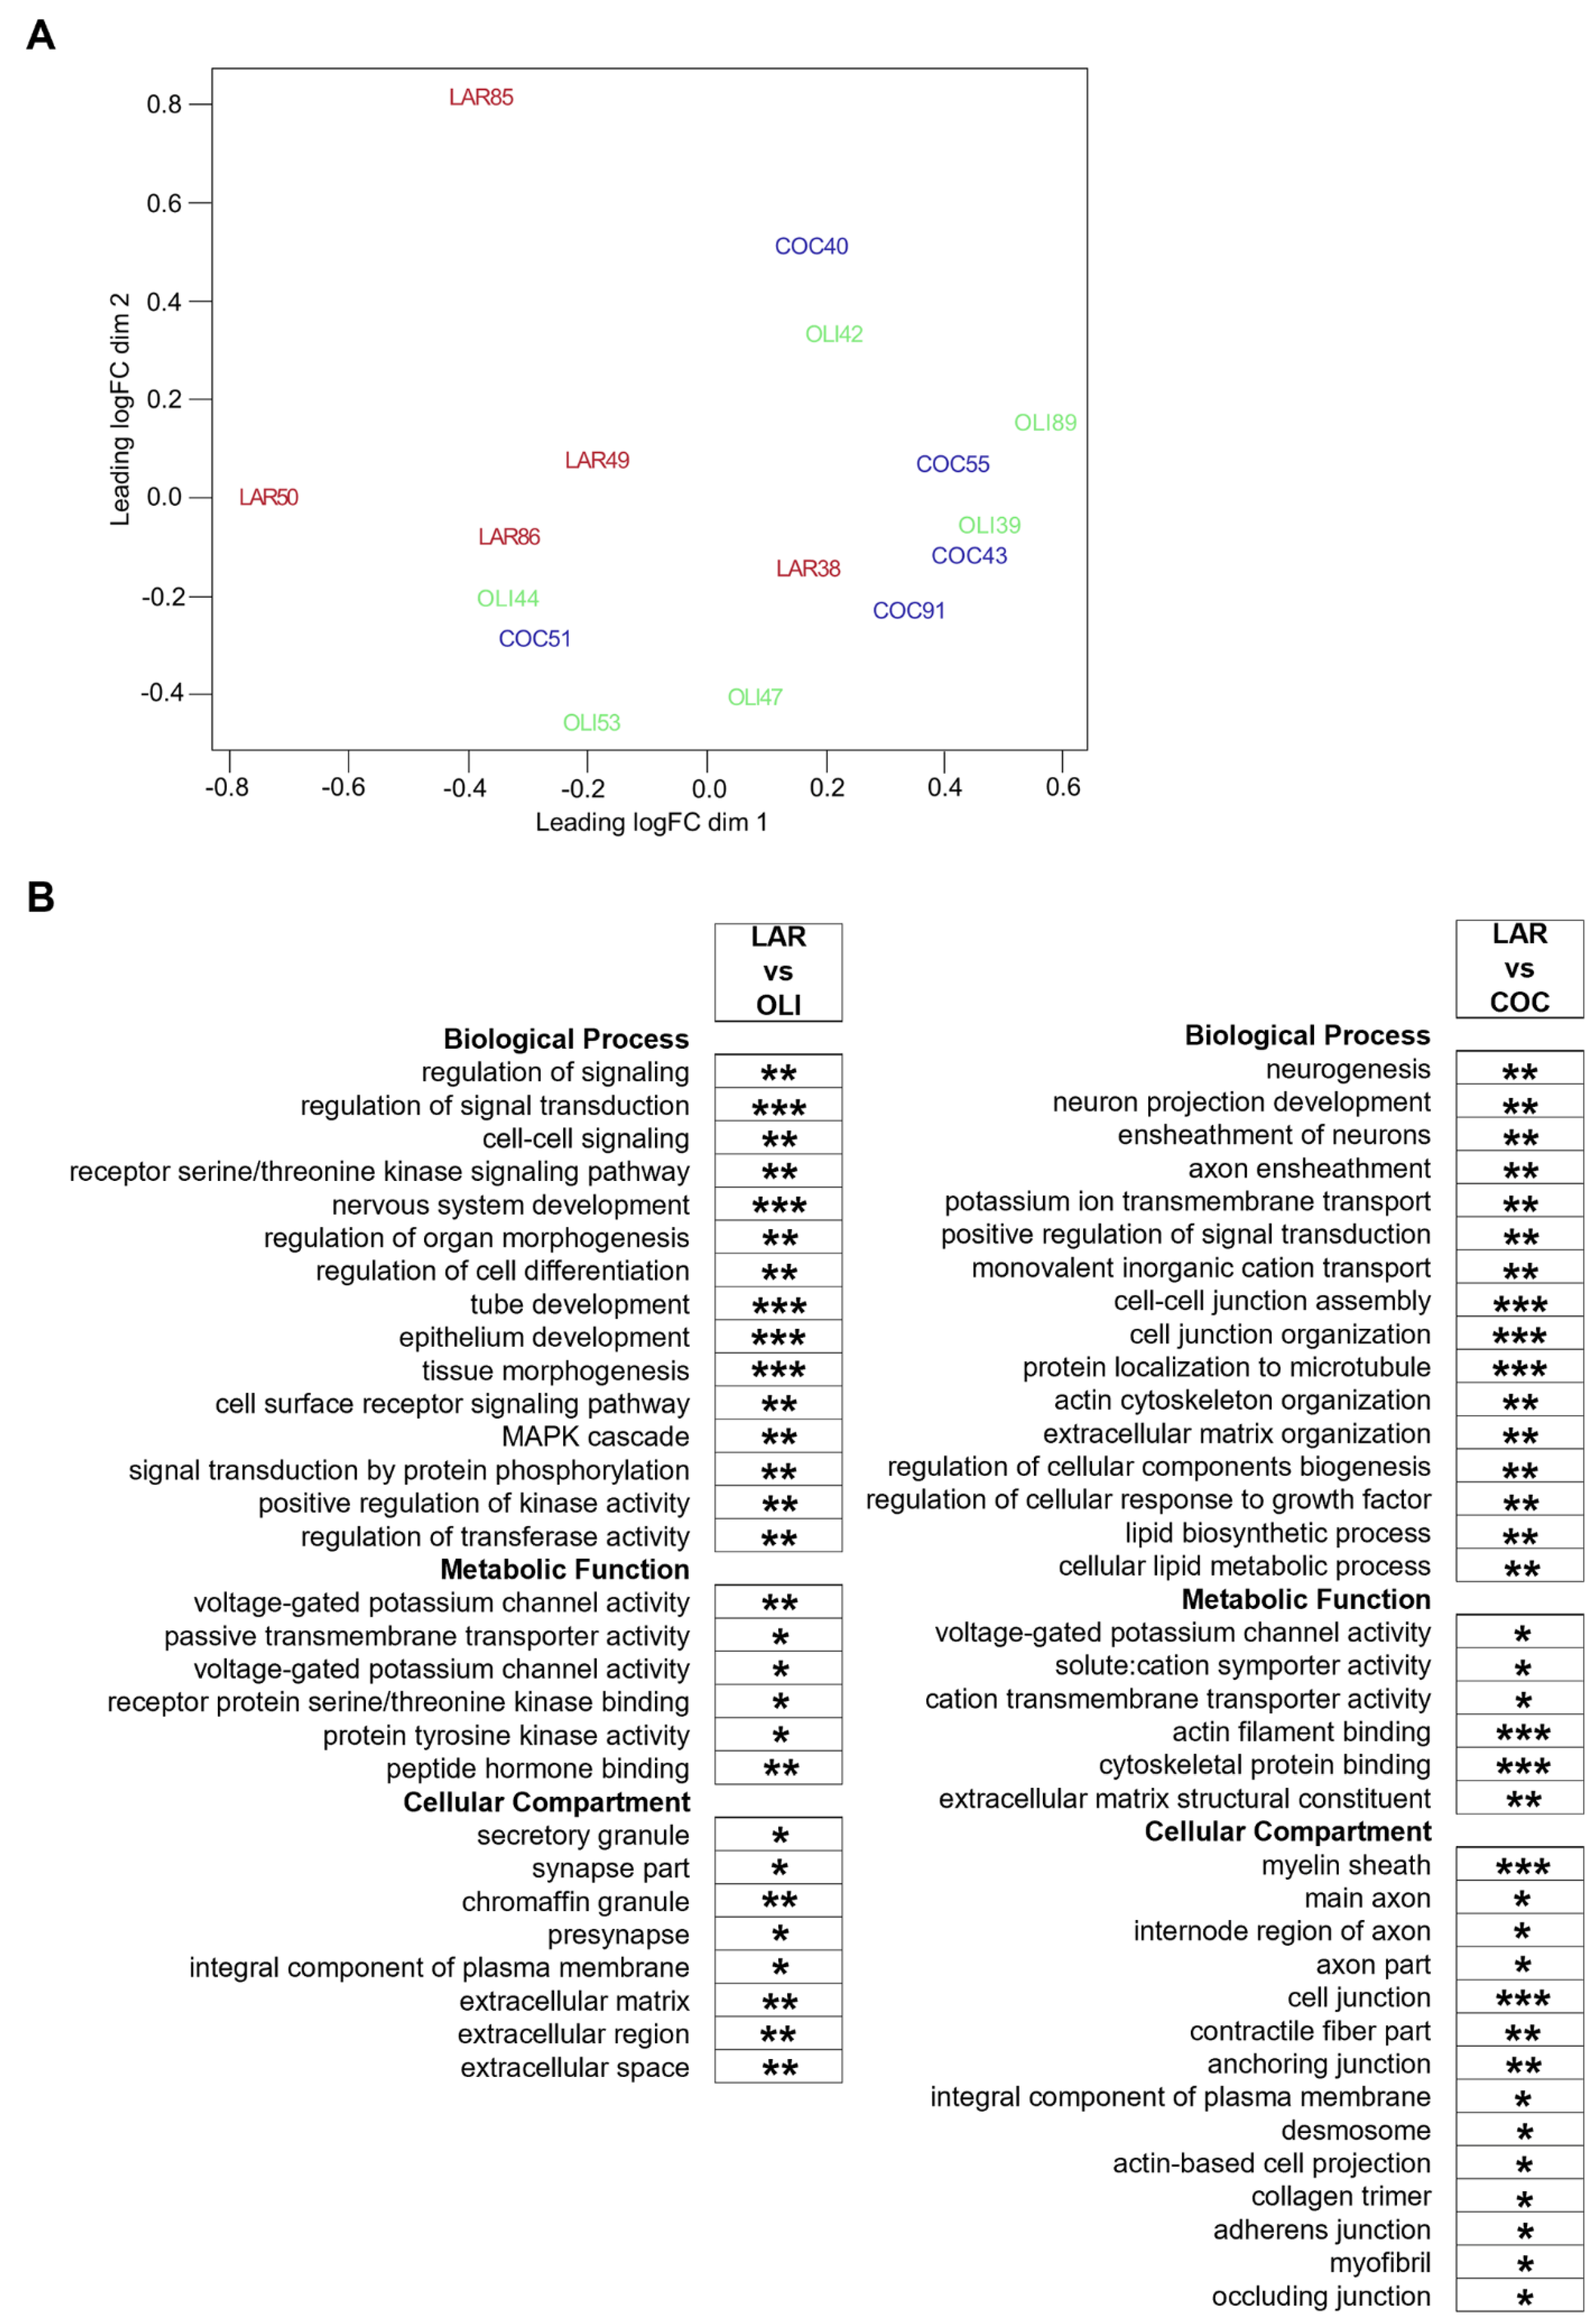
3.4. COC and OLI Diets Regulated Genes Associated with Myelin Formation, Neuronal Development, and Signaling

Diet-induced changes in the FCs of COC- and OLI-fed pigs were further evaluated through transcriptome-wide RNA profiling. Multidimensional scaling showed the association of FC samples in two differentiated clusters in the chart, with LAR pigs separated from OLI and COC (Figure 6A). Functional enrichment analyses of LAR vs. COC identified terms associated with neurogenesis, myelin formation, voltage-gated channels, organization of extracellular matrix (ECM) and cytoskeleton, and cell adhesion (p ≤ 0.05; Figure 6B). In OLI brains, functional enrichment analyses showed deregulation of GO terms related to cell signaling, nervous and epithelial tissue development, voltage-gated channels, synapses, and ECM when compared with LAR (p ≤ 0.05; Figure 6B).
The transcriptional profile highlighted the upregulation (p ≤ 0.05; Figure 7A) of many genes in COC brains associated with the formation, maintenance, and structure of the myelin sheath, such as Myelin Oligodendrocyte Glycoprotein (MOG), Myelin-Associated Oligodendrocyte Basic Protein (MOBP), Myelin Basic Protein (MBP), and Myelin-Associated Glycoprotein (MAG). Gene sets related to the differentiation, migration, and regeneration of brain cells, such as Glia Maturation Factor Beta (GMFB), Shootin 1 (SHTN1), Glial-Cell-Derived Neurotrophic Factor Family Receptor Alpha 1 (GFRA1), Semaphorin 4D (SEMA4D), Neural Progenitor Differentiation Regulator (MTURN), Neuromedin B Receptor (NMBR), and Contactin 1 (CNTN1) were also upregulated in COC compared with LAR (p ≤ 0.05; Figure 7A). Conversely, transcripts associated with the ECM, including collagen subunits (COL13A1, COL28A1, COL4A6, COL18A1, and COL27A1) and Metalloprotease-like Enzymes that modulate microfibril assembly (ADAMTS10 and ADAMTSL5), decreased in COC compared with LAR (p ≤ 0.05; Figure 7A).
In OLI-fed pigs, the transcriptional profile showed the downregulation (p ≤ 0.05; Figure 7B) of genes coding for voltage-gated sodium and potassium channels (SCN9A, SCN1B, SCN4B, and KCNIP2), as well as genes associated with the development and activity of synapses and neurotransmitters, such as Polypeptide-Interacting Protein-Binding Protein 2 (PPFIBP2), Proenkephalin (PENK2), Extracellular Leucine Rich Repeat And Fibronectin Type III Domain Containing 1 (ELFN1), Synapse Differentiation Inducing 1 (SYNDIG1), and Glutamate Ionotropic Receptor Kainate Type Subunit 1 (GRIK1). Gene sets related to cancer, cell division, cell growth and transcription/translation, coagulation, immune response, and lipid and protein metabolism were also differentially regulated in the FCs of the COC and OLI groups compared with LAR (p ≤ 0.05; Figure 7A,B), but were not consistently up- or downregulated nor significantly associated with GO terms in the FC.

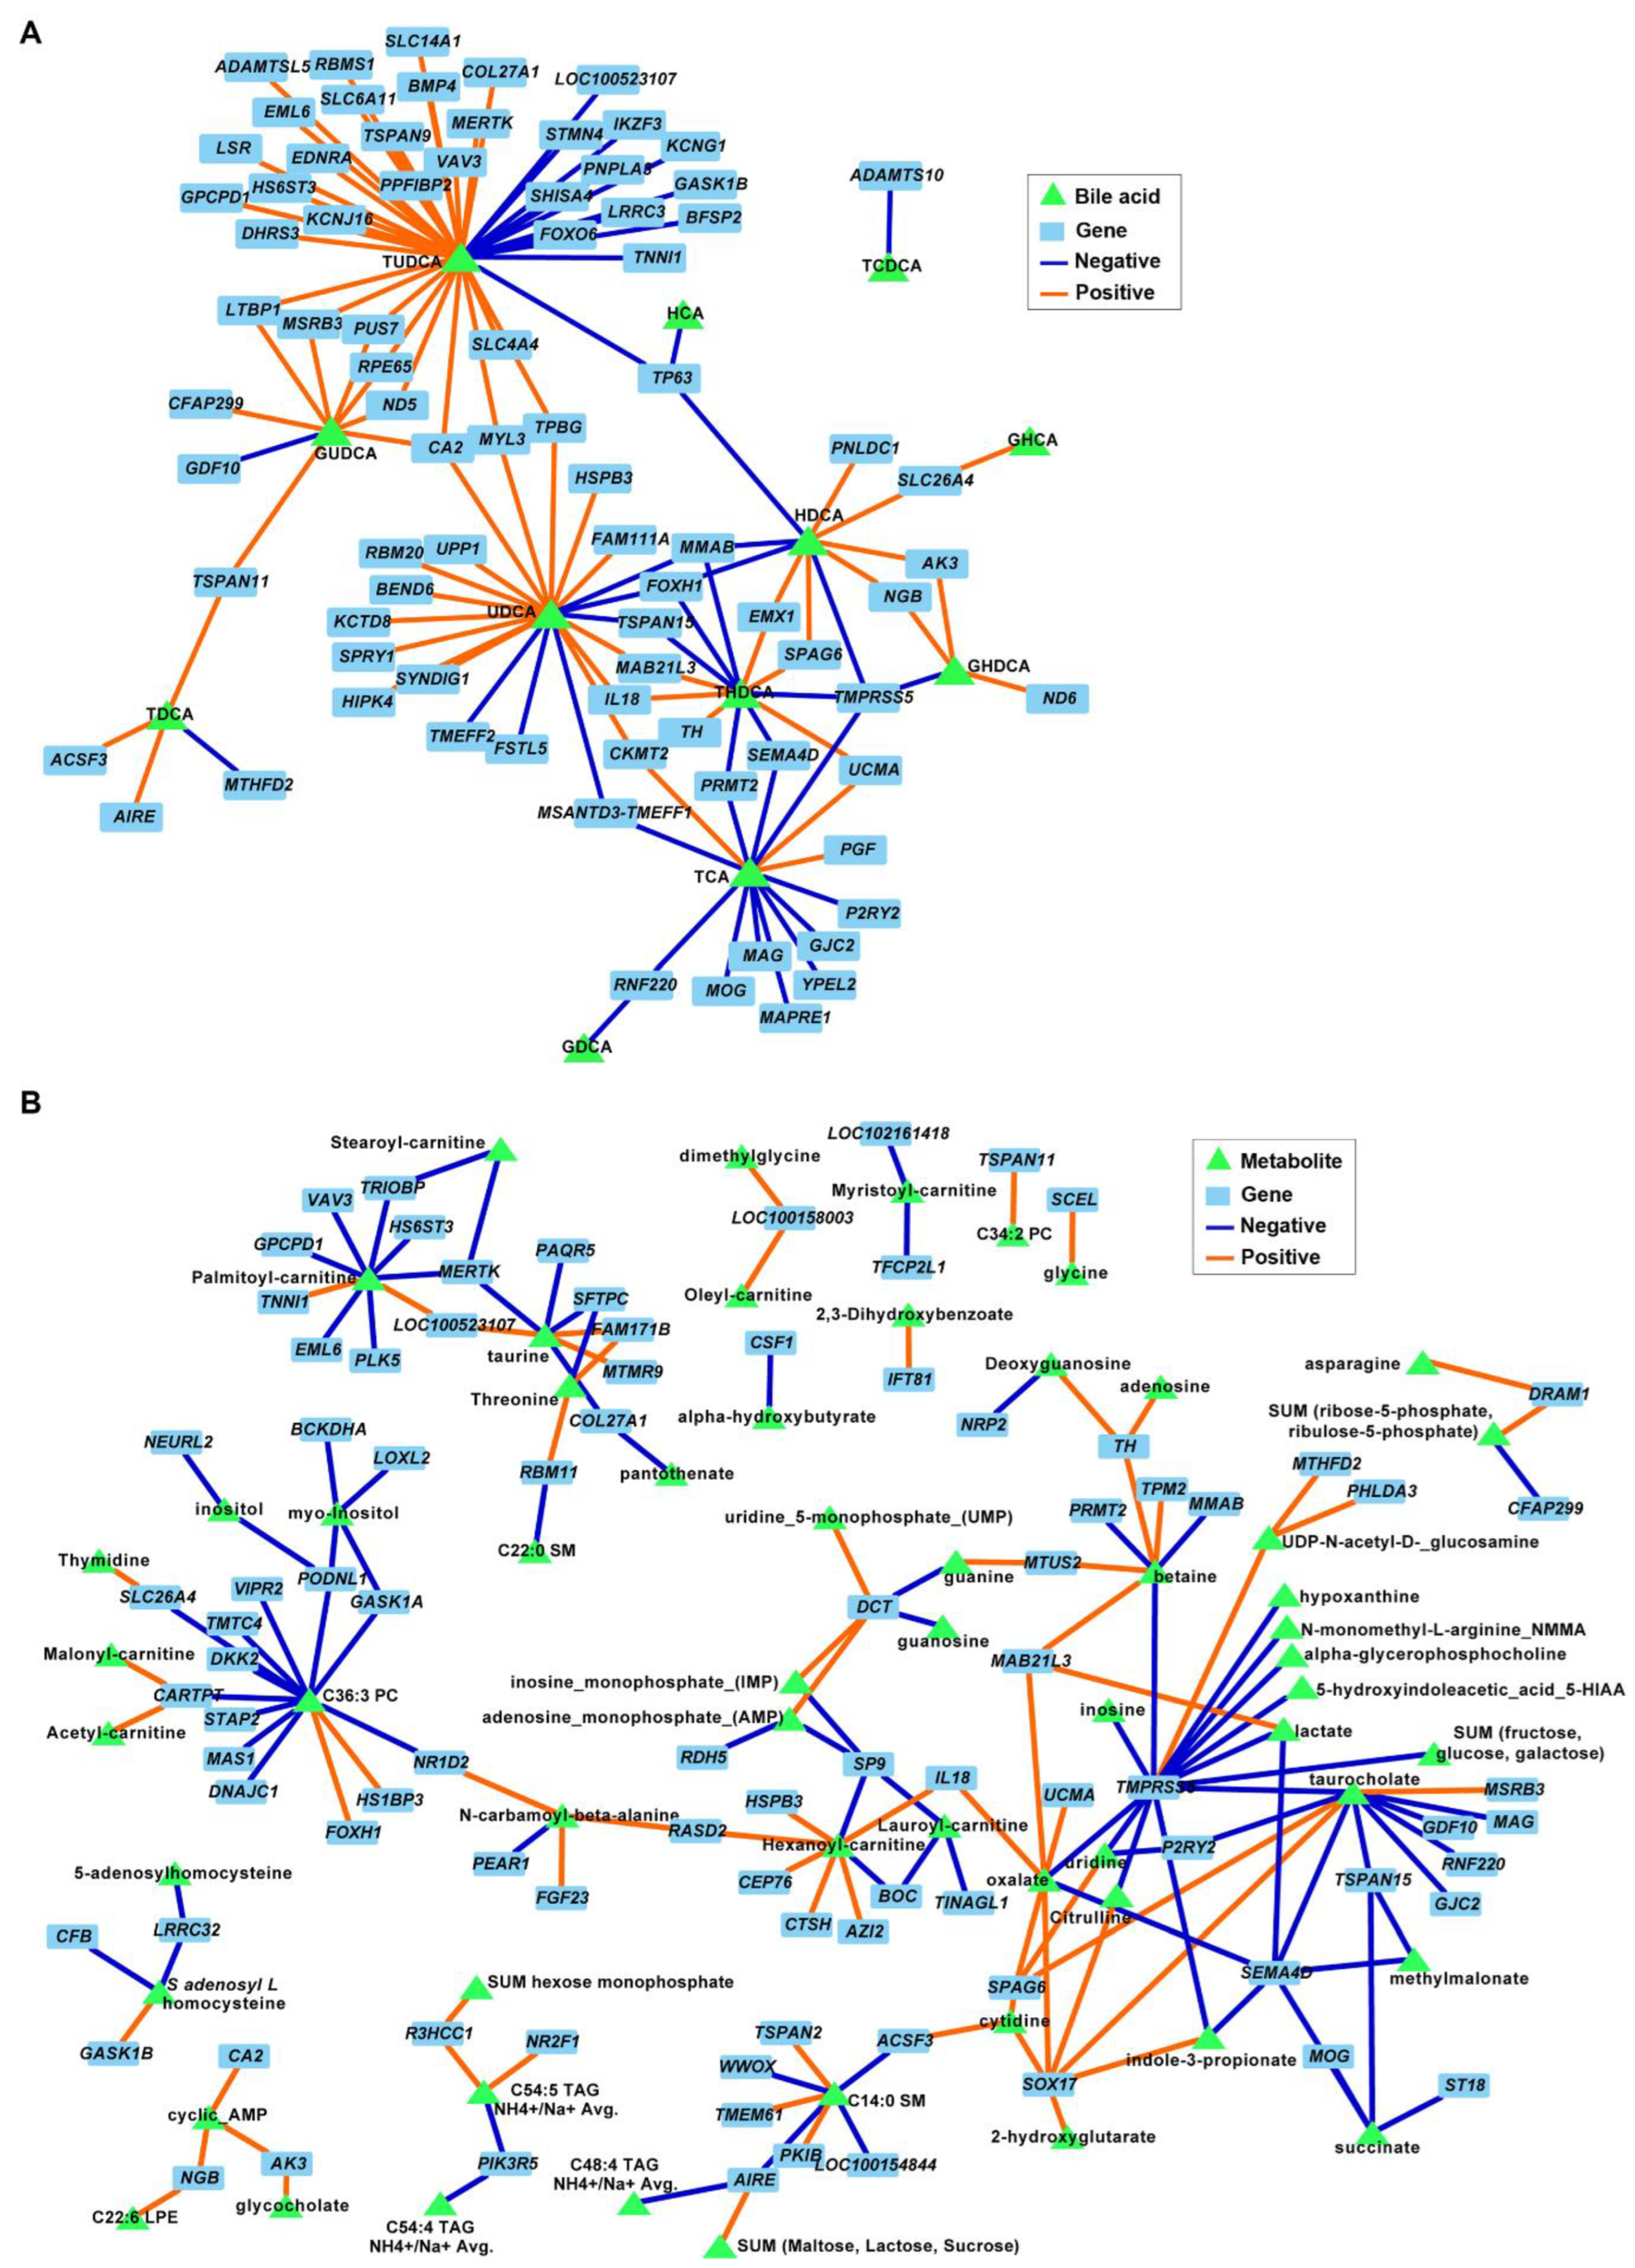
3.5. Secondary Bile Acids Were Correlated with Expression of Frontal Cortex Genes Involved in Neurogenesis, Neurotransmission, and Extracellular Matrix Organization

The correlation analysis between BAs and DEGs in FC tissues revealed an association between both TUDCA and UDCA and several genes involved in neuronal development and ECM organization (p ≤ 0.001; Figure 8A). For example, negative associations were identified between TUDCA and neurogenesis, neurotransmission, and synapse development genes STMN4, FOXO6, BMP4, PPFIBP2, SLC6A11, and KCNG1, and between TUDCA and ECM genes COL27A1 and ADAMTSL5. Similarly, UDCA was correlated with genes involved in nervous system functions (negative: SPRY1 and KCTD8; positive: BEND6 and TMEFF2). Several metabolites were also associated with DEGs in the FC; however, none of the correlation nodes involved metabolites that were significantly different between diets and/or genes associated with relevant cell functions (Figure 8B).

4. Discussion

The main objective of this study was to investigate the effect of fat sources with different FA profiles on brain BA metabolism and neuronal loss in a pig model of NAFLD using a multiomic approach combined with immunohistochemistry and behavioral analyses. In a completely randomized design with two consecutive replicates, 30 juvenile Iberian pigs were fed one of three high-fat, high-fructose diets enriched with lard (high in SFAs and LCFAs), olive oil (high in MUFAs and LCFAs), and coconut oil (high in SFAs and MCFAs). Our results show that the COC and OLI diets lowered secondary conjugated and unconjugated BAs in the FCs of NAFLD pigs, reduced physical activity, and altered expression of metabolic and transcriptomic markers of brain injury. In addition, diet-induced changes in FC metabolites and genes paralleled the severity of NAFLD, as both COC and OLI diets increased steatosis, necrosis, and cellular proliferation in the liver compared with LAR [43]. However, recognition memory and neuronal number did not differ between diets, suggesting that metabolic and transcript abnormalities may precede more severe functional or histopathological changes in the cortex. Interestingly, NeuN average staining intensities in the FCs of the COC, LAR, and OLI groups were similar to the NeuN intensity in the FCs of high-fructose, high-fat-diet-fed juvenile Iberian pigs with neurodegeneration [9], suggesting that the three high-fat diets may have promoted some degree of neuronal loss in the animals when compared with healthy controls.
Many preclinical studies have demonstrated a neuroprotective role for secondary BAs in the brain [66]. For example, TLCA, which was lower in COC-fed pigs compared with the LAR group, decreased microglial production of interleukins 1β and 6 in an LPS model of neuroinflammation [67]. Similarly, administration of HDCA prevented apoptosis and necrosis in astrocytes and neurons exposed to oxygen–glucose deprivation in vitro [68]. Particularly interesting in our study is the decrease in UDCA and TUDCA in COC- and OLI-fed pigs, given that both BAs have been shown to prevent apoptosis, oxidative stress, and inflammation in ex vivo, in vitro, and in rodent models of AD and PD [66]. Furthermore, UDCA is a Farnesoid X receptor antagonist [69], and inhibition of Farnesoid X signaling in the FC has been shown to protect against toxic cholesterol accumulation in mouse models of hepatic encephalopathy [23]. UDCA is produced by gut bacteria through the deconjugation of primary BAs in the distal ileum and colon [1]. Most UDCA is then excreted in the feces, with a small fraction being reabsorbed in the colonic mucosa and circulated into the liver with the portal blood. Once in the liver, UDCA is reconjugated with taurine (t) or glycine (g) before being released again into the small intestine [1]. It is thought that most UDCA and TUDCA in the brain comes from peripheral circulation, as both BAs can be detected in blood and brain and can penetrate across the blood–brain barrier and the cerebrospinal fluid [70,71,72]. However, levels of conjugated and unconjugated UDCA did not decrease in the livers, sera, or colons of COC- or OLI-fed pigs [43], suggesting an alteration of BA transport in the brain rather than systemic BA dysregulation. Similar results were observed in our previous study, in which high-fat-diet-fed pigs with NAFLD and neuronal loss had decreased levels of UDCA and TUDCA in the brain but not in the liver or serum [9,25]. A possible explanation for this effect could be attributed to the decrease in circulating FGF19 levels in OLI and COC animals [43], which has been shown to downregulate the BA transporters OATP and NTCP in the liver and to decrease BA uptake [73]. In this regard, OATP and NTCP have also been detected at the blood–brain barrier in humans and rats and have been shown to participate in UDCA and TUDCA transport [74,75].
We also observed a decrease in one-carbon metabolites [76], amino acids [77], and lactate [78] in the FCs of COC- and OLI-fed pigs compared with LAR. The depletion of brain levels of glutamine and creatinine suggests alterations in neuronal nitric oxide production, which have been associated with the development of AD [79,80,81]. Similarly, decreases in cerebral lactate contents were correlated with reduced amounts of neurons and oligodendrocytes and increased quantities of astrocytes in a mouse model of AD [78]. Of particular importance in the context of brain injury is the decrease in betaine levels in OLI- and COC-fed pigs. Changes in betaine levels in the brain occur as a result of betaine being converted back to choline, which is required for neurotransmitter synthesis and lipid metabolism in neurons [82,83]. In addition, betaine can serve as a methyl donor for the homocysteine-to-methionine reaction in one-carbon metabolism [82,83]. As such, a decrease in betaine levels in COC- and OLI-fed pigs may have altered choline, homocysteine, and gene methylation levels in the FC, with potential neurodegenerative effects [84,85,86]. In this regard, we have previously shown a disproportionate decrease in FC levels of betaine in NAFLD pigs which was positively correlated with astrogliosis and neuronal loss [9]. Given that betaine levels were also lower in OLI and COC livers compared with LAR [43], it is possible that OLI and COC diets caused a systemic dysregulation of choline metabolism. In agreement with this idea, we have previously shown that our pediatric pig model resembles choline-deficient dietary models of NASH, in which pigs develop steatosis, lobular inflammation, and ballooning in the absence of other metabolic features seen in human NAFLD [9,25].
Diets high in total and saturated fats are known to induce brain inflammation, immune cell infiltration, and mitochondrial alterations in mice [87,88,89] and deterioration of cognitive functions in healthy patients [90,91]. Conversely, consumption of the MUFA-enriched Mediterranean diet has been associated with protection against cognitive decline [92,93,94] and reduced neurological dysfunction in rodent models of AD [1,95,96,97]. However, OLI-fed pigs (high in MUFAs) showed downregulation of genes involved in neurotransmission, synaptic transmission, and nervous tissue development, which have been linked to neurological disorders [98,99]. These contradictory results are likely due to the elevated amount of olive oil in the OLI diet (>100 g/d in 20 kg pig), as short-term consumption of low doses of extra virgin olive oil (26 g/d) had a neuroprotective effect in elderly patients [92], whereas high intake of MUFAs (42 g/d) was associated with decreased learning and memory abilities in younger women [100]. Similarly, high MUFA consumption was predictive of mild cognitive impairment in 60- to 64-year-old patients assessed over 4 years [101]. It has been suggested that excessive MUFA intake may have detrimental effects on cognitive function via regulating inflammatory markers and inflammatory signaling pathways in the brain. For example, feeding mice an obesogenic diet with 45% total kcal as oleic acid instead of palmitic acid predisposed neurons and microglia towards an inflammatory phenotype ex vivo [102]. In a separate study, mice fed a high-fat diet enriched with MUFAs showed decreased learning and memory in parallel with the upregulation of interleukin 6 and TLR-MyD88-NF-κB inflammatory signaling pathways in the brain [103]. Interestingly, levels of oleic acid and expression of genes associated with inflammatory cytokines and immune response did not differ between OLI and LAR. Similarly, we did not observe changes in the FC cytokine levels or microglia activation in response to high-fat-diet intake in our previous work [9]; therefore, the etiology of brain transcriptome changes in OLI-fed pigs remains unknown. We cannot discard the possibility that these differences were due to the duration of the study or diet composition. In this regard, previous work has shown an amelioration of NAFLD following inhibition of microglia [104,105].
In addition to the degree of saturation, there is evidence to suggest that carbon chain length is a major determinant of the metabolic effects of dietary FAs in the brain. Substitution of LCFAs with MCFAs, by replacing sunflower oil with medium-chain triacylglyceride (MCT) oils, had a positive effect on cognition and markers of synapse formation in rats fed a weight-maintenance diet [106]. Similarly, isocaloric replacement of LCFAs derived from tallow by MCTs promoted cognition-improving effects in non-obese dogs [107]. Data from clinical trials also suggest that MCTs improved cognitive abilities in patients with AD [108,109]. However, a positive role for FA saturation and chain length in brain function is less clear in high-fat hypercaloric diets, with several studies resulting in negative findings associated with MCT intake. Haghikia et al. [110] reported a decrease in the integrity of the blood–brain barrier in mice fed a high-fat diet enriched with lauric acid [110]. A coconut oil high-fat diet was also found to cause neurotoxicity and impair learning and memory ability in obese mice through upregulation of inflammatory signaling pathways in brain tissue [103]. Moreover, short-term ingestion of high levels of coconut oil margarine instead of lard decreased hypothalamic serotonin in mice [111]. The results from our study demonstrate that partial replacement of lard with an isocaloric amount of coconut oil increased the expression of many remyelination genes in the FC, which are upregulated after injuries to the CNS, such as acute demyelination episodes in neurodegenerative diseases [112,113,114]. In addition, compared to LAR, the COC diet downregulated the expression of genes and enzymes involved in ECM organization, including several collagen subunits, which have also been associated with brain injury in mice [115]. Moreover, we report the accumulation of medium-chain acylcarnitines in brain tissue compared with LAR and OLI. Since coconut oil is rich in lauric acid, COC brains may have been overloaded with an excess of medium-chain FAs, resulting in incomplete FA oxidation and subsequent accumulation of lauryl-acylcarnitine in the FC [116], with potential neurotoxic effects [110]. Limitations of the current study are associated with the experimental design and analysis. Most pens in our study contained a male and a female, and therefore it was not possible to address the influence of sexual dimorphism in diet response. In addition, we did not analyze the hippocampus or hypothalamus, which are also studied in diet-induced neurodegeneration research. Finally, we did not investigate microglia and cytokines in FC tissues, as our previous work did not show changes in these parameters in response to high-fat diets.

5. Conclusions

In conclusion, our results showed a decrease in neuroprotective secondary BAs and betaine levels in the FCs of OLI and COC pigs which paralleled the severity of NAFLD, suggesting a link between liver and brain disease. In addition, we have also shown a direct effect of dietary FA composition on the expression of genes linked to brain injury, as the COC diet upregulated markers of myelin repair, whereas the OLI diet downregulated genes involved in synapse development and cell signaling. Nutritional recommendations for NAFLD patients suggest limiting fat intake and a reduction in LCFA consumption in favor of MUFAs and MCTs. While this approach has been shown to be beneficial in balanced diets, our findings do not support replacing large amounts of SFAs by MCFAs and MUFAs in high-fat hypercaloric diets, as this may have a negative effect on brain health.

Author Contributions

Conceptualization, M.A.M. and R.M.; formal analysis, M.A.M., B.D.P., M.K.A.-I. and R.M.; investigation, M.A.M., T.R.G. and R.M.; methodology, R.K.F., H.G., C.I., M.S.M., C.R.S., B.D.P., M.K.A.-I. and M.R.L.F., project administration, M.A.M.; software, H.G.; supervision, R.M. and M.A.M.; visualization, R.M.; writing—original draft preparation, R.M. and M.A.M.; writing—review and editing, all authors. All authors have read and agreed to the published version of the manuscript.

Funding

This work was supported by California State University Agriculture Research Institute (grants 58873 and 58913), California Polytechnic State University internal funding programs Baker/Koob, RSCA, Hull Graduate Assistantship and STRIDE, BiOWiSH Technologies, Hilmar Ingredients, and Acorn Seekers.

Institutional Review Board Statement

All experiments were carried out with the approval of the Institutional Animal Care and Use Committee of California State University (#1611), following guidelines issued by the National Research Council Guide for the Care and Use of Laboratory Animals.

Data Availability Statement

Datasets cannot be publicly shared due to privacy issues. They can be provided by email upon request.

Acknowledgments

We thank the Animal Science Department for making available the Veterinary Clinic and Animal Facilities, and Nolan Manning, Amber Chavez, Brooklyne Hazenberg, Emily Schube, Sadie Mae, and Alexandra Clifton for their assistance with behavioral tests.

Conflicts of Interest

The authors declare no conflict of interest.

References

  1. Mitra, S.; De, A.; Chowdhury, A. Epidemiology of non-alcoholic and alcoholic fatty liver diseases. Transl. Gastroenterol. Hepatol. 2020, 5, 16. [Google Scholar] [CrossRef] [PubMed]
  2. Nobili, V.; Alisi, A.; Newton, K.P.; Schwimmer, J.B. Comparison of the phenotype and approach to pediatric vs adult patients with nonalcoholic fatty liver disease. Gastroenterology 2016, 150, 1798–1810. [Google Scholar] [CrossRef] [PubMed]
  3. Elliott, C.; Frith, J.; Day, C.P.; Jones, D.E.; Newton, J.L. Functional impairment in alcoholic liver disease and non-alcoholic fatty liver disease is significant and persists over 3 years of follow-up. Dig. Dis. Sci. 2013, 58, 2383–2391. [Google Scholar] [CrossRef] [PubMed]
  4. Filipović, B.; Marković, O.; Durić, V.; Filipović, B. Cognitive Changes and Brain Volume Reduction in Patients with Nonalcoholic Fatty Liver Disease. Can. J. Gastroenterol. Hepatol. 2018, 2018, 9638797. [Google Scholar] [CrossRef]
  5. Seo, S.W.; Gottesman, R.F.; Clark, J.M.; Hernaez, R.; Chang, Y.; Kim, C.; Ha, K.H.; Guallar, E.; Lazo, M. Nonalcoholic fatty liver disease is associated with cognitive function in adults. Neurology 2016, 86, 1136–1142. [Google Scholar] [CrossRef]
  6. Weinstein, G.; Zelber-Sagi, S.; Preis, S.R.; Beiser, A.S.; DeCarli, C.; Speliotes, E.K.; Satizabal, C.L.; Vasan, R.S.; Seshadri, S. Association of nonalcoholic fatty liver disease with lower brain volume in healthy middle-aged adults in the Framingham Study. JAMA Neurol. 2018, 75, 97–104. [Google Scholar] [CrossRef]
  7. Bosoi, C.R.; Vandal, M.; Tournissac, M.; Leclerc, M.; Fanet, H.; Mitchell, P.L.; Verreault, M.; Trottier, J.; Virgili, J.; Tremblay, C.; et al. High-fat diet modulates hepatic amyloid β and cerebrosterol metabolism in the triple transgenic mouse model of Alzheimer’s Disease. Hepatol. Commun. 2020, 5, 446–460. [Google Scholar] [CrossRef]
  8. Kim, D.G.; Krenz, A.; Toussaint, L.E.; Maurer, K.J.; Robinson, S.A.; Yan, A.; Torres, L.; Bynoe, M.S. Non-alcoholic fatty liver disease induces signs of Alzheimer’s disease (AD) in wild-type mice and accelerates pathological signs of AD in an AD model. J. Neuroinflammation 2016, 13, 1. [Google Scholar] [CrossRef]
  9. Zeltser, N.; Meyer, I.; Hernandez, G.V.; Trahan, M.J.; Fanter, R.K.; Abo-Ismail, M.; Glanz, H.; Strand, C.R.; Burrin, D.G.; La Frano, M.R.; et al. Neurodegeneration in juvenile Iberian pigs with diet-induced nonalcoholic fatty liver disease. Am. J. Physiol. Endocrinol. Metab. 2020, 319, E592–E606. [Google Scholar] [CrossRef]
  10. MahmoudianDehkordi, S.; Arnold, M.; Nho, K.; Ahmad, S.; Jia, W.; Xie, G.; Louie, G.; Kueider-Paisley, A.; Moseley, M.A.; Thompson, J.W.; et al. Altered bile acid profile associates with cognitive impairment in Alzheimer’s disease—An emerging role for gut microbiome. Alzheimer’s Dement. 2019, 15, 76–92. [Google Scholar] [CrossRef]
  11. Nho, K.; Kueider-Paisley, A.; Ahmad, S.; MahmoudianDehkordi, S.; Arnold, M.; Risacher, S.L.; Louie, G.; Blach, C.; Baillie, R.; Han, X.; et al. Association of altered liver enzymes with Alzheimer disease diagnosis, cognition, neuroimaging measures, and cerebrospinal fluid biomarkers. JAMA Netw. 2019, 2, e197978. [Google Scholar] [CrossRef]
  12. Pasquier, F.; Boulogne, A.; Leys, D.; Fontaine, P. Diabetes mellitus and dementia. Diabetes Metab. 2006, 32, 403–414. [Google Scholar] [CrossRef]
  13. Barnard, N.D.; Bunner, A.E.; Agarwal, U. Saturated and trans fats and dementia: A systematic review. Neurobiol. Aging 2014, 35 (Suppl. S2), S65–S73. [Google Scholar] [CrossRef]
  14. Ruan, Y.; Tang, J.; Guo, X.; Li, K.; Li, D. Dietary fat intake and risk of Alzheimer’s disease and dementia: A meta-analysis of cohort studies. Curr. Alzheimer Res. 2018, 15, 869–876. [Google Scholar] [CrossRef] [PubMed]
  15. Gomez-Pinilla, F. Brain foods: The effects of nutrients on brain function. Nat. Rev. Neurosci. 2008, 9, 568–578. [Google Scholar] [CrossRef]
  16. Spencer, S.J.; Korosi, A.; Laye, S.; Shukitt-Hale, B.; Barrientos, R.M. Food for thought: How nutrition impacts cognition and emotion. NPJ Sci. Food 2017, 1, 7. [Google Scholar] [CrossRef]
  17. Meeusen, R. Exercise, Nutrition and the Brain. Sports Med. 2014, 44, 47–56. [Google Scholar] [CrossRef] [PubMed]
  18. Molina, T.L.; Stoll, B.; Mohammad, M.; Mohila, C.A.; Call, L.; Cui, L.; Guthrie, G.; Kunichoff, D.; Lin, S.; Welch-Jernigan, R.; et al. New generation lipid emulsions increase brain DHA and improve body composition, but not short-term neurodevelopment in parenterally-fed preterm piglets. Brain Behav. Immun. 2020, 85, 46–56. [Google Scholar] [CrossRef] [PubMed]
  19. Quinn, M.; McMillin, M.; Galindo, C.; Frampton, G.; Pae, H.Y.; DeMorrow, S. Bile acids permeabilize the blood brain barrier after bile duct ligation in rats via Rac1-dependent mechanisms. Dig. Liver Dis. 2014, 46, 527–534. [Google Scholar] [CrossRef]
  20. Greenwood, J.; Adu, J.; Davey, A.J.; Abbott, N.J.; Bradbury, M.W.B. The effect of bile salts on the permeability and ultrastructure of the perfused, energy-depleted, rat blood-brain barrier. J. Cereb. Blood Flow Metab. 1991, 11, 644–654. [Google Scholar] [CrossRef] [Green Version]
  21. Wahler, J.B.; Swain, M.G.; Carson, R.; Bergasa, N.V.; Jones, E.A. Blood-brain barrier permeability is markedly decreased in cholestasis in the rat. Hepatology 1993, 6, 1103–1108. [Google Scholar] [CrossRef]
  22. McMillin, M.; Frampton, G.; Quinn, M.; Ashfaq, S.; De Los Santos, M.; Grant, S.; DeMorrow, S. Bile acid signaling is involved in the neurological decline in a murine model of acute liver failure. Am. J. Pathol. 2016, 186, 312–323. [Google Scholar] [CrossRef]
  23. McMillin, M.; Grant, S.; Frampton, G.; Petrescu, A.D.; Kain, J.; Williams, E.; Haines, R.; Canady, L.; DeMorrow, S. FXR-mediated cortical cholesterol accumulation contributes to the pathogenesis of type A hepatic encephalopathy. Cell. Mol. Gastroenterol. Hepatol. 2018, 6, 47–63. [Google Scholar] [CrossRef] [PubMed]
  24. McMillin, M.; Frampton, G.; Grant, S.; Khan, S.; Diocares, J.; Petrescu, A.; Wyatt, A.; Kain, J.; Jefferson, B.; DeMorrow, S. Bile acid-mediated sphingosine-1-phosphate receptor 2 signaling promotes neuroinflammation during hepatic encephalopathy in mice. Front. Cell. Neurosci. 2017, 11, 191. [Google Scholar] [CrossRef] [PubMed]
  25. Hernandez, G.V.; Smith, V.A.; Melnyk, M.; Burd, M.A.; Sprayberry, K.A.; Edwards, M.S.; Peterson, D.G.; Bennet, D.C.; Fanter, R.K.; Columbus, D.A.; et al. Dysregulated FXR-FGF19 signaling and choline metabolism is associated with gut dysbiosis and hyperplasia in a novel pig model of pediatric NASH. Am. J. Physiol. Liver Physiol. 2020, 318, G582–G609. [Google Scholar] [CrossRef] [PubMed]
  26. Jiao, N.; Baker, S.S.; Chapa-Rodriguez, A.; Liu, W.; Nugent, C.A.; Tsompana, M.; Mastrandrea, L.; Buck, M.J.; Baker, R.D.; Genco, R.J.; et al. Suppressed hepatic bile acid signaling despite elevated production of primary and secondary bile acids in NAFLD. Gut 2018, 67, 1881–1891. [Google Scholar] [CrossRef]
  27. Puri, P.; Daita, K.; Joyce, A.; Mirshahi, F.; Santhekadur, P.K.; Cazanave, S.; Luketic, V.A.; Siddiqui, M.S.; Boyett, S.; Min, H.K.; et al. The presence and severity of nonalcoholic steatohepatitis is associated with specific changes in circulating bile acids. Hepatology 2018, 67, 534–548. [Google Scholar] [CrossRef]
  28. Liu, Z.; Zhang, Z.; Huang, M.; Sun, X.; Liu, B.; Guo, Q.; Chang, Q.; Duan, Z. Taurocholic acid is an active promoting factor, not just a biomarker of progression of liver cirrhosis, evidence from a human metabolomic study and in vitro experiments. BMC Gastroenterol. 2018, 18, 112. [Google Scholar] [CrossRef]
  29. Svegliati-Baroni, G.; Ridolfi, F.; Hannivoort, R.; Saccomanno, S.; Homan, M.; De Minicis, S.; Jansen, P.L.; Candelaresi, C.; Benedetti, A.; Moshage, H. Bile acids induce hepatic stellate cell proliferation via activation of the epidermal growth factor receptor. Gastroenterology 2005, 128, 1042–1055. [Google Scholar] [CrossRef]
  30. Xie, G.; Wang, X.; Jiang, R.; Zhao, A.; Yan, J.; Zheng, X.; Huang, F.; Liu, X.; Panee, J.; Rajani, C.; et al. Dysregulated bile acid signaling contributes to the neurological impairment in murine models of acute and chronic liver failure. EBioMedicine 2018, 37, 294–306. [Google Scholar] [CrossRef] [Green Version]
  31. Baloni, P.; Funk, C.C.; Yan, J.; Yurkovich, J.T.; Kueider-Paisley, A.; Nho, K.; Heinken, A.; Jia, W.; Mahmoudiandehkordi, S.; Louie, G.; et al. Metabolic network analysis reveals altered bile acid synthesis and metabolism in Alzheimer’s Disease. Cell Rep. Med. 2020, 1, 100138. [Google Scholar] [CrossRef] [PubMed]
  32. Marksteiner, J.; Blasko, I.; Kemmler, G.; Koal, T.; Humpel, C. Bile acid quantification of 20 plasma metabolites identifies lithocholic acid as a putative biomarker in Alzheimer’s disease. Metabolomics 2018, 14, 1. [Google Scholar] [CrossRef] [PubMed]
  33. Weiss, N.; Barbier Saint Hilaire, P.; Colsch, B.; Isnard, F.; Attala, S.; Schaefer, A.; Amador, M.D.; Rudler, M.; Lamari, F.; Sedel, F.; et al. Cerebrospinal fluid metabolomics highlights dysregulation of energy metabolism in overt hepatic encephalopathy. J. Hepatol. 2016, 65, 1120–1130. [Google Scholar] [CrossRef] [PubMed]
  34. Bazzari, F.H.; Abdallah, D.M.; El-Abhar, H.S. Chenodeoxycholic acid ameliorates AlCl3-induced Alzheimer’s disease neurotoxicity and cognitive deterioration via enhanced insulin signaling in rats. Molecules 2019, 24, 1992. [Google Scholar] [CrossRef]
  35. Bell, S.M.; Barnes, K.; Clemmens, H.; Al-Rafiah, A.R.; Al-Ofi, E.A.; Leech, V.; Bandmann, O.; Shaw, P.J.; Blackburn, D.J.; Ferraiuolo, L.; et al. Ursodeoxycholic acid improves mitochondrial function and redistributes drp1 in fibroblasts from patients with either sporadic or familial Alzheimer’s disease. J. Mol. Biol. 2018, 430, 3942–3953. [Google Scholar] [CrossRef]
  36. Rosa, A.I.; Duarte-Silva, S.; Silva-Fernandes, A.; Nunes, M.J.; Carvalho, A.N.; Rodrigues, E.; Gama, M.J.; Rodrigues, C.M.P.; Maciel, P.; Castro-Caldas, M. Tauroursodeoxycholic acid improves motor symptoms in a mouse model of parkinson’s disease. Mol. Neurobiol. 2018, 55, 9139–9155. [Google Scholar] [CrossRef] [PubMed]
  37. Bertolotti, M.; Spady, D.K.; Dietschy, J.M. Regulation of hepatic cholesterol metabolism in the rat in vivo: Effect of a synthetic fat-free diet on sterol synthesis and low-density lipoprotein transport. Biochim. Biophys. Acta 1995, 1255, 293–300. [Google Scholar] [CrossRef]
  38. Botham, K.M.; Boyd, G.S. The effect of dietary fat on bile salt synthesis in rat liver. Biochim. Biophys. Acta 1983, 752, 307–314. [Google Scholar] [CrossRef]
  39. Devkota, S.; Wang, Y.; Musch, M.W.; Leone, V.; Fehlner-Peach, H.; Nadimpalli, A.; Antonopoulos, D.A.; Jabri, B.; Chang, E.B. Dietary-fat-induced taurocholic acid promotes pathobiont expansion and colitis in Il10-/- mice. Nature 2012, 487, 104–108. [Google Scholar] [CrossRef]
  40. Goldsmith, G.A.; Hamilton, J.G.; Miller, O.N. Lowering of serum lipid concentrations: Mechanisms used by unsaturated fats, nicotinic acid, and neomycin: Excretion of sterols and bile acids. Arch. Intern. Med. 1960, 105, 512–517. [Google Scholar] [CrossRef]
  41. Haust, H.L.; Beveridge, J.M. Effect of varying type and quantity of dietary fat on the fecal excretion of bile acids in humans subsisting on formula diets. Arch. Biochem. Biophys. 1958, 78, 367–375. [Google Scholar] [CrossRef]
  42. Bisschop, P.H.; Bandsma, R.H.; Stellaard, F.; ter Harmsel, A.; Meijer, A.J.; Sauerwein, H.P.; Kuipers, F.; Romijn, J.A. Low-fat, high-carbohydrate and high-fat, low-carbohydrate diets decrease primary bile acid synthesis in humans. Am. J. Clin. Nutr. 2004, 79, 570–576. [Google Scholar] [CrossRef] [PubMed]
  43. Manjarin, R.; Dillard, K.; Coffin, M.; Hernandez, G.V.; Smith, V.A.; Noland-Liddell, T.; Gehani, T.R.; Smart, H.J.; Wheeler, K.; Sprayberry, K.A.; et al. Dietary fat composition shapes bile acid metabolism and severity of liver injury in a pig model of pediatric NAFLD. Am. J. Physiol. Endocrinol. Metab. 2022, 323, E187–E206. [Google Scholar] [CrossRef] [PubMed]
  44. National Research Council. Nutrient Requirements of Swine, 10th ed.; National Academy Press: Washington, DC, USA, 1998; pp. 110–123. [Google Scholar]
  45. De Blas, C.; Gasa, J.; Mateos, G.G. Necesidades Nutricionales Para Ganado Porcino; Normas FEDNA (2ª Edición) [Online]; Universidad Politécnica de Madrid: Madrid, Spain; Universidad Autónoma de Barcelona: Barcelona, Spain; Available online: http://www.fundacionfedna.org/sites/default/files/Normas%20PORCINO_2013rev2.pdf (accessed on 8 January 2020).
  46. Hof, P.R.; Morrison, J.H.; Cox, K. Quantitative analysis of a vulnerable subset of pyramidal neurons in Alzheimer’s disease: I. Superior frontal and inferior temporal cortex. J. Comp. Neurol. 1990, 301, 44–54. [Google Scholar] [CrossRef] [PubMed]
  47. Friard, O.; Gamba, M. BORIS: A free, versatile open-source event-logging software for video/audio coding and live observations. Methods Ecol. Evol. 2016, 7, 1325–1330. [Google Scholar] [CrossRef]
  48. Fleming, S.A.; Dilger, R.N. Young pigs exhibit differential exploratory behavior during novelty preference tasks in response to age, sex, and delay. Behav. Brain Res. 2017, 321, 50–60. [Google Scholar] [CrossRef]
  49. Gifford, A.K.; Cloutier, S.; Newberry, R.C. Objects as enrichment: Effects of object exposure time and delay interval on object recognition memory of the domestic pig. Appl. Anim. Behav. Sci. 2007, 107, 206–217. [Google Scholar] [CrossRef]
  50. Pamplona, R.; Portero-Otín, M.; Riba, D.; Ruiz, C.; Prat, J.; Bellmunt, M.J.; Barja, G. Mitochondrial membrane peroxidizability index is inversely related to maximum life span in mammals. J. Lipid Res. 1998, 39, 1989–1994. [Google Scholar] [CrossRef]
  51. Schneider, C.A.; Rasband, W.S.; Eliceiri, K.W. NIH Image to ImageJ: 25 years of image analysis. Nat. Methods 2012, 9, 671–675. [Google Scholar] [CrossRef]
  52. Townsend, M.K.; Clish, C.B.; Kraft, P.; Wu, C.; Souza, A.L.; Deik, A.A.; Tworoger, S.S.; Wolpin, B.M. Reproducibility of metabolomic profiles among men and women in 2 large cohort studies. Clin. Chem. 2013, 59, 1657–1667. [Google Scholar] [CrossRef] [Green Version]
  53. Bajad, S.U.; Lu, W.; Kimball, E.H.; Yuan, J.; Peterson, C.; Rabinowitz, J.D. Separation and quantitation of water soluble cellular metabolites by hydrophilic interaction chromatography-tandem mass spectrome-try. J. Chromatogr. A 2006, 1125, 76–88. [Google Scholar] [CrossRef] [PubMed]
  54. Rhee, E.P.; Cheng, S.; Larson, M.G.; Walford, G.A.; Lewis, G.D.; McCabe, E.; Yang, E.; Farrell, L.; Fox, C.S.; O’Donnell, C.J.; et al. Lipid profiling identifies a triacylglycerol signature of insulin resistance and improves diabetes predic-tion in humans. J. Clin. Investig. 2011, 121, 1402–1411. [Google Scholar] [CrossRef] [PubMed]
  55. Dobin, A.; Davis, C.A.; Schlesinger, F.; Drenkow, J.; Zaleski, C.; Jha, S.; Batut, P.; Chaisson, M.; Gingeras, T.R. STAR: Ultrafast universal RNA-seq aligner. Bioinformatics 2013, 29, 15–21. [Google Scholar] [CrossRef] [PubMed]
  56. Liao, Y.; Smyth, G.K.; Shi, W. featureCounts: An efficient general purpose program for assigning sequence reads to genomic features. Bioinformatics 2014, 30, 923–930. [Google Scholar] [CrossRef]
  57. Piepho, H.P. Data transformation in statistical analysis of field trials with changing treatment variance. Agron. J. 2009, 101, 865–869. [Google Scholar] [CrossRef]
  58. Manjarin, R.; Maj, M.A.; La Frano, M.R.; Glanz, H. %polynova_2way: A SAS macro for implementation of mixed models for metabolomics data. PLoS ONE 2020, 15, e0244013. [Google Scholar] [CrossRef]
  59. Troyanskaya, O.; Cantor, M.; Sherlock, G.; Brown, P.; Hastie, T.; Tibshirani, R.; Botstein, D.; Altman, R.B. Missing value estimation methods for DNA microarrays. Bioinformatics 2001, 17, 520–525. [Google Scholar] [CrossRef] [PubMed]
  60. McCarthy, D.J.; Chen, Y.; Smyth, G.K. Differential expression analysis of multifactor RNA-Seq experiments with respect to biological variation. Nucleic Acids Res. 2012, 40, 4288–4297. [Google Scholar] [CrossRef] [PubMed]
  61. Huang, D.W.; Sherman, B.T.; Lempicki, R.A. Systematic and integrative analysis of large gene lists using DAVID bioinformatics resources. Nat. Protoc. 2009, 4, 44–57. [Google Scholar] [CrossRef]
  62. Metsalu, T.; Vilo, J. ClustVis: A web tool for visualizing clustering of multivariate data using Principal Component Analysis and heatmap. Nucleic Acids Res. 2015, 43, W566–W570. [Google Scholar] [CrossRef]
  63. Lê Cao, K.A.; Martin, P.G.; Robert-Granié, C.; Besse, P. Sparse canonical methods for biological data integration: Application to a cross-platform study. BMC Bioinform. 2009, 10, 34. [Google Scholar] [CrossRef] [PubMed]
  64. González, I.; Cao, K.A.; Davis, M.J.; Déjean, S. Visualizing associations between paired ‘omics’ data sets. BioData Min. 2012, 5, 19. [Google Scholar] [CrossRef] [PubMed]
  65. Shannon, P.; Markiel, A.; Ozier, O.; Baliga, N.S.; Wang, J.T.; Ramage, D.; Amin, N.; Schwikowski, B.; Ideker, T. Cytoscape: A software environment for integrated models of biomolecular interaction networks. Genome Res. 2003, 13, 2498–2504. [Google Scholar] [CrossRef] [PubMed]
  66. Huang, F.; Pariante, C.M.; Borsini, A. From dried bear bile to molecular investigation: A systematic review of the effect of bile acids on cell apoptosis, oxidative stress and inflammation in the brain, across pre-clinical models of neurological, neurodegenerative and neuropsychiatric disorders. Brain Behav. Immun. 2022, 99, 132–146. [Google Scholar] [CrossRef] [PubMed]
  67. Karababa, A.; Groos-Sahr, K.; Albrecht, U.; Keitel, V.; Shafigullina, A.; Görg, B.; Häussinger, D. Ammonia Attenuates LPS-Induced Upregulation of Pro-Inflammatory Cytokine mRNA in Co-Cultured Astrocytes and Microglia. Neurochem. Res. 2017, 42, 737–749. [Google Scholar] [CrossRef] [PubMed]
  68. Li, C.X.; Wang, X.Q.; Cheng, F.F.; Yan, X.; Luo, J.; Wang, Q.G. Hyodeoxycholic acid protects the neurovascular unit against oxygen-glucose deprivation and reoxygenation-induced injury in vitro. Neural Regen. Res. 2019, 14, 1941–1949. [Google Scholar]
  69. Mueller, M.; Thorell, A.; Claudel, T.; Jha, P.; Koefeler, H.; Lackner, C.; Hoesel, B.; Fauler, G.; Stojakovic, T.; Einarsson, C.; et al. Ursodeoxycholic acid exerts farnesoid X receptor-antagonistic effects on bile acid and lipid metabolism in morbid obesity. J. Hepatol. 2015, 62, 1398–1404. [Google Scholar] [CrossRef]
  70. Palmela, I.; Correia, L.; Silva, R.F.; Sasaki, H.; Kim, K.S.; Brites, D.; Brito, M.A. Hydrophilic bile acids protect human blood-brain barrier endothelial cells from disruption by unconjugated bilirubin: An in vitro study. Front. Neurosci. 2015, 9, 80. [Google Scholar] [CrossRef]
  71. Pan, X.; Elliott, C.T.; McGuinness, B.; Passmore, P.; Kehoe, P.G.; Hölscher, C.; McClean, P.L.; Graham, S.F.; Green, B.D. Metabolomic Profiling of Bile Acids in Clinical and Experimental Samples of Alzheimer’s Disease. Metabolites 2017, 7, 28. [Google Scholar] [CrossRef]
  72. Parry, G.J.; Rodrigues, C.M.; Aranha, M.M.; Hilbert, S.J.; Davey, C.; Kelkar, P.; Low, W.C.; Steer, C.J. Safety, tolerability, and cerebrospinal fluid penetration of ursodeoxycholic Acid in patients with amyotrophic lateral sclerosis. Clin. Neuropharmacol. 2010, 33, 17–21. [Google Scholar] [CrossRef]
  73. Pai, R.; French, D.; Ma, N.; Hotzel, K.; Plise, E.; Salphati, L.; Setchell, K.D.; Ware, J.; Lauriault, V.; Schutt, L.; et al. Antibody-mediated inhibition of fibroblast growth factor 19 results in increased bile acids synthesis and ileal malabsorption of bile acids in cynomolgus monkeys. Toxicol. Sci. 2012, 126, 446–456. [Google Scholar] [CrossRef] [PubMed] [Green Version]
  74. Gao, B.; Hagenbuch, B.; Kullak-Ublick, G.A.; Benke, D.; Aguzzi, A.; Meier, P.J. Organic anion-transporting polypeptides mediate transport of opioid peptides across blood-brain barrier. J. Pharmacol. Exp. Ther. 2000, 294, 73–79. [Google Scholar] [PubMed]
  75. Maeda, K.; Kambara, M.; Tian, Y.; Hofmann, A.F.; Sugiyama, Y. Uptake of ursodeoxycholate and its conjugates by human hepatocytes: Role of Na(+)-taurocholate cotransporting polypeptide (NTCP), organic anion transporting polypeptide (OATP) 1B1 (OATP-C), and oatp1B3 (OATP8). Mol. Pharm. 2006, 3, 70–77. [Google Scholar] [CrossRef]
  76. Dayon, L.; Guiraud, S.P.; Corthésy, J.; Da Silva, L.; Migliavacca, E.; Tautvydaitė, D.; Oikonomidi, A.; Moullet, B.; Henry, H.; Métairon, S.; et al. One-carbon metabolism, cognitive impairment and CSF measures of Alzheimer pathology: Homocysteine and beyond. Alzheimer’s Res. Ther. 2017, 9, 43. [Google Scholar] [CrossRef] [PubMed]
  77. Griffin, J.W.; Bradshaw, P.C. Amino Acid Catabolism in Alzheimer’s Disease Brain: Friend or Foe? Oxid. Med. Cell. Longev. 2017, 2017, 5472792. [Google Scholar] [CrossRef]
  78. Zhang, M.; Cheng, X.; Dang, R.; Zhang, W.; Zhang, J.; Yao, Z. Lactate deficit in an Alzheimer Disease mouse model: The relationship with neuronal damage. J. Neuropathol. Exp. Neurol. 2018, 77, 1163–1176. [Google Scholar] [CrossRef]
  79. Conway, M.E. Alzheimer’s disease: Targeting the glutamatergic system. Biogerontology 2020, 21, 257–274. [Google Scholar] [CrossRef]
  80. Balez, R.; Ooi, L. Getting to NO Alzheimer’s Disease: Neuroprotection versus neurotoxicity mediated by nitric oxide. Oxid. Med. Cell. Longev. 2016, 2016, 3806157. [Google Scholar] [CrossRef]
  81. Kuiper, M.A.; Teerlink, T.; Visser, J.J.; Bergmans, P.L.; Scheltens, P.; Wolters, E.C. L-glutamate, L-arginine and L-citrulline levels in cerebrospinal fluid of Parkinson’s disease, multiple system atrophy, and Alzheimer’s disease patients. J. Neural Transm. 2000, 107, 183–189. [Google Scholar] [CrossRef]
  82. Jadavji, N.M.; Deng, L.; Leclerc, D.; Malysheva, O.; Bedell, B.J.; Caudill, M.A.; Rozen, R. Severe methylenetetrahydrofolate reductase deficiency in mice results in behavioral anomalies with morphological and biochemical changes in hippocampus. Mol. Genet. Metab. 2012, 106, 149–159. [Google Scholar] [CrossRef]
  83. Ueland, P.M. Choline and betaine in health and disease. J. Inherit. Metab. Dis. 2011, 34, 3–15. [Google Scholar] [CrossRef] [PubMed]
  84. Mudd, A.T.; Getty, C.M.; Sutton, B.P.; Dilger, R.N. Perinatal choline deficiency delays brain development and alters metabolite concentrations in the young pig. Nutr. Neurosci. 2016, 19, 425–433. [Google Scholar] [CrossRef] [PubMed]
  85. Niculescu, M.D.; Craciunescu, C.N.; Zeisel, S.H. Dietary choline deficiency alters global and gene-specific DNA methylation in the developing hippocampus of mouse fetal brains. FASEB J. 2006, 20, 43–49. [Google Scholar] [CrossRef]
  86. Zeisel, S.H. Choline: An important nutrient in brain development, liver function and carcinogenesis. J. Am. Coll. Nutr. 1992, 5, 473–481. [Google Scholar] [CrossRef] [PubMed]
  87. Buckman, L.B.; Hasty, A.H.; Flaherty, D.K.; Buckman, C.T.; Thompson, M.M.; Matlock, B.K.; Weller, K.; Ellacott, K.L. Obesity induced by a high-fat diet is associated with increased immune cell entry into the central nervous system. Brain Behav. Immun. 2014, 35, 33–42. [Google Scholar] [CrossRef] [PubMed]
  88. Milanski, M.; Degasperi, G.; Coope, A.; Morari, J.; Denis, R.; Cintra, D.E.; Tsukumo, D.M.; Anhe, G.; Amaral, M.E.; Takahashi, H.K.; et al. Saturated fatty acids produce an inflammatory response predominantly through the activation of TLR4 signaling in hypothalamus: Implications for the pathogenesis of obesity. J. Neurosci. 2009, 29, 359–370. [Google Scholar] [CrossRef]
  89. Petrov, D.; Pedrós, I.; Artiach, G.; Sureda, F.X.; Barroso, E.; Pallàs, M.; Casadesús, G.; Beas-Zarate, C.; Carro, E.; Ferrer, I.; et al. High-fat diet-induced deregulation of hippocampal insulin signaling and mitochondrial homeostasis deficiencies contribute to Alzheimer disease pathology in rodents. Biochim. Biophys. Acta 2015, 1852, 1687–1699. [Google Scholar] [CrossRef]
  90. Francis, H.M.; Stevenson, R.J. Higher reported saturated fat and refined sugar intake is associated with reduced hippocampal-dependent memory and sensitivity to interoceptive signals. Behav. Neurosci. 2011, 125, 943–955. [Google Scholar] [CrossRef]
  91. Holloway, C.J.; Cochlin, L.E.; Emmanuel, Y.; Murray, A.; Codreanu, I.; Edwards, L.M.; Szmigielski, C.; Tyler, D.J.; Knight, N.S.; Saxby, B.K.; et al. A high-fat diet impairs cardiac high-energy phosphate metabolism and cognitive function in healthy human subjects. Am. J. Clin. Nutr. 2011, 93, 748–755. [Google Scholar] [CrossRef]
  92. Mazza, E.; Fava, A.; Ferro, Y.; Rotundo, S.; Romeo, S.; Bosco, D.; Pujia, A.; Montalcini, T. Effect of the replacement of dietary vegetable oils with a low dose of extravirgin olive oil in the Mediterranean Diet on cognitive functions in the elderly. J. Transl. Med. 2018, 16, 10. [Google Scholar] [CrossRef]
  93. Scarmeas, N.; Stern, Y.; Tang, M.X.; Mayeux, R.; Luchsinger, J.A. Mediterranean diet and risk for Alzheimer’s disease. Ann. Neurol. 2006, 59, 912–921. [Google Scholar] [CrossRef] [PubMed] [Green Version]
  94. Solfrizzi, V.; Colacicco, A.M.; D’Introno, A.; Capurso, C.; Torres, F.; Rizzo, C.; Capurso, A.; Panza, F. Dietary intake of unsaturated fatty acids and age-related cognitive decline: A 8.5-year follow-up of the Italian Longitudinal Study on Aging. Neurobiol. Aging 2006, 27, 1694–1704. [Google Scholar] [CrossRef] [PubMed]
  95. Amtul, Z.; Westaway, D.; Cechetto, D.F.; Rozmahel, R.F. Oleic acid ameliorates amyloidosis in cellular and mouse models of Alzheimer’s disease. Brain Pathol. 2011, 21, 321–329. [Google Scholar] [CrossRef] [PubMed]
  96. Lauretti, E.; Iuliano, L.; Praticò, D. Extra-virgin olive oil ameliorates cognition and neuropathology of the 3xTg mice: Role of autophagy. Ann. Clin. Transl. Neurol. 2017, 4, 564–574. [Google Scholar] [CrossRef] [PubMed]
  97. Lauretti, E.; Nenov, M.; Dincer, O.; Iuliano, L.; Praticò, D. Extra virgin olive oil improves synaptic activity, short-term plasticity, memory, and neuropathology in a tauopathy model. Aging Cell. 2020, 19, e13076. [Google Scholar] [CrossRef] [PubMed]
  98. Berchtold, N.C.; Coleman, P.D.; Cribbs, D.H.; Rogers, J.; Gillen, D.L.; Cotman, C.W. Synaptic genes are extensively downregulated across multiple brain regions in normal human aging and Alzheimer’s disease. Neurobiol. Aging 2013, 34, 1653–1661. [Google Scholar] [CrossRef]
  99. Kang, H.J.; Voleti, B.; Hajszan, T.; Rajkowska, G.; Stockmeier, C.A.; Licznerski, P.; Lepack, A.; Majik, M.S.; Jeong, L.S.; Banasr, M.; et al. Decreased expression of synapse-related genes and loss of synapses in major depressive disorder. Nat. Med. 2012, 18, 1413–1417. [Google Scholar] [CrossRef] [PubMed]
  100. Gibson, E.L.; Barr, S.; Jeanes, Y.M. Habitual fat intake predicts memory function in younger women. Front. Hum. Neurosci. 2013, 7, 838. [Google Scholar] [CrossRef]
  101. Cherbuin, N.; Anstey, K.J. The Mediterranean diet is not related to cognitive change in a large prospective investigation: The PATH through Life study. Am. J. Geriatr. Psychiatry 2012, 20, 635–639. [Google Scholar] [CrossRef]
  102. Howe, A.M.; Burke, S.; O’Reilly, M.E.; McGillicuddy, F.C.; Costello, D.A. Palmitic Acid and Oleic Acid Differently Modulate TLR2-Mediated Inflammatory Responses in Microglia and Macrophages. Mol. Neurobiol. 2022, 59, 2348–2362. [Google Scholar] [CrossRef]
  103. Fan, R.; Hua, Y.; Shen, J.; Xiao, R.; Ma, W. Dietary fatty acids affect learning and memory ability via regulating inflammatory factors in obese mice. J. Nutr. Biochem. 2022, 103, 108959. [Google Scholar] [CrossRef]
  104. Kim, H.R.; Young, C.N. Inhibition of forebrain microglia ameliorates non-alcoholic fatty liver disease during obesity. FASEB J. 2022, 36. [Google Scholar] [CrossRef]
  105. Hadjihambi, A.; Konstantinou, C.; Klohs, J.; Monsorno, K.; Le Guennec, A.; Donnelly, C.; Cox, J.; Kusumbe, A.; Hosford, P.S.; Soffientini, U.; et al. Partial MCT1 invalidation protects against diet-induced non-alcoholic fatty liver disease and the associated brain dysfunction. J. Hepatol. 2022. [Google Scholar] [CrossRef] [PubMed]
  106. Wang, D.; Mitchell, E.S. Cognition and Synaptic-Plasticity Related Changes in Aged Rats Supplemented with 8- and 10-Carbon Medium Chain Triglycerides. PLoS ONE 2016, 11, e0160159. [Google Scholar] [CrossRef] [PubMed]
  107. Pan, Y.; Larson, B.; Araujo, J.A.; Lau, W.; de Rivera, C.; Santana, R.; Gore, A.; Milgram, N.W. Dietary supplementation with medium-chain TAG has long-lasting cognition-enhancing effects in aged dogs. Br. J. Nutr. 2010, 103, 1746–1754. [Google Scholar] [CrossRef] [PubMed]
  108. De la Rubia Ortí, J.E.; García-Pardo, M.P.; Drehmer, E.; Sancho Cantus, D.; Julián Rochina, M.; Aguilar, M.A.; Hu Yang, I. Improvement of Main Cognitive Functions in Patients with Alzheimer’s Disease after Treatment with Coconut Oil Enriched Mediterranean Diet: A Pilot Study. J. Alzheimer’s Dis. 2018, 65, 577–587. [Google Scholar] [CrossRef]
  109. Henderson, S.T.; Poirier, J. Pharmacogenetic analysis of the effects of polymorphisms in APOE, IDE and IL1B on a ketone body based therapeutic on cognition in mild to moderate Alzheimer’s disease; a randomized, double-blind, placebo-controlled study. BMC Med. Genet. 2011, 12, 137. [Google Scholar] [CrossRef]
  110. Haghikia, A.; Jörg, S.; Duscha, A.; Berg, J.; Manzel, A.; Waschbisch, A.; Hammer, A.; Lee, D.H.; May, C.; Wilck, N.; et al. Dietary Fatty Acids Directly Impact Central Nervous System Autoimmunity via the Small Intestine. Immunity 2016, 44, 951–953. [Google Scholar] [CrossRef]
  111. Orosco, M.; Rouch, C.; Daugé, V. Behavioral responses to ingestion of different sources of fat. Involvement of serotonin? Behav. Brain Res. 2002, 132, 103–109. [Google Scholar] [CrossRef]
  112. Butt, A.M.; Rivera, A.D.; Fulton, D.; Azim, K. Targeting the Subventricular Zone to Promote Myelin Repair in the Aging Brain. Cells 2022, 11, 1809. [Google Scholar] [CrossRef]
  113. El Khoury, D. Study of Myelin Gene Expression in the Central Nervous System Using Real-Time PCR. Methods Mol. Biol. 2019, 2011, 659–670. [Google Scholar] [PubMed]
  114. El Waly, B.; Macchi, M.; Cayre, M.; Durbec, P. Oligodendrogenesis in the normal and pathological central nervous system. Front. Neurosci. 2014, 8, 145. [Google Scholar] [CrossRef] [PubMed]
  115. Cescon, M.; Chen, P.; Castagnaro, S.; Gregorio, I.; Bonaldo, P. Lack of collagen VI promotes neurodegeneration by impairing autophagy and inducing apoptosis during aging. Aging 2016, 8, 1083–1101. [Google Scholar] [CrossRef] [PubMed]
  116. White, C.J.; Lee, J.; Choi, J.; Chu, T.; Scafidi, S.; Wolfgang, M.J. Determining the Bioenergetic Capacity for Fatty Acid Oxidation in the Mammalian Nervous System. Mol. Cell Biol. 2020, 40, e00037-20. [Google Scholar] [CrossRef] [PubMed]
Figure 1. (A) Experimental design. (B) Timeline of activities during the 10 weeks of the study.
Brainsci 12 01193 g001
Figure 2. (A) Relative brain weight expressed as grams of brain tissue per kg of body weight. (B) Quantification of staining intensity of neuronal nuclei (NeuN) in the frontal cortex expressed as a percentage of the total area. (C) Pen activity, measured daily between d 1 and 70 of the study from 8:30 AM to 12:30 PM. Values are means ± SDs. (D) Histograms representing results for the recognition index (RI). The indexes were calculated based on the formula (time spent investigating novel object/time investigating both objects). Significant p-values for daily activity were adjusted for multiple testing with Tukey post hoc tests and expressed as a p ≤ 0.05, b p ≤ 0.05 LAR vs. COC, and c p ≤ 0.05 OLI vs. COC. p-values for one-tailed t-tests significantly different from 0.5 are expressed as * p ≤ 0.05, ** p ≤ 0.01, *** p ≤0.001. COC, coconut oil diet; LAR, lard diet; OLI, olive oil diet.
Brainsci 12 01193 g002
Figure 3. Principal component analysis of bile acids (A) and metabolites (B) in the frontal cortexes of juvenile Iberian pigs. Data were scaled to unit variance prior to PCA assessment. Two-dimensional visualizations of PCA scores are projected from their group centroids along components 1 and 2. p-, R-squared, and F-statistic values are derived from ANOVA assessed on the first principal component. Each point represents an individual pig; the color of the point denotes the diet.
Brainsci 12 01193 g003
Figure 4. (A) Total, primary, and secondary levels of BAs in the frontal cortex of juvenile Iberian pigs fed LAR (n = 5 pens), OLI (n = 5 pens), and COC (n = 5 pens) diets on day 70 of the study. (B) Abundance of individual BAs in the frontal cortex. p-values for each metabolite were calculated by one-way ANOVA and a mixed model that included diet as fixed effect, and both replicate and pen nested in diet as random effects, and further adjusted for multiple testing with the Benjamini–Hochberg procedure. Values are means ± SDs. p-values were adjusted for multiple testing with Tukey’s post hoc test. ab p ≤ 0.05, de p ≤ 0.01. CA, cholic acid; CDCA, chenodeoxycholic acid; COC, coconut oil diet; DCA, deoxycholic acid; G, glycine conjugated; HCA; hyocholic acid; HDCA, hyodeoxycholic acid; LAR, lard diet; LCA, lithocholic acid; OLI, olive oil diet; T, taurine conjugated; UDCA, ursodeoxycholic acid.
Brainsci 12 01193 g004
Figure 5. Heat map of absolute abundance of metabolites significantly altered by diet in the frontal cortexes of juvenile pigs, measured by ultra-performance liquid chromatography–tandem quadrupole mass spectrometry. Columns represent individual pigs and rows represent log2-transformed metabolites. Blue and red colors represent the row minimum and maximum values, respectively. p-values for each metabolite were calculated by one-way ANOVA and a mixed model that included diet as fixed effect, and both replicate and pen nested in diet as random effects, and were adjusted for multiple testing with the Benjamini-Hochberg procedure. Values are means ± SDs. p-values were adjusted for multiple testing with Tukey´s post hoc test. a p ≤ 0.05, b p ≤ 0.05 LAR vs. COC, and c p ≤ 0.05 OLI vs. COC. COC, coconut oil diet; LAR, lard diet; OLI, olive oil diet.
Brainsci 12 01193 g005
Figure 6. (A) Multidimensional scaling diagram of FC samples indicating the groupings obtained from the multivariate analysis. (B) Functional enrichment analyses performed on differentially expressed genes at 5% FDR to identify GO terms pertaining to Biological Process, Metabolic Function, and Cellular Compartment in the frontal cortexes of juvenile Iberian pigs using the Database for Annotation, Visualization and Integrated Discovery software version 6.8. * p ≤ 0.05, ** p ≤ 0.01, *** p ≤ 0.001. COC, coconut oil diet; FDR, false discovery rate; LAR, lard diet; OLI, olive oil diet.
Brainsci 12 01193 g006
Figure 7. Heat maps of differentially expressed genes (5% FDR) between LAR and COC (A) and LAR and OLI (B) in the frontal cortex of juvenile Iberian pigs on d 70 of the study. RNA libraries were sequenced using a 2 × 150 bp Paired-End configuration of the Illumina HiSeq 4000 system on two flow cell lanes. The read counts were normalized using the trimmed means of M values (TMM) method implemented in edgeR and then analyzed with a generalized linear model, with an assumption of a negative binomial distribution. Columns represent individual pigs and rows represent log-transformed read counts per million for each gene. Blue and red colors represent the row minimum and maximum values, respectively. COC, coconut oil diet; FDR, false discovery rate; LAR, lard diet; OLI, olive oil diet.
Brainsci 12 01193 g007
Figure 8. Associations between differentially expressed genes (DEGs) and bile acids (A) and metabolites (B) in the frontal cortexes of juvenile Iberian pigs fed LAR (n = 5 pens), OLI (n = 5 pens), and COC (n = 5 pens) diets on day 70 of the study. Network displays robust approximations of Pearson’s correlations using sparse partial least square (sPLS) with LASSO penalization. Orange and blue edges represent positive and negative correlations, respectively.
Brainsci 12 01193 g008
Table 1. Ethograms for novel object recognition test and pig activity in the home pens.
BehaviorDescription
Pig activity
 StandingBoth pigs in the pen are standing on four legs
 RestingBoth pigs in the pen are lying down on the floor
 Standing/restingOne pig is standing and one pig is lying down
Novel object recognition test
 Learning phase
  Sample Object IPig exploring sample object on left side
  Sample Object IIPig exploring sample object on right side
 Memory phase
  Sample ObjectPig exploring sample object on left side
  Novel ObjectPig exploring novel object on right side
Table 2. Serum biochemistry and quantitative assessment of hepatic histology in juvenile Iberian pigs fed LAR, OLI, and COC diets for 10 consecutive weeks. COC, coconut oil diet; LAR, lard diet; OLI, olive oil diet.
Item 1LAROLICOC
Nº pigs (pen)10 (5)10 (5)10 (5)
Sex (M/F)6/47/36/4
Liver histology 2
 Steatosis2.90 a ± 0.323.40 ab ± 0.523.50 b ± 0.53
 Ballooning0 ± 00.40 ± 0.520.30 ± 0.48
 Mallory–Denk Bodies0.10 ± 0.320.20 ± 0.420.30 ± 0.48
 Inflammation1.20 ± 0.421.20 ± 0.421.33 ± 0.42
 Necrosis0 d ± 01.00 e ± 0.470.70 e ± 0.58
 Ki67+ cells 38.23 a ± 3.459.56 ab ± 3.2314.7 b ± 6.85
 Composite lesion score4.20 d ± 0.426.20 e ± 1.236.00 e ± 0.82
Serum biochemistry
 Alanine aminotransferase, U·L−134.3 a ± 3.570.6 b ± 18.062.2 b ± 40.4
 Aspartate aminotransferase, U·L−165.7 ± 48.5180.5 ± 75.6199.6 ± 149.2
 Alkaline phosphatase, U·L−1292.6 ± 80.7387.7 ± 120.8391.6 ± 149.2
 γ-glutamyl transferase, U·L−133.3 a ± 9.937.3 ab ± 4.856.8 b ± 29.4
 Lactate dehydrogenase, U·L−11819.8 a ± 1078.33986.5 b ± 829.13114.2 b ± 1492.7
 Total bilirubin, mg·dL−10.04 ± 0.040.02 ± 0.020.05 ± 0.03
1 Data are means ± SDs. 2 Steatosis: 0 (absent), 1 (<10%), 2 (10–25%), 3 (26–50%), 4 (>50%); ballooning, Mallory–Denk Bodies, fibrosis, inflammation, and necrosis: 0 (absent), 1 (minimal), 2 (mild), 3 (moderate), 4 (severe); composite lesion score: sum of all histological scores. 3 Ki67+: percentage of proliferative cells in liver. p-values were calculated by one-way ANOVA and adjusted by post hoc Tukey test. Labeled means without a common letter differ: abc p ≤ 0.05, def p ≤ 0.01.
Table 3. Fatty acid (FA) compositions in the frontal cortexes of pigs fed LAR, OLI, and COC diets. Samples were analyzed by gas chromatography and values expressed as absolute FA composition. Values are means ± SDs. COC, coconut oil diet; FA, fatty acid; LAR, lard diet; LCFA, long-chain FA; MCFA, medium chain FA; OLI, olive oil diet; SFA, saturated FA; UFA, unsaturated FA; MUFA, monounsaturated FA; PUFA, polyunsaturated FA; VLCFA, very-long-chain FA.
LAROLICOC
FAs
CaprylicC8:0515.8 ± 77.2514.1 ± 69.3497.5 ± 56.3
MyristicC14:0620.1 ± 63.0621.6 ± 76.8664.0 ± 35.3
PentanedecanoicC15:1 (n-5)1122.3 ± 206.41134.8 ± 125.11267.1 ± 259.2
PalmiticC16:07705.1 ± 721.17741.0 ± 520.67935.6 ± 774.3
PalmitoleicC16:1 (n-7)587.2 ± 49.0585.8 ± 49.1591.7 ± 38.8
HeptadecanoicC17:0371.8 ± 32.9392.8 ± 84.2357.8 ± 27.7
HeptadecenoicC17:1 (n-7)302.1 ± 22.8309.5 ± 45.9295.5 ± 29.5
StearicC18:07470.6 ± 930.57277.3 ± 678.87682.3 ± 1207.3
OleicC18:1 (n-9)6305.8 ± 493.66572.8 ± 769.56559.4 ± 1388.3
LinoleicC18:2 (n-6)473.1 ± 22.8472.5 ± 78.2449.2 ± 41.9
ArachidicC20:0617.2 ± 87.8576.8 ± 67.6559.1 ± 35.4
EicosenoicC20:1 (n-9)478.3 ± 37.6469.9 ± 43.3449.4 ± 49.2
EicosadienoicC20:2 (n-6)524.7 ± 74.2573.9 ± 58.4578.6 ± 78.3
HeneicosanoicC21:0323.5 ± 27.9305.5 ± 20.1323.8 ± 60.0
EicosatrienoicC20:3 (n-6)396.6 ± 35.0422.0 ± 70.8421.3 ± 93.6
ArachidonicC20:4 (n-6)4119.0 ± 376.64228.3 ± 234.04224.5 ± 591.4
BehenicC22:0600.9 ± 109.3534.0 ± 112.8493.6 ± 68.5
ErucicC22:1 (n-9)182.5 ± 11.8167.9 ± 21.4238.6 ± 109.4
NervonicC24:1 (n-9)2583.2 ± 362.12581.6 ± 129.02578.5 ± 416.4
Length of FAs
 MCFAsC6-12515.8 ± 77.2514.1 ± 69.3497.5 ± 56.3
 LCFAs C13-2131,102.3 ± 2368.631,041.9 ± 2624.930,955.5 ± 4997.8
 VLCFAsC22-243205.6 ± 391.52982.6 ± 373.42926.3 ± 379.2
Saturation of FAs
 Saturated 17,860.2 ± 1619.517,180.1 ± 1555.117,807.1 ± 2266.9
 Unsaturated 16,963.5 ± 1182.317,358.5 ± 1229.716,572.3 ± 3217.1
  MUFAs 11,450.2 ± 895.811,661.8 ± 1004.310,898.6 ± 2934.4
  PUFAs 5513.3 ± 357.05696.7 ± 292.55673.7 ± 575.2
 Ratio Sat/Unsat 1.1 ± 0.11.0 ± 0.01.1 ± 0.2
Publisher’s Note: MDPI stays neutral with regard to jurisdictional claims in published maps and institutional affiliations.

