
Effects of Transcranial Direct Current Stimulation over the Supplementary Motor Area Combined with Walking on the Intramuscular Coherence of the Tibialis Anterior in a Subacute Post-Stroke Patient: A Single-Case Study

 ,
,
Abstract
:1. Introduction
2. Materials and Methods
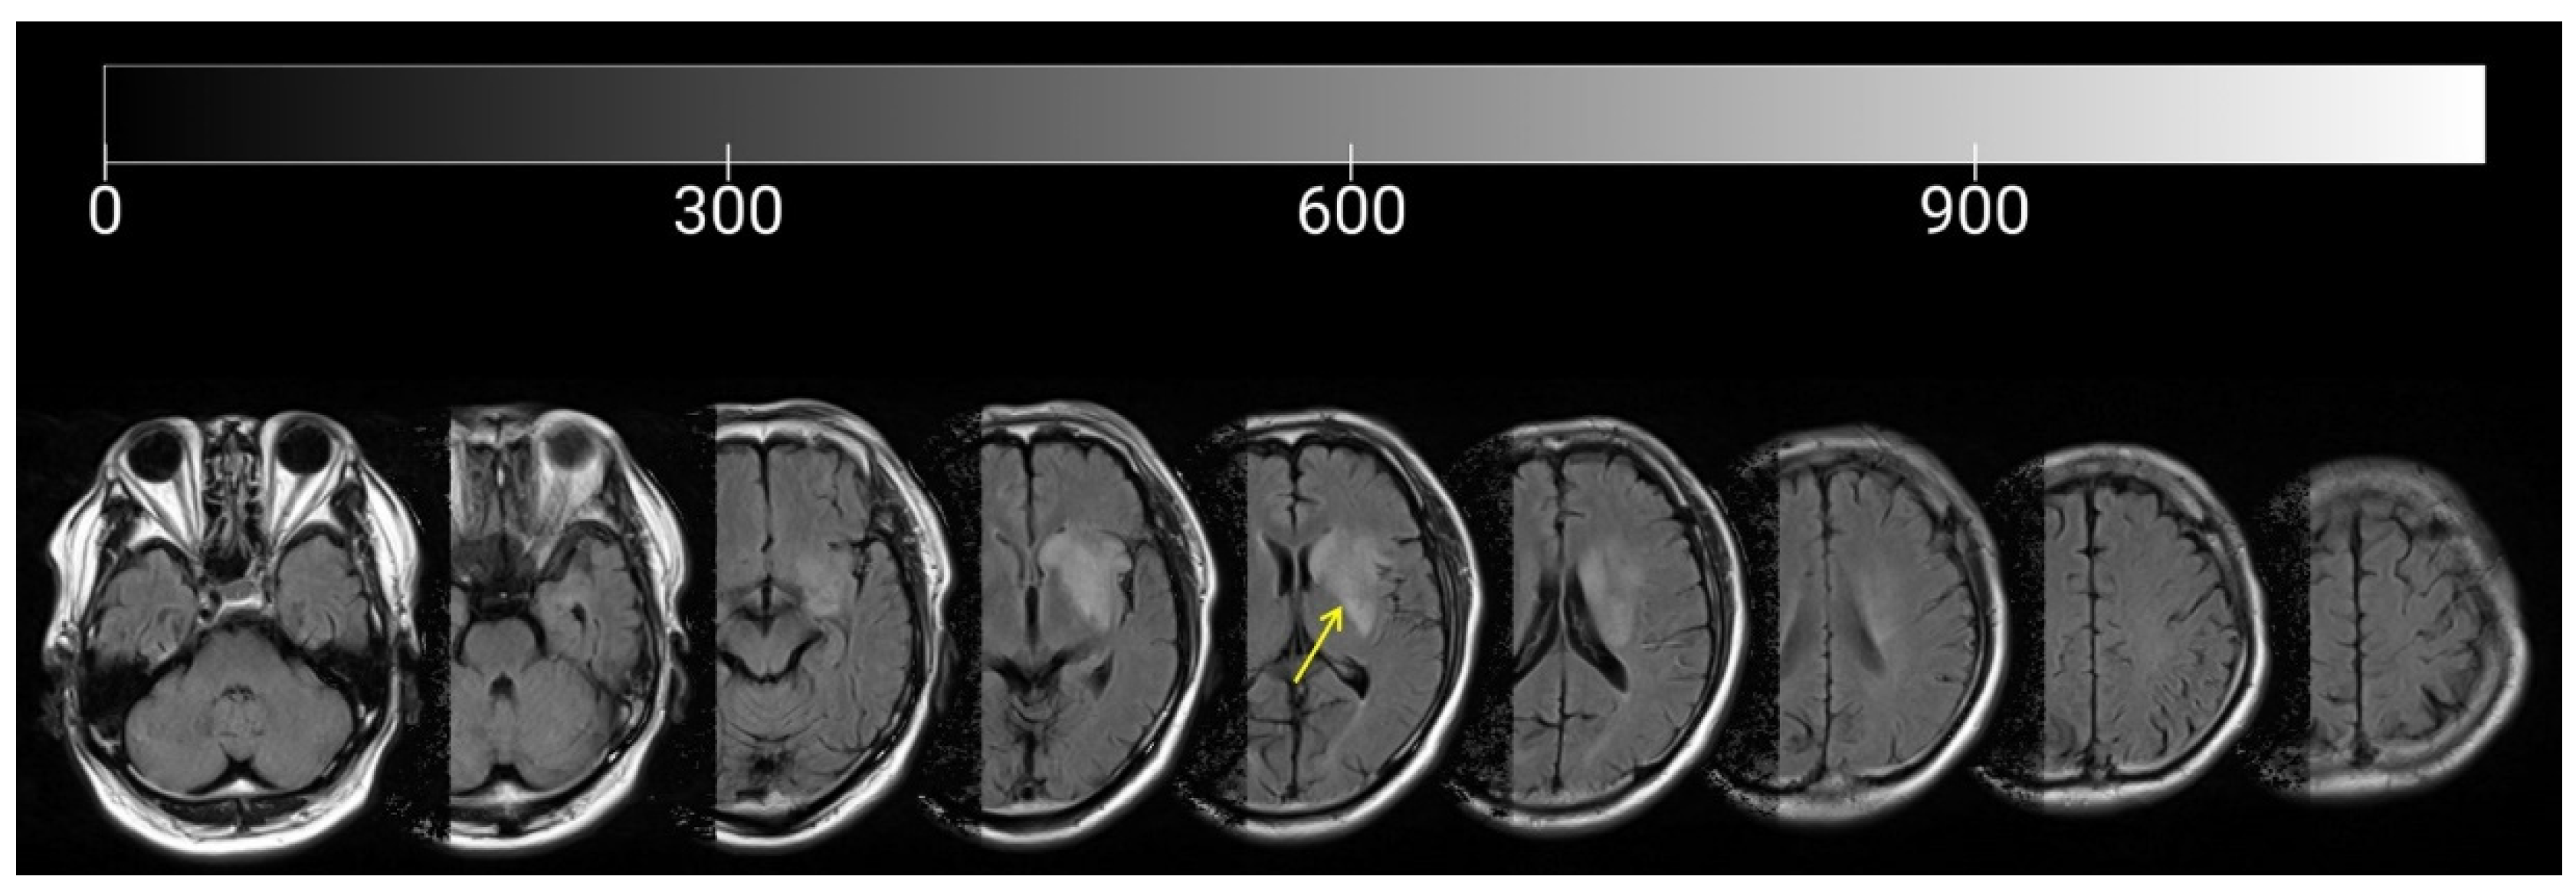
2.1. Participant
2.2. Experimental Design and Procedure
2.3. Clinical Evaluation
2.4. Evaluation of Walking and Electromyography
2.5. Data Analysis
3. Results
3.1. Clinical Evaluations
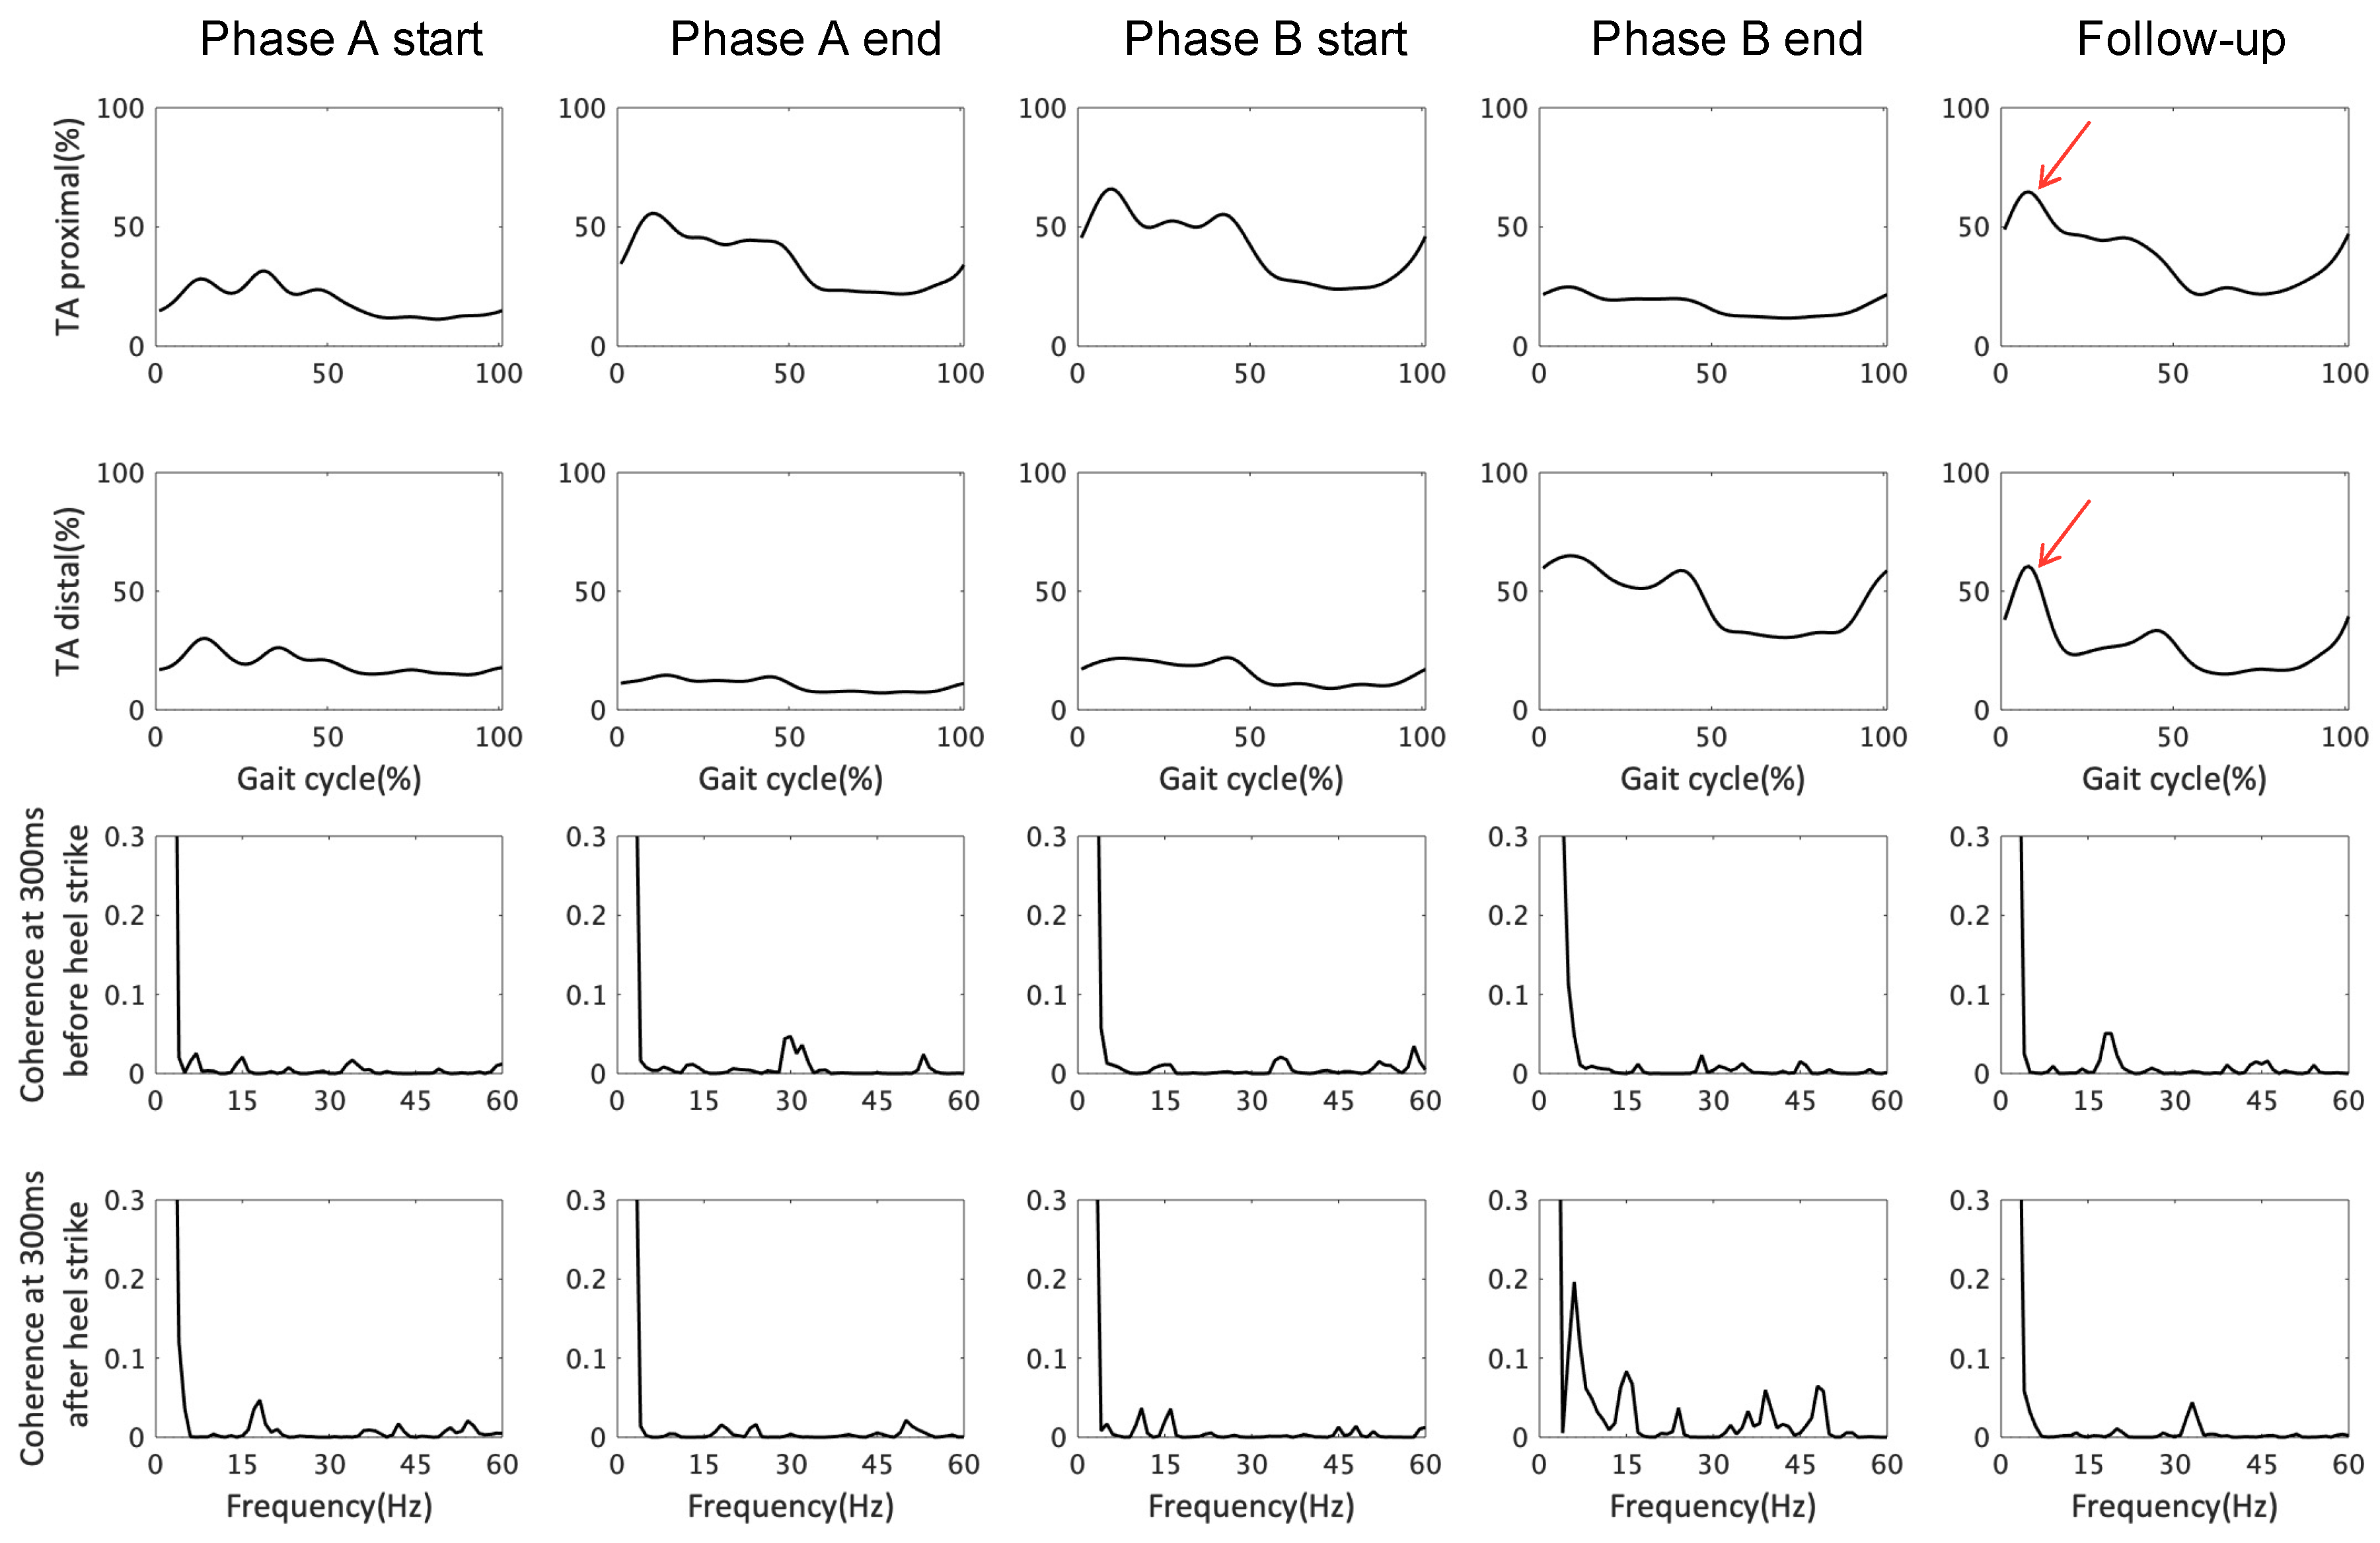
3.2. EMG Response and TA–TA Coherence in Early Stance and Late Swing
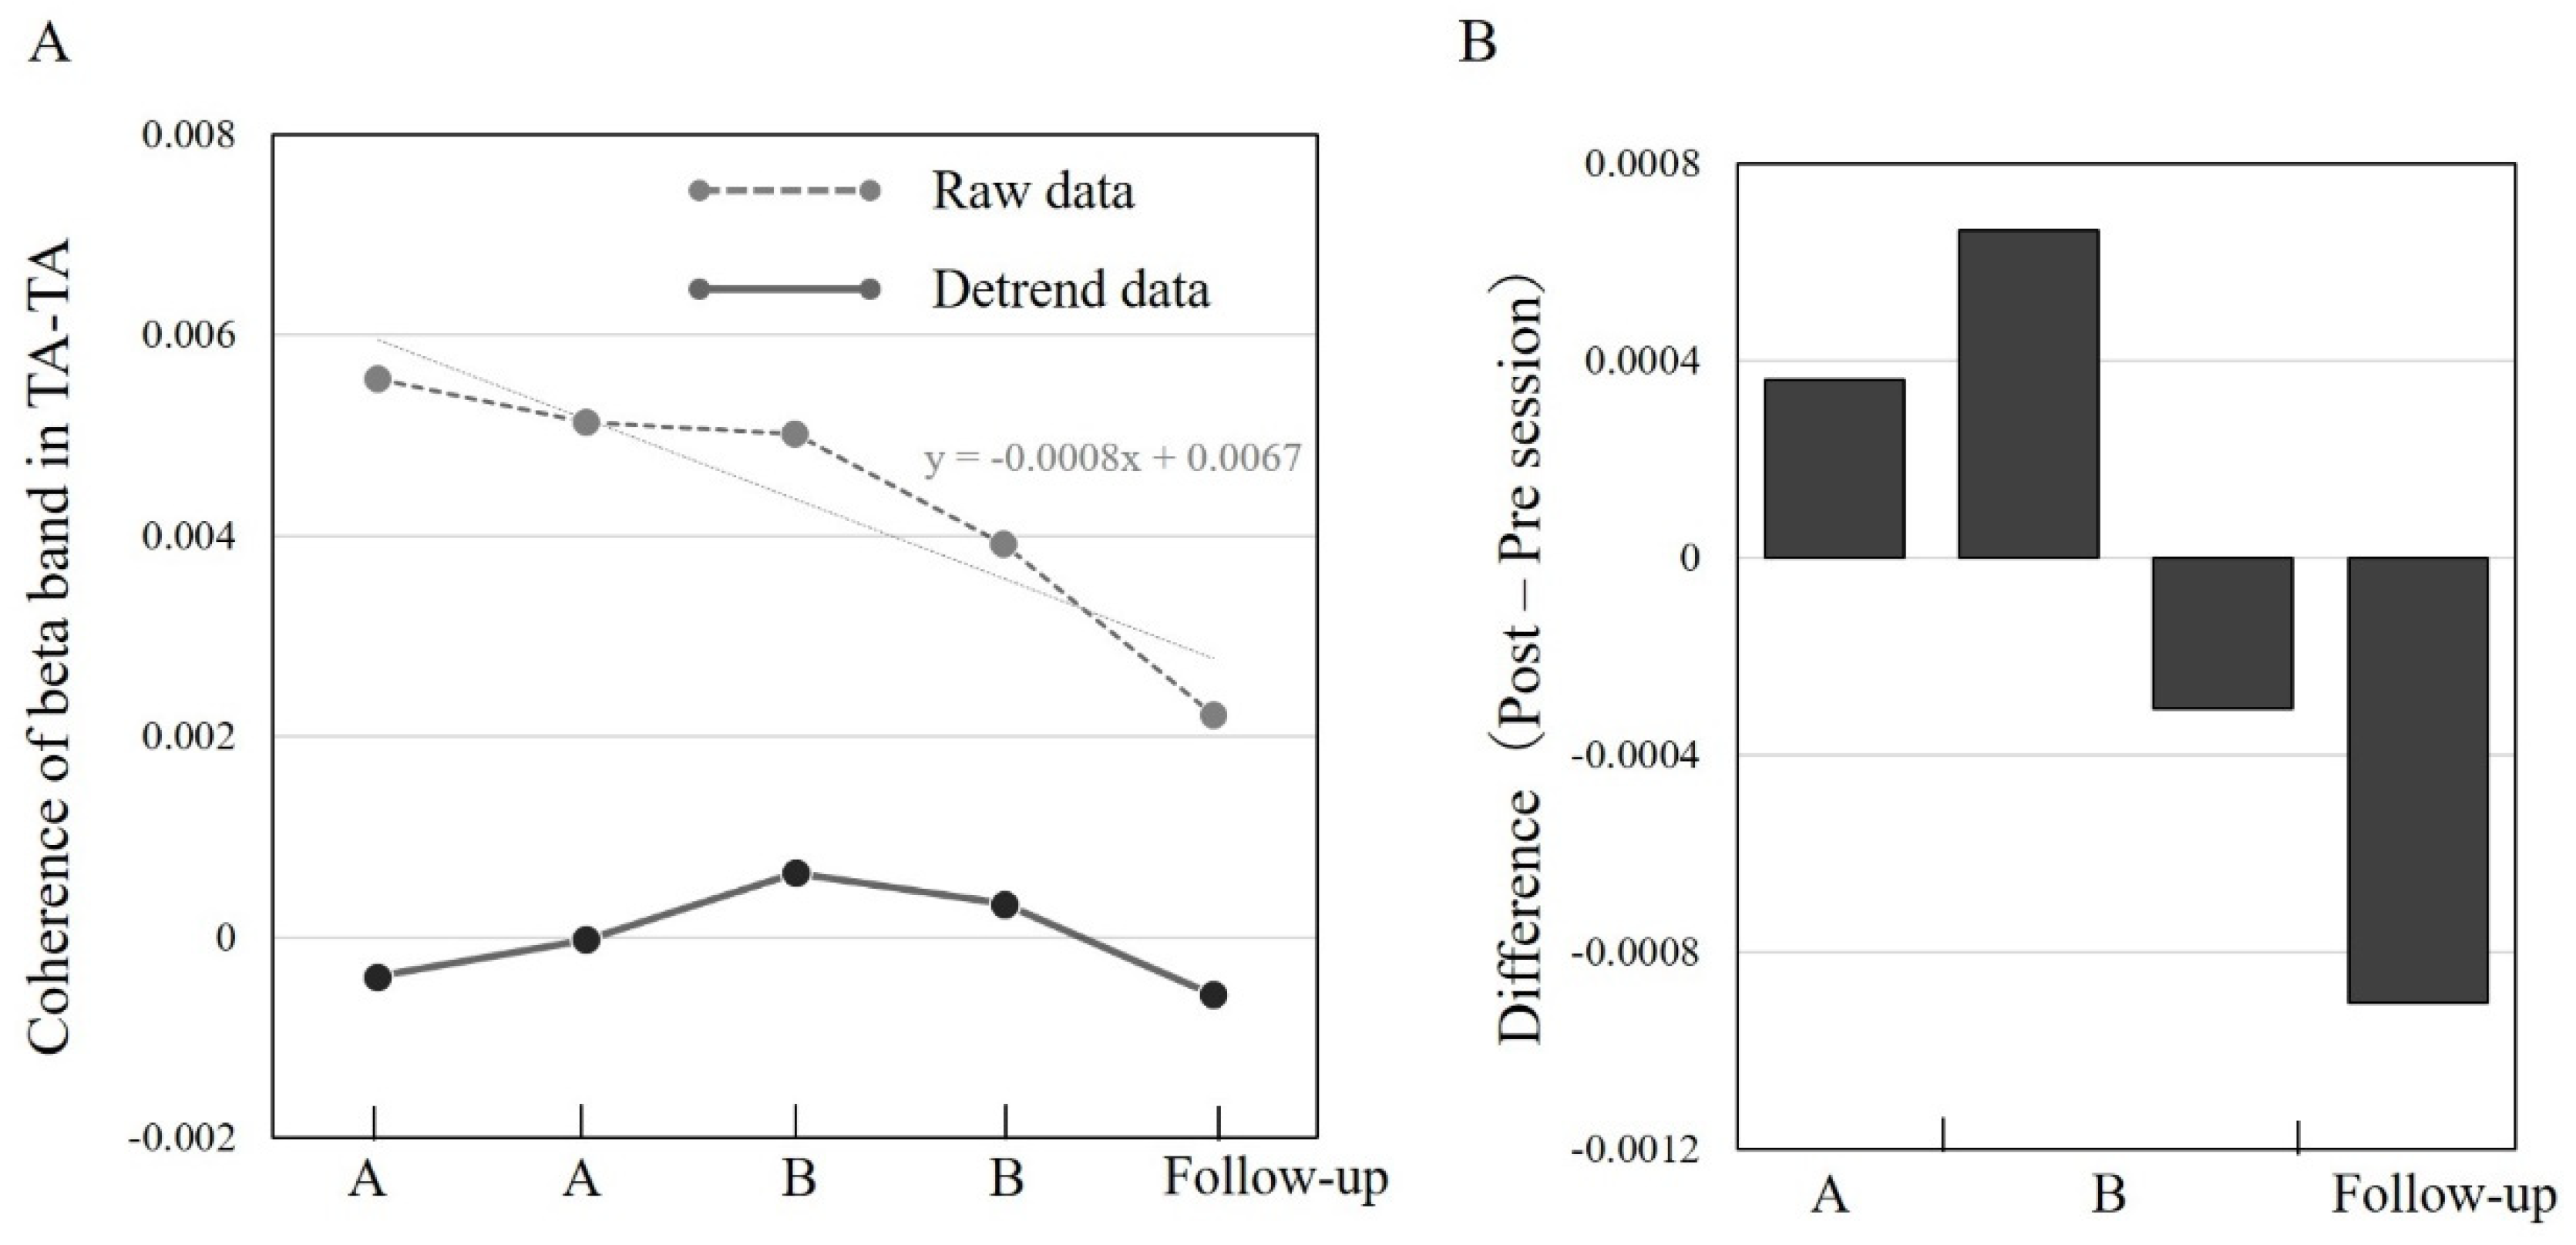
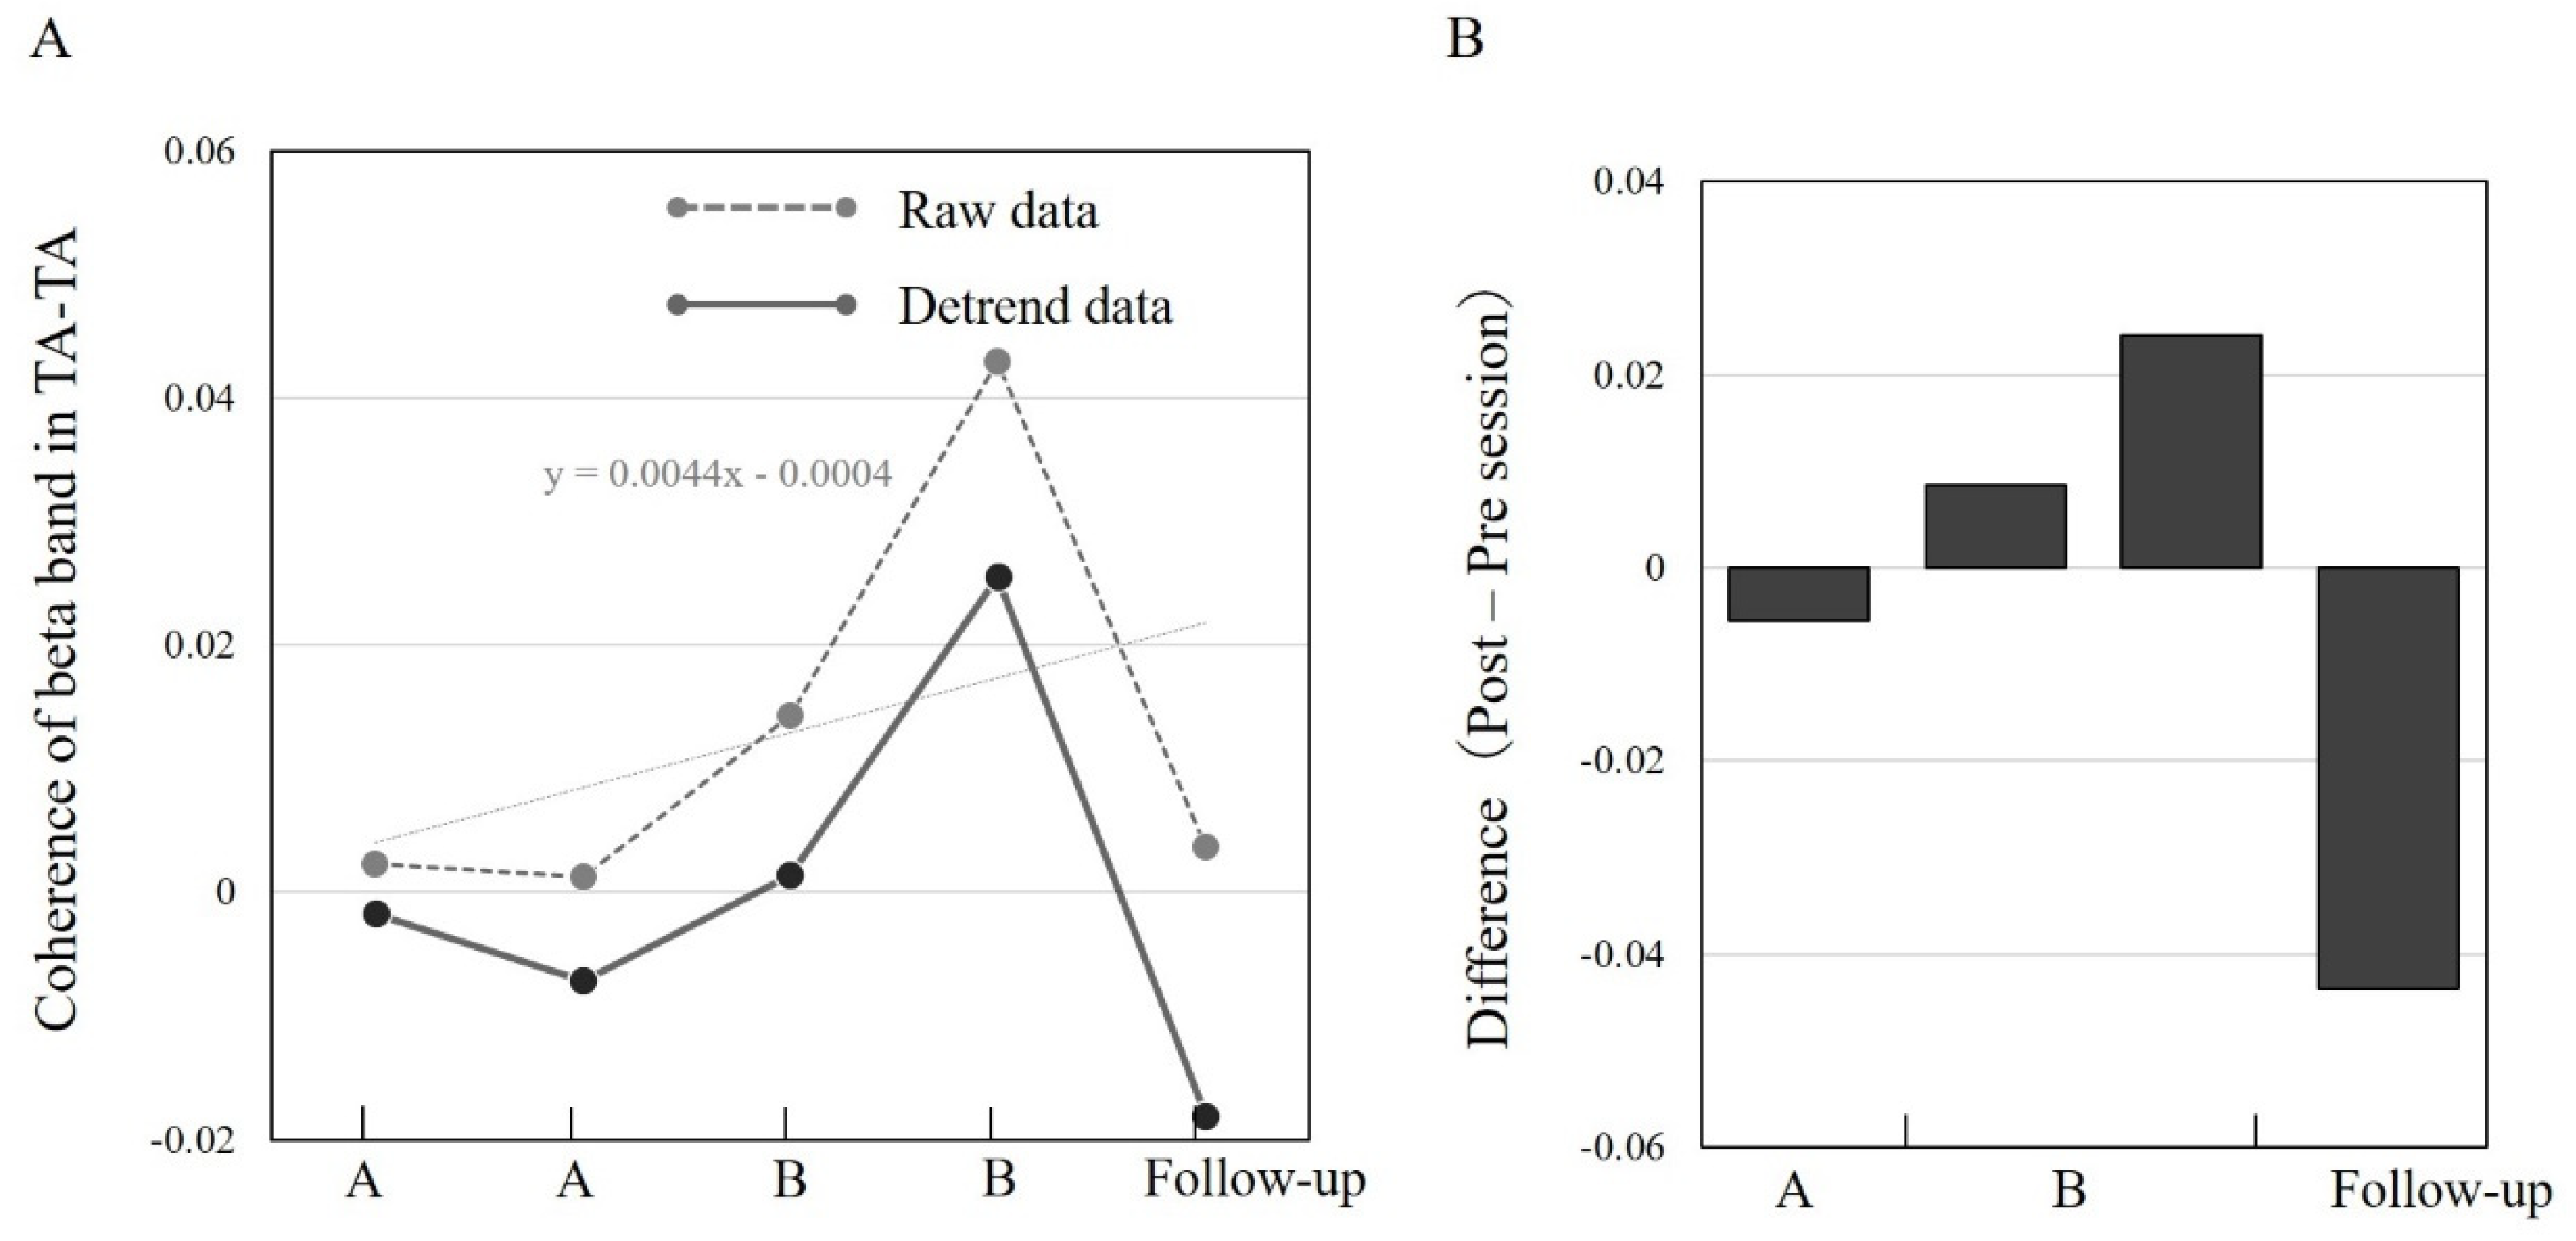
3.3. TA–TA Coherence in Different Sessions A/B and Follow-Up
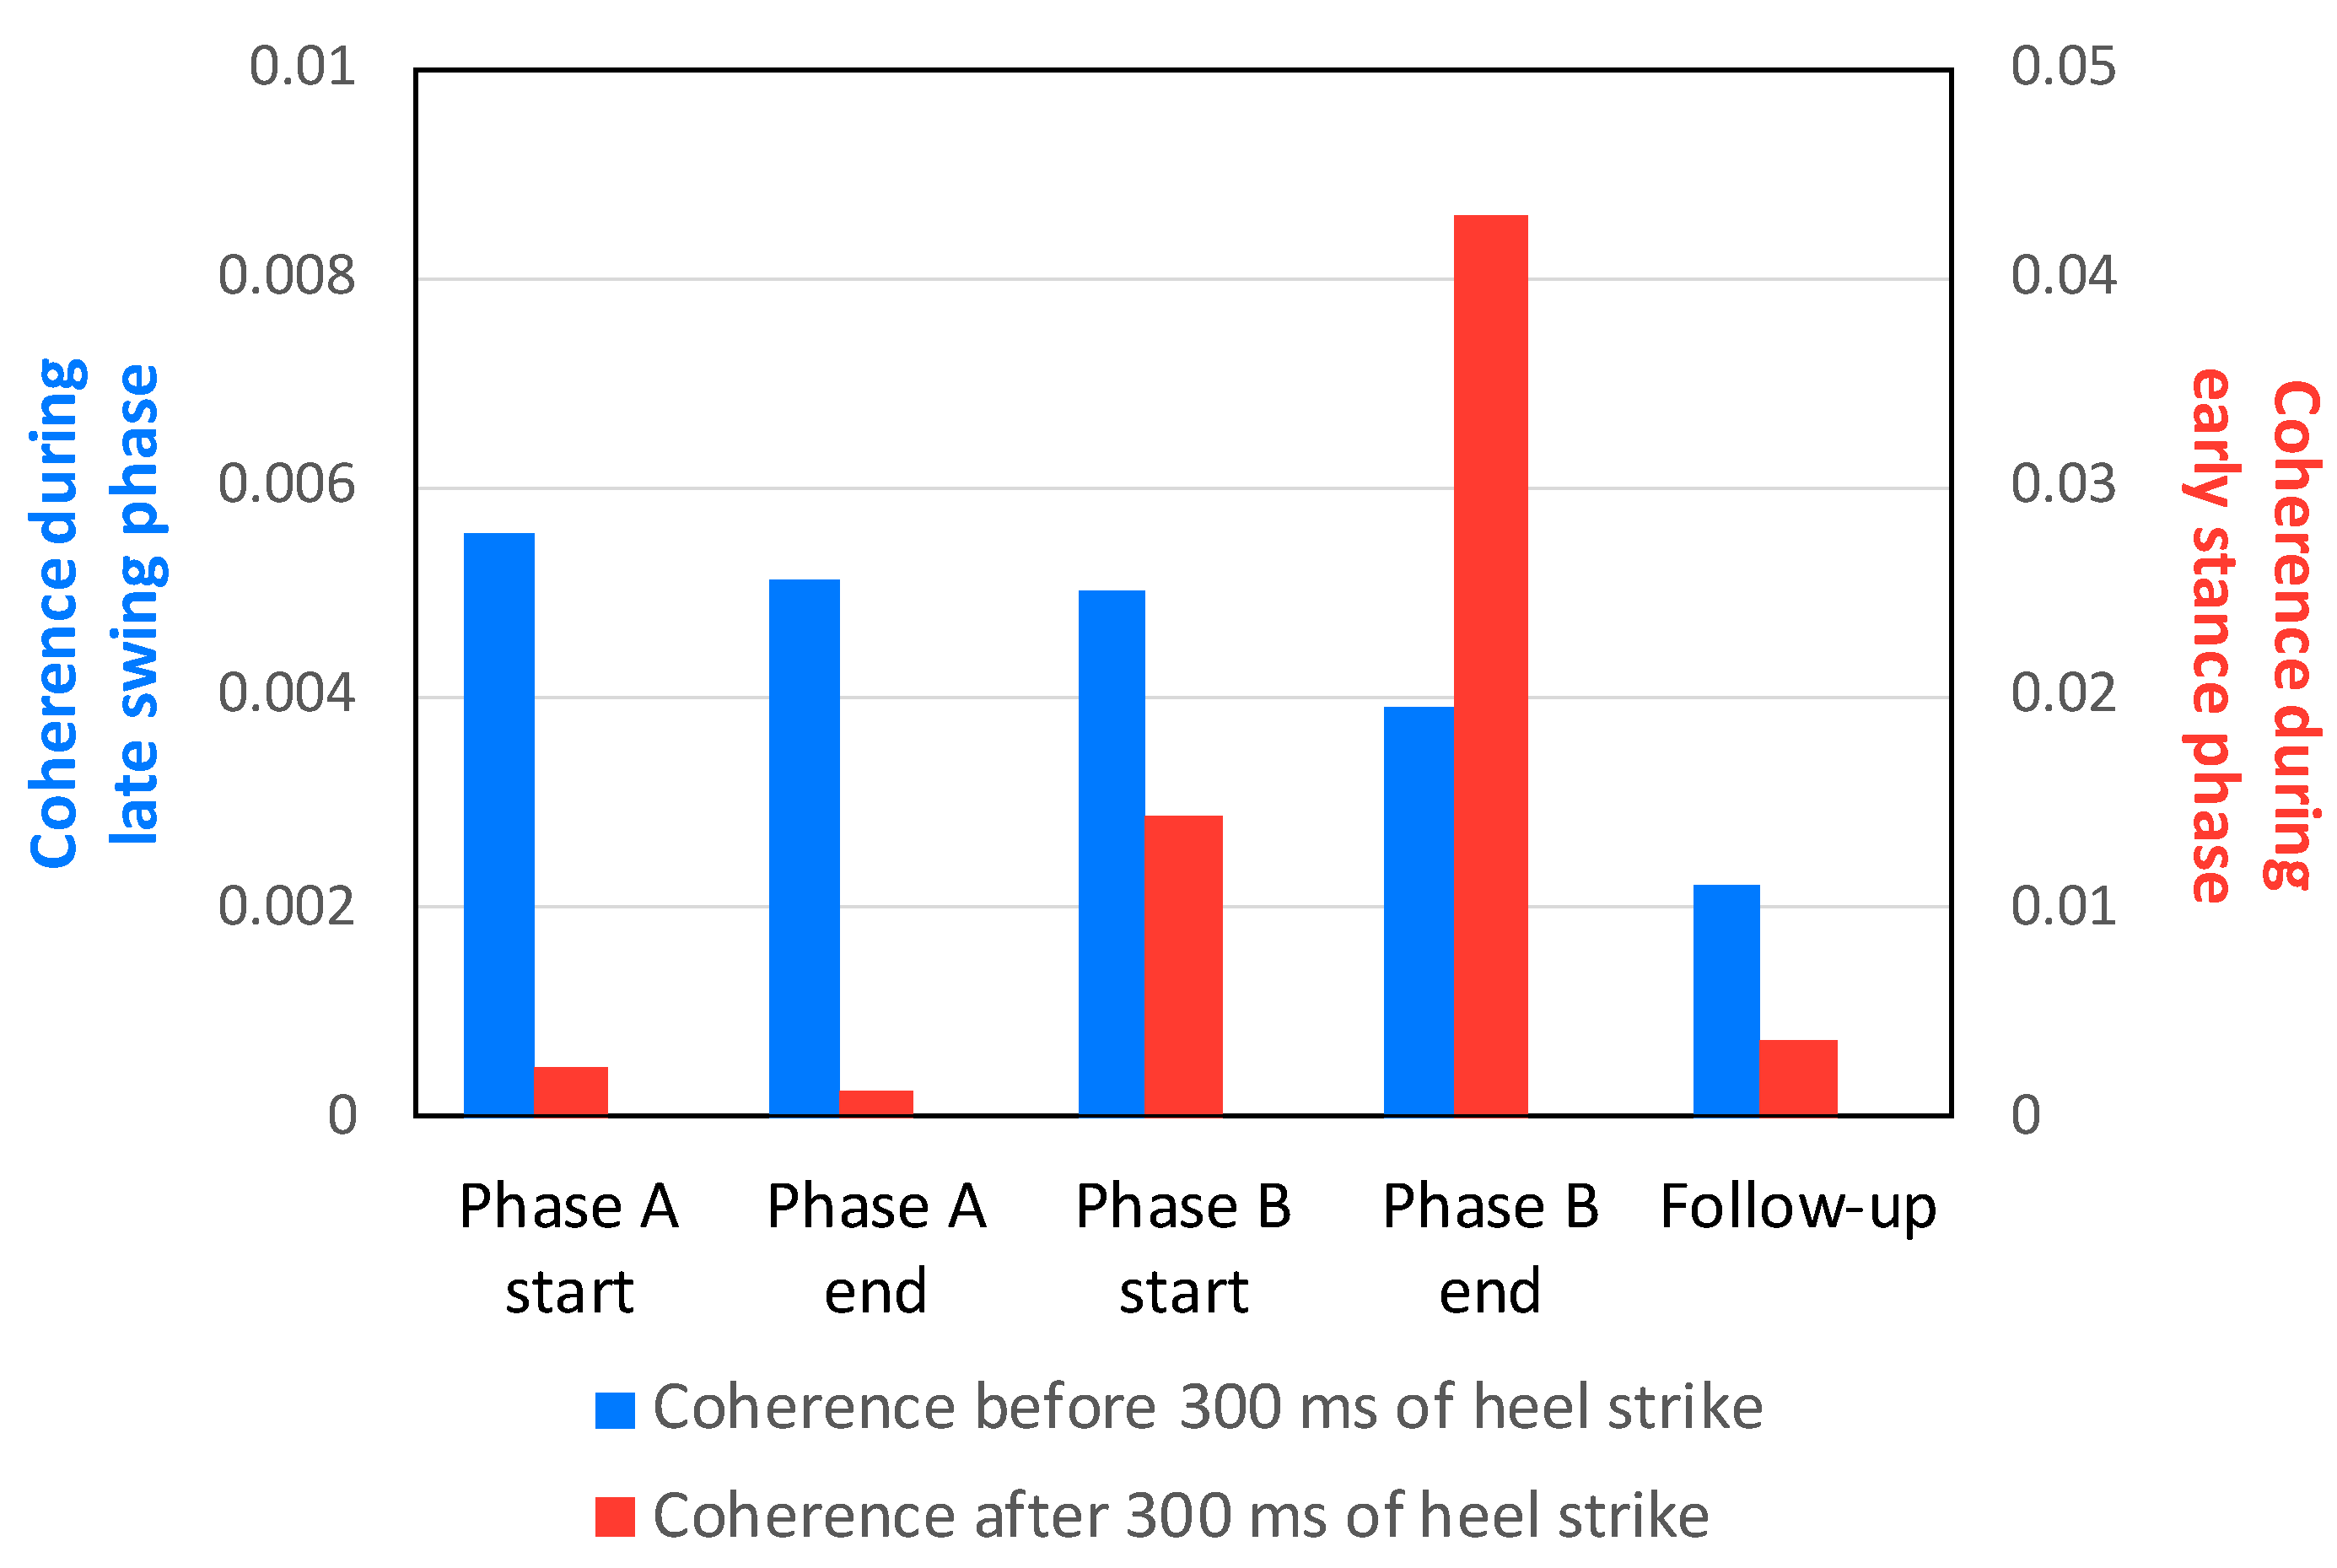
3.4. Comparison of TA–TA Coherence in Early Stance and Late Swing at the A/B and Follow-Up Sessions
4. Discussion
5. Conclusions
Author Contributions
Funding
Institutional Review Board Statement
Informed Consent Statement
Data Availability Statement
Acknowledgments
Conflicts of Interest
Appendix A

References
- Drew, T.; Prentice, S.; Schepens, B. Cortical and brainstem control of locomotion. Prog. Brain Res. 2004, 143, 251–261. [Google Scholar] [CrossRef] [PubMed]
- Ivanenko, Y.P.; Cappellini, G.; Dominici, N.; Poppele, R.E.; Lacquaniti, F. Modular Control of Limb Movements during Human Locomotion. J. Neurosci. 2007, 27, 11149–11161. [Google Scholar] [CrossRef] [PubMed] [Green Version]
- Yokoyama, H.; Kaneko, N.; Ogawa, T.; Kawashima, N.; Watanabe, K.; Nakazawa, K. Cortical Correlates of Locomotor Muscle Synergy Activation in Humans: An Electroencephalographic Decoding Study. iScience 2019, 15, 623–639. [Google Scholar] [CrossRef] [PubMed] [Green Version]
- Kamibayashi, K.; Nakajima, T.; Takahashi, M.; Akai, M.; Nakazawa, K. Facilitation of corticospinal excitability in the tibialis anterior muscle during robot-assisted passive stepping in humans. Eur. J. Neurosci. 2009, 30, 100–109. [Google Scholar] [CrossRef]
- Capaday, C.; Lavoie, B.A.; Barbeau, H.; Schneider, C.; Bonnard, M. Studies on the Corticospinal Control of Human Walking. I. Responses to Focal Transcranial Magnetic Stimulation of the Motor Cortex. J. Neurophysiol. 1999, 81, 129–139. [Google Scholar] [CrossRef]
- Nudo, R. Adaptive plasticity in motor cortex: Implications for rehabilitation after brain injury. J. Rehabil. Med. Suppl. 2003, 35, 7–10. [Google Scholar] [CrossRef] [Green Version]
- Jang, S.H. The role of the corticospinal tract in motor recovery in patients with a stroke: A review. NeuroRehabilitation 2009, 24, 285–290. [Google Scholar] [CrossRef]
- Choi, E.J.; Kyeong, S.; Jeon, H.M.; Kang, H.; Kim, D.H. Brain mapping of motor and functional recovery after supratentorial stroke. NeuroReport 2018, 29, 1217–1222. [Google Scholar] [CrossRef]
- Dawes, H.; Enzinger, C.; Johansen-Berg, H.; Bogdanovic, M.; Guy, C.; Collett, J.; Izadi, H.; Stagg, C.; Wade, D.; Matthews, P.M. Walking performance and its recovery in chronic stroke in relation to extent of lesion overlap with the descending motor tract. Exp. Brain Res. 2008, 186, 325–333. [Google Scholar] [CrossRef]
- Handelzalts, S.; Melzer, I.; Soroker, N. Analysis of Brain Lesion Impact on Balance and Gait Following Stroke. Front. Hum. Neurosci. 2019, 13, 149. [Google Scholar] [CrossRef]
- Bowden, M.G.; Clark, D.J.; Kautz, S.A. Evaluation of Abnormal Synergy Patterns Poststroke: Relationship of the Fugl-Meyer Assessment to Hemiparetic Locomotion. Neurorehabilit. Neural Repair 2010, 24, 328–337. [Google Scholar] [CrossRef] [PubMed]
- Liu, J.; Wang, C.; Qin, W.; Ding, H.; Guo, J.; Han, T.; Cheng, J.; Yu, C. Corticospinal Fibers With Different Origins Impact Motor Outcome and Brain After Subcortical Stroke. Stroke 2020, 51, 2170–2178. [Google Scholar] [CrossRef] [PubMed]
- Xu, Y.-W.; Lin, P.; Yao, P.-S.; Zheng, S.-F.; Kang, D.-Z. Structure and function of corticospinal projection originating from supplementary motor area. Neuroradiology 2021, 63, 1283–1292. [Google Scholar] [CrossRef] [PubMed]
- Nitsche, M.A.; Paulus, W. Excitability changes induced in the human motor cortex by weak transcranial direct current stimulation. J. Physiol. 2000, 527, 633–639. [Google Scholar] [CrossRef]
- Conway, B.A.; Halliday, D.; Farmer, S.; Shahani, U.; Maas, P.; Weir, A.I.; Rosenberg, J.R. Synchronization between motor cortex and spinal motoneuronal pool during the performance of a maintained motor task in man. J. Physiol. 1995, 489, 917–924. [Google Scholar] [CrossRef]
- Power, H.A.; Norton, J.; Porter, C.L.; Doyle, Z.; Hui, I.; Chan, K.M. Transcranial direct current stimulation of the primary motor cortex affects cortical drive to human musculature as assessed by intermuscular coherence. J. Physiol. 2006, 577, 795–803. [Google Scholar] [CrossRef]
- Li, Y.; Fan, J.; Yang, J.; He, C.; Li, S. Effects of transcranial direct current stimulation on walking ability after stroke: A systematic review and meta-analysis. Restor. Neurol. Neurosci. 2018, 36, 59–71. [Google Scholar] [CrossRef]
- Cattagni, T.; Geiger, M.; Supiot, A.; de Mazancourt, P.; Pradon, D.; Zory, R.; Roche, N. A single session of anodal transcranial direct current stimulation applied over the affected primary motor cortex does not alter gait parameters in chronic stroke survivors. Neurophysiol. Clin. 2019, 49, 283–293. [Google Scholar] [CrossRef]
- Chang, M.C.; Kim, D.Y.; Park, D.H. Enhancement of Cortical Excitability and Lower Limb Motor Function in Patients With Stroke by Transcranial Direct Current Stimulation. Brain Stimul. 2015, 8, 561–566. [Google Scholar] [CrossRef]
- Gil Seo, H.; Lee, W.H.; Lee, S.H.; Yi, Y.; Kim, K.D.; Oh, B.-M. Robotic-assisted gait training combined with transcranial direct current stimulation in chronic stroke patients: A pilot double-blind, randomized controlled trial. Restor. Neurol. Neurosci. 2017, 35, 527–536. [Google Scholar] [CrossRef]
- Manji, A.; Amimoto, K.; Matsuda, T.; Wada, Y.; Inaba, A.; Ko, S. Effects of transcranial direct current stimulation over the supplementary motor area body weight-supported treadmill gait training in hemiparetic patients after stroke. Neurosci. Lett. 2018, 662, 302–305. [Google Scholar] [CrossRef] [PubMed]
- Vollmann, H.; Conde, V.; Sewerin, S.; Taubert, M.; Sehm, B.; Witte, O.W.; Villringer, A.; Ragert, P. Anodal transcranial direct current stimulation (tDCS) over supplementary motor area (SMA) but not pre-SMA promotes short-term visuomotor learning. Brain Stimul. 2013, 6, 101–107. [Google Scholar] [CrossRef] [PubMed]
- Fusco, A.; Assenza, F.; Iosa, M.; Izzo, S.; Altavilla, R.; Paolucci, S.; Vernieri, F. The Ineffective Role of Cathodal tDCS in Enhancing the Functional Motor Outcomes in Early Phase of Stroke Rehabilitation: An Experimental Trial. BioMed Res. Int. 2014, 2014, 547290. [Google Scholar] [CrossRef] [PubMed] [Green Version]
- Bhattacharjee, S.; Kashyap, R.; Rapp, B.; Oishi, K.; Desmond, J.E.; Chen, S.H.A. Simulation Analyses of tDCS Montages for the Investigation of Dorsal and Ventral Pathways. Sci. Rep. 2019, 9, 12178. [Google Scholar] [CrossRef]
- Berg, K.; Wood-Dauphinee, S.; Williams, J.I.; Gayton, D. Measuring balance in the elderly: Preliminary development of an instrument. Physiother. Can. 1989, 41, 304–311. [Google Scholar] [CrossRef]
- Verheyden, G.; Nieuwboer, A.; Mertin, J.; Preger, R.; Kiekens, C.; De Weerdt, W. The Trunk Impairment Scale: A new tool to measure motor impairment of the trunk after stroke. Clin. Rehabil. 2004, 18, 326–334. [Google Scholar] [CrossRef]
- Holden, M.K.; Gill, K.M.; Magliozzi, M.R.; Nathan, J.; Piehl-Baker, L. Clinical Gait Assessment in the Neurologically Impaired: Reliability and meaningfulness. Phys. Ther. 1984, 64, 35–40. [Google Scholar] [CrossRef]
- Mizuta, N.; Hasui, N.; Nakatani, T.; Takamura, Y.; Fujii, S.; Tsutsumi, M.; Taguchi, J.; Morioka, S. Walking characteristics including mild motor paralysis and slow walking speed in post-stroke patients. Sci. Rep. 2020, 10, 11819. [Google Scholar] [CrossRef]
- Kitatani, R.; Ohata, K.; Aga, Y.; Mashima, Y.; Hashiguchi, Y.; Wakida, M.; Maeda, A.; Yamada, S. Descending neural drives to ankle muscles during gait and their relationships with clinical functions in patients after stroke. Clin. Neurophysiol. 2016, 127, 1512–1520. [Google Scholar] [CrossRef] [Green Version]
- Hansen, N.L.; Conway, B.A.; Halliday, D.; Hansen, S.; Pyndt, H.S.; Biering-Sørensen, F.; Nielsen, J.B. Reduction of Common Synaptic Drive to Ankle Dorsiflexor Motoneurons During Walking in Patients With Spinal Cord Lesion. J. Neurophysiol. 2005, 94, 934–942. [Google Scholar] [CrossRef] [Green Version]
- Karpman, C.; LeBrasseur, N.; DePew, Z.S.; Novotny, P.J.; Benzo, R.P. Measuring Gait Speed in the Out-Patient Clinic: Methodology and Feasibility. Respir. Care 2014, 59, 531–537. [Google Scholar] [CrossRef] [PubMed] [Green Version]
- Hausdorff, J.M.; Rios, D.A.; Edelberg, H.K. Gait variability and fall risk in community-living older adults: A 1-year prospective study. Arch. Phys. Med. Rehabil. 2001, 82, 1050–1056. [Google Scholar] [CrossRef] [PubMed]
- Beauchet, O.; Dubost, V.; Herrmann, F.R.; Kressig, R.W. Stride-to-stride variability while backward counting among healthy young adults. J. Neuroeng. Rehabil. 2005, 2, 26. [Google Scholar] [CrossRef] [PubMed]
- Petersen, T.H.; Willerslev-Olsen, M.; Conway, B.A.; Nielsen, J.B. The motor cortex drives the muscles during walking in human subjects. J. Physiol. 2012, 590, 2443–2452. [Google Scholar] [CrossRef] [PubMed]
- Fisher, K.M.; Zaaimi, B.; Williams, T.L.; Baker, S.N.; Baker, M.R. Beta-band intermuscular coherence: A novel biomarker of upper motor neuron dysfunction in motor neuron disease. Brain 2012, 135, 2849–2864. [Google Scholar] [CrossRef] [Green Version]
- Khandelwal, S.; Wickstrom, N. Gait Event Detection in Real-World Environment for Long-Term Applications: Incorporating Domain Knowledge Into Time-Frequency Analysis. IEEE Trans. Neural Syst. Rehabil. Eng. 2016, 24, 1363–1372. [Google Scholar] [CrossRef] [Green Version]
- Roeder, L.; Boonstra, T.W.; Smith, S.S.; Kerr, G.K. Dynamics of corticospinal motor control during overground and treadmill walking in humans. J. Neurophysiol. 2018, 120, 1017–1031. [Google Scholar] [CrossRef]
- Halliday, D.; Conway, B.A.; Christensen, L.; Hansen, N.L.; Petersen, N.C.; Nielsen, J.B. Functional Coupling of Motor Units Is Modulated During Walking in Human Subjects. J. Neurophysiol. 2003, 89, 960–968. [Google Scholar] [CrossRef] [Green Version]
- Bravo-Esteban, E.; Taylor, J.S.; Aleixandre, M.; Simón-Martínez, C.; Torricelli, D.; Pons, J.L.; Avila-Martín, G.; Galán-Arriero, I.; Gómez-Soriano, J. Longitudinal estimation of intramuscular Tibialis Anterior coherence during subacute spinal cord injury: Relationship with neurophysiological, functional and clinical outcome measures. J. Neuroeng. Rehabil. 2017, 14, 1–11. [Google Scholar] [CrossRef] [Green Version]
- Dietz, V. The Human Central Pattern Generator and Its Role in Spinal Cord Injury Recovery. Available online: https://musculoskeletalkey.com/the-human-central-pattern-generator-and-its-role-in-spinal-cord-injury-recovery/ (accessed on 6 November 2021).
- Hausdorff, J.M.; Lertratanakul, A.; Cudkowicz, M.E.; Peterson, A.L.; Kaliton, D.; Goldberger, A.L. Dynamic markers of altered gait rhythm in amyotrophic lateral sclerosis. J. Appl. Physiol. 2000, 88, 2045–2053. [Google Scholar] [CrossRef]
- Balasubramanian, C.K.; Neptune, R.R.; Kautz, S.A. Variability in spatiotemporal step characteristics and its relationship to walking performance post-stroke. Gait Posture 2009, 29, 408–414. [Google Scholar] [CrossRef] [PubMed] [Green Version]
- Fujimoto, H.; Mihara, M.; Hattori, N.; Hatakenaka, M.; Kawano, T.; Yagura, H.; Miyai, I.; Mochizuki, H. Cortical changes underlying balance recovery in patients with hemiplegic stroke. NeuroImage 2014, 85, 547–554. [Google Scholar] [CrossRef] [PubMed]
- Navarro-López, V.; Molina-Rueda, F.; Jiménez-Jiménez, S.; Alguacil-Diego, I.; Carratalá-Tejada, M. Effects of Transcranial Direct Current Stimulation Combined with Physiotherapy on Gait Pattern, Balance, and Functionality in Stroke Patients. A Systematic Review. Diagnostics 2021, 11, 656. [Google Scholar] [CrossRef] [PubMed]

| Stroke Onset (Days) | ||||||
|---|---|---|---|---|---|---|
| 69 | 137 | 144 | 151 | 165 | ||
| Functional Ambulation Category | 1 | 4 | 4 | 4 | 4 | |
| BRS (lower extremity) | 1 | 2 | 2 | 2 | 2 | |
| FMS (lower extremity): max = 22 * | Total score | 0 | 6 | 6 | 6 | 9 |
| Flexor synergy | 0 | 0 | 0 | 0 | 2 | |
| Extensor synergy | 0 | 5 | 5 | 5 | 5 | |
| Knee Ankle when sitting | 0 | 1 | 1 | 1 | 2 | |
| Knee Ankle when standing | 0 | 0 | 0 | 0 | 0 | |
| FMA sensory score (lower extremity): max = 12 † | 6 | 8 | 8 | 8 | 8 | |
| Knee extensor strength (kgf) | 0 | 2.4 | 2.4 | 2.5 | 2.8 | |
| Trunk Impairment Scale | 14 | 20 | 20 | 20 | 20 | |
| Berg Balance Scale (scores) | 24 | 42 | 42 | 42 | 46 | |
| Comfortable walking speed (m/s) | - | 0.45 | 0.48 | 0.51 | 0.55 | |
| Stride Time Variability (%) | - | 4.00 | 4.66 | 2.43 | 2.13 | |
| Items | Details | |
|---|---|---|
| Timeseries information | ||
| Timeline of stroke | Functional Ambulation Category improved from 1 to 4 between 69 and 137 days from stroke onset Phase A: 1 week from 137 days after stroke onset, Phase B: 1 week from 144 days after stroke onset, Follow-up: 2 weeks from 151 days after stroke onset | |
| Instrument settings | ||
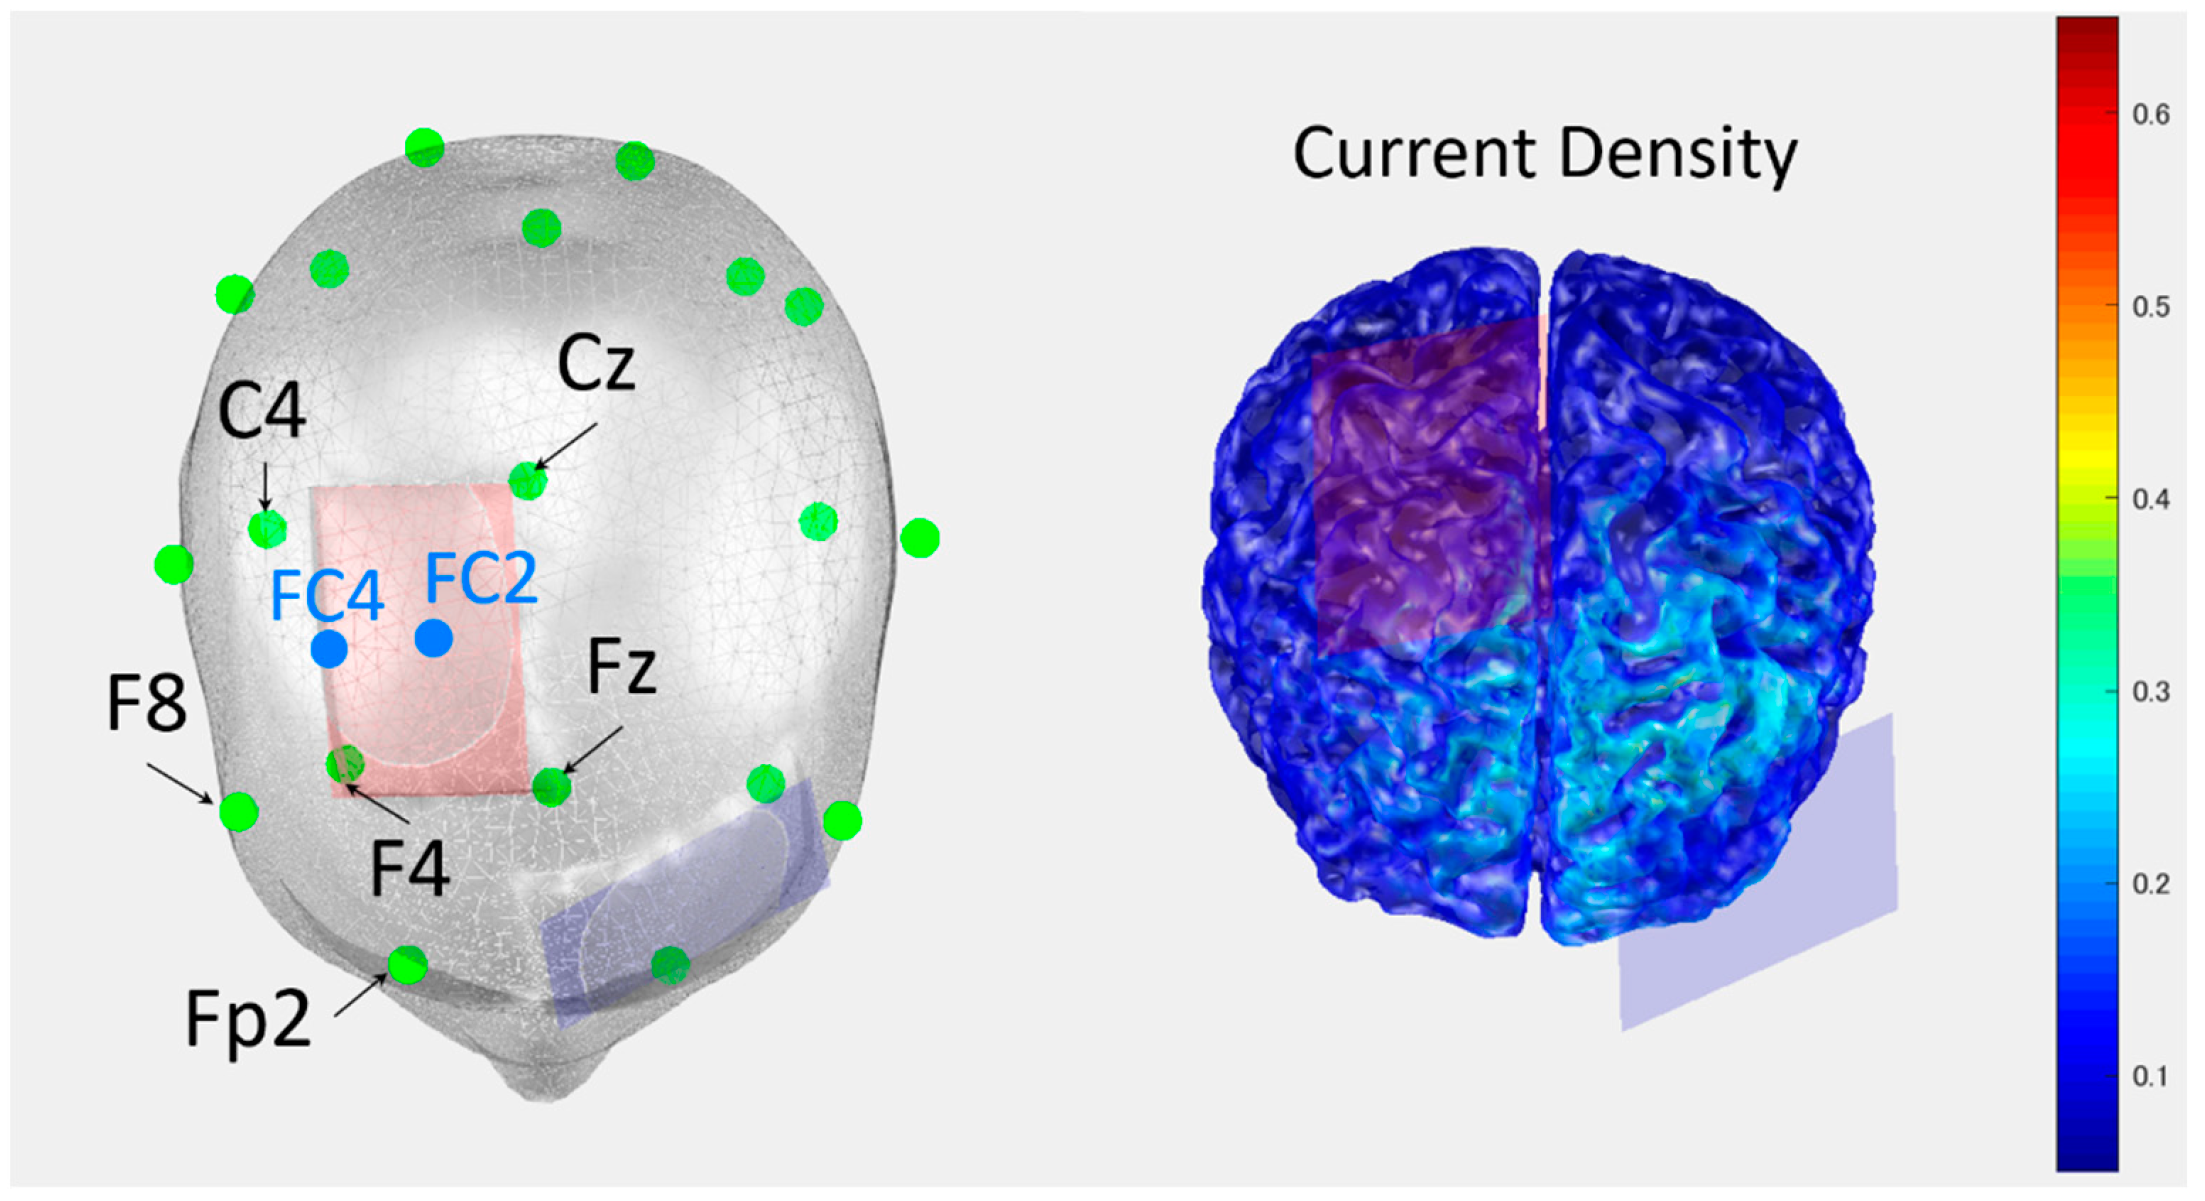
| tDCS stimulation | Placement | Anode: supplementary motor cortex on the damaged side, cathode: contrala-teral supraorbital region |
| Parameter setting | Current intensity: 1.5 mA, duration of stimulation: 30 min (Phase B) | |
| Data collecting | ||
| Measurements | Clinical evaluation | Brunnstrom Recovery Stage and Synergy score of the Fugl–Meyer assessment, Knee extensor strength (Motor paralysis) Sensory score of the Fugl–Meyer assessment, Trunk Impairment Scale, Berg Balance Scale |
| Walking assessment | Comfortable walking speed, Stride time variability (Gait stability) | |
| EMG assessment | TA-TA coherence in beta band (Corticospinal tract excitability) during late swing and early stance phases |
Publisher’s Note: MDPI stays neutral with regard to jurisdictional claims in published maps and institutional affiliations. |
© 2022 by the authors. Licensee MDPI, Basel, Switzerland. This article is an open access article distributed under the terms and conditions of the Creative Commons Attribution (CC BY) license (https://creativecommons.org/licenses/by/4.0/).
Share and Cite
Hasui, N.; Mizuta, N.; Taguchi, J.; Nakatani, T.; Morioka, S. Effects of Transcranial Direct Current Stimulation over the Supplementary Motor Area Combined with Walking on the Intramuscular Coherence of the Tibialis Anterior in a Subacute Post-Stroke Patient: A Single-Case Study. Brain Sci. 2022, 12, 540. https://doi.org/10.3390/brainsci12050540
Hasui N, Mizuta N, Taguchi J, Nakatani T, Morioka S. Effects of Transcranial Direct Current Stimulation over the Supplementary Motor Area Combined with Walking on the Intramuscular Coherence of the Tibialis Anterior in a Subacute Post-Stroke Patient: A Single-Case Study. Brain Sciences. 2022; 12(5):540. https://doi.org/10.3390/brainsci12050540
Chicago/Turabian StyleHasui, Naruhito, Naomichi Mizuta, Junji Taguchi, Tomoki Nakatani, and Shu Morioka. 2022. "Effects of Transcranial Direct Current Stimulation over the Supplementary Motor Area Combined with Walking on the Intramuscular Coherence of the Tibialis Anterior in a Subacute Post-Stroke Patient: A Single-Case Study" Brain Sciences 12, no. 5: 540. https://doi.org/10.3390/brainsci12050540